Article

Spatial-Temporal Hotspot Pattern Analysis of Provincial Environmental Pollution Incidents and Related Regional Sustainable Management in China in the Period 1995–2012

1
School of Environmental Studies, China University of Geosciences, Wuhan 430074, China
2
Faculty of Resources and Environmental Science, Hubei University, Wuhan 430062, China
3
Regional Development and Environmental Response Key Laboratory of Hubei Province, Wuhan 430062, China
4
School of Public Administration, China University of Geosciences, Wuhan 430074, China
*
Author to whom correspondence should be addressed.
Sustainability 2015, 7(10), 14385-14407; https://doi.org/10.3390/su71014385
Submission received: 22 July 2015 / Revised: 19 October 2015 / Accepted: 20 October 2015 / Published: 26 October 2015

Abstract

:
Spatial-temporal hotspot pattern analysis of environmental pollution incidents provides an indispensable source of information for the further development of incident prevention measures. In this study, the spatial-temporal patterns of environmental pollution incidents in China in the period of 1995–2012 were analyzed, using the Spatial Getis-Ord statistic and an Improved Prediction Accuracy Index (IAPI). The results show that, in this period, the occurrence of environmental incidents exhibited a dynamic growth pattern but then dropped and continued to drop after the year 2006, which was considered a crucial turning point. Not coincidentally, this corresponds to the year when the State Council issued its National Environmental Emergency Plan, and following the examination of major incidents, special actions were taken to strengthen the control of incidents and emergency responses. The results from Getis-Ord General G statistical analysis show that the spatial agglomeration phenomenon was statistically significant after 1999 and that the level of spatial agglomeration was rising, while the Getis-Ord Gi* statistical analysis reveals that environmental pollution incidents were mainly agglomerated in the Pan Yangtze River Delta and Pan Pearl River Delta regions. Accordingly, the spatial-temporal hotspot pattern based on the IAPI values at the provincial scale could be categorized into: stable hotspots, unstable hotspots, and cold-spot areas. The stable hotspots category was further divided into three subtypes: industrial distribution type, industrial transfer type, and extensive economic growth type. Finally, the corresponding measures for sustainable management were proposed: stable hotspots were classified as essential regions requiring the immediate prevention and control of environmental pollution incidents; unstable hotspots were characterized by their need for ongoing and continual prevention measures, and cold-spots were those areas that required strengthened environmental monitoring. Meanwhile, it was identified that a multi-level environmental pollution incident emergency response and regional (incident) joint control plan needed to be well prepared and carried out effectively. To prevent environmental pollution and the regional transfer of pollution from incidents, measures towards achieving regional environmental planning, environmental risk prevention, environmental emergency monitoring and adequate emergency responses must be efficiently implemented.

1. Introduction

China’s extensive development and modernization process has been characterized by profit-oriented, rapid economic development and the occurrence of various incidents [1,2], such as production safety incidents (including many mine incidents), traffic incidents, and environmental pollution incidents. Meanwhile, incidents that cause a chain reaction are becoming more and more common. Today, the occurrences of production safety incidents are always accompanied by environmental pollution incidents. The term “environmental pollution incident” in this article refers to sudden environmental pollution incidents, where there is no fixed emission mode or emission pathway, and instead the incident involves a sudden, ferocious, and instantaneous discharge of mass pollutants [3,4]. Thus, it poses a huge threat to the environment and to human health. This can be contrasted with non-sudden environmental pollution incidents, where a pollution incident builds up over a long period of time and evolves through the cumulative effect of time and space. For example, the use of pesticides in farming leads to long-term pollution incidents due to accumulation effects building up over a long period time. A specific example of a pollution incident that built up over a long time before it became fully apparent is the Taihu Lake algae bloom pollution incident in 2007. Currently, China faces a serious risk of environmental pollution incidents occurring, and indeed has entered a high-incidence period of environmental pollution incidents [5]. For instance, a major pollution incident happened in November 2005 in the Songhua River [6,7], resulting in large areas of polluted water in Harbin City, threatening the water safety of the Russian border city Khabarovsk [8,9]. Other environmental pollution incidents widely reported by the media, for instance, include the lead poisoning incident in Shaanxi Province (August 2009), Zijin Mining copper acidic water leakage incident in Fujian Province (July 2010), and the Qingdao pipeline bombings (2013). These incidents were not only seriously harmful to social stability and people’s health, but also greatly obstructed the process of regional sustainable development [4,10]. Thus, it is an intractable issue and significant challenge to effectively prevent sudden environmental pollution incidents from occurring under China’s new economic situation.
In recent years, an increasing number of scholars have been concerned about environmental pollution and have carried out a wide range of related research on environmental pollution incidents. In these studies, first, some researchers adopted mathematical and statistical analysis methods based on historical data to explore the time series evolution characteristics of environmental pollution incidents [5,7,10], and a historical incident database was proposed for long-term risk identification and control [11]. Second, due to the sudden, uncertain and dangerous characteristics of environmental pollution incidents, many scholars focused on the study of risk assessment [12,13,14,15], loss estimation [16,17], simulation [18] and emergency response, and decision-making [19,20,21,22,23] of pollution incidents. There is no doubt that these studies provide a basis for early warning of regional pollution incidents. However, the occurrence of an environmental pollution incident is usually a result of multiple factors. Also, significant regional differences exist in different areas [4]. Some areas indeed show a higher frequency of incidents. Existing research has not taken into account these regional differences and few studies conducted spatial pattern analysis. Hence, in this perspective of regional sustainable development, it is necessary to analyze the spatial characteristics of environmental pollution incidents, examine the hotspot areas and identify some relevant and appropriate prevention measures. Notably, spatial-temporal hotspot pattern analysis has been widely used in describing geographical events or phenomena [24,25]. The prediction accuracy index (PAI) [26], the Kernel density estimation (KDE) [24,27], Spatial Autocorrelation, and Spatial Getis-Ord Gi* statistic methods have all been mainly introduced to analyze spatial patterns [28,29,30].
The main purpose of this paper is to reveal the temporal-spatial hotspot pattern of provincial environmental pollution incidents and its relationship with social-economic activities and regional sustainable development for the period 1995–2012 in China. Spatial Getis-Ord Gi* statistical analysis was used to investigate the characteristics of spatial agglomeration, and an improved PAI was adopted to analyze the temporal-spatial hotspot pattern evolution. Based on this, we aimed to divide the provincial scales hotspots mode into a regional economic development stage and industrial structure characteristics, with the aim of developing spatial scales to aid the prevention and control of environmental pollution incidents. Furthermore, we emphatically analyzed the hot model features of six typical provinces, and finally proposed corresponding measures for sustainable management.

2. Data Sources and Analytical Methods

2.1. Data Sources

It is well-known that environmental protection in China lags far behind Western industrial countries [10]. Also, there is no public database on environmental pollution incidents in China, unlike in the UK, which has the Major Hazard Incident Data Service (MHIDAS) managed by the Safety and Reliability Directorate (SRD) [5]. Hence, statistical analysis and mastering of environmental information is relatively rare for China. In China, it was only in around 1990 that environmental protection really started to have presence on the political agenda, and it was then that environmental pollution incident data was first provided in the China Statistical Yearbook and China Environmental Statistical Yearbook. From 1993, the government began to compile and report the provincial yearly data, and then after 1995 added information on the pollution types, incident grades, casualties and direct economic losses. Therefore, the timescale from 1995–2012 was chosen as our research period; and the environmental incident data presented in this paper are mainly collected from the China Environmental Statistical Yearbook (19962013) [31]. Due to the lack of statistical data, our research area did not include Hong Kong and Macau special administrative regions, Taiwan Province, Diaoyu Islands, and Sansha City. In addition, as the purpose of this paper was to analyze the spatial-temporal hotspot patterns of provincial environmental pollution incidents and the relationship with social-economic activities, during the data processing, we excluded those environmental pollution incidents caused by natural disasters (such as the Fukushima nuclear disaster), which only accounted for 3%–5% of the total number of incidents.

2.2. Methods

In this paper, we first analyzed the space distribution types with the Getis-Ord General G index, and then used Getis-Ord Gi* index to seek out the hotspots for environmental pollution incidents’ rule of agglomeration and evolution. We then evaluated the stability of individual provinces in the hot spot region using the improved prediction accuracy index (IPAI), followed by a comparative analysis of the different pattern characteristics and hotspot trend for different economic development backgrounds and development stages.

2.2.1. Descriptive Analysis

The descriptive analysis relates to the estimation of the conditional probability. In this method, the probability of the occurrence of an incident is defined as the number of ways an incident occurs, divided by the number of all possible results of observations.

2.2.2. Spatial Getis-Ord Statistical Analysis

The Getis-Ord statistical analysis, also known as hot-spot analysis, is a method for analyzing the related location tendency (clustering) in the attributes of spatial data (points or areas), and includes the Getis-Ord General G statistic and the Getis-Ord Gi* local statistic [32,33,34]. The Getis-Ord General G statistic computes a single statistic for the entire study area, while the Getis-Ord Gi* statistic serves as an indicator for local autocorrelation, i.e., it measures how spatial autocorrelation varies locally over the study area and computes a statistic for each data point [29]. Compared with the Moran Index, another important spatial autocorrelation analysis method, the Getis-Ord statistic gives more intuitive results and a better visual exploration, and has the advantage of distinguishing high value clusters or low value clusters. Thus, we used the General G statistic and the Gi* statistic to quantify the degree of global spatial autocorrelation for nationwide environmental pollution incidents and to identify local hotspot/cold-spot areas based on ArcGIS10.0, respectively, whereby:
(1) The Getis-Ord General G statistic is given by Equation (1):
G ( d ) = W ij ( d ) x i x j / x i x j
where G (d) is the General G statistic for a feature (i) within a distance (d), Wij (d) represents the spatial weight matrix of study area, and xi and xj are the frequencies of environmental pollution incidents for i and j province in a given year, respectively. Under the hypothesis of spatial not spatial randomness, the expected value of G (d) is E (G) as per Equation (2):
E ( G ) = W / [ n ( n 1 ) ]   W = W i j ( d )
Under the condition of normal distribution, the statistical test value of G (d) is Z (G) as given in Equation (3):
Z ( G ) = [ G E ( G ) ] / V ar ( G )
When G (d) exceeds E (G), and the value of Z (G) is significant, it means that there is a high value cluster (incident of hotspots) in the study area. When G (d) is approximately equal to E (G), it means that provincial environmental pollution incidents show a random distribution characteristic [35].
(2) The Getis-Ord Gi* statistic is given by Equation (4):
G * i ( d ) = j = 1 n W i j ( d ) x j / j = 1 n x j
where Gi* (d) is the local G statistic for a feature (i) within a distance (d), and Wij (d) represents the spatial weight for the target-neighbor i and j pair [29]. In order to improve the statistical testing, Ord and Getis (1995) developed a z-transformed form of Gi* by taking the statistic Gi* (d) minus its expected value, divided by the square root of its variance [36]. This Z (Gi*) transformation, termed the standardized Gi* statistic, is given by Equation (5):
Z ( G * i ) = [ G * i E ( G * i ) ] / V a r ( G * i )
where E (Gi* is the expectation value, and Var (Gi*) represents the variance coefficient. The output of the Gi* statistic is a map indicating the location of the spatial clusters in the study area. The degree of clustering and its statistical significance is evaluated based on a confidence level and on the output Z-scores. If Z (Gi*) is positive and significant, it shows that one province and its neighboring regions have a relatively high frequency of environmental pollution incidents, i.e., is a hotspot (spatial cluster of high data values); while, on the contrary, if Z (Gi*) is negative and significant, it points to a cold-spot (spatial cluster of low data values).

2.2.3. IPAI Model

PAI (Prediction Accuracy Index) is an important index for determining hotspot areas, and was first proposed by Chianey in 2008 [24]. In Chianey’s research, this index was devised to measure the hit rate against the areas where crimes were predicted to occur with respect to the size of the study area, as shown in Equation (6):
PAI = HitRate/Area Percentage = (n/N) × 100/(a/A) × 100
where n is the number of geographical events (e.g., crimes, diseases, incidents) in areas where the events predictably occur (e.g., hotspots), N is the number of geographic events in the study area, a represents the area (e.g., km2) of the geographical events predicted to occur, and A is the area of the whole study area.
In this paper, the prediction accuracy index (PAI) is introduced into the hotspot model of environmental pollution incidents. The occurrence of environmental pollution incidents may be a result of multiple factors, e.g. the level of regional economy, the level of industrial development, technological innovation, the pollution treatment investment situation and environmental emergency management level [4]. Thus, the economic factors should be added in when analyzing the area in which the incidents are predicted to occur. Above all, a simple area index only reflects the likely number of environmental pollution incidents, i.e., the carrying capacity of pollution incidents. We assumed that the occurrence of environmental pollution incidents is a process that results in the sudden release of pollutants and results in destruction (hit rate) in a certain zone with economic development of a certain stage. That is, an indicator of the provincial proportion of GDP is added into the model, in order to build an improved version of the PAI hotspot model as per Equation (7):
I P A I = ( n / N ) × 100 / ( a / A ) × 100 × ( g / G ) × 100
where n is the frequency of environmental pollution incidents in an area used to determine whether the area is a hotspot for pollution incidents, N is the total number of national environmental pollution incidents in a year; a is the land area of a certain province, A is the total area of the country; g is a province’s GDP in a year, and G is the national total GDP. If the country is taken as a regional hotspot, then 100% of the environmental events take place in the global economy (in terms of the model research area) and finally IAPI value is 1; if 25% incidents occurred in 50% of the proportion of the economy and 50% of the provincial land area, then the IAPI value is 0.5; if 50% of the incidents occurred in the 25% economic weight and 25% of the provincial land area, the IAPI value is 2. Taking 1 as a reference, when the calculating value is higher than 1, then the selected area is considered to be a hotspot area.

3. Results and Discussion

3.1. Statistical Distribution of Incidents over Time

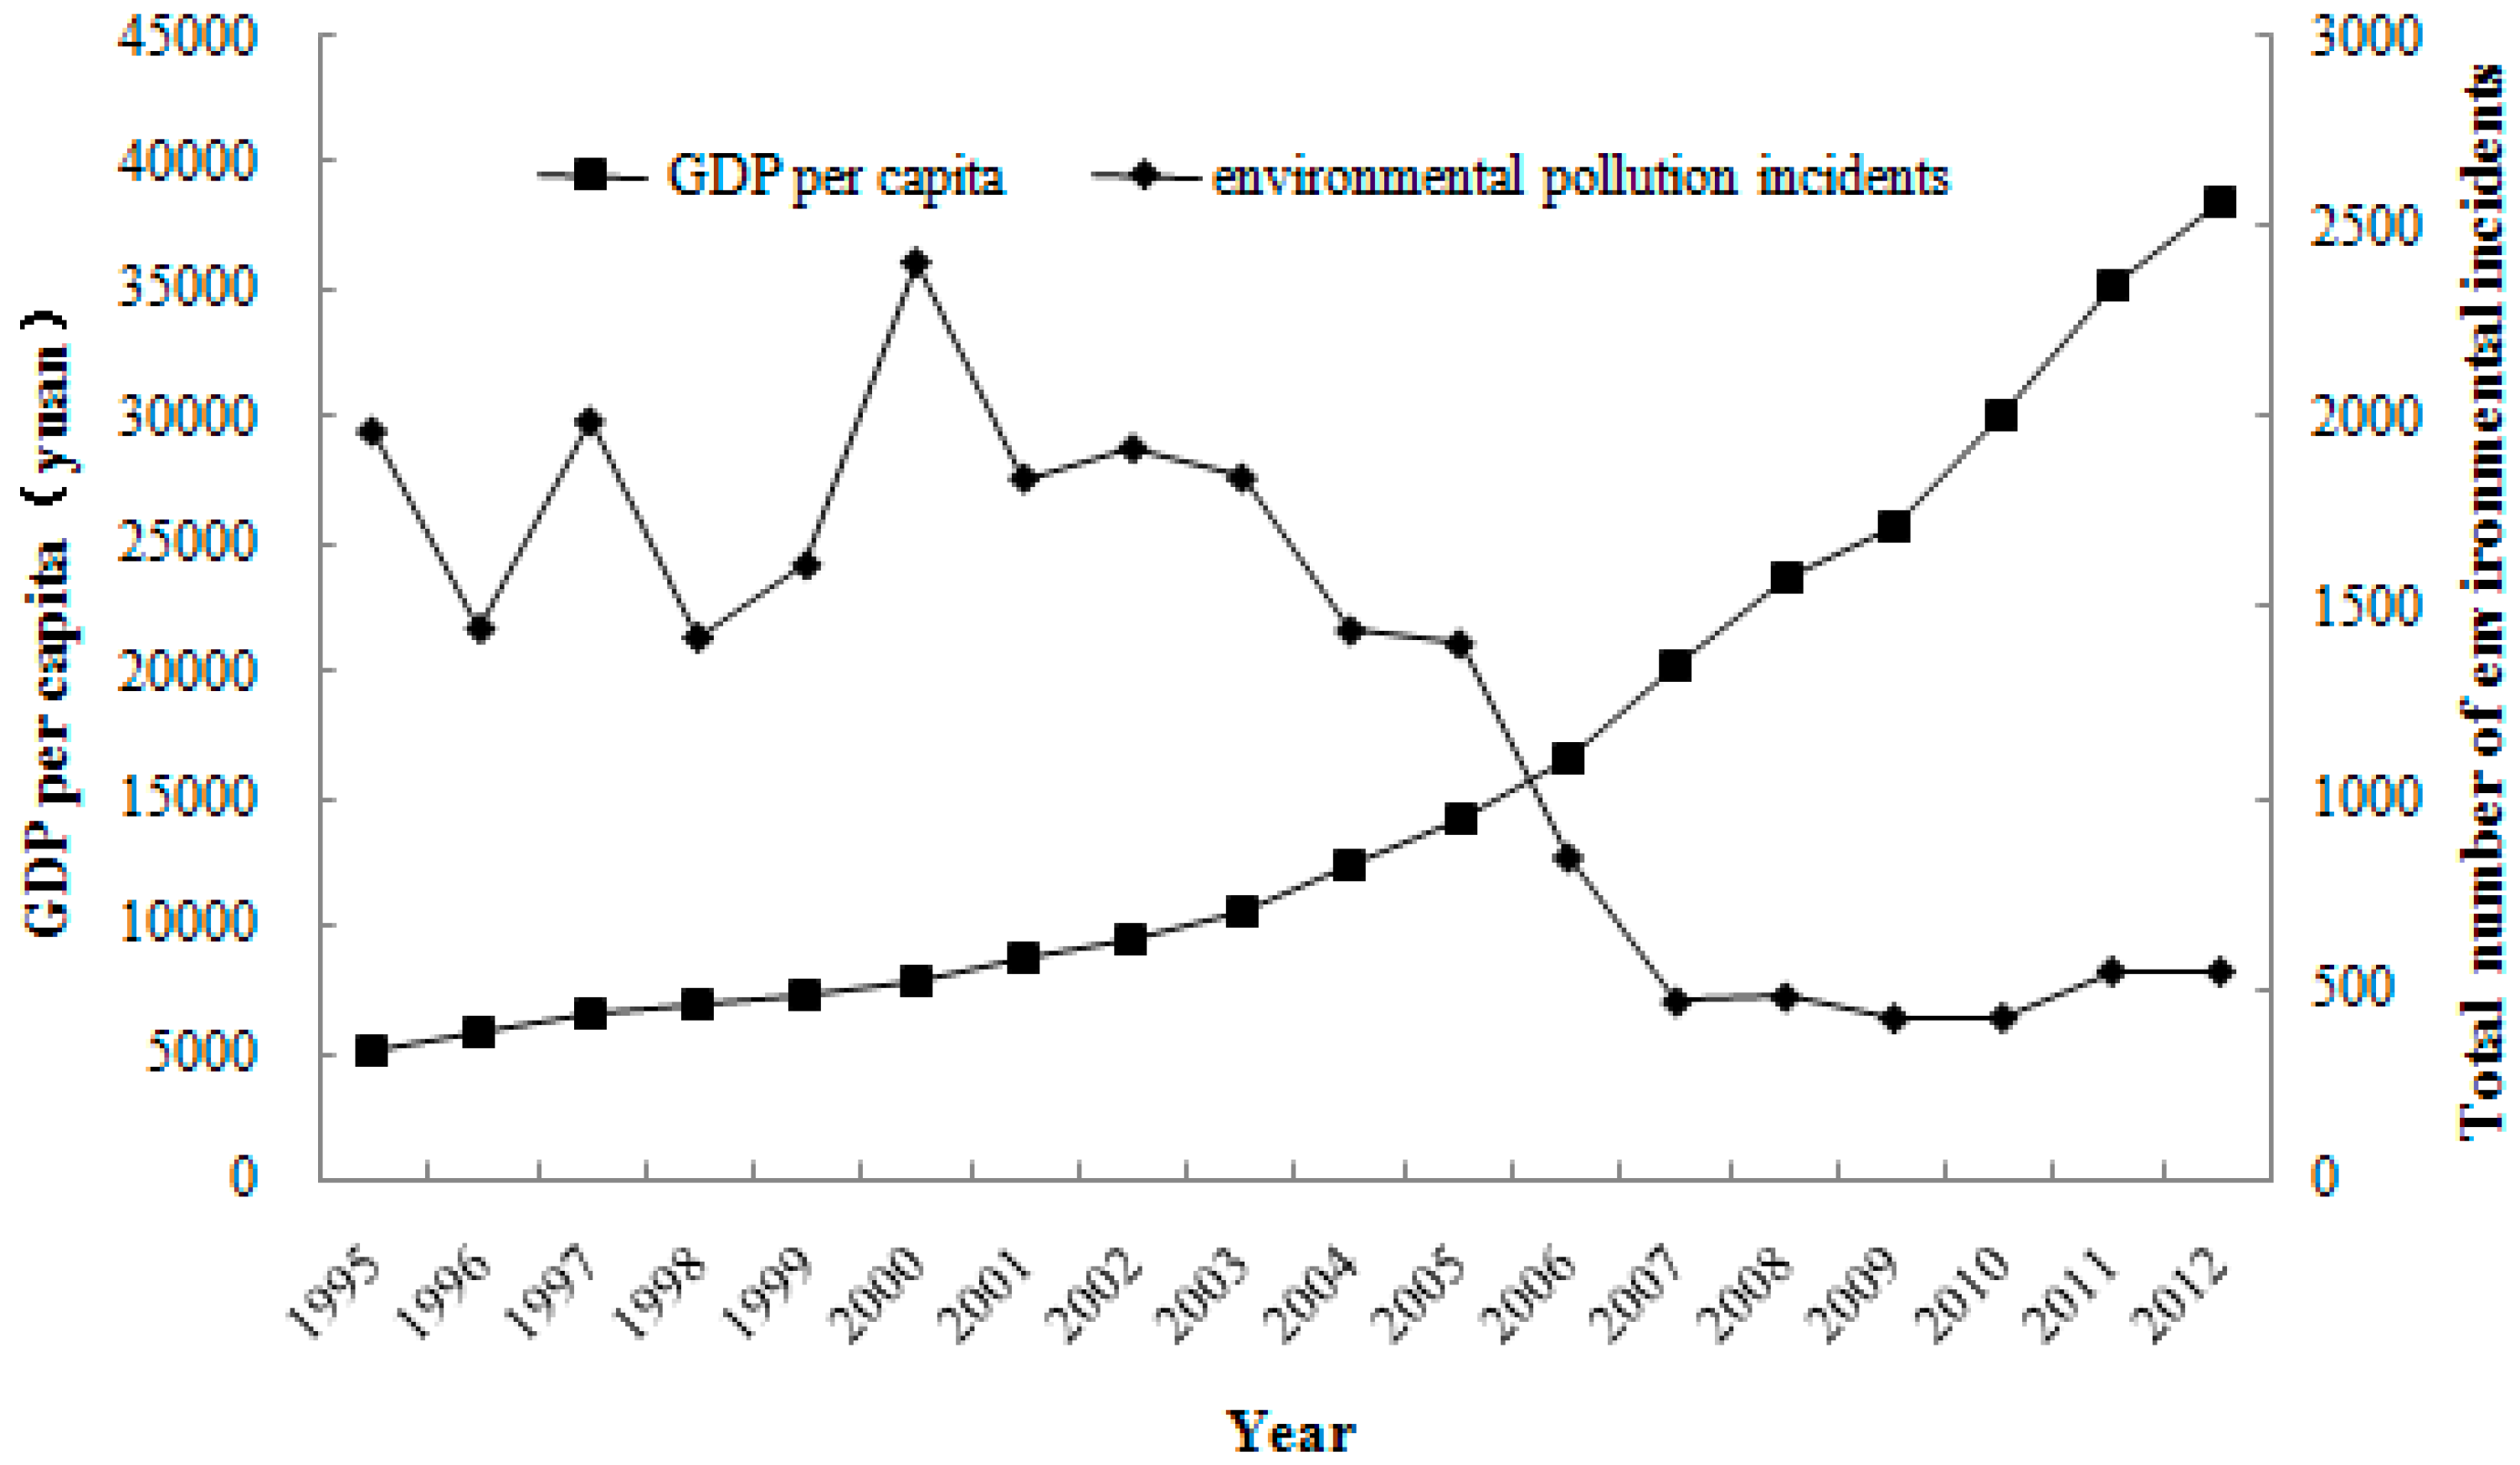
3.1.1. Temporal Variation

Our analysis was initiated by briefly reviewing the overall trend of total incidents based on the statistical data. In terms of the time scale of the whole country, the frequency of environmental pollution incidents in China gradually declined, after a previous period of dynamic growth, from 1995–2012 (Figure 1). The annual number of incidents was between 418 and 2411, the total frequency over the study period was 23,004, and the average value was 1278. The year 2000 showed a large peak value of 2411, which gradually reduced and stabilized after the year 2007, which indicated that environmental pollution incidents were being more effectively controlled. Take Guangxi and Hunan as typical examples, during the years 2000–2005, these two areas accounted for 23%–39% of the total number of incidents in China, however, after 2005, these two areas only accounted for 2%–10% of the total number. Over this study period, the year 2006 is an important transition and turning period, when the State Council promulgated and issued “National Environmental Emergency Plan and Environmental Emergency Information Report” by Administrative Department of Environmental Protection. These environmental policies played a crucial role in the establishment of nationwide environmental emergency response mechanisms and improved the government’s ability to deal with public crises involving environmental emergencies, including maintaining social stability and safeguarding public health and life and property, as well as ensuring environmental protection. Under the guidance of the Plan, all levels of local government developed corresponding environmental emergency plans or countermeasure systems. More importantly, an examination of environmental pollution incidents and the special actions against them was undertaken in many parts of the country after 2003. After 2007–2012, the number of environmental pollution incidents basically remained stable at around 500 per year. Further reductions though could be expected if the current prevailing trend continues, and in response to the raised awareness of environmental risks and the consequences of environmental pollution incidents [3,10].
Figure 1. Variance of environmental pollution incidents and GDP per capita from 1995–2012 in China.
Sustainability 07 14385 g001

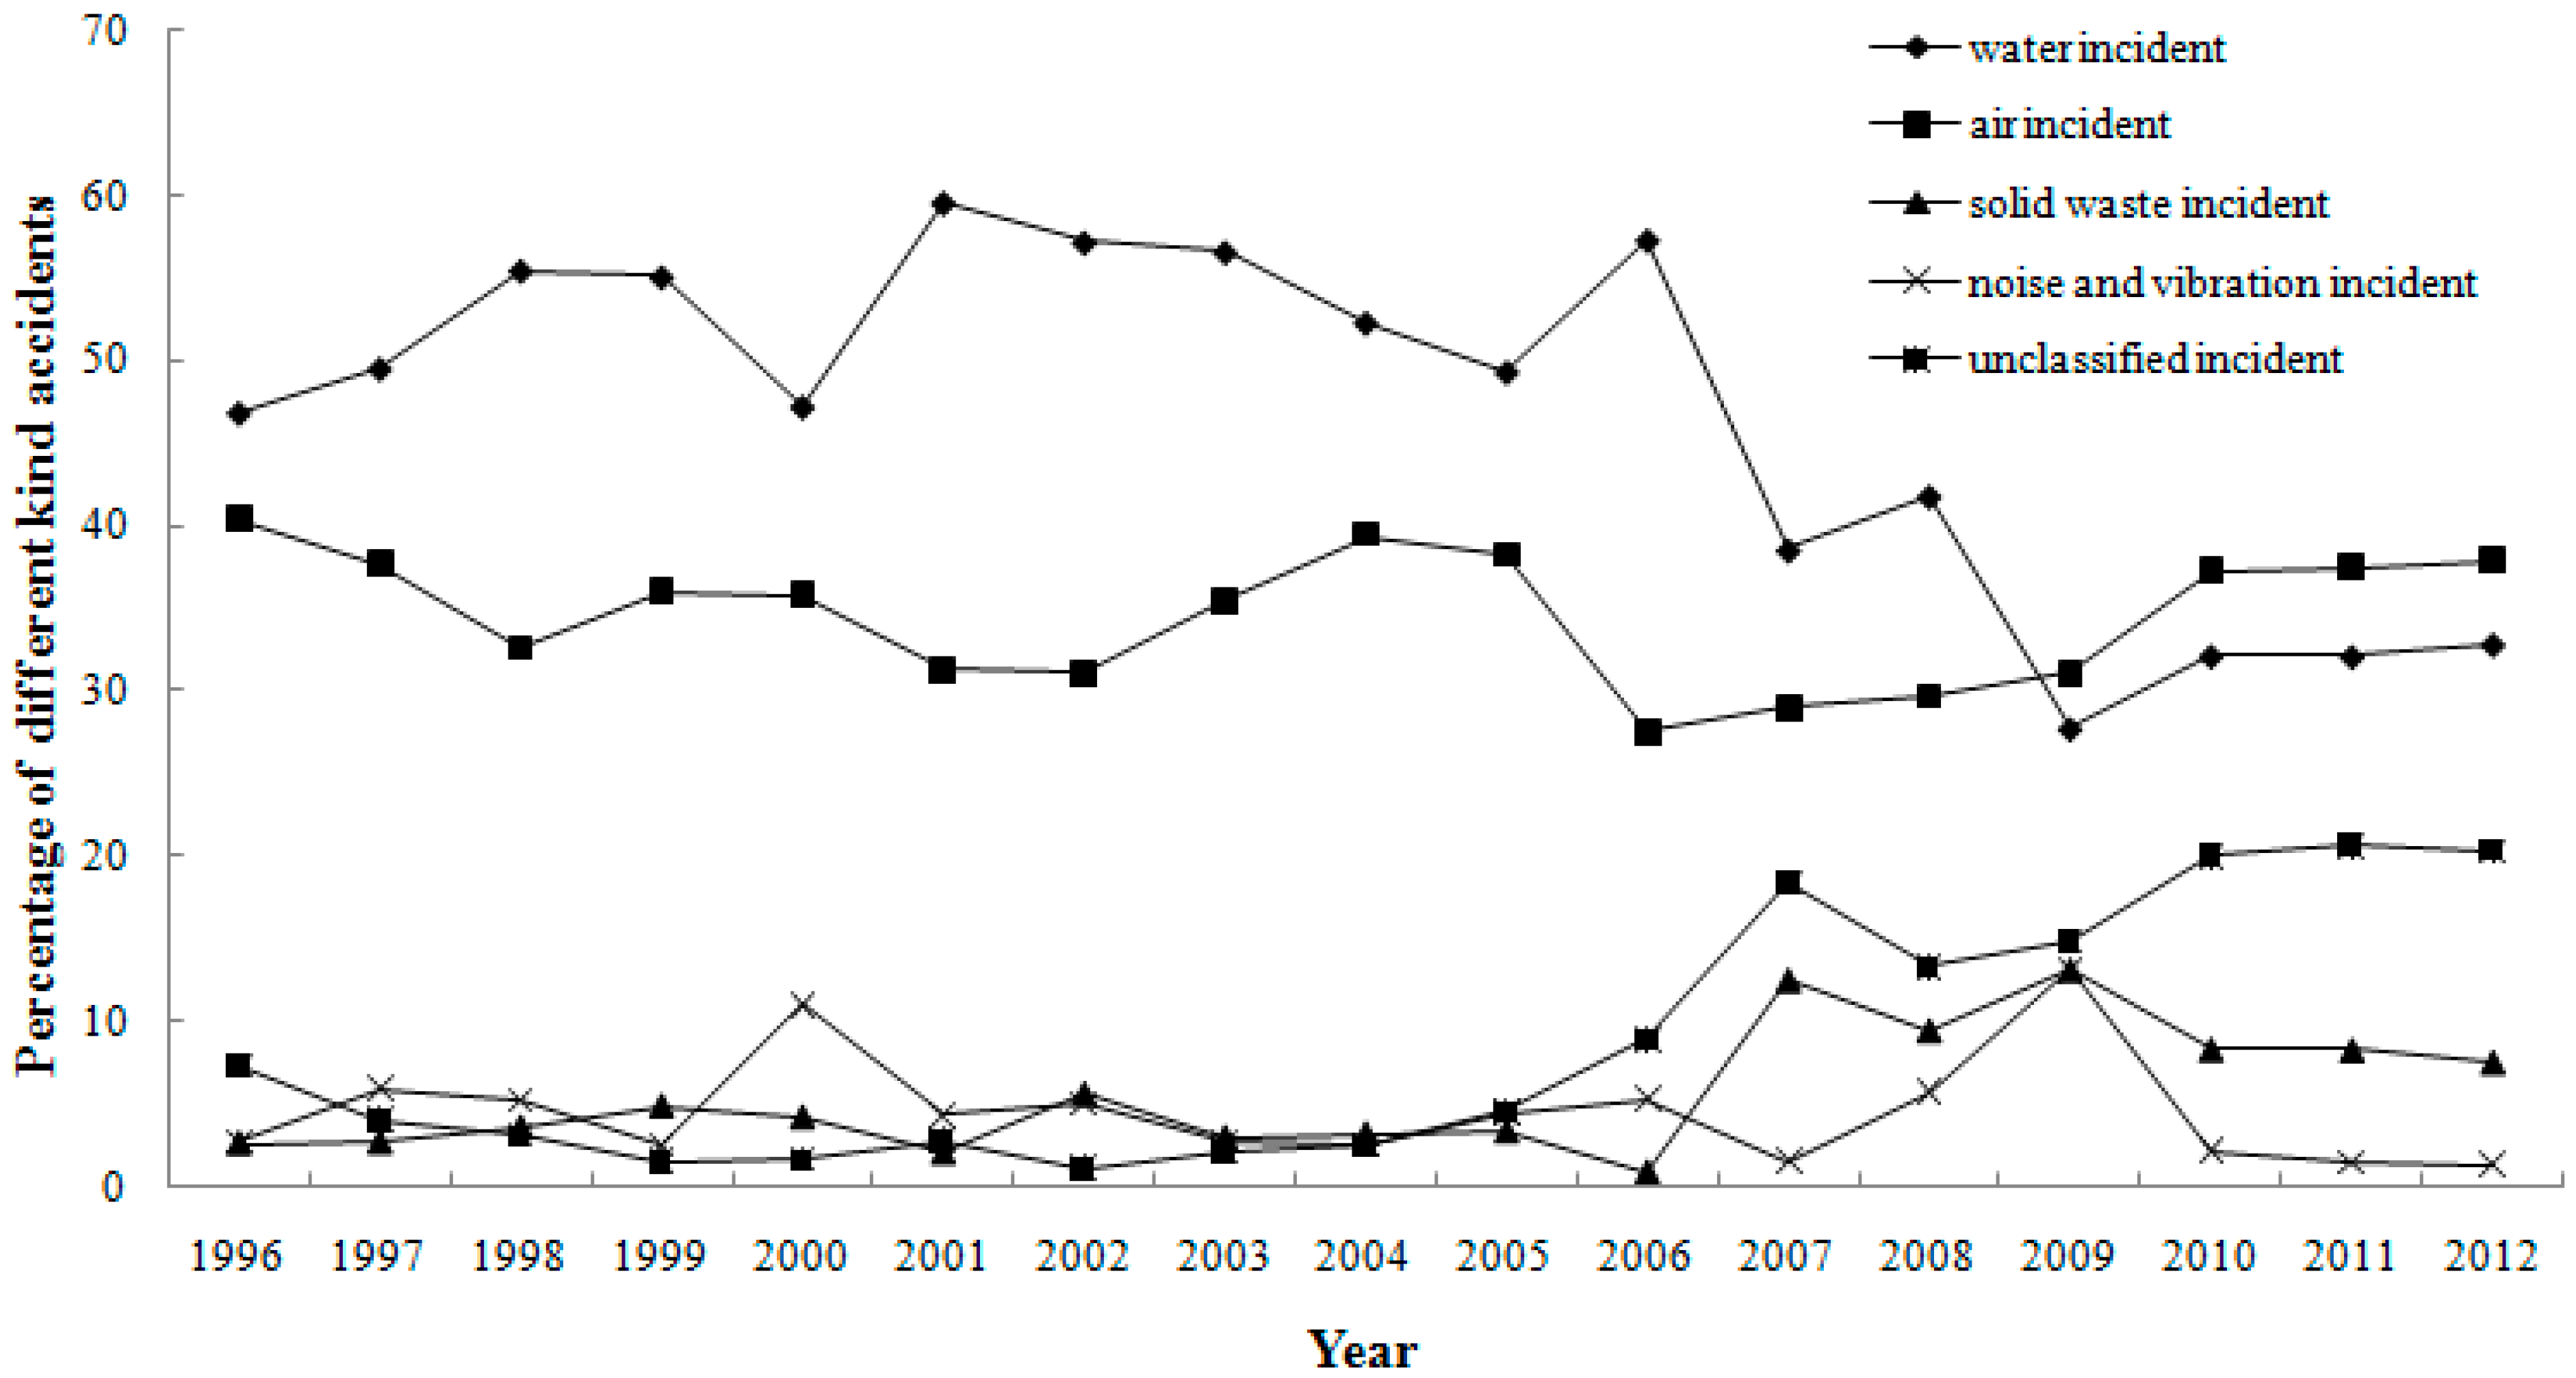
3.1.2. Statistical Variation Characteristics

From the perspective of the type of environmental pollution incident, it is important to note that, among the 23,004 environmental incidents, more than 85% were water and air pollution incidents (Figure 2), accounting for 50.60% and 35.28%, respectively. Of the remaining incidents, 4.28% were related to solid waste pollution, 4.62% to noise and vibration incidents, and 5.22% were unclassified incidents referring to marine pollution incidents, chemical and pesticide pollution incidents, ecological destruction incidents or radioactive contamination incidents.
By contrast, Figure 2 shows that water pollution incidents ranged from 51.98%–32.84%, while air pollution incidents ranged from 37.23%–38.01%, and that these two have been the dominant types of environmental incidents in China since 1995. In addition, it is worthwhile noting that, after 2009, air pollution related incidents started to exceed water pollution incidents. As we know, in recent years, China has continuously suffered from large-scale haze [37,38] and PM2.5 excessive atmospheric events [39], and in many cities, the air quality has continually deteriorated [40,41,42,43]. Moreover, chemical plant explosion accidents have intensified the air pollution. Whereas, solid waste incidents and unclassified incidents have displayed an obvious increasing trend during the past decade, especially hazardous chemical or hazardous material incidents [5,44]. The proportional variation of different incidents illustrates the varying emphasis of regulation of pollution incidents in China.
Figure 2. Proportion of different kinds of environmental incidents in China, 1995–2012.
Sustainability 07 14385 g002

3.2. Spatial Distribution Characteristics and Evolution

3.2.1. Global Spatial Relationship Changes

According to the principle of the aforementioned Getis-Ord General G statistic, the value of G (d) and the Z-score were calculated by using the ArcGIS10.0 Spatial Analysis tool, in order to confirm the pattern of spatial agglomeration; the results are shown in Table 1.
Table 1. Getis-Ord General G statistic results of environmental pollution incidents in China, 1995–2012.
YearG (d)E (d)Z-Scorep-Value
19950.0450.0291.5510.121
19960.0340.0290.5820.562
19970.0400.0291.5910.110
19980.0350.0290.8030.422
19990.0420.0291.8110.071
20000.0460.0292.0150.044
20010.0530.0292.8640.004
20020.0560.0292.9710.003
20030.0540.0292.2630.023
20040.0490.0292.6460.008
20050.0530.0292.3370.019
20060.0490.0292.3810.017
20070.0350.0290.6930.488
20080.0440.0291.8520.064
20090.0490.0291.8990.057
20100.0510.0291.8160.069
20110.0490.0292.0050.045
20120.0730.0293.6370.0003
It can be seen that the value of G (d) was always positive and greater than E (d), and displayed a fluctuating and gradual increase from 0.045 in 1995 to 0.073 in 2012, indicating a greater spatial agglomeration of environmental pollution incidents. Secondly, the Z-score of Getis-Ord General G showed no statistical significance from 1995–1998, indicating that the environmental pollution incidents trended in a random distribution at the global level. Whereas, the year 1999 was a turning point, and the Z-score showed a statistical significance (at least at a significance level of 0.1), except in 2007 (Z = 0.693, p = 0.488), which reveals an obvious spatial agglomeration phenomenon. That is to say, there existed certain hotspots of environmental pollution incidents after 1999. However, it did not show the specific high frequency hotspots of environmental pollution incidents, the Getis-Ord Gi* statistic was adopted for further tests.

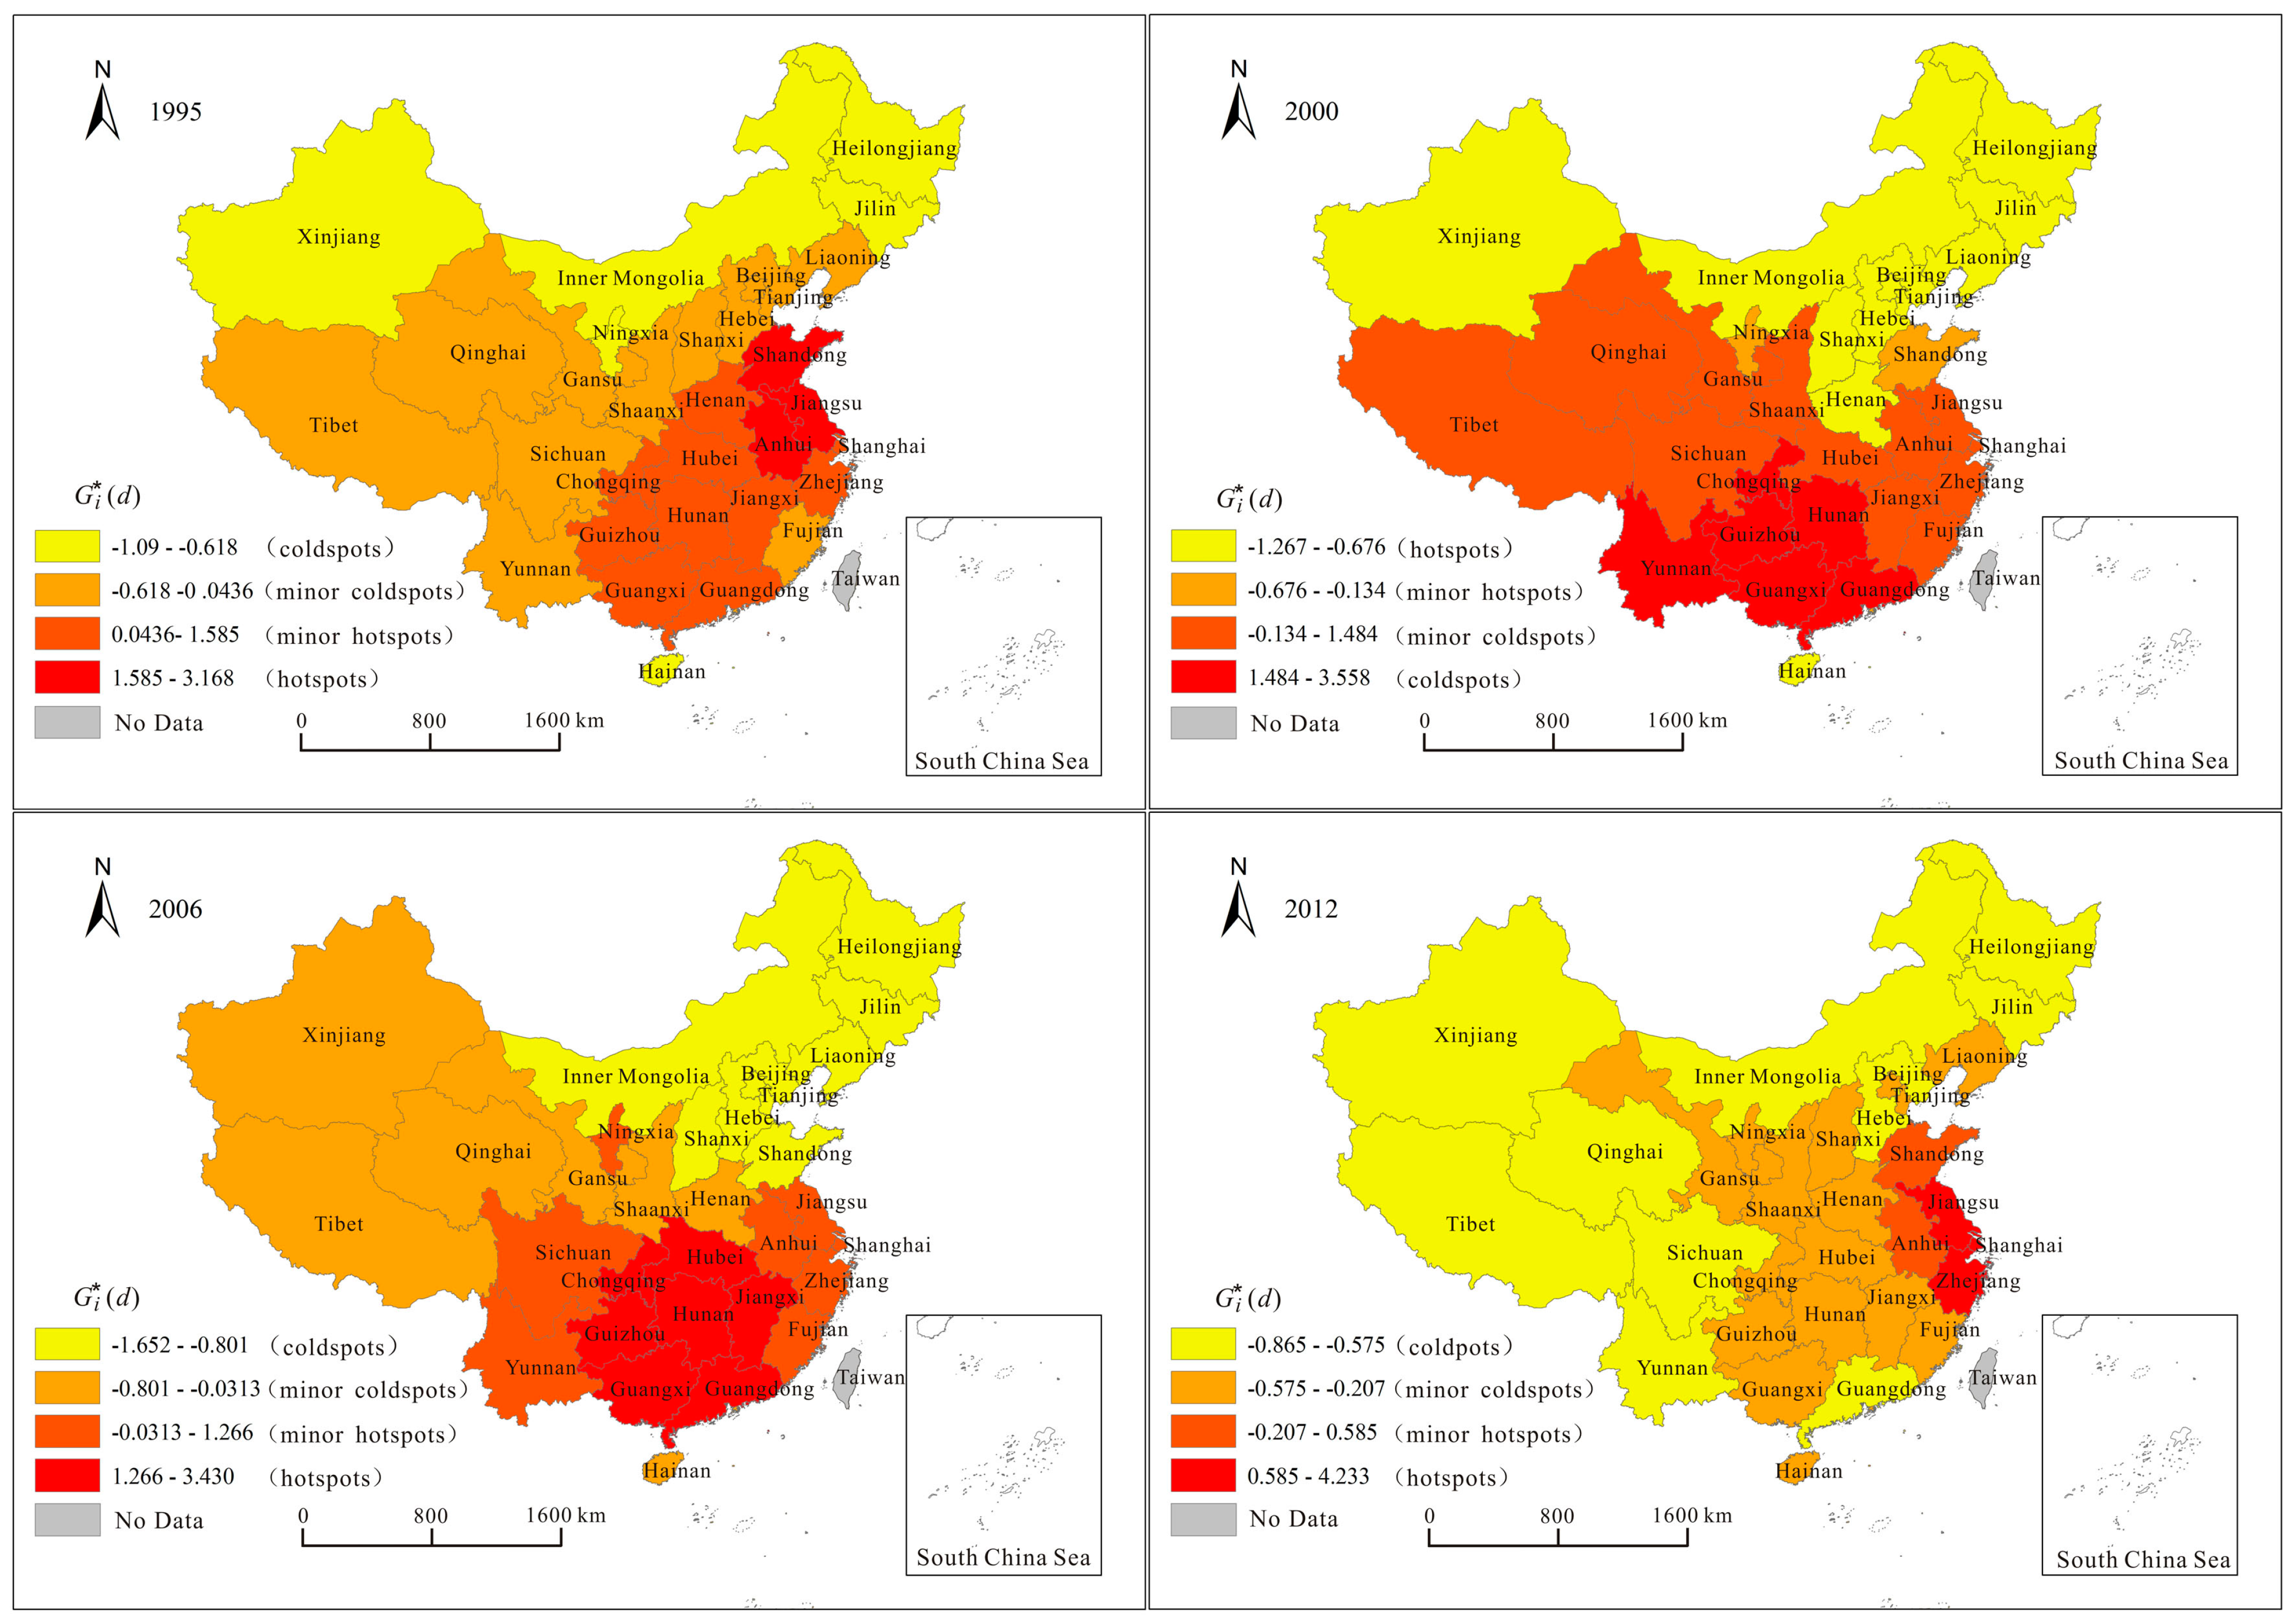
3.2.2. The Evolution of Local Hotspots

The Getis-Ord Gi* statistic was used to analyze the hotspots of provincial environmental pollution incidents, and four time points in 1995, 2000, 2006, and 2012 were selected for the comparative analysis. Then, Jenks Natural Break Method [45,46]—which is a data classification method that determines the best arrangements of values in different classes and seeks to reduce variance within classes and to maximize variance between classes—was adopted to divide the 31 Chinese provinces into four different groups. From high to low, the levels of spatial agglomeration of environmental pollution incidents were categorized as: hotspot agglomeration areas, minor hotspot agglomeration areas, minor cold-spot agglomeration areas, and cold-spot agglomeration areas, respectively. Finally, the spatial and temporal patterns of environmental pollution incidents in China were mapped, and are shown in Figure 3 and Table 2.
Table 2. Hotspot areas in China, 1995–2012.
YearHotspotsNumber
1995Jiangsu, Shangdong, Anhui3
1996Jiangsu, Anhui, Henan, Chongqing, Yunnan5
1997Anhui, Fujian, Guangdong, Guangxi, Hunan, Guizhou, Yunnan7
1998Anhui, Fujian, Guangdong, Guangxi, Hunan, Jiangxi6
1999Guangdong, Guangxi, Hunan, Guizhou, Yunnan5
2000Guangdong, Guangxi, Hunan, Guizhou, Yunnan, Chongqing6
2001Guangdong, Guangxi, Hunan, Guizhou, Yunnan5
2002Guangdong, Guangxi, Hunan, Guizhou, Yunnan, Chongqing, Jiangxi7
2003Guangdong, Guangxi, Hunan, Guizhou, Yunnan, Jiangxi6
2004Guangdong, Guangxi, Hunan, Guizhou, Yunnan, Chongqing, Jiangxi7
2005Guangxi, Guizhou, Yunnan3
2006Guangdong, Guangxi, Hunan, Hubei, Chongqing, Jiangxi, Guizhou7
2007Shanghai, Jiangsu, Zhejiang3
2008Shanghai, Jiangsu, Zhejiang3
2009Shanghai, Jiangsu, Zhejiang3
2010Shanghai, Jiangsu, Zhejiang3
2011Shanghai, Jiangsu, Zhejiang3
2012Shanghai, Jiangsu, Zhejiang3
Figure 3. Evolution of the spatial hotspots of environmental pollution incidents in China, 1995–2012.
Sustainability 07 14385 g003
It can be seen that: (1) The number of hotspot provinces was variable and changing, from three provinces in 1995, expanding to six provinces in 2000, and hovering around seven between 1996 and 2004, before dropping to three in 2007–2012 (Jiangsu, Zhejiang, and Shanghai), indicating that the degree of spatial agglomeration of hotspot provinces strengthened and then weakened; (2) The occurrence of hotspots within the areas of environmental pollution incidents was relatively frequent, with the Pan Yangtze River Delta region and the Pan Pearl River Delta region being the primary hotspot areas. Among the hotspots areas, those in 1995 were mainly concentrated in Shandong, Jiangsu, and Anhui, all located in the Pan Yangtze River Delta Region. After 1999, this turned out to be the Pan Pearl River Delta region and southwest China, and in 2006, central China became a hotspot area (e.g., Hubei and Jiangxi province). After 2007, the hotspots were centered in the Yangtze River Delta region (Jiangsu, Zhejiang and Shanghai). The orientation of hotspots may relate to national development strategies and industrial upgrading [4]. For instance, the movement of hotspots to southwest China after 2000 dovetailed with the government strategy for development of China’s West. This strategic policy began in 2000, whereby many polluting enterprises (including a large number of small and medium-sized enterprises) quickly came into operation, which, together with a lack of effective management of environmental regulations, resulted in plenty of environmental pollution incidents occurring [10,47,48]. In 2006, the Chinese government began to implement the Central-China Rising strategy, while the Yangtze River Delta region entered into a time of rapid development of the social economy. During this time, Zhang’s study (2011) showed that the Yangtze River Delta region had entered the stage of heavy, energy intensive, and high water consumption after the year 2007, which brought with it increased environmental pressure and, consequently, industrial waste, specifically “three wastes” emissions in peak periods [49]. This is one of the main reasons why the hotspots started to appear in the eastern and central areas. Meanwhile, the spatial agglomeration was closely related to the trans-border pollution incidents, such as incidents in Wujiang, Jiangsu province, and Jiaxing, Zhejiang province in 2005. Moreover, another more widely reported incident was when Jiaxing dead pigs polluted the Huangpu River in Shanghai in 2013; (3) Environmental pollution incident hotspot provinces demonstrated a spatial hierarchy structure of gradient attenuation tendency, formed with the Yangtze River Delta and the Pearl River Delta as the core hotspots area, and the diffusion outward of minor hotspots (e.g., Jiangxi, Hubei, Anhui) and cold-spots (e.g., Xinjiang, Ningxia). Of course, the core hotspots area was the essential region to control in the future.

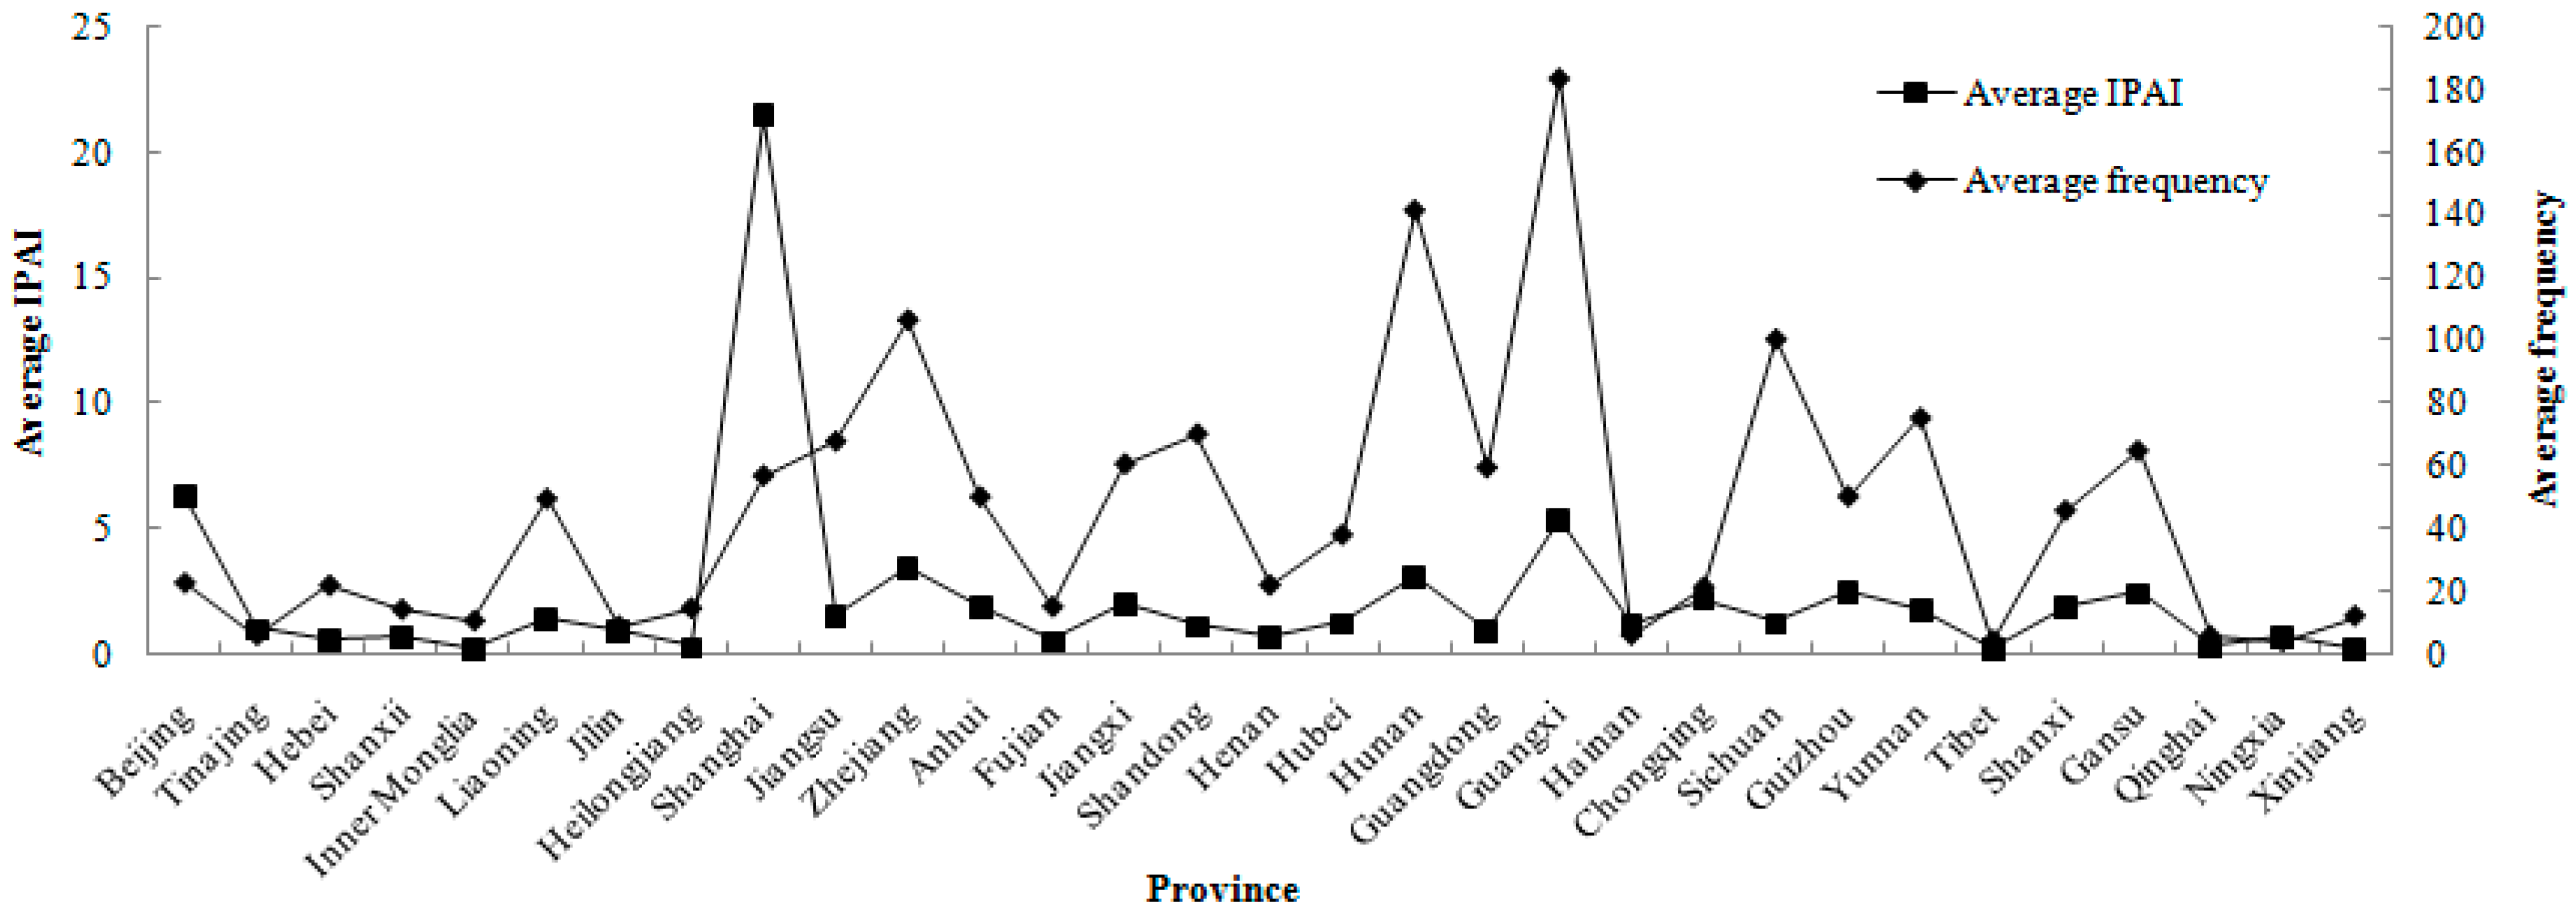
3.3. Hotspots Pattern Evaluation of Environmental Pollution Incidents

The Getis-Ord Gi* statistic and hotspot temporal patterns explained the evolution process of hotspots and the spatial relationships between different provinces through the frequency of provincial environmental pollution incidents. However, previous studies indicated that the frequency of environmental pollution incidents was mainly related to the level of industrialization, pollution control, economic structure, industry layout situation, and government environmental supervision ability, etc. [4,5,50]. Different provinces also may have diverse hotspots patterns and characteristics as time goes on. Therefore, the hotspots’ patterns were classified based on the value evolution of IPAI. Initially, it can be clearly seen that the average frequency was different from the average IPAI value in each province over the 18 years (Figure 4), typically as Shanghai and Beijing had higher average IPAI values and relatively lower average number of incidents, which gave a greater probability of incidents’ hit rate.
Figure 4. Comparing with average frequency and average IPAI value in each province from 1995–2012 in China.
Sustainability 07 14385 g004
Subsequently, in order to explore the hotspot mode for each province, they were divided into the three different kinds of patterns and combined with the economic development situation and industry characteristics (Table 3). In practical terms, stable hotspot provinces were defined by an n (when IPAI > 1) and N (total year) ratio greater than or equal to 0.5 and an average IAPI exceeding 1; while unstable hotspots provinces were defined by an n (when IPAI > 1) and N (total year) ratio less than 0.5 and an average IAPI exceeding 1; and the rest are cold-spot provinces with an IAPI less than 1. Of course, due to the regional differences in industry characteristics, stable hotspots also have different subtypes, mainly based on the industrial distribution type, industrial transfer type, and extensive economic growth type, and which manifested as the different characteristics of environmental pollution incidents. The specific analysis is outlined as follows.
Table 3. Hotspot mode patterns, characteristics of pollution incidents, and control strategies.
Hotspot PatternTypeCharacteristicsTypical ProvincesControl Strategy
Stable hotspotsIndustrial distribution typeEnvironmental pollution incident is closely related to the layout of regional pollution industry, frequency of incidents remains stable or continues to increaseZhejiang, Shanghai, Beijing, ChongqingAdjust the industrial layout, technical innovation, environmental regulation, shut down or rectified polluting enterprises, focus on cross-border incidents.
Industrial transfer typeEnvironmental pollution incidents related to this area to undertake external transfer of industry, has structural risk, and shows the corresponding periodic incident high-risk characteristicsGuangxi, Guizhou, Yunnan, Sichuan, Anhui, HuibeiStrict industry access to prohibit heavy pollution projects, comprehensive investigation of environmental pollution risks, improve environmental contingency plans and emergency facilities
Extensive economic growth typeEnvironmental pollution incidents related to the extensive development of local resources and the unreasonable industrial structure, but in the past 5 years have significantly slowed Jiangxi, Hunan, Shanxi, LiaoningImprove the environmental emergency facilities, adjust the industrial structure, strict enforcement of environmental laws, achieve regional green growth
Unstable hotspotsEnvironmental pollution incidents are not stable, individual years frequency is higherShandong, HainanImplement emergency measures to actively prevent natural disasters and other unexpected factors
Cold spot areaIndustrial output typeIAPI value is small, and frequency of incidents is decreasingGuangdong, Fujian, TianjinPolluting enterprises technological innovation, improve the environmental emergency plan, focusing on transboundary effects of the incident (Marine Pollution)
Economically backward typeIAPI value is small, frequency of environmental pollution incident is also small, industrial base relatively poorXinjiang, Qinghai, Ningxia, TibetEcological protection and development of mineral resources in a rational and orderly, careful introduction of polluting industries

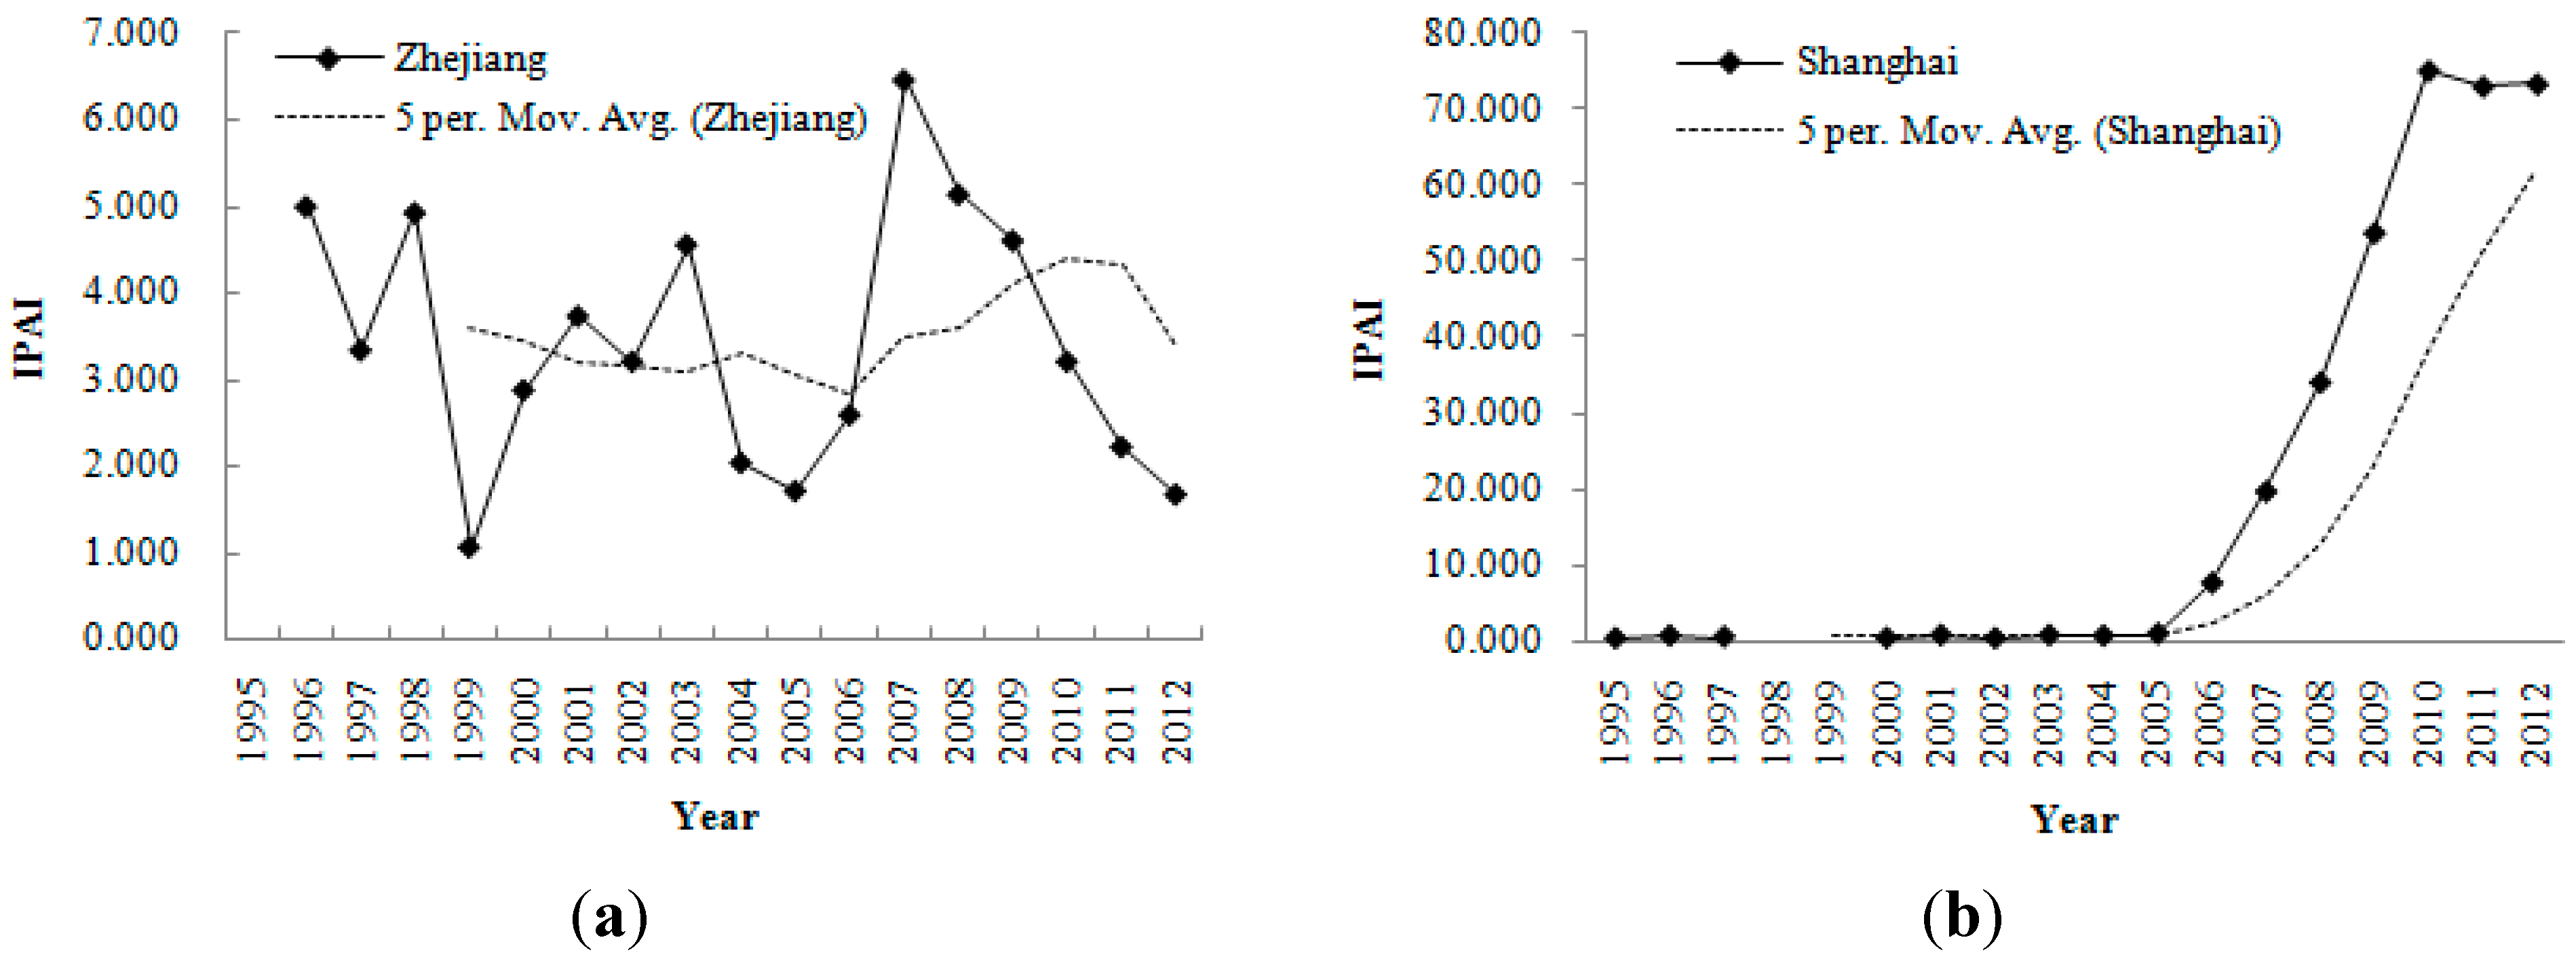
3.3.1. Industrial Distribution Types in Economically Developed Provinces (Zhejiang, Shanghai)

The stable hotspots and high-risk areas of environmental pollution incidents first appeared in the economically developed provinces such as Zhejiang Province and Shanghai, with the typical environmental performance being closely related to the layout of the regional polluting industry.
The annual IAPI values of environmental pollution incidents were greater than 1 in Zhejiang province (Figure 5a), with an average annual value as high as 3.427, showing a very stable hotspot zone, and a cumulative total frequency reaching 1813. As a province at the forefront of the developed economies and as an important manufacturing base, Zhejiang mainly relies on lots of private enterprises; with the leading industries being garments and textiles, general machinery and equipment, electrical machinery equipment, chemical, pharmaceutical, and metal products industries [51]. Also, the majority of the small- and medium-sized private enterprises are labor intensive (unlike Jiangsu and Shandong provinces, which rely on state-owned industrial development model of foreign companies), and the level of industrial technology is not advanced enough with low structural levels. Additionally, much of the layout of polluting industries increases the risk of environmental pollution incidents [52,53]. The chance of incidents occurring is also increased due to the small- and medium-sized enterprises having a poor capacity to control pollution emissions and ensure safe production management. Typically, the incidents such as the Dongyang Huashui town pollution incident, the Xinchang drug contamination incident, and the Changxing battery factory pollution incident in 2005 were closely related to the regional intensive distribution of chemical, electroplating, and pharmaceutical companies. Another cause for the Zhenhai PX incident in Ningbo in 2012 and which attracted significant social attention was the fact that the local residents resisted the establishment of a chemical company due to the serious potential environmental risks.
In addition, the environmental pollution incident hotspot type in Shanghai showed it was a continuous hotspot region characterized by low frequency, steady growth turning to rapid growth. Here, the year 2005 was the turning point, as IPAI increased rapidly after 2006 (Figure 5b). Furthermore, the total number of environmental pollution incidents from 2008–2012 reached 911, and Shanghai was the provincial unit with the most frequent pollution incidents during this period. As is known, Shanghai is the core city in the Yangtze River Delta economic group, with a large number of traditional heavy chemical industry enterprises distributed around the Huangpu River and the Suzhou River, while some new chemical industry parks are located in Wusong, Takahashi, Jinshan and Baoshan County, etc. Due to the unreasonable industrial distribution and industrial structure, the environmental incident risk was becoming increasingly prominent [54]. At the same time, Yangtze River delta economic activities were linked to each other, with a well-developed transportation network and a prosperous logistics industry, which increases the risk of incidents in the process of chemical products transportation. Then, as time goes on and equipment ages (especially chemical pipeline aging), combined with operational errors by workers, the frequency of environmental pollution incidents increased rapidly after slow growth in the early years. Yang et al.’s (2012) research showed that toxic and harmful chemical spill events, flammable and explosive chemicals leakage and fire explosion incidents were the main sudden environment incidents impacting on Shanghai environmental safety. Poor management of safety incidents, bad traffic incidents and some illegal behavior were the main reasons for these environmental pollution incidents [55]. In addition, it should not be overlooked that, in regards to the environmental pollution of the Yangtze River Delta’s regional incidents spatial diffusion effect, the aforementioned Getis-Ord Gi* statistic shows that environmental pollution incidents lead to an agglomeration pattern, such as the localized haze and air pollution events in recent years. Therefore, the connectivity of transboundary water pollution incidents (such as the Huangpu River dead pig incident in 2013 [56]) puts forward higher requirements for the joint prevention of regional pollution.
Figure 5. Layout type of stable hot provinces’ interannual IPAI and the moving average per five years. (a) interannual IPAI variation of Zhejiang; (b) interannual IPAI variation of Shanghai.
Sustainability 07 14385 g005

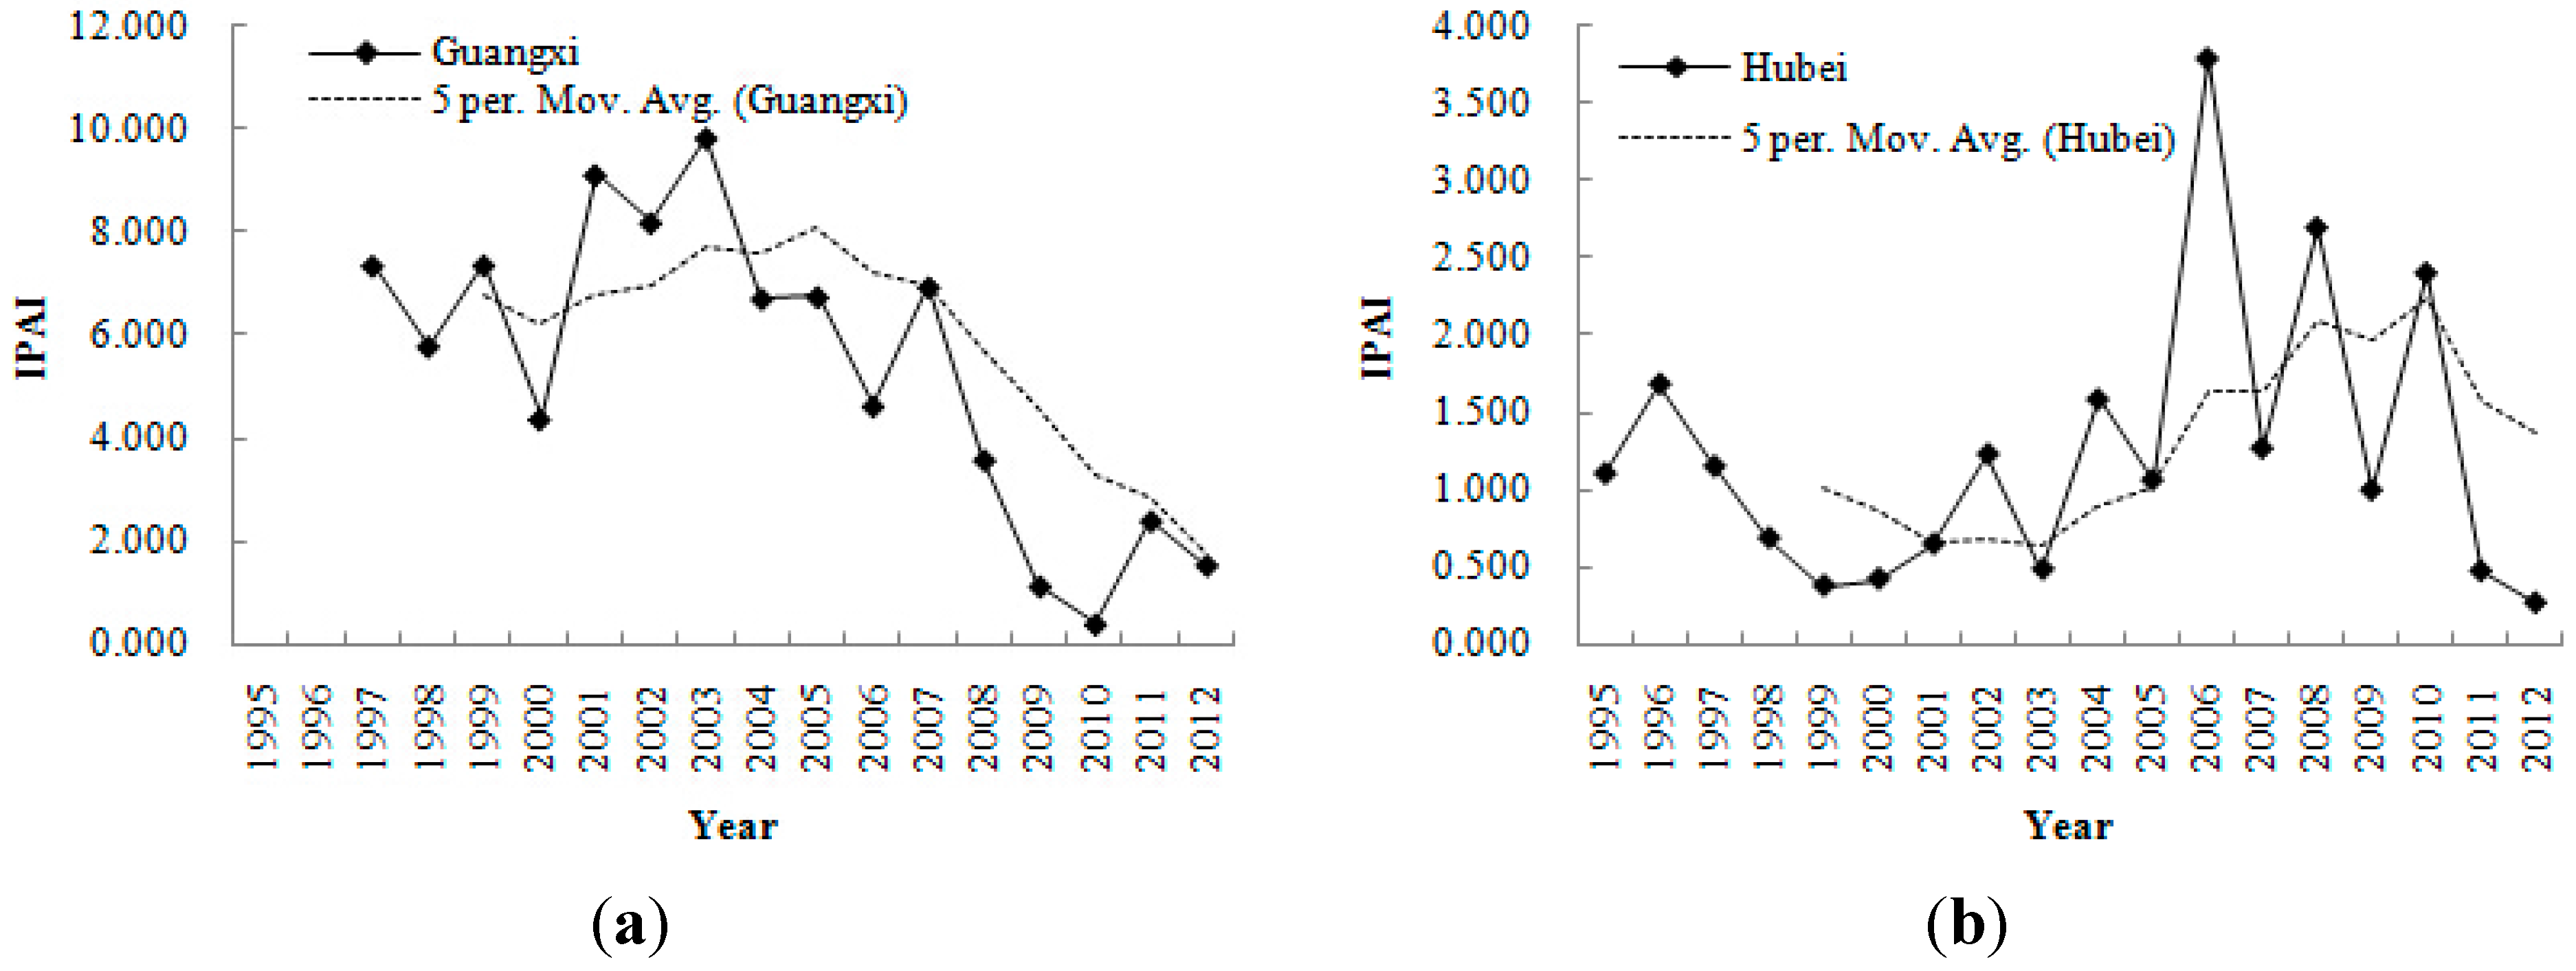
3.3.2. Industrial Transfer Type in Rapid Economic Development Provinces (Guangxi, Hubei)

Another hotspot of environmental pollution incidents is focused on the rapid economic development in the Midwest region, such as in the Guangxi Zhuang Autonomous Region and Hubei Province, which are closely related to undertake the transfer of polluting industries. In recent years, with the changes in the domestic and international economic environment, the eastern provinces have sped up the adjustment of industrial structure under dual pressure from the market and government [47]. Combined with the carrying forward of the West Development Strategy and the Central-China Rising strategy, which saw a large number of low-end manufacturing industries (mainly heavy resource consumption and labor-intensive industries) gradually shifting to central and western China, many of which were polluting ore, smelting, chemical, and other enterprises, plus given the absence of a reasonable background understanding of environmental monitoring mechanisms and pollution prevention and control in these industries, this led to an increased frequency of environmental pollution incidents occurring in the central and western regions.
The Guangxi Zhuang Autonomous Region adjacent to the Pearl River Delta is at the forefront of the development of the western region. It is also a rapid economic development base for China’s southern coastal provinces. The environmental pollution incidents’ hotspot mode type in Guangxi showed it was a continuous hotspot region, characterized by a gradual weakening after an initial growth wave, and where the year 2000 was the turning point, with a declining IPAI value after 2009 (Figure 6a), in spite of the total number of incidents showing the highest frequency in China in 1995–2000, reaching 2940. The aforementioned Getis-Ord Gi* statistic also shows that environmental pollution incidents moved southwest China after 2000, especially to Guangxi, with a rapid outbreak of environmental pollution incidents after 2000. The typical incidents, such as the Lu Chuan benzene spill incident in 2001, the Guangxi Luzhai Chemical fertilizer Co. Ltd. (Liuzhou, China) SO2 spill incident in 2002, and the Guangxi Huayin aluminium industry Co. Ltd. (Baise, China) water pollution incident in 2008, were related to production difficulties and illegal discharges caused by external polluting enterprises. In addition, there is a wide variety and large reserves of mineral resources in Guangxi. As one of the 10 key national areas for producing non-ferrous metal in China, Guangxi’s excessive number of developed metallurgical chemical enterprises with their own commercials demands has led to more frequent pollution incidents involving heavy metal industry polluting emissions and toxic substances leaking to the watershed [57], such as Hechi’s heavy arsenic pollution incident which occurred in 2001, Hechi’s Longjiang River cadmium pollution incident in 2012, and Hejiang’s water pollution incident in 2013.
Figure 6. Transfer and structured types of stable hot provinces’ interannual IPAI and the moving average per five years. (a) interannual IPAI variation of Guangxi; (b) interannual IPAI variation of Guangxi.
Sustainability 07 14385 g006
Similar to Guangxi, the environmental pollution incident hotspot mode type in Hubei province showed it was a continuous hotspot region, characterized by a reduced volatility after an initial slow growth period, reaching a peak in 2006 (frequency of 81), and an IPAI value after 2006 that was significantly higher than that in the early stages of development (Figure 6b), which is consistent with the spatial agglomeration result from the Getis-Ord Gi* statistic in 2006. China first proposed in 2004 and formally implemented in 2006 “the Mid-China Rising strategy”, which brought great development opportunities to Hubei and other central provinces, and with them the transfer of industries and the rapid development of the regional and local economy, but also more frequent environmental pollution processes and pollution incidents [58]. As an important province in the middle reaches of the Yangtze River Basin, Hubei’s rivers and lakes are home to densely distributed, messy scattered petrochemical, pharmaceutical, and chemical industries, printing and dyeing industries, and other heavily polluting industries, and have become a focus for regional industry development. Consequently, this transfer direction has brought a greater risk of environmental pollution incidents occurring, such as the ammonia spill incident by Dawu County Huangmailing’s nitrogenous fertilizer plant in 2006, the highly toxic chemical flow into the Yangtze River incident by Zhijiang Kaiyuan Chemical Technology Co. Ltd. (Xiaogan, China) in 2006, and the water pollution incident by Hubei Xiangfan Kexing pharmaceutical chemical Ltd. (Xiangyang, China) in 2008.

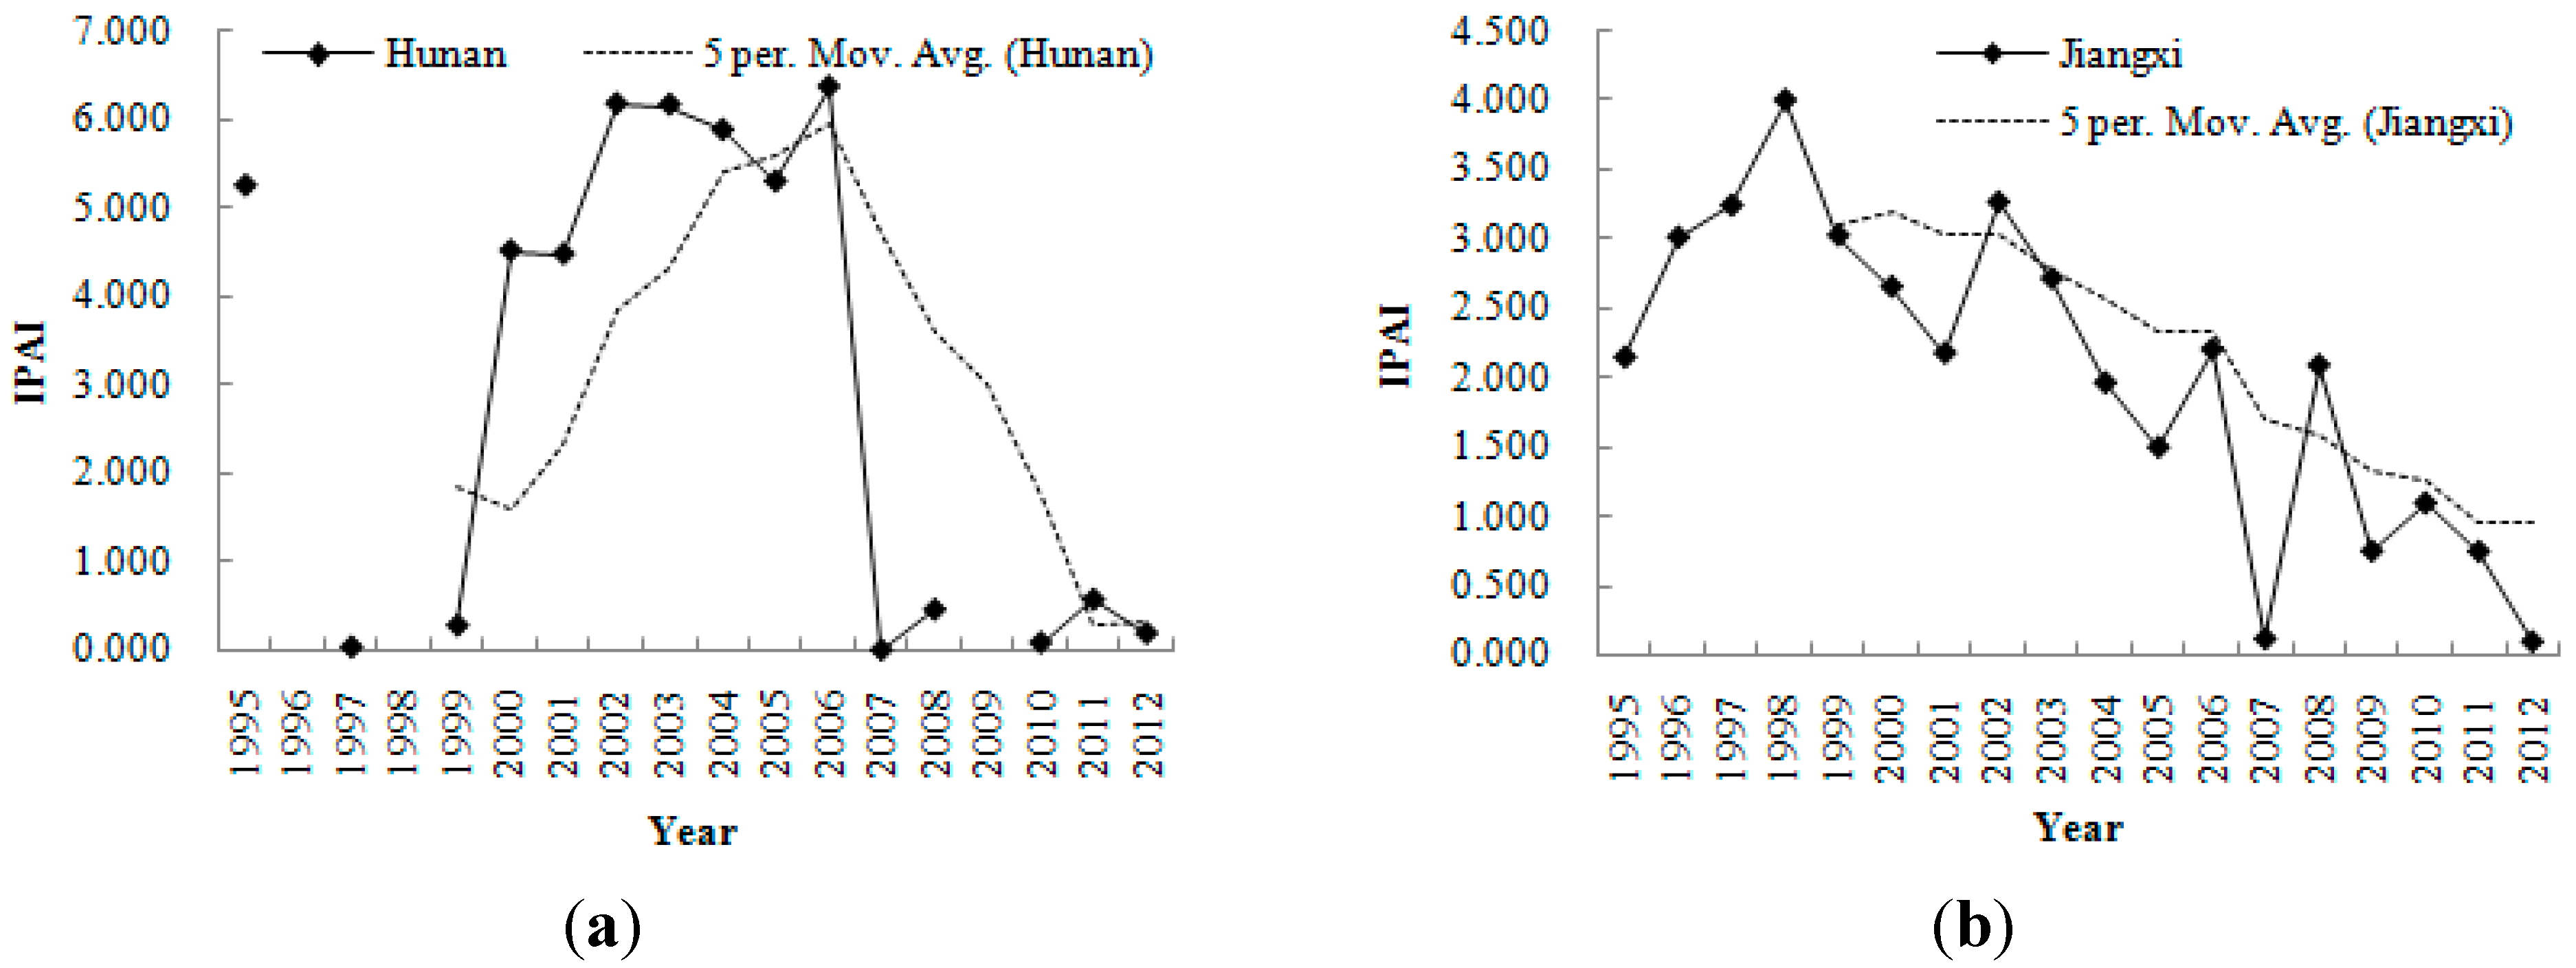
3.3.3. Extensive Growth Types of Pollution Incidents from Rapid Economic Development (Hunan, Jiangxi)

Some scholars have revealed not only that in recent years the frequency of major environmental pollution incidents has a close relationship with the environmental management system and mechanisms in place, but also that more extensive economic development has long-term cumulative consequences that fundamentally contribute to the occurrence of pollution incidents [4,5]. In this paper, Hunan and Jiangxi Provinces were taken as the examples for a specific analysis of this phenomenon.
The total frequency of Hunan’s environmental pollution incidents was 2126, only just lower than Guangxi, with the highest incidence of incidents occurring between 2000 and 2006. The value tendency of IPAI appears as an inverted V-shaped feature (Figure 7a). For a long time, Hunan’s economic growth depended on the whole production input of many factors (e.g., capital, resources, labor), and Human showed an extensive growth mode, but together with high material consumption, high energy consumption, and also high pollution, where some pollution problems were long outstanding [59]. This means that adjusting the industrial structure has become a top priority. In addition, Hunan has abundant mineral resources (e.g., tungsten, bismuth, antimony, lead, zinc, aluminum, titanium mine, etc.), and a non-ferrous metals industry, fine chemical industry, and machinery manufacturing industry that all have developed rapidly. Due to backward production technology and illegal pollution discharges, numerous environment pollution incidents emerged one after another, such as the Xinqianghe water pollution incident in 2006 in Yueyang City, the Liuyang cadmium pollution incident and the Wugang children lead poisoning incident in 2009.
Adjacent to Hunan province, the total number of Jiangxi’s environmental pollution incidents was 1093, and during 1995–2006 was the highest rate of incidents, while the value of IPAI showed a general linear decreasing trend (Figure 7b). Since the beginning of the 21st century, Jiangxi Province has achieved rapid economic growth under the central implementation strategy guidance and motivation, but the economy experiences structural challenges and the extensive growth trend has not changed. Similar to Hunan, Jiangxi is rich in mineral resources with many diverse types (e.g., copper, tungsten, uranium, tantalum, heavy rare earth, gold, silver mine, etc.), and, thus, has a large metallurgy and metal products industry, together with proprietary Chinese medicine and biological medicine industries, and is characterized by the excessive development of mineral resources and the rapid development of small- and medium-sized enterprises. Consequently, there have been a number of environmental pollution incidents in Jiangxi province, such as the Ganjiang water pollution incident by the Xingan County chemical plant explosion in 2007, Dexing heavy metal contamination incidents in 2011, and the Jiangxi copper waste-water pollution incident in 2011.
Figure 7. Extensive growth type of stable hot provinces’ interannual IPAI and the moving average per five years. (a) interannual IPAI variation of Hunan; (b) interannual IPAI variation of Jiangxi.
Sustainability 07 14385 g007

3.4. Regional Sustainable Management Strategy

For the sustainable development of fast expanding economic activity in China, it is strategically important to move from responding reactively to risks and incidents to proactively preventing them. This calls for a more coordinated management of incident hotspots. Furthermore, in facing the challenges of pollution incidents, different levels of the Chinese government consistently seek to enhance their support capability through science and technology to prevent environmental emergencies [10]. This paper has been mainly focused on the above-mentioned three mode types of stable hotspots in order to analyze the regional sustainable management strategies (Table 3), specifically:
(1)
For the industrial layout of an environmental pollution incident hotspot model for the provinces: firstly, the industrial layout must been reasonably adjusted to strengthen the technical innovation of polluting enterprises, implement environmental regulations, shut down and rectify enterprises with pollutant over-discharges, and focus on the cross-border impact of the incident. For example, Shanghai started to relocate chemical enterprises after 2007, mainly targeting those in urban areas and also targeted the water surrounding chemical enterprises; furthermore, it planned to complete the layout adjustment of non-industrial park enterprises involved with dangerous chemicals; actively encourage and support enterprises in achieving technological innovation; encourage increased environmental protection efforts and input; and improve the environmental emergency response plans and emergency facilities [60].
(2)
For the industrial transfer environment pollution incident hotspot mode for the provinces: the reality shows that the layout of the pollution-intensive industries tends to be dictated by the movement of regional incidents from provinces with strong environmental regulations to provinces with loose environmental regulations. The intensity of punishment and fines must be enhanced, and the polluting enterprises’ entry standard must be improved. On 6 September 2010, the State Council issued the Guidance on the central and western regions to undertake industrial transfer, and indicated explicitly that the resources carrying capacity of the environment was an important basis to consider when assessing the transfer of industry. The Midwest provinces ought to selectively accept eastern enterprises on the basis of economic development while developing a green economy. In addition, on February 2014, Guangxi issued the Implementation of environmental reversed transmission mechanism to promote industrial transformation and upgrading of tough decision, which emphasized that Guangxi will strengthen resources integration, centralized treatment of heavy metal, and will control the heavy metal pollution incidents.
(3)
For the extensive growth mode of environmental pollution incident hotspot regions: first, it is necessary to adjust the industrial structure, change the growth pattern of the regional economy, ensure orderly and rational development and utilization of resources, and the realization of regional green growth to reduce environmental pollution incidents. Furthermore, properly and safely treated pollution sources, strict environmental enforcement, the promotion of environmental monitoring, improvement of emergency facilities, and drawing up an incident emergency response plan were the important measures that could be applied to reduce the frequency of environmental pollution incidents.
In general, stable hotspots were the key point in the prevention and control of environmental pollution incidents, while unstable hotspots require ongoing and continual prevention measures, and cold-spots need to have strengthened environmental monitoring. Moreover, a multi-level environmental pollution incident emergency response and regional (incident) joint control plan needs be well prepared and established.

4. Conclusions

The spatial-temporal hotspot pattern analysis of environmental pollution incidents is an indispensable source of information for the further development of incident prevention measures. Environmental incidents exhibited a continued reduction after initial dynamic growth using the available statistical data from 1995–2012. The Getis-Ord statistic shows that environmental pollution incidents are mainly agglomerated in the Pan Yangtze River Delta and Pan Pearl River Delta regions. At the same time, movement of the hotspots and incidents was in line with the different economic development stages in the regions, which themselves were closely related to national development strategies. Therefore, similarly to the regional characteristics of environmental pollution, the environmental pollution incident spatial agglomeration pattern is associated with hot-spot provinces that pay attention to the spreading of environmental pollution, and thus, it is necessary to pay close attention to preventing regional environmental pollution incidents from affecting neighboring regions, especially regarding water pollution incidents and air pollution incidents. Moreover, the environmental thresholds of heavy pollution industries need to be lifted in these less-developed regions. Industries with high environmental risks and no technological transformation in the eastern provinces (the Yangtze River Delta) should be prohibited from transferring to the central and western provinces. More importantly, watershed scales and multistage cross-border joint prevention measures need to be suggested to assist environmental pollution incident emergency response linkage mechanisms, especially in the stable hotspots. At present, the Yangtze River Delta and Pearl River Delta regions ought to establish provincial linkage mechanisms, in order to guide the adjacent provincial boundary regions. The local environmental protection department should set up a corresponding mechanism to jointly combat the illegal environmental activities, handle transboundary pollution disputes, and tackle cross-border emergency environmental incidents.
Furthermore, this study is aimed to classify the hotspot patterns of environmental pollution incidents based on the value of an improved prediction accuracy index (IPAI). The results were specifically classified into stable hotspots, unstable hotspots, and cold-spot areas, while the stable hotspots were further divided into three subtypes: industrial distribution type, industrial transfer type, and extensive economic growth type. In fact, the factors contributing to environment pollution incidents are diverse and uncertain for the different provinces; therefore, identifying and determining the spatial-temporal patterns and evolution rule could provide a new perspective for the prevention and control of environmental pollution incidents. Given the overall background of regional industry transfer, the sustainable management of regional environmental pollution incidents has become increasingly important, and in-depth research into environmental risk management systems, including regional environmental planning, environmental risk prevention, environmental emergency monitoring, and emergency response will also be conducted in the future.

Acknowledgments

The study was financially supported by the National Natural Science Foundation of China (Grant No. 41401076 and 41401181) and the Natural Science Foundation of Hubei Province (Grant No. 2013CFB010).
The authors would also like to thank Chao Liu and Yalin Huang.

Author Contributions

Lei Ding and Xu Wang designed the study, analyzed the data and wrote the manuscript. Kunlun Chen, Ting Liu and Shenggao Cheng collected the data, coordinated the data-analysis and revised the paper.

Conflicts of Interest

The authors declare no conflict of interest.

References

  1. Nie, H.H.; Jiang, M.J.; Wang, X.H. The Impact of Political Cycle: Evidence from Coalmine Accidents in China. J. Comp. Econ. 2013, 41, 995–1011. [Google Scholar] [CrossRef]
  2. He, G.; Mol, A.P.J.; Lu, Y. Trust and credibility in governing China’s risk society. Environ. Sci. Technol. 2012, 46, 7442–7443. [Google Scholar] [CrossRef] [PubMed]
  3. Wiens, J.A.; Parker, K.R. Analyzing the effects of accidental environmental impacts: Approaches and assumptions. Ecol. Appl. 1995, 5, 1069–1083. [Google Scholar] [CrossRef]
  4. Ding, L.; Huang, Y.L.; Liu, Y.L.; Cheng, S.G.; Liu, C. Spatiotemporal variability of sudden environmental pollution incidents and influencing factors in China, 1995–2012. Prog. Geogr. 2015, 34, 749–760. (In Chinese) [Google Scholar]
  5. Yang, J.; Bi, J.; Zhang, H.Y.; Li, F.Y.; Zhou, J.B.; Liu, B.B. Evolvement of the relationship between environmental pollution accident and economic growth in China. China Environ. Sci. 2010, 30, 571–576. (In Chinese) [Google Scholar]
  6. Zhu, Y.G.; Wang, L.; Wang, Z.J.; Christie, P.; Bell, J.N.B. China steps up its efforts in research and development to combat environmental pollution. Environ. Pollut. 2007, 147, 301–302. [Google Scholar] [CrossRef] [PubMed]
  7. Li, J.; Lv, Y.L.; He, G.Z.; Wang, T.Y.; Luo, W.; Shi, Y.J. Spatial and temporal changes of emerging environmental pollution accidents and impact factors in China. Environ. Sci. 2008, 29, 2684–2688. (In Chinese) [Google Scholar]
  8. Liu, R.P.; Liu, H.J.; Wan, D.J.; Yang, M. Characterization of the Songhua River sediments and evaluation of their adsorption behavior for nitrobenzene. J. Environ. Sci. 2008, 20, 796–802. [Google Scholar]
  9. Zhang, Q.W.; Zhang, W.D.; Wang, F.; Lu, P.L. Study on assessment methods of eco-environmental damage after pollution accident. J. Anhui Agric. Sci. 2009, 37, 17047–17049. (In Chinese) [Google Scholar]
  10. Xue, P.L.; Zeng, W.H. Trends of environmental accidents and impact factors in China. Front. Environ. Sci. Eng. China 2011, 5, 266–276. [Google Scholar] [CrossRef]
  11. Hou, Y.; Zhang, T.Z. Evaluation of major polluting accidents in China—Results and perspectives. J. Hazard. Mater. 2009, 168, 670–673. [Google Scholar] [CrossRef] [PubMed]
  12. Wirtz, K.W.; Baumberger, N.; Adam, S.; Liu, X. Oil spill impact minimization under uncertainty: Evaluating contingency simulations of the Prestige accident. Ecol. Econ. 2007, 61, 417–428. [Google Scholar] [CrossRef]
  13. He, G.Z.; Zhang, L.; Lu, Y.L.; Mol, A.P.J. Managing major chemical accidents in China: Towards effective risk information. J. Hazard. Mater. 2011, 187, 171–181. [Google Scholar] [CrossRef] [PubMed]
  14. Satt, M.R.; Werth, C.J.; Schaeffer, D.; Yoon, H.; Barkan, C.P. Environmental risk analysis of hazardous material rail transportation. J. Hazard. Mater. 2014, 264, 560–569. [Google Scholar] [CrossRef] [PubMed]
  15. Bonvicini, S.; Antonioni, G.; Morra, P.; Cozzani, V. Quantitative assessment of environmental risk due to accidental spills from onshore pipelines. Process Saf. Environ. Prot. 2015, 93, 31–49. [Google Scholar] [CrossRef]
  16. Zeng, W.H.; Cheng, S.T. Risk forecasting and evaluating model of environmental pollution accident. J. Environ. Sci. China 2005, 17, 263–267. [Google Scholar] [PubMed]
  17. Yang, T. Dynamic assessment of environmental damage based on the optimal clustering criterion—Taking oil spill damage to marine ecological environment as an example. Ecol. Indic. 2015, 51, 53–58. [Google Scholar] [CrossRef]
  18. Han, S.Q.; Cai, X.H.; Li, P.Y.; Xie, Y.Y.; Wang, X.L. Numerical simulation of emergency response to atmospheric pollution accident in Tianjin. China Environ. Sci. 2009, 29, 919–923. (In Chinese) [Google Scholar]
  19. Lee, B.C.; Jeong, J.H.; Na, M.G. Effects of accident management strategy on the severe accident environmental conditions. Ann. Nucl. Energy 2006, 33, 13–21. [Google Scholar] [CrossRef]
  20. Wu, X.G.; Yi, D.X.; Song, J.R.; Huang, Y.D. Study on the emergency mechanism for sudden pollution of water resources. Water Resour. Prot. 2006, 22, 76–79. (In Chinese) [Google Scholar]
  21. Darbra, R.M.; Demichela, M.; Murè, S. Preliminary risk assessment of ecotoxic substances accidental releases in major risk installations through fuzzy logic. Process Saf. Environ. Prot. 2008, 86, 103–111. [Google Scholar] [CrossRef] [Green Version]
  22. Zhang, X.J.; Chen, C.; Lin, P.F.; Hou, A.X.; Niu, Z.B. Emergency drinking water treatment during source water pollution accidents in China: Origin analysis, framework and technologies. Environ. Sci. Technol. 2011, 45, 161–167. [Google Scholar] [CrossRef] [PubMed]
  23. Shi, S.G.; Cao, J.C.; Feng, L.; Liang, W.Y.; Zhang, L.Q. Construction of a technique plan repository and evaluation system based on ahp group decision-making for emergency treatment and disposal in chemical pollution accidents. J. Hazard. Mater. 2014, 276, 200–206. [Google Scholar] [CrossRef] [PubMed]
  24. Chainey, S.; Tompson, L.; Uhlig, S. The utility of hotspot mappering for predicting spatial patterns of crime. Secur. J. 2008, 21, 4–28. [Google Scholar] [CrossRef]
  25. Berestycki, H.; Wei, J.; Winter, M. Existence of symmetric and asymmetric spikes for a crime hotspot model. Siam J. Math. Anal. 2013, 46, 691–719. [Google Scholar] [CrossRef]
  26. Xu, C.; Liu, L.; Zhou, S.H.; Ye, X.Y.; Jiang, C. The spatio-temporal patterns of street robbery in DP peninsula. Acta Geogr. 2013, 68, 1714–1723. (In Chinese) [Google Scholar]
  27. Gerber, M.S. Predicting crime using twitter and kernel density estimation. Decis. Support Syst. 2014, 61, 115–125. [Google Scholar] [CrossRef]
  28. Wang, G.G.; Wang, M.L.; Wang, J.M.; Yang, C. Spatio-temporal characteristics of rural economic development in Eastern Coastal China. Sustainability 2015, 7, 1542–1557. [Google Scholar] [CrossRef]
  29. Peeters, A.; Zude, M.; Käthner, J.; Ünlü, M.; Kanber, R.; Hetzroni, A. Getis-ord’s hot- and cold-spot statistics as a basis for multivariate spatial clustering of orchard tree data. Comput. Electron. Agric. 2015, 111, 140–150. [Google Scholar] [CrossRef]
  30. Nie, K.; Wang, Z.S.; Du, Q.Y.; Ren, F.; Tian, Q. A network-constrained integrated method for detecting spatial cluster and risk location of traffic crash: A case study from Wuhan, China. Sustainability 2015, 7, 2662–2677. [Google Scholar] [CrossRef]
  31. National Bureau of Statistics of China. China Environmental Statistical Yearbook; China Statistics Press: Beijing, China, 2013.
  32. Getis, A.; Ord, J.K. The analysis of spatial association by use of distance statistics. Geogr. Anal. 1992, 24, 189–206. [Google Scholar] [CrossRef]
  33. Getis, A.; Ord, J.K. Local spatial statistics: An overview. In Spatial Analysis: Modeling in GIS Environment; Longley, P., Batty, M., Eds.; John Wiley & Sons Inc.: New York, NY, USA, 1996; pp. 261–278. [Google Scholar]
  34. Mitchell, A. Spatial Measurements & Statistics. In The ESRI Guide to GIS Analysis; ESRI Press: Redlands, CA, USA, 2005; Volume 2. [Google Scholar]
  35. Che, Q.J.; Duan, X.J.; Guo, Y.; Wang, L.; Cao, Y.H. Uraban Spatial Expansion Process, Pattern and Mechanism in Yangtze River Delta. Acta Geogr. Sin. 2011, 64, 446–465. (In Chinese) [Google Scholar]
  36. Ord, J.K.; Getis, A. Local spatial autocorrelation statistics: Distributional issues and an application. Geogr. Anal. 1995, 27, 286–306. [Google Scholar] [CrossRef]
  37. Li, M.N.; Zhang, L.L. Haze in China: Current and feature challenges. Environ. Pollut. 2014, 189, 85–86. [Google Scholar] [CrossRef] [PubMed]
  38. Wang, X.F.; Chen, J.M.; Sun, J.F.; Li, W.J.; Yang, L.X.; Wen, L. Severe haze episodes and seriously polluted fog water in Ji’nan, China. Sci. Total Environ. 2014, 493, 133–137. [Google Scholar] [CrossRef] [PubMed]
  39. Cheng, M.C.; You, C.F.; Cao, J.J.; Jin, Z.D. Spatial and seasonal variability of water-soluble ions in PM2.5 aerosols in 14 major cities in China. Atmos. Environ. 2011, 186, 1489–1494. [Google Scholar] [CrossRef]
  40. Zhang, D.; Aunan, K.; Seip, H.M.; Larssen, T.; Vennemo, H.; Larssen, S.; Feng, L.L.; Wu, C.C. Air pollution reduction during China’s 11th five-year plan period—Local implementation and achievements in Shanxi province. Environ. Dev. 2012, 4, 36–53. [Google Scholar] [CrossRef]
  41. Meng, X.; Wang, C.C.; Cao, D.C.; Wong, C.M.; Kan, H.D. Short-term effect of ambient air pollution on COPD mortality in four Chinese cities. Atmos. Environ. 2013, 77, 149–154. [Google Scholar] [CrossRef]
  42. Cai, J.; Zhao, A.; Zhao, J.; Chen, R.; Wang, W.; Ha, S. Acute effects of air pollution on asthma hospitalization in Shanghai, China. Environ. Pollut. 2014, 191, 139–144. [Google Scholar] [CrossRef] [PubMed]
  43. Wei, J.C.; Guo, X.M.; Marinova, D.; Fan, J. Industrial SO2 pollution and agricultural losses in China: Evidence from heavy air polluters. J. Clean. Prod. 2014, 64, 404–413. [Google Scholar] [CrossRef]
  44. Duan, W.L.; Chen, G.H.; Ye, Q.; Chen, Q.G. The situation of hazardous chemical accidents in China between 2000 and 2006. J. Hazard. Mater. 2011, 186, 1489–1494. [Google Scholar] [CrossRef] [PubMed]
  45. Jenks, G.F. The data model concept in statistical mapping. Int. Yearb. Cartogr. 1967, 7, 186–190. [Google Scholar]
  46. Wang, J.; Zhang, X.L.; Du, H.R. Spatial pattern evolvement and characteristics of the economy in Xinjiang at the county level. Prog. Geogr. 2011, 30, 470–478. (In Chinese) [Google Scholar]
  47. Yang, L.W. Pollution westward: New problem of China Western Development. Ecol. Econ. 2007, 5, 14–17. (In Chinese) [Google Scholar]
  48. Jin, X.R.; Tan, L.L. Differences in environmental policies and transfer of regional industry: A perspective of new economic geography (NEG). J. Zhejiang Univ. Hum. Soc. Sci. 2012, 42, 51–60. (In Chinese) [Google Scholar]
  49. Zhang, L.; Chen, W.; Chen, X.; Xue, J.F. Space-time Analysis on delinkage between environmental pollution and economic growth in Yangtze River Delta. China Popul. Resour. Environ. 2011, 21, 275–279. (In Chinese) [Google Scholar]
  50. Yang, J.; Huang, L.; Li, F.Y.; Zou, L.P.; Fei, H.X.; Bi, J. Decomposition analysis on the variation of China’s annual environmental pollution accidents, 1991–2010. China Environ. Sci. 2013, 33, 931–937. (In Chinese) [Google Scholar]
  51. Liu, C.X.; Joyce, L. An empirical analysis of upgrading status of Zhejiang traditional industry clusters from the perspective of global value chain. J. Appl. Sci. 2013, 13, 1597–1601. [Google Scholar] [CrossRef]
  52. Su, S.L.; Li, D.; Zhang, Q.; Xiao, R.; Huang, F.; Wu, J.P. Temporal trend and source apportionment of water pollution in different functional zones of Qiantang River, China. Water Res. 2011, 45, 1781–1795. [Google Scholar] [CrossRef] [PubMed]
  53. Wang, X.F.; Miller, G.; Ding, G.Q.; Lou, X.M.; Cai, D.L.; Chen, Z.J.; Meng, J.; Tang, J.; Chu, C.; Mo, Z.; et al. Health risk assessment of lead for children in tinfoil manufacturing and e-waste recycling areas of Zhejiang Province, China. Sci. Total Environ. 2012, 426, 106–112. [Google Scholar] [CrossRef] [PubMed]
  54. Xue, P.L.; Zeng, W.H. Shanghai environmental accidents risk regionalization. China Environ. Sci. 2011, 31, 1743–1750. (In Chinese) [Google Scholar]
  55. Yang, Y.; Ma, J.W.; Liu, R.Z. Incidents and its causative factors in Shanghai. China Popul. Resour. Environ. 2012, 22, 105–109. (In Chinese) [Google Scholar]
  56. Hu, Y.; Feng, Y.Y.; Huang, C.C.; Xiao, L.H. Occurrence, source, and human infection potential of cryptosporidium and Enterocytozoon bieneusi in drinking source water in Shanghai, China, during a pig carcass disposal incident. Environ. Sci. Technol. 2014, 48, 14219–14227. [Google Scholar] [CrossRef] [PubMed]
  57. Li, M.S.; Luo, Y.P.; Su, Z.Y. Heavy metal concentrations in soils and plant accumulation in a restored manganese mineland in Guangxi, South China. Environ. Pollut. 2007, 147, 168–175. [Google Scholar] [CrossRef] [PubMed]
  58. Ma, X.; Li, F.; Zhang, M.; Zheng, F.Z.; Du, S. Assessment and analysis of non-point source nitrogen and phosphorus loads in the Three Gorges Reservoir Area of Hubei Province, China. Sci. Total Environ. 2011, 412–413, 154–161. [Google Scholar] [CrossRef] [PubMed]
  59. Wei, C.Y.; Wang, C.; Yang, L.S. Characterizing spatial distribution and sources of heavy metals in the soils from mining-smelting activities in Shuikoushan, Hunan Province, China. J. Environ. Sci. China 2009, 21, 1230–1236. [Google Scholar] [CrossRef]
  60. Peng, J.F.; Song, Y.H.; Yuan, P.; Xiao, S.H.; Han, L. An novel identification method of the environmental risk sources for surface water pollution accidents in chemical industrial parks. J. Environ. Sci. China 2013, 25, 1441–1449. [Google Scholar] [CrossRef]

