Article

Identification of 4CL Genes in Desert Poplars and Their Changes in Expression in Response to Salt Stress

State Key Laboratory of Grassland Agro-Ecosystem, School of Life Sciences, Lanzhou University, No.222, Tianshui Southern Road, Lanzhou 730000, China
*
Author to whom correspondence should be addressed.
These authors contributed equally to this work.
Genes 2015, 6(3), 901-917; https://doi.org/10.3390/genes6030901
Submission received: 23 July 2015 / Revised: 31 August 2015 / Accepted: 7 September 2015 / Published: 18 September 2015
(This article belongs to the Section Population and Evolutionary Genetics and Genomics)

Abstract

:
4-Coumarate:CoA ligase (4CL) genes are critical for the biosynthesis of plant phenylpropanoids. Here we identified 20 4CL genes in the genomes of two desert poplars (Populus euphratica and P. pruinosa) and salt-sensitive congener (P. trichocarpa), but 12 in Salix suchowensis (Salix willow). Phylogenetic analyses clustered all Salicaceae 4CL genes into two clades, and one of them (corresponding to the 4CL-like clade from Arabidopsis) showed signals of adaptive evolution, with more genes retained in Populus than Salix and Arabidopsis. We also found that 4CL12 (in 4CL-like clade) showed positive selection along the two desert poplar lineages. Transcriptional profiling analyses indicated that the expression of 4CL2, 4CL11, and 4CL12 changed significantly in one or both desert poplars in response to salt stress compared to that of in P. trichocarpa. Our results suggest that the evolution of the 4CL genes may have contributed to the development of salt tolerance in the two desert poplars.

1. Introduction

The enzyme 4-coumarate:CoA ligase (4CL; EC 6.2.1.12) plays an important role in phenylpropanoid metabolism by catalyzing the formation of CoA ester [1,2]. 4CL regulates a specific branched pathway that contributes to flavonoid and lignin synthesis [3]. Both of these products control various physiological functions in plants and improve plant adaptations to environmental stress [4]. 4CL proteins belong to the AMP-binding protein family, containing one defining structural characteristic: two conserved domains within the AMP-binding domain [5]. One domain (Box I) consists of a serine/threonine/glycine (STG)-rich region followed by a proline/lysine/glycine (PKG) triplet [6], which is an important criterion in establishing an adenylate-forming superfamily [7]. Another domain includes a GEICIRG motif (Box II), whose central cysteine residue can be involved directly in catalysis [8].
Since the first 4CL gene was cloned and identified in 1981 [9], a series of 4CL and 4CL-like genes have been found and investigated in many plant species, such as rice [10], soybean [11], loblolly pine [12], Arabidopsis [13,14], tobacco [15,16], aspen [2,17], and hybrid poplar [18]. 4CL is encoded by a multi-gene family in higher plants, and the number of gene members varies according to plant species. Based on phylogenetic analyses, 4CL genes are divided into two classes, Class I and Class II [14,19]. The structure of Class I proteins is conserved across all plants, while that of Class II varies even within the same species [14]. In the Arabidopsis genome, four 4CL genes and nine 4CL-like genes have been detected; three 4CL genes (4CL1, 4CL2 and 4CL4) belong to Class I and one (4CL3) belongs to Class II, while the remaining nine genes are classified as 4CL-likes [20], which were predicted to encode proteins nearly 50% identical over their full length to 4CLs and contain several same conserved motifs as 4CLs [19]. All of them are here treated as members of the same gene family. It has been suggested that the 4CL genes in Class II are closely associated with flavonoid biosynthesis, while those in Class I are involved in the biosynthesis of lignin and other phenylpropanoids [14,19]. Even though their precise roles remain unknown, the 4CL-like genes may be associated with other functions [19,20].
There is evidence that salt stress causes increased lignification of the cell wall in plants [21]. It has, therefore, been hypothesized that the functions of the 4CL genes are closely linked to the environmental stresses that plants encounter [8,22,23]. Two poplar species (P. euphratica and P. pruinosa) that occur in desert regions have adapted to the high saline underground water and drought environment; both of these species play key roles in maintaining local arid ecosystems [24,25,26,27]. The wood of the two species is much harder than in other poplars [28], and they may have accumulated more lignin in the xylem for both structural support and water transport in response to their extremely arid environments. However, there has been limited research on this phenomenon. In this study, we carried out evolutionary analyses of the 4CL genes of these two desert poplars and one salt-sensitive poplar (P. trichocarpa). We also looked for any change in expression of the 4CL genes in this family in response to salt stress using calluses developed from three species. Our results provide important insights into the evolutionary roles of this gene family during the environmental adaptation of desert poplars.

2. Materials and Methods

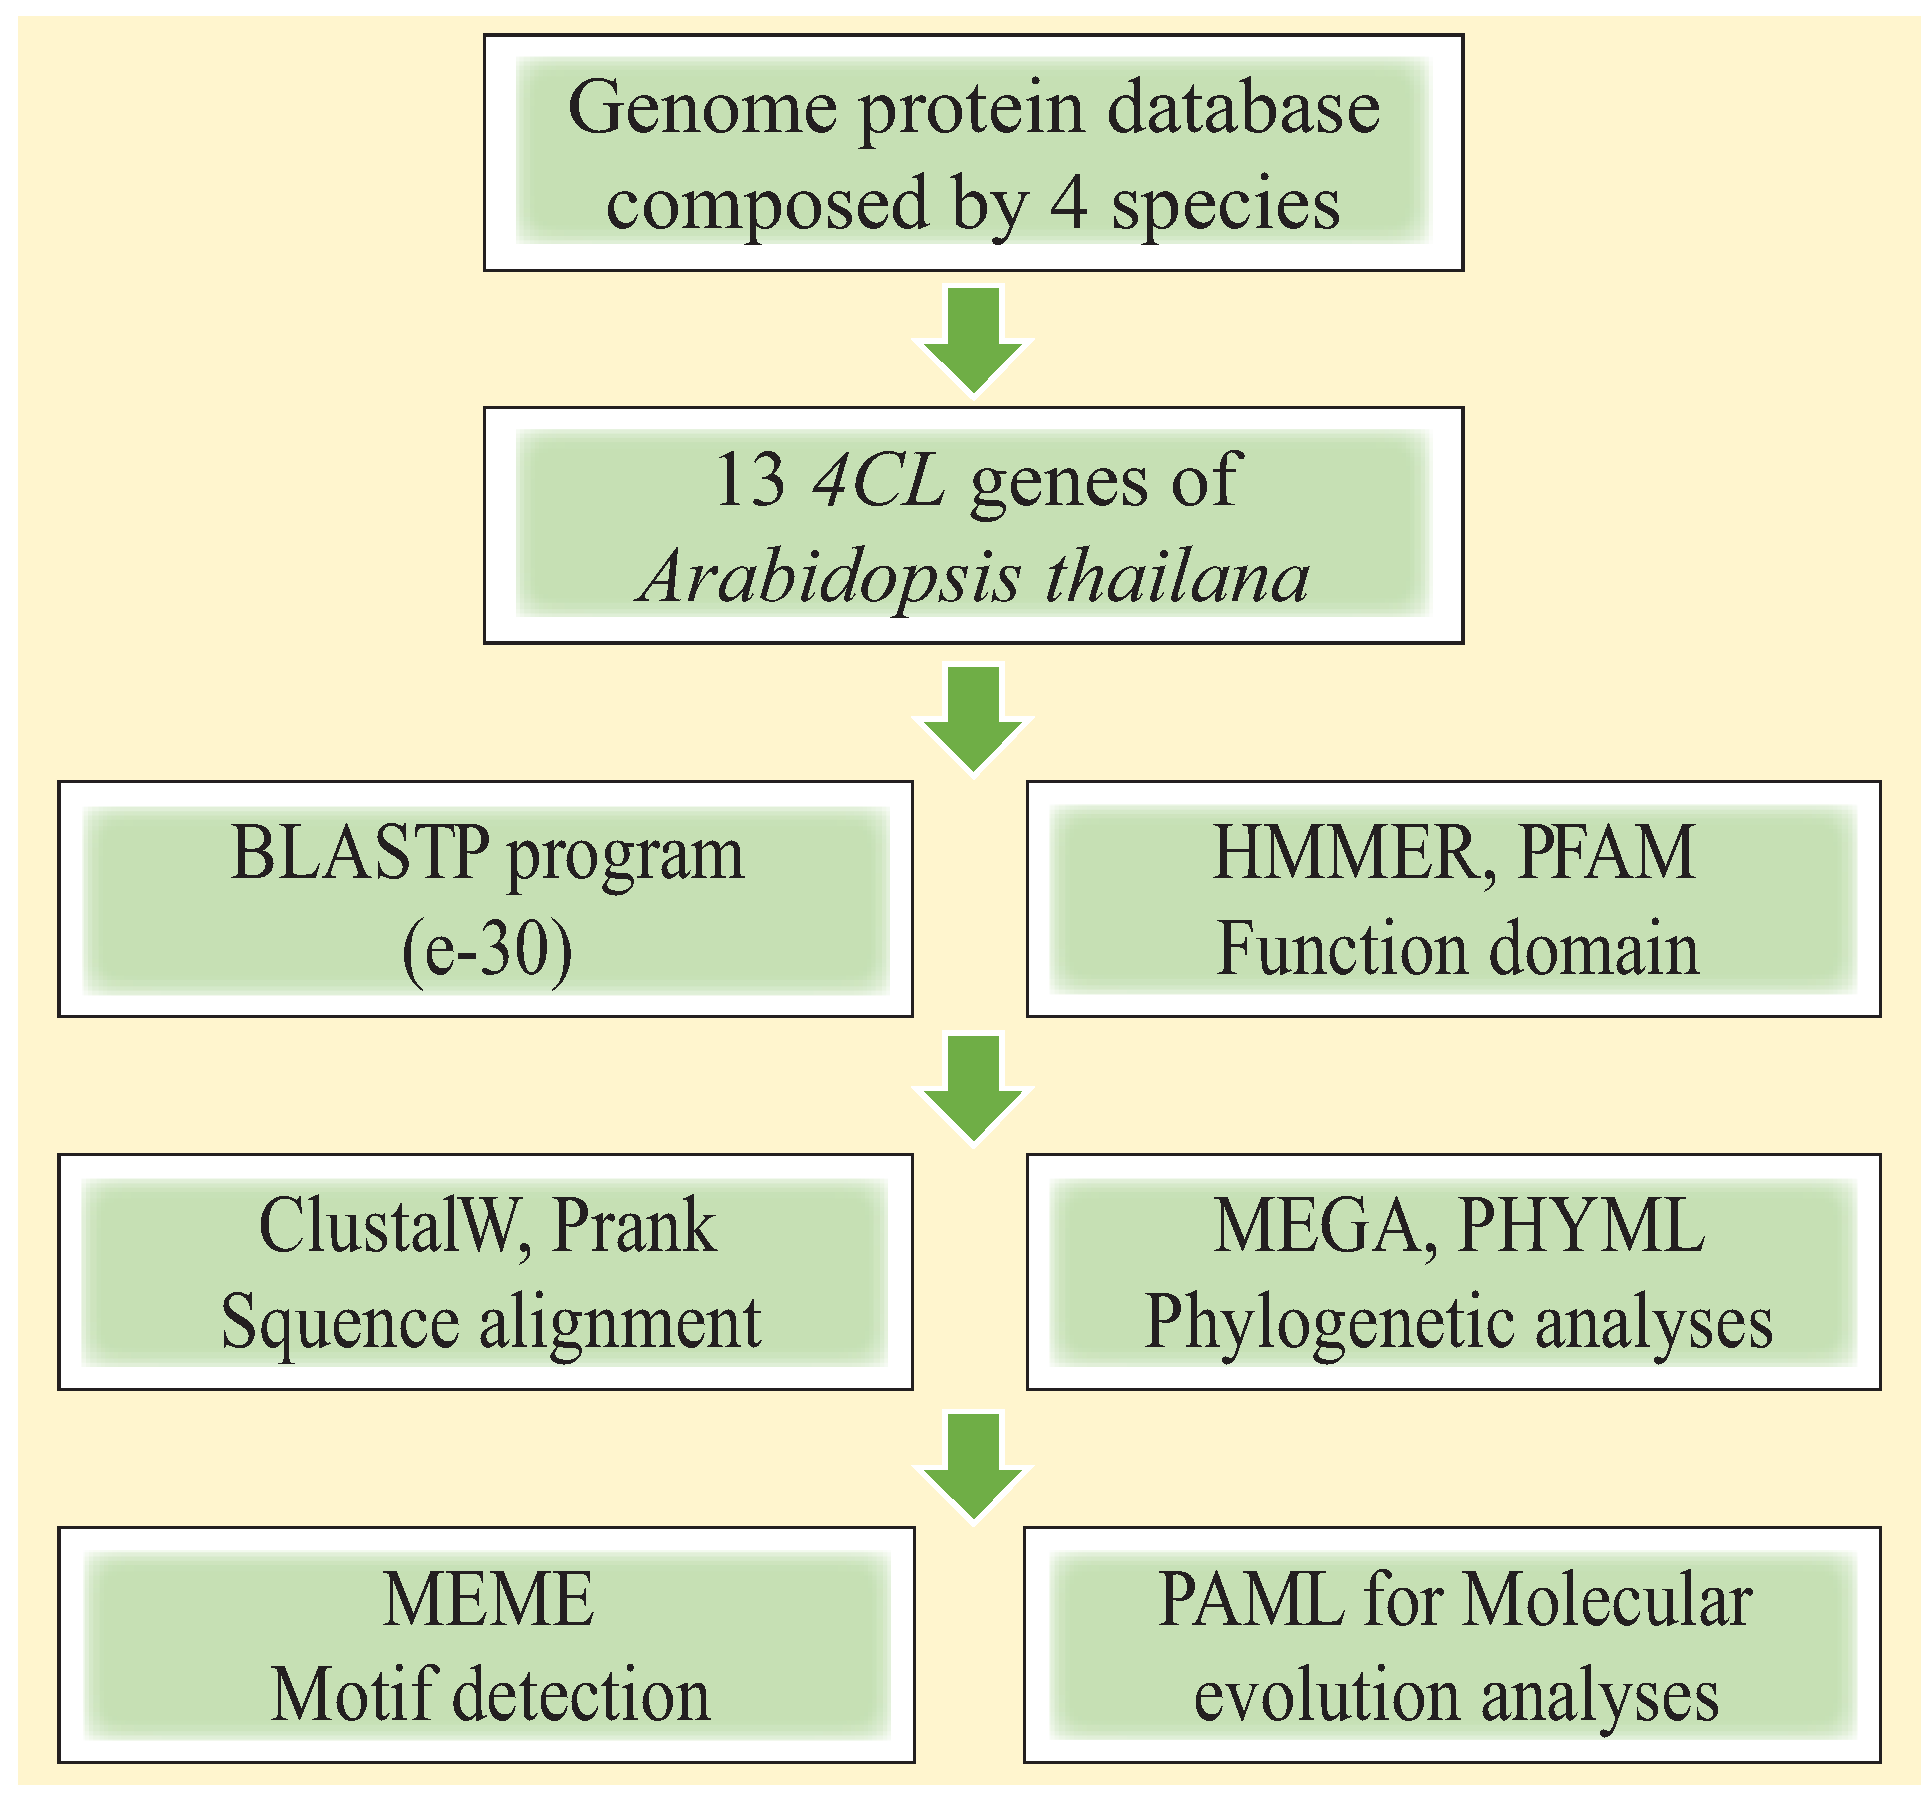
2.1. Gene Sequence Collection and Identification of 4CL Genes

4CL genes were identified in the protein databases of P. euphratica [29], P. trichocarpa [30] (JGI v9.0) [31], P. pruinosa [32] and Salix suchowensis [33] using the reciprocal BLAST technique with protein sequences from the 13 4CL genes of Arabidopsis thaliana, retrieved from Cell Wall Genomics [34]. Poplar gene models homologous with the 13 Arabidopsis genes were sought based on these protein sequences using the program BLASTP with an e-value cut-off of 1-E30. The protein sequences resulting from positive poplar gene model hits then completed the BLAST search against all the proteins in the Arabidopsis genome from the TAIR 9.0 website [35]. Proteins that had one of the 13 Arabidopsis genes as a top-three hit were identified as candidate 4CL proteins. We then applied the HMMER program [36] to identify 4CL sequences in the poplar genomes using the AMP-binding domain sequence as a query, which was acquired using the Hidden Markov Models (HMM) profile [36] for the AMP-binding domain (PF00501.21) from the Protein Families database (PFAM) database [37]. These sequences were further verified using a PFAM batch search with default settings. Sequences that were confirmed by both methods were used for further analyses. The 4CL genes used in this study were re-named based on the names of Arabidopsis genes in previous studies [20] and the phylogenetic analyses in this study. Information regarding all 4CL genes from the five species used is given in Table S1.

2.2. Phylogenetic Analysis

Full-length amino acid sequences from A. thaliana, P. euphratica, P. trichocarpa, P. pruinosa, and S. suchowensis were aligned using CLUSTALW2 [38]. An un-rooted neighbor-joining (NJ) [39] tree was constructed using MUSCLE [40] and the Molecular Evolutionary Genetics Analysis version 6.0. (MEGA 6) package [41]. The tree nodes were evaluated by bootstrap analysis with 100 replicates. Branches with bootstrap values less than 50% were collapsed. In addition, gene structures were obtained by comparing coding regions and genomic sequences, and displayed using Scalable Vector Graphics (SVG) [42]. The putative 4CL protein sequences used for the phylogenetic analysis were detected using Multiple Expectation Maximization for Motif Elicitation (MEME v4.10.1) [43] and applied to analyze possible conserved motifs; default parameters were used, except for the maximum number of identified motifs, which was defined as 20. The motifs were numbered according to their order displayed in MEME. The detected motifs were annotated using Simple Modular Architecture Research Tool (SMART) protein analyzing software [44,45].

2.3. Molecular Evolution Analysis

To evaluate variation in selective pressure in the two major clades that we identified, branch-specific models of CODEML in Phylogenetic Analysis by Maximum Likelihood (PAML v4.6) [46] were used to estimate the ratio of non-synonymous vs. synonymous substitutions (ω) under two a priori assumptions: a one-ratio model, in which one ω value was assumed for the entire tree, and a two-ratio model, in which ω values were allowed to vary between the two major clades.
Identification of orthologous proteins between the five species was performed using the INPARANOID [47] and MULTIPARANOID programs [48]. Phylogenetic relationships among the orthologous groups were reconstructed using the MEGA 6 package. To evaluate variation in selective pressure across each orthologous group, the branch models of CODEML and PAML were used to estimate ω under different assumptions, by selecting P. euphratica or P. pruinosa as the foreground. For some orthologous groups, the branch-model tests indicated that selective pressures differed significantly between the two clades. Thus, we used branch-site models to test whether positive selection had occurred at some amino acid sites in the clade comprising P. euphratica and P. pruinosa. The Bayes Empirical Bayes method [49] was then applied to identify positively selected candidate sites. To examine which of the models fit the data best, Likelihood Ratio Tests (LRTs) were performed by comparing the difference in log likelihood values between pairs of models using a χ2 distribution, with the degrees of freedom equal to the difference in numbers of parameters between the models [50]. The flowchart for the 4CL gene family analysis is summarized in Figure 1.
Figure 1. Schema of the experiment.
Genes 06 00901 g001

2.4. Expression of 4CL Genes in Salt Stress and Control Conditions

The expression analysis of poplar 4CL genes was performed based on the RNA-Seq data from P. trichocarpa [51], P. euphratica [29], and P. pruinosa [52]. The calluses were firstly induced from shoots for each species using the methods described previously [53,54]. Then the total RNAs were isolated from the control and salt-stressed calluses (200 mM NaCl for 6, 12, 24, and 48 h) using a CTAB procedure [55]. The quality and integrity of the RNA samples were examined using the Agilent 2100 Bioanalyzer and their RIN (RNA Integrity Number) values ranged from 8.6 to 10.0, with no sign of degradation. Three biological replicates were conducted and equal quantities of total RNA were pooled for cDNA libraries construction. Poly(A) mRNA was isolated using beads with oligo (dT) before the mRNA was fragmented and cDNA synthesis performed using random hexamer-primers and reverse transcriptase (Invitrogen, Carlsbad, CA, USA). After end repair, adapter ligation and PCR amplification, the libraries were sequenced using an Illumina Genome Analyzer platform.
The cleaned reads from each of the three poplar species were mapped onto its own reference sequences using Bowtie2 (version 2.1.0, University of Maryland, College Park, MD, USA) [56] software with default parameters. The sensitivity of RNA-Seq will be a function of both molar concentration and transcript length. By normalizing for RNA length and for the total read number in the measurement, the RPKM measure of read density reflects the molar concentration of a transcript in the starting sample [57]. Therefore, gene expression levels were measured as the number of reads per kilobase per million mapped reads (RPKM) on exon regions within a given gene [57] and to reduce effects of background transcription, we selected only genes that had RPKM ≥1 in sample from two or more time points for further analysis. To identify differentially-expressed genes (DEGs) in control callus and salt-stressed callus from P. trichocarpa, P. euphratica and P. pruinosa, the edgeR [58] was used to estimate the means and variances of raw read counts under a negative binomial distribution and used exact tests to identify differentially-expressed transcripts. After the p-value for each expressed genes were obtained by edgeR, we used the false discovery rate (FDR) to justify the p-value by the function p.adjust in R. If log2 (FPKMsalt/FPKMcontrol) > 1 or < −1, and the adjusted p-value (FDR) was <0.05, the genes were identified differentially expressed genes (DEGs) [59].

3. Results and Discussion

3.1. Identification of the 4CL Genes from Four Species of Salicaceae

The initial step in identifying the gene family members was to find candidate genes with a similarity search [60]. We used the BLASTP program to search a database of annotated protein sequences from the three poplar species and one willow species, resulting in 168, 528 protein sequences in total. We identified 20, 20, 20 and 12 4CL genes from P. trichocarpa, P. euphratica, P. pruinosa, and S. suchowensis genomes, respectively (Table 1 and Table S1). All three poplars had the same number of 4CL genes, which was more than that of the single willow species. Both Salix and Populus species have experienced a common genome duplication. However, the increased number of genes within one genus compared with another in the same family could be the result of two possibilities: Populus may have retained more gene copies than Salix following genome duplication, or the copies may be derived from expansions through Populus-specific segmental and tandem duplications [30].

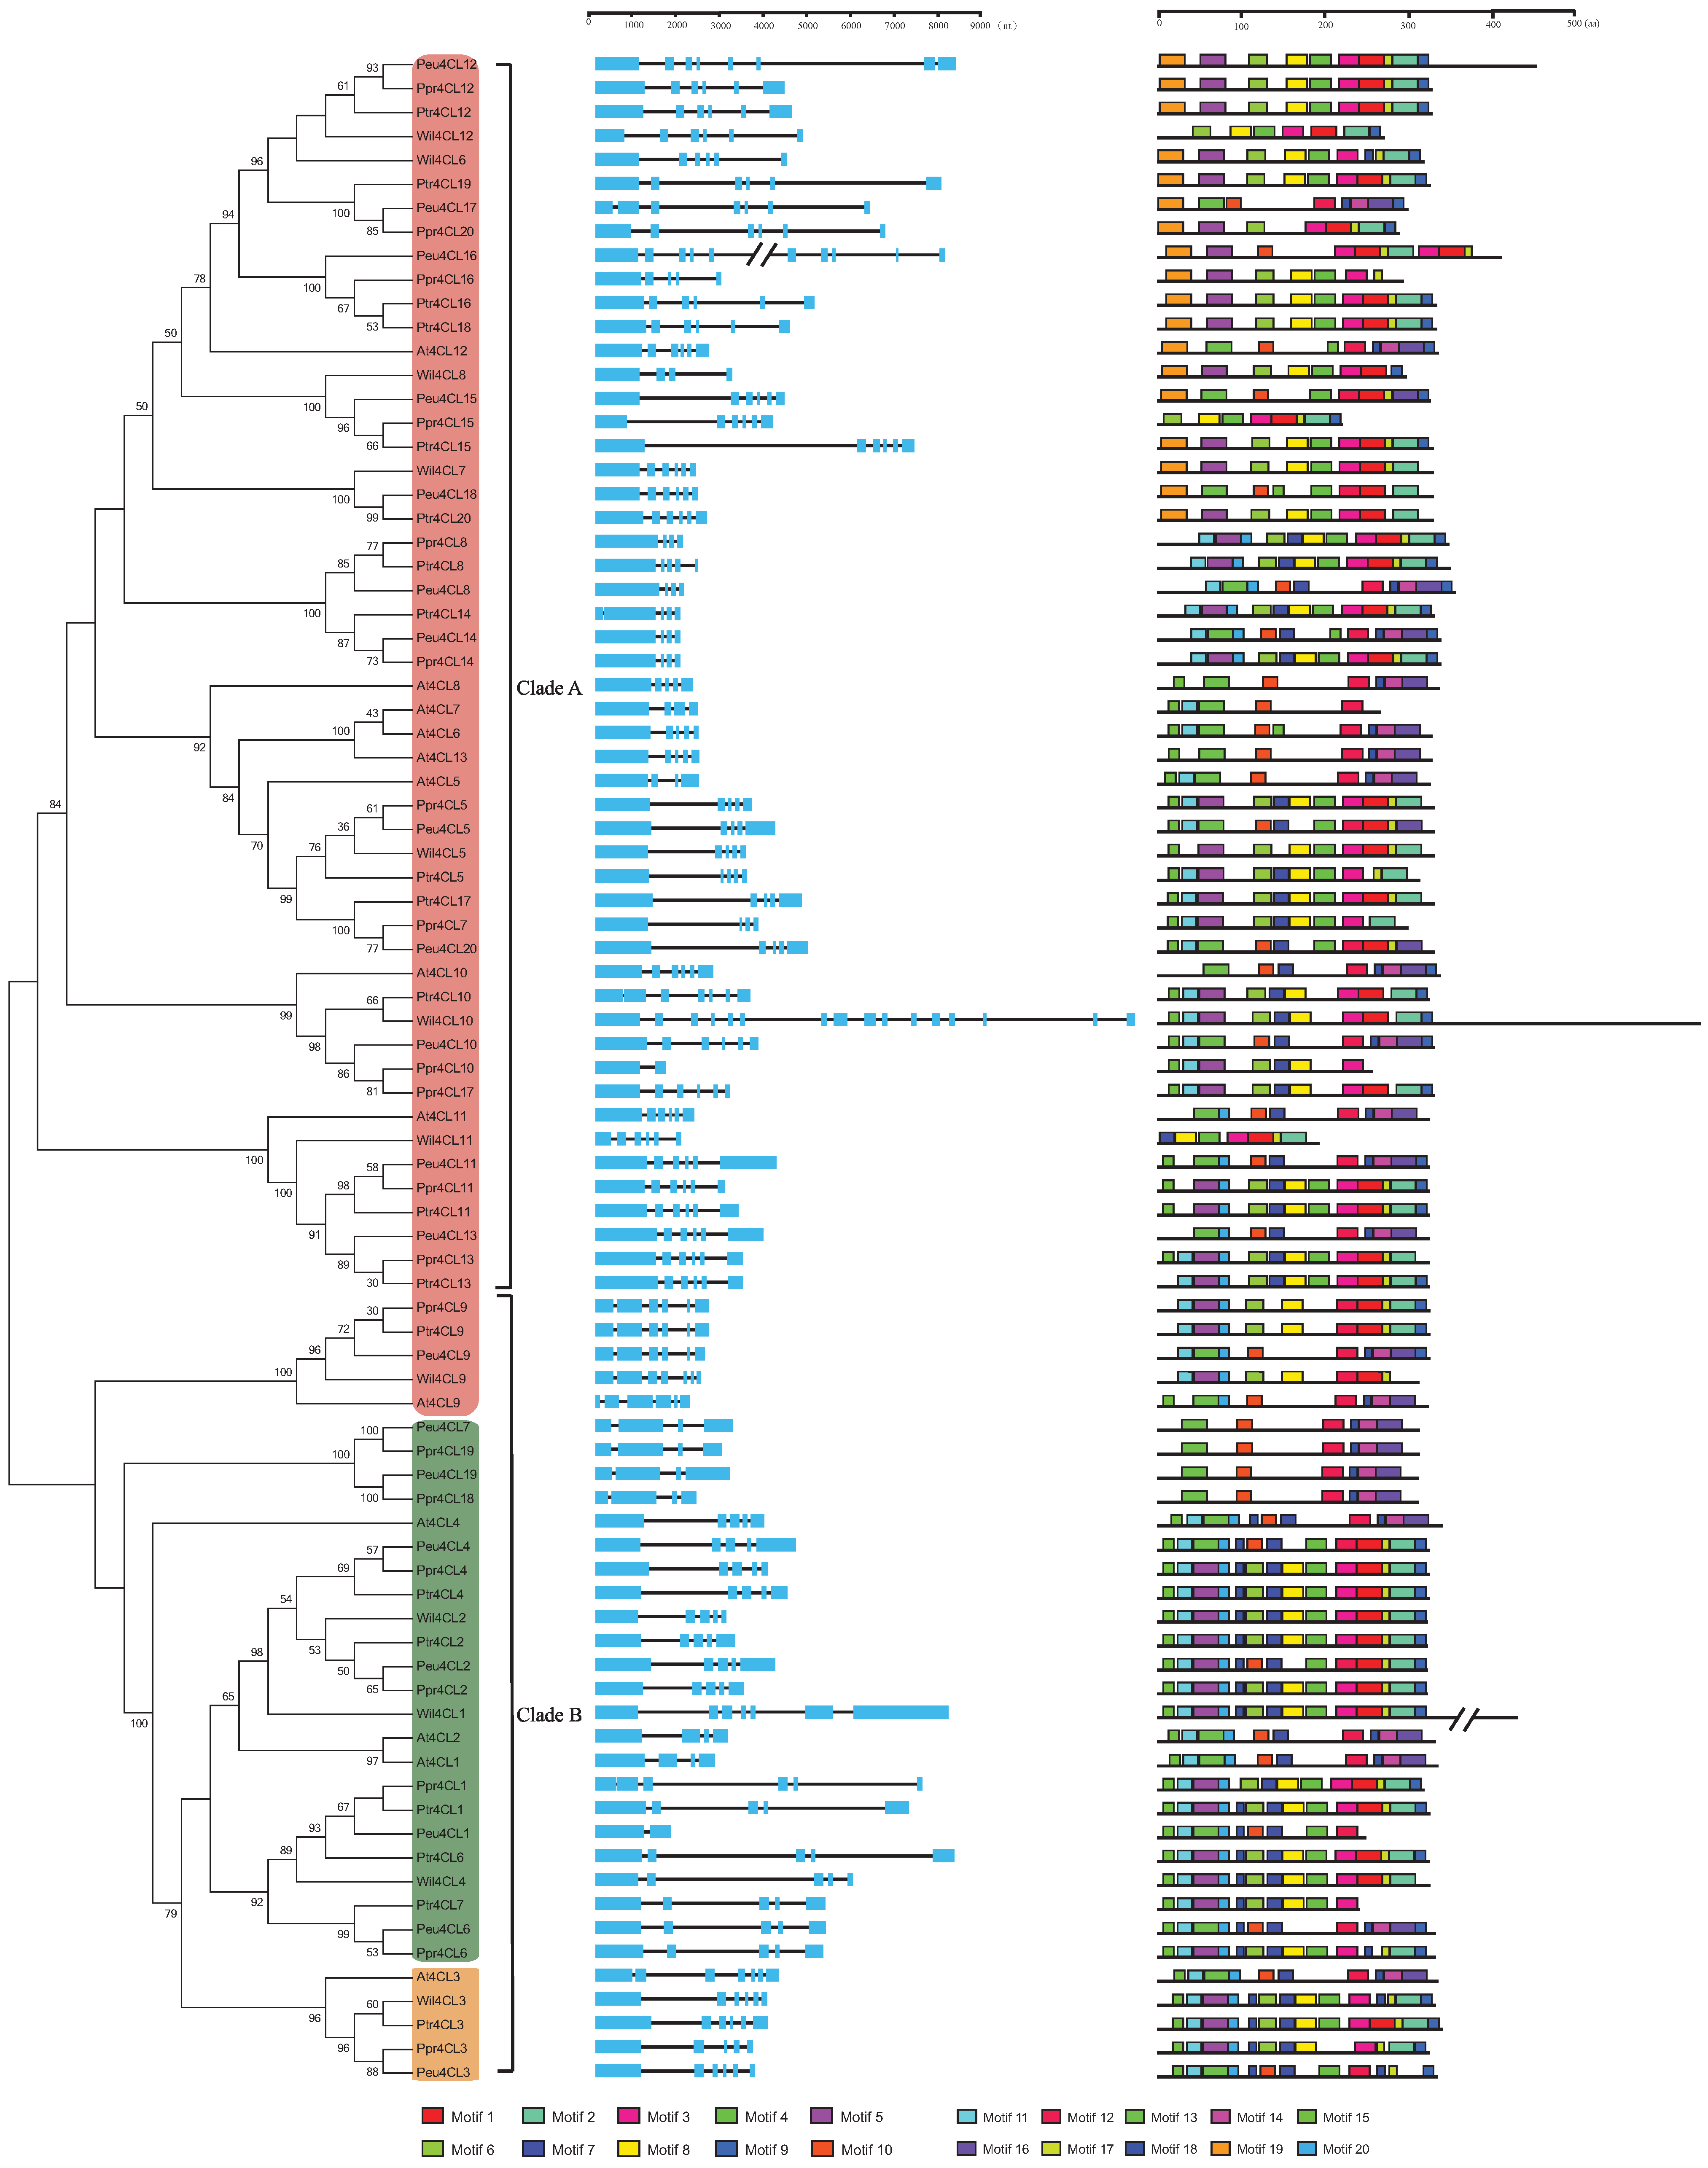
3.2. Gene Structure and Motif Identification of 4CL Genes in Poplars

To understand better the diversity of 4CL genes in the Salicaceae, intron/exon arrangements and conserved motifs were compared using their phylogenetic relationships (Figure 2). As shown in Figure 2, closely related genes were generally more similar, structurally, differing only in intron and exon lengths. Some close gene pairs did have distinct intron/exon arrangements. For example, Peu4CL16 had 10 exons, whereas its close orthologs Ptr4CL16 and Ppr4CL16 had only six and five, respectively, even though their phylogenetic relationship was supported by a high bootstrap value. However, overall, our results show that the 4CL genes in poplars have relatively conservative exon/intron structures.
Figure 2. Phylogenetic relationships, gene structure and motif structure of 4CL genes in the five considered species. An un-rooted NJ tree was constructed from the alignment of full-length amino acid sequences of Arabidopsis thaliana (At), P. trichocarpa (Ptr), P. pruinosa (Ppr), P. euphratica (Peu), and Salix suchowensis (Wil) using the MEGA 6 package. Branches with less than 50% bootstrap values were collapsed. The tree divided into two clades: designated Clades A and B. The different color backgrounds represent three kinds of 4CLs: 4CL-like (red), Class I (green), and Class II (orange). Lengths of exons and introns of each 4CL gene are displayed proportionally. The blue solid boxes represent exons; black lines represent introns. Motifs represented with boxes were predicted using MEME. The numbers and colors represent motifs 1–20. Box size indicates the length of the motif.
Genes 06 00901 g002
Table 1. Comparison of 4CL gene family sizes in the five considered species.
Organisms4CL groupsTotal 4CLs
Class IClass IIClass-4CL like
Arabidopsis thaliana31913
Populus trichocarpa511420
Populus pruinosa411520
Populus euphratica411520
Salix suchowensis31812
We then used the online program MEME v4.10.1 to analyze conserved motifs in 4CL proteins. A total of 20 conserved motifs were identified (Figure 2 and Table S2). Motif 6 and motif 10 were represented by the typical AMP-binging domain, which is rich in Gly, Ser, and Thr. The 4CLs belonging to the superfamily of adenylate-forming enzymes contained motif 6 or motif 10. Motif 3 and motif 12 were the second most conserved signature motif, with GEICIRG. Their central cysteine residue is thought to be directly involved in catalysis [5]. In addition to the conserved domains, several other conserved motifs were common in all 4CL genes, such as motifs 2, 4, and 13, indicating their importance. Then we subjected the motifs 2, 4, and 13 to SMART annotation. Motif 1 and Motif 4 were represented by the AMP-binding domain for AMP-dependent synthetase or ligase and Motif 13 was represented by the AMP-binding enzyme C-terminal domain.

3.3. Phylogenetic Analysis of 4CL Genes

In order to determine the evolutionary relationships between the poplar 4CL proteins and 4CL proteins known from other species, we performed multiple sequence alignment and generated a NJ phylogenetic tree for 4CL proteins from Arabidopsis, P. euphratica, P. pruinosa, P. trichocarpa, and S. suchowensis (Figure 2). For this study, we generated a new version of the phylogenetic reconstruction that incorporated the 4CL and 4CL-like amino acid sequence data from three poplars, one willow, and Arabidopsis. In total, all 72 confirmed 4CL genes from Salicaceae and 13 from Arabidopsis clustered into two clades, designated Clades A and B. Clade A included most of the 4CL-like genes identified from Arabidopsis (At4CL5-8, At4CL10-13), while Clade B contained four Arabidopsis 4CL genes (At4CL1, At4CL2, At4CL3, and At4CL4), and one 4CL-like gene (At4CL9). At4CL3 was ascribed to 4CL Class II [14] and our phylogenetic analyses identified only one orthologous copy for each poplar or willow with their common origin. However, for 4CL Class I [14], comprising At4CL1, At4CL2, and At4CL4, we recovered independent gene duplications for both Arabidopsis and Salicaceae. At4CL1 and At4CL2 clustered into one subclade and At4CL4 formed another separate subclade, while those from Salicaceae comprised two independent subclades. Numbers of 4CL Class I genes in the investigated species of Salicaceae ranged from three (S. suchowensis), through four (P. euphratica and P. pruinosa) to five (P. trichocarpa) (Table 1). For the 4CL-like gene located in Clade B, At4CL9, there was only one homologous gene in each Salicaceae species. Within Clade A, eight 4CL-like genes from Arabidopsis clustered, while varying numbers of copies were found in the Salicaceae species: 14 in P. euphratica and P. pruinosa, 13 in P. trichocarpa, and seven in S. suchowensis. Similarly, phylogenetic analyses indicated that most 4CL-like genes from Arabidopsis and Salicaceae had common orthologous origins, but some were derived from an independent lineage-specific genome or gene duplications. These findings suggest that some 4CL genes are evolutionarily dynamic while others have remained stable; the duplicated genes would have been lost after the common genome duplications. In total, across one salt-sensitive and two salt-tolerant poplars, we recovered six groups of 1:1:1 4CL orthologous genes. In addition, we found that independent duplication had occurred once for P. trichocarpa (Ptr4CL16 and Ptr4CL18) and once for P. pruinosa (Ppr4CL10 and Ppr4CL17), resulting in one more gene for each species in smaller subclades.

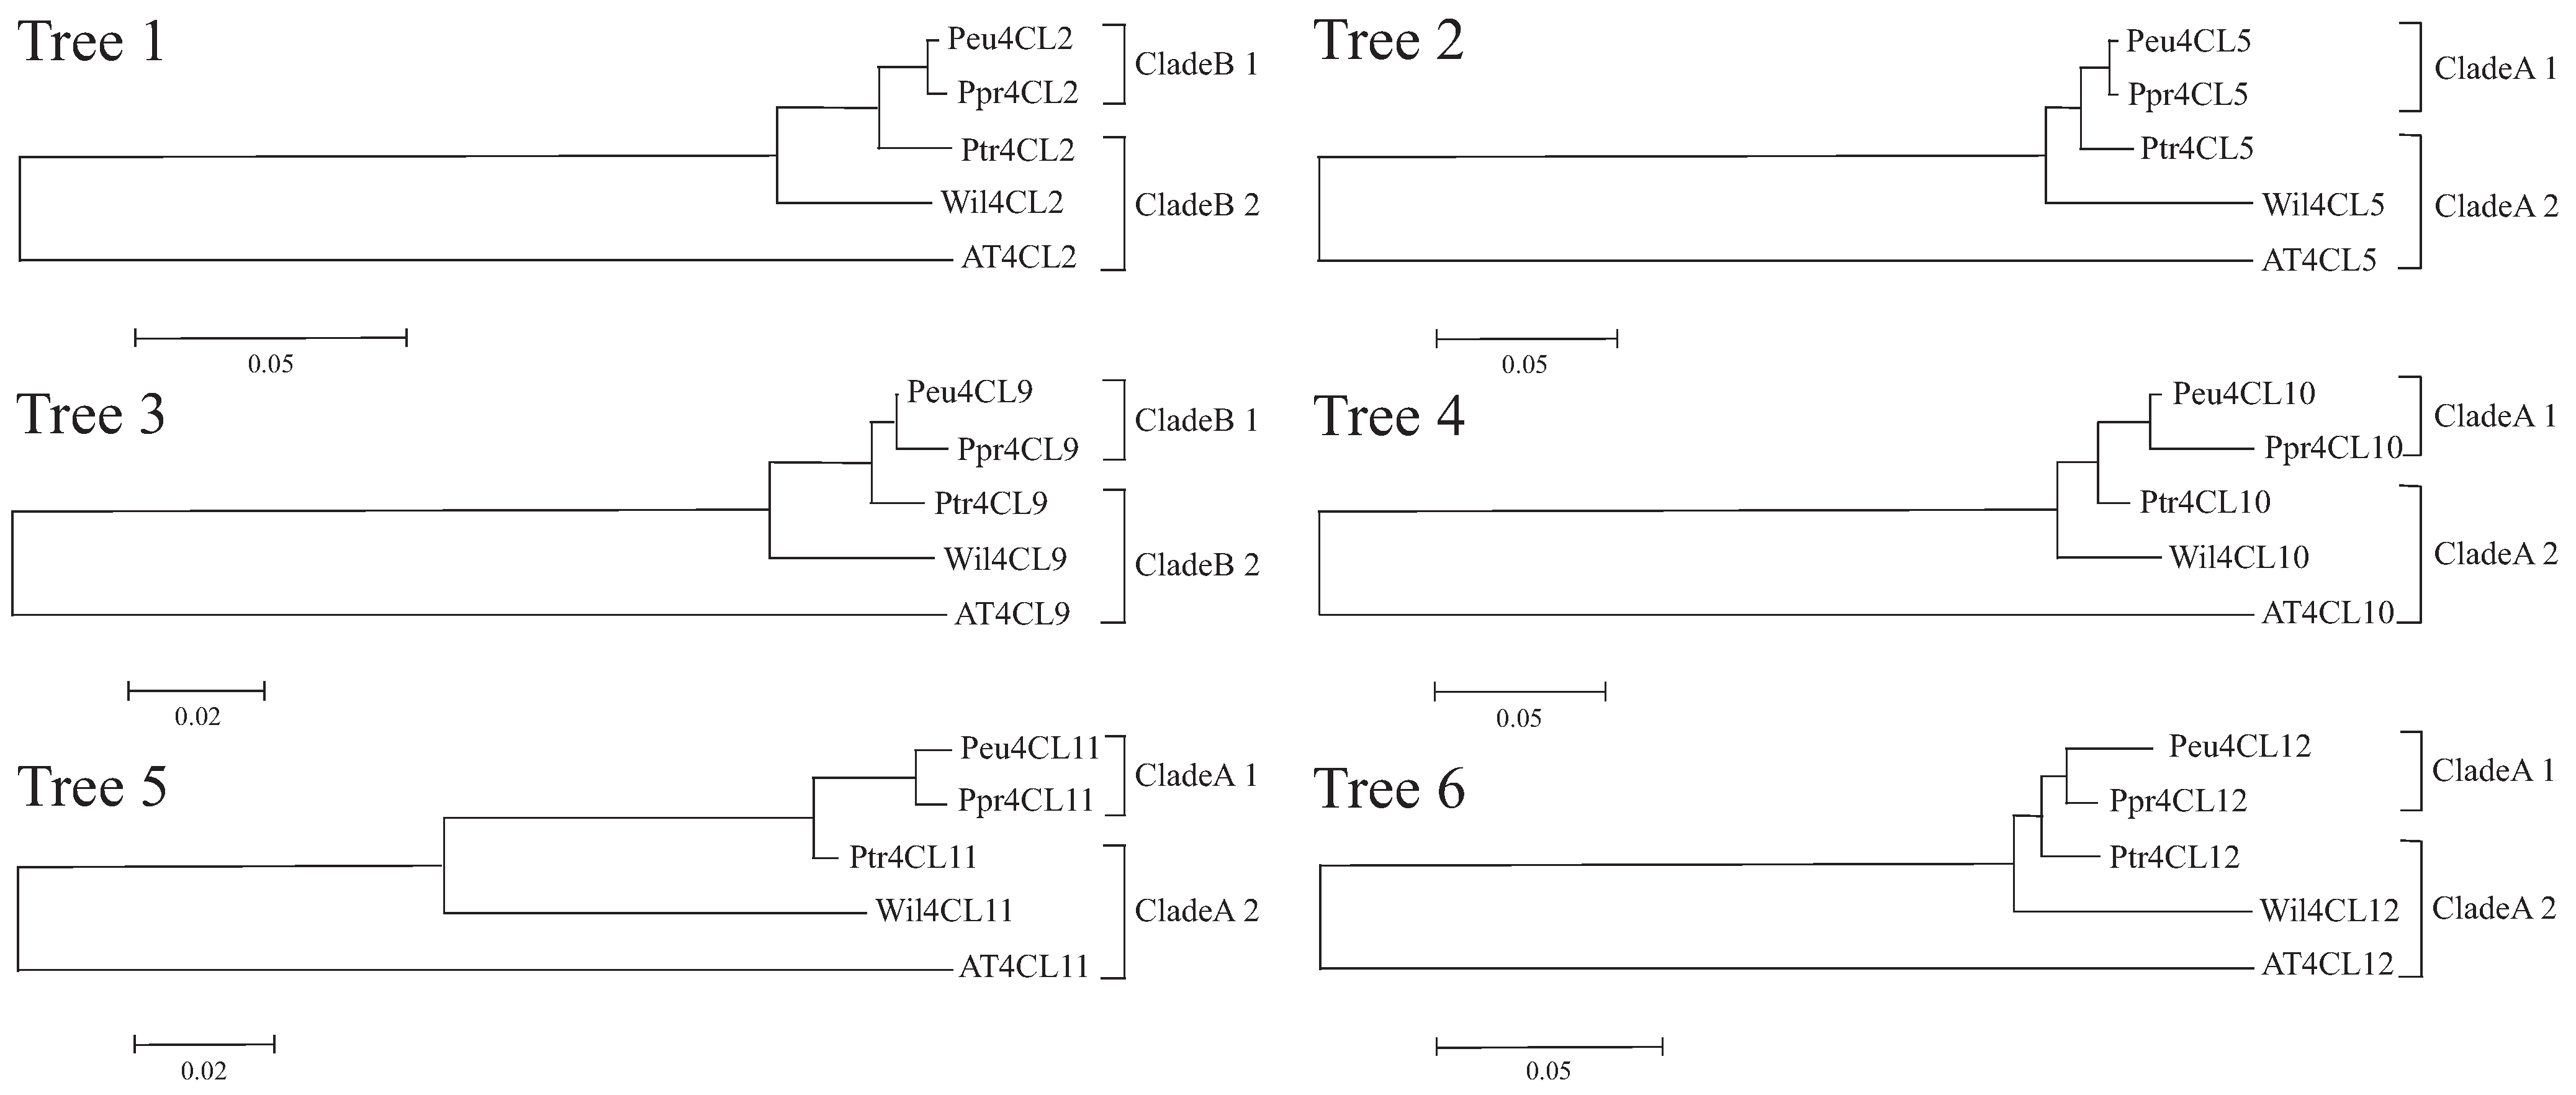
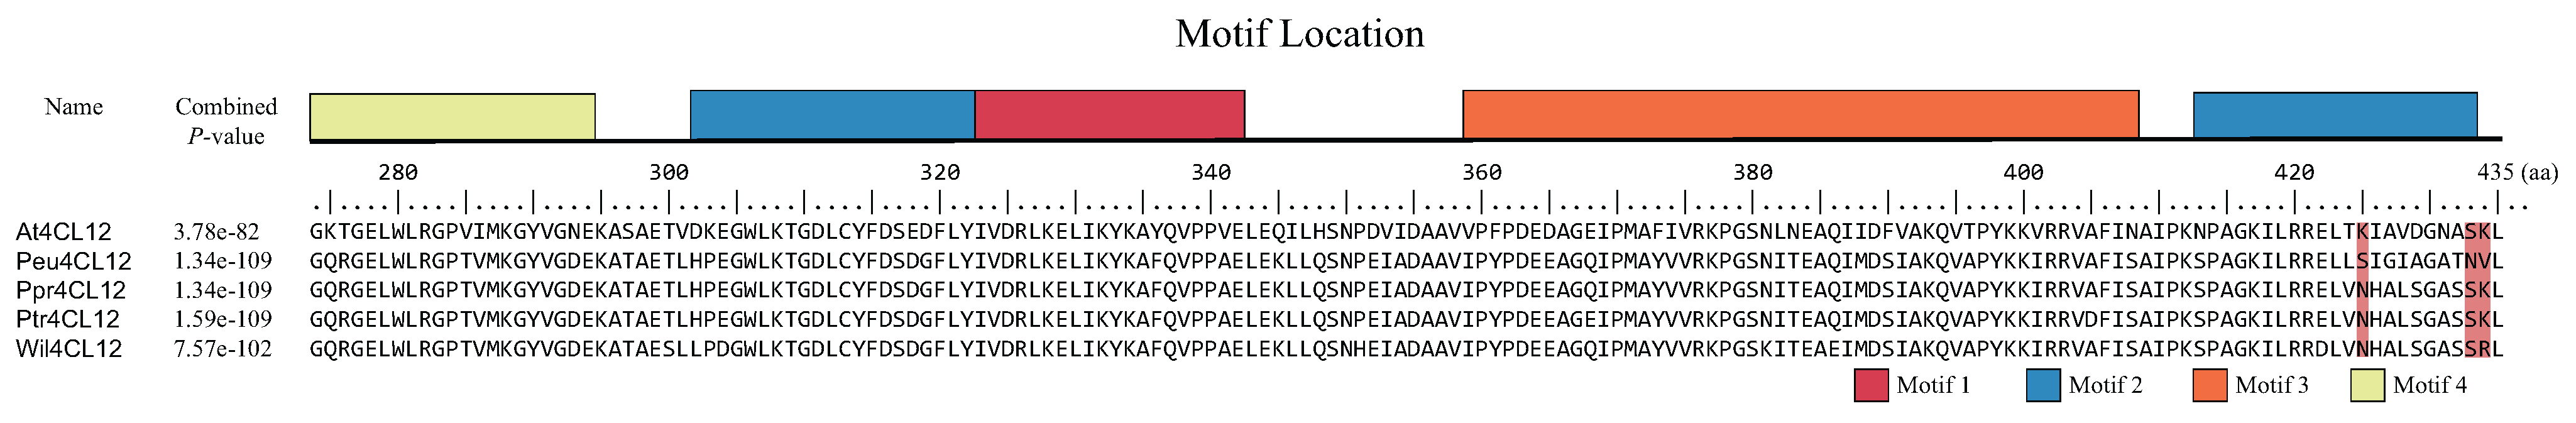
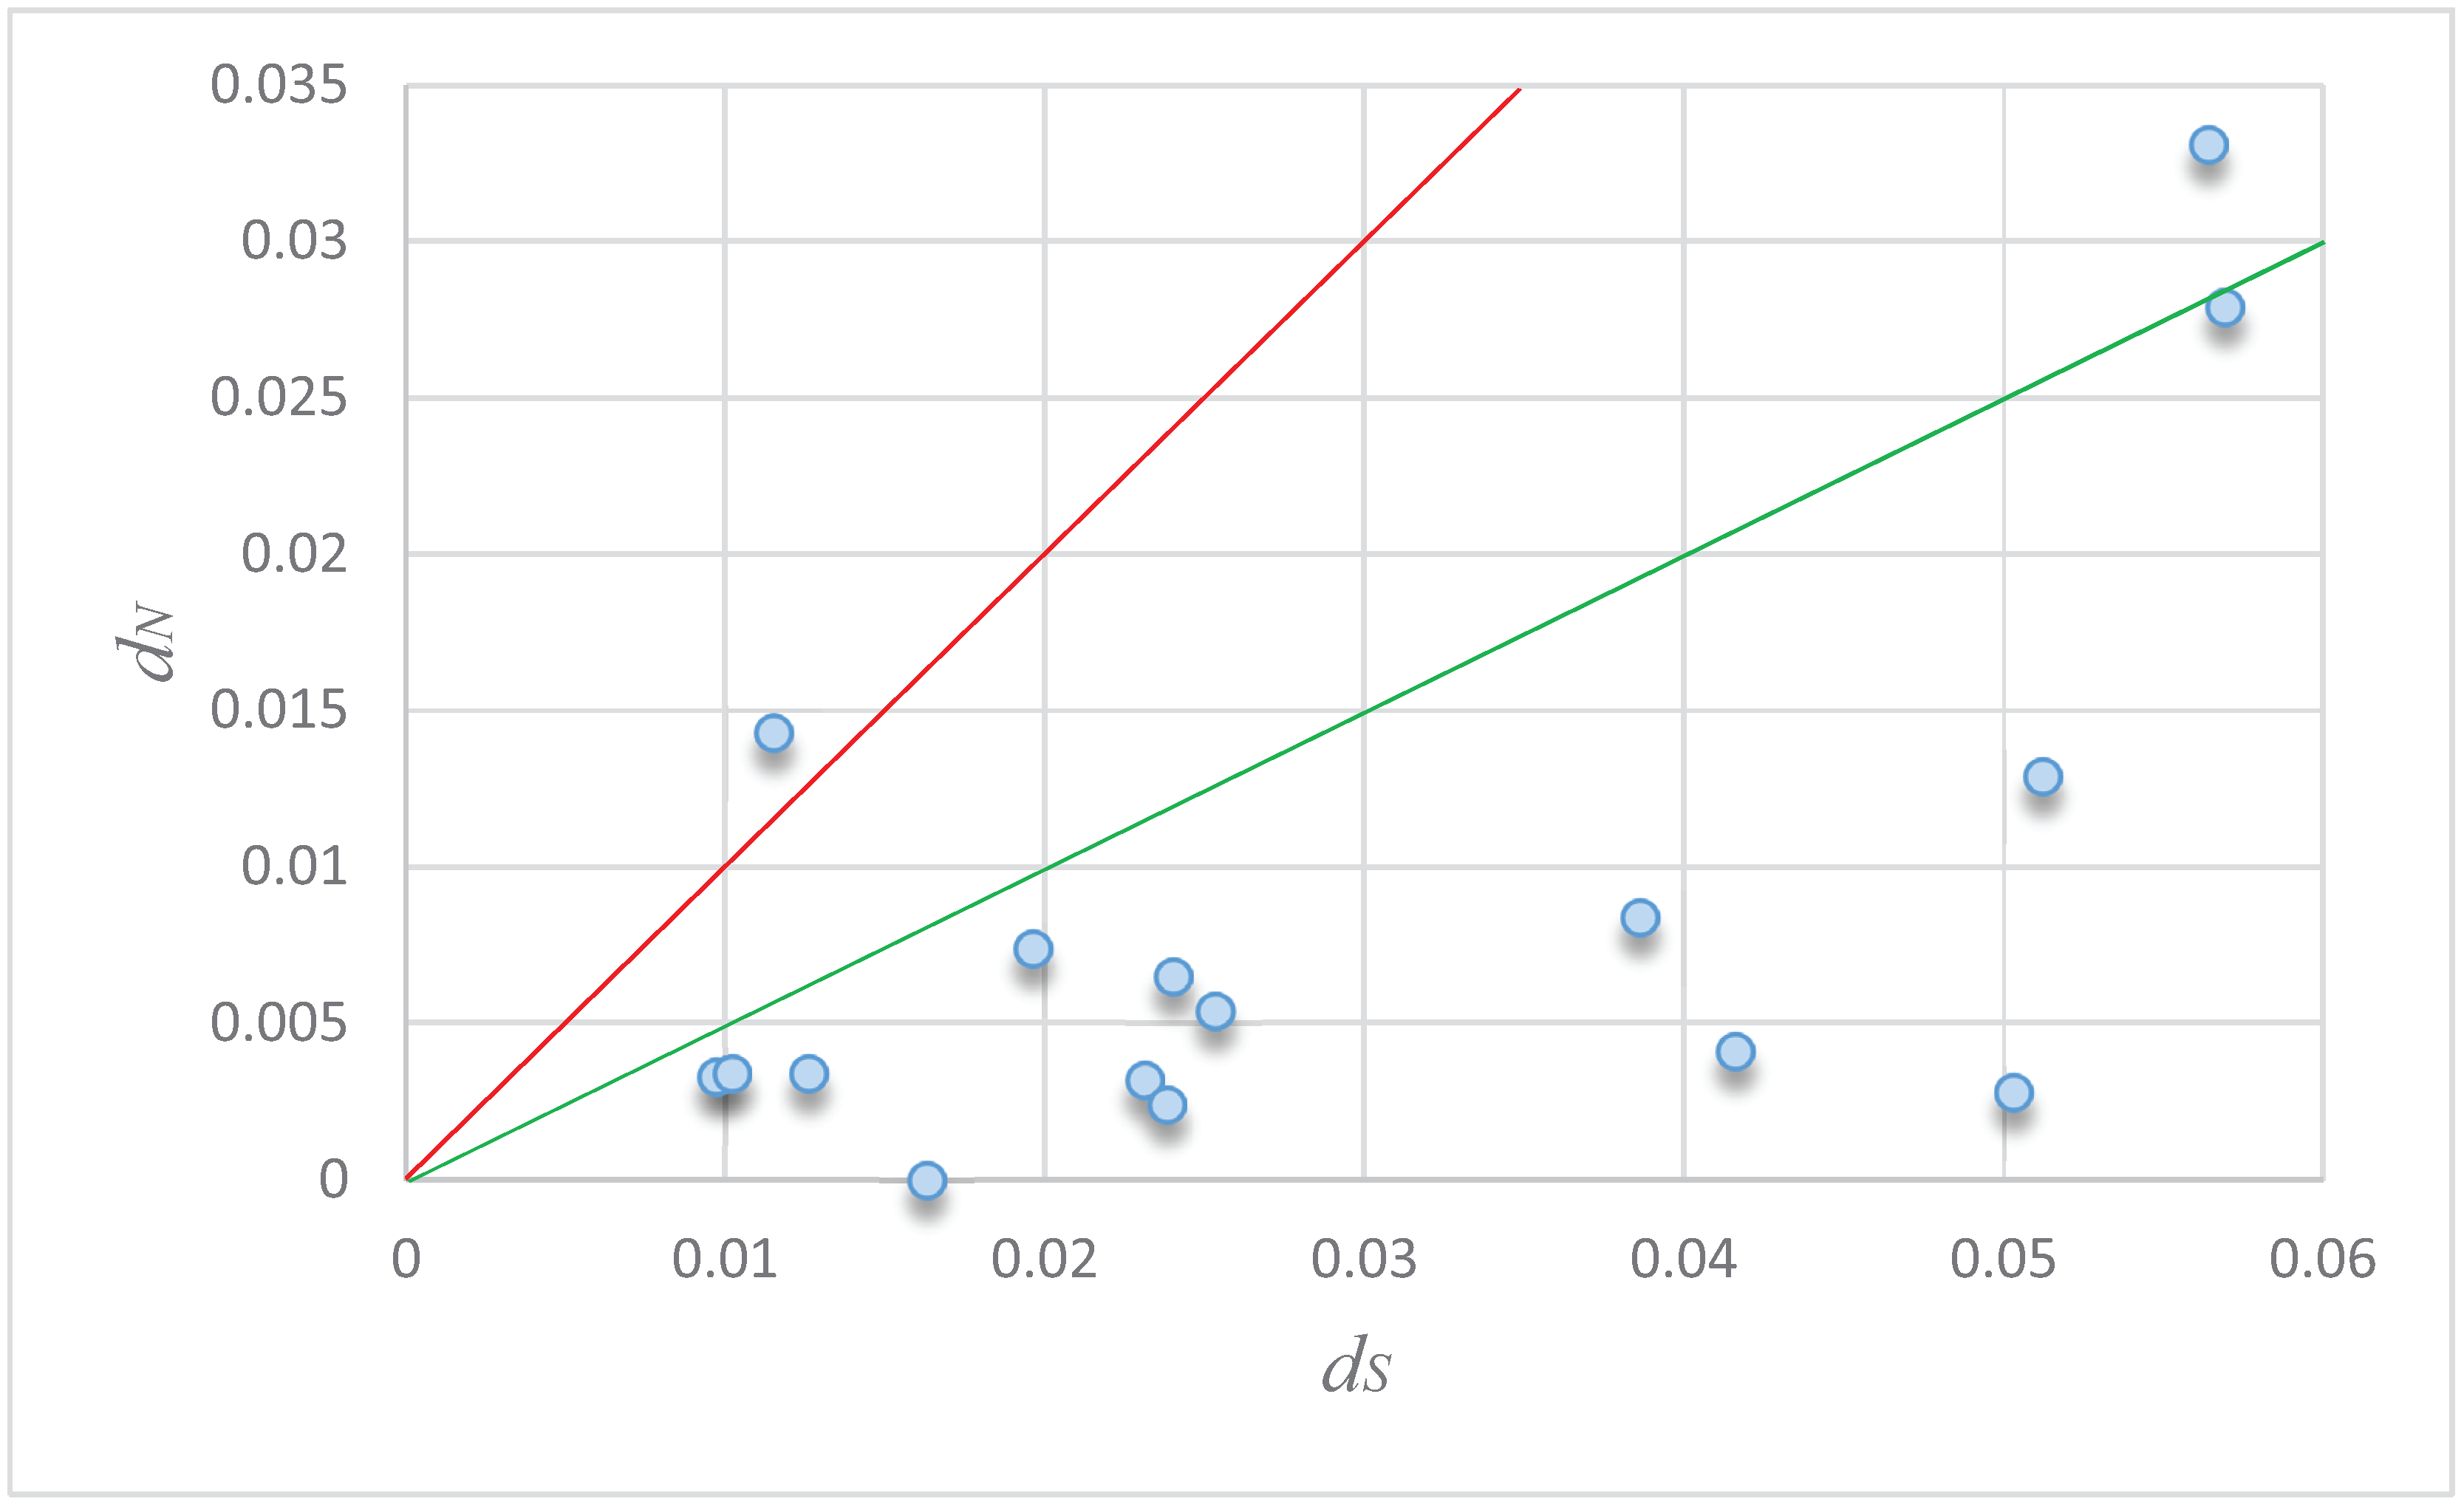
3.4. Molecular Evolution

The phylogenetic relationships among the 4CL genes showed that a total of 85 full-length genes encoding putative 4CL proteins were grouped into two distinct clades (Figure 2). To determine whether there was a significant difference in selective pressure between Clades A and B (Figure 2), we performed a maximum likelihood codon model analysis using the PAML package. Two assumptions were tested: a one-ratio model that assumed the same ω (= dN/dS) ratio for both clades of 4CLs and a two-ratio model in which the two 4CL types were assigned different ω ratios. The log likelihood values under the one-ratio and two-ratio models were ln L = −8739.544694 and −8719.525874, respectively (Table 2). The likelihood ratio test indicated that the null (single ratio) model should be rejected and (thus) selective pressure has differed significantly between Clades A and B (p < 0.001). Under the two-ratio model, the ω values for Clades B and A were 0.21307 and 0.08243, respectively, indicating that Clade A (including the most 4CL-like genes) has been under more relaxed selection constraints than Clade B (comprising four 4CL genes, 4CL1-4, and one homologous 4CL-like gene, 4CL9).
Table 2. Summary statistics of clades for detecting selection using branch models in PAML.
Branch modelωln Lχ2p
One-ratioω = 0.14106 for all branches−8739.54
Two-ratiosω0 = 0.08243 for Clade I−8719.5340.04< 0.001
ω1 = 0.21307 for Clade II
Two-ratiosω0 = 0.08243 for Clade II
ω1 = 0.21307 for Clade I
In order to detect evidence of adaptive evolution of the desert poplar clade comprising P. pruinosa and P. euphratica genes, we only used six groups of 1:1:1 orthologous genes across all five species for the analyses. We excluded groups with species-specific gene duplications or losses, which might affect the estimation of adaptive evolution. We carried out phylogenetic analyses for each group (Figure 3) and examined the significance of differences in apparent selection pressure between the desert poplar clade (P. pruinosa and P. euphratica) (A1 or B1) and the other species (A2 or B2). We used CODEML branch models in PAML to estimate ω (= dN/dS) values for the two clades (Table 3). An LRT showed that the two-ratio model provided a significantly better fit than the one-ratio model for trees five (4CL11) and six (4CL12) (p < 0.05), suggesting that there were significant differences in selective pressures between the two clades of 4CL genes after the ancestral gene duplication. However, for the other four trees (trees 1, 2, 3, and 4), LRTs indicated that the one-ratio model (in which the two clades were assigned the same ratio) could not be rejected, suggesting that the selective pressure was similar between the two clades.
Figure 3. Phylogenetic trees of six orthologous 4CL genes between four poplar species and Arabidopsis for molecular evolution analyses. The trees were reconstructed using NJ with 100 bootstrap replicates. Based on the orthologs belonging to Clade A or Clade B in Figure 2, A and B represent Clade A and Clade B, respectively, so the desert poplar clades (P. pruinosa and P. euphratica) were assigned to A1 or B1 and the other species were assigned to A2 or B2.
Genes 06 00901 g003
Table 3. Summary statistics of orthologs for detecting selection using branch models in PAML.
TreeBranch model (tree)ωln Lχ2p
Tree 1
One-ratioω = 0.09995 for all branches −4106.5051773.473988
Two-ratiosω0 = 0.12256 for Clade B1−4104.768183
ω1 = 0.05817 for Clade B2
Tree 2
One-ratioω = 0.14031 for all branches −3879.089193.149266
Two-ratiosω0 = 0.3196 for Clade A1−3877.514557
ω1 = 0.1330 for Clade A2
Tree 3
One-ratioω = 0.07578 for all branches −4312.0233690.768848
Two-ratiosω0 = 0.10875 for Clade B1−4311.638945
ω1 = 0.07299 for Clade B2
Tree 4
One-ratioω = 0.19107 for all branches −3400.6067283.567392
Two-ratiosω0 = 0.34271 for Clade A1−3398.823032
ω1 = 0.17030 for Clade A2
Tree 5
One-ratio ω = 0.09507 for all branches −2426.3832067.862458< 0.05
Two-ratiosω0 = 0.40447 for Clade A1−2422.451977
ω1 = 0.08459 for Clade A2
Tree 6
One-ratio ω = 0.13484 for all branches −3524.7766145.583034< 0.05
Two-ratiosω0 = 0.30109 for Clade A1−3521.985097
ω1 = 0.12124 for Clade A2
For trees 5 and 6, in which selective pressures differed between the two clades, the mean ω values for Clades A1 and A2 were 0.40 and 0.08 or 0.30 and 0.12, respectively, indicating that more amino acid changes in the desert popular clade (A1) might have been preserved by positive selection. To test this hypothesis, we applied a branch-site test to identify target sites that were potentially under positive selection in Clade A1 of these two trees. We assigned Clades A1 and A2 as foreground and background branches, respectively, and obtained log likelihood values under the positive selection model A. We detected signals for tree 6 and the null model A0 of ln L = −3482.762192 and ln L = −3471.911359, respectively. The LRT indicated that the null model should be rejected (p < 0.05), corroborating the hypothesis that some amino acid sites in Clade A1 have been under positive selection for tree 6 (4CL12) (Table 4). Further analysis using a Bayes Empirical Bayes procedure identified three sites (alignment positions 425, 433 and 434) that have apparently been under positive selection with posterior probabilities >0.99. With one exception (alignment position 434), these amino acids were located in motif 2 (Figure 4).
To infer the influence of selection on the pairs of orthologs from P. euphratica and P. pruinosa, the ratio of non-synonymous vs. synonymous substitutions (ω = dN/dS) was used because it is an indicator of the history of selection acting on a gene. Ratios significantly <1 are suggestive of purifying selection which hinders the spread of deleterious alleles, whereas ratios >1 suggest positive selection which promotes the spread of beneficial alleles in population [61]. A plot of dN/dS for the orthologous genes is shown in Figure 5 and the results suggest that most pairs have evolved mainly under the influence of purifying selection. Of these, one pair of orthologs (Peu4CL15 and Ppr4CL15) between two desert poplars has a dN/dS > 1, indicating positive selection, and one pair has a dN/dS between 0.5 and 1, indicating weak purifying selection (Table S3).
Figure 4. Positions of the positive selection sites. Sequence alignment of 4CL12 orthologs from 274–435 amino acid sites from five species included five motifs; the numbers and colors represent motifs 1–4. The three positive-selection sites predicted by the branch-site model test are colored red. Two sites (alignment positions 425 and 433) were located in motif 2. One site (alignment position 434) was located in none of the motifs.
Genes 06 00901 g004
Table 4. Summary statistics for detecting selection using branch-site models in PAML.
ModeEstimates of parametersln Lχ2pPositively selected sites
Tree6Branch modelω = 0.13484 for all branches−3524.7766145.583034< 0.05
One-ratioω0 = 0.30109 for Clade A1−3521.985097
Two-ratiosω1 = 0.12124 for Clade A2
Branch-site model
Model A0ω0 = 0.05407, p0 = 0.82301,
ωl = 0.05407, p1 = 0.17699
−3482.762192
(ω2 = 1)ω2a fore = 0.40000,
ω2a back = 0.05407, P2a = 0.00000
ω2b fore = 1.00000,
ω2b back = 0.40000, P2b = 0.00000
Model A1ω0 = 0.05457, p0 = 0.82708,
ωl = 1.00000, p1 = 0.15615
−3471.91135921.701666< 0.01425 *, 433 **, 434 *
(ω2 > 1)ω2a fore = 90.73377,
ω2a back = 0.05457, P2a = 0.01411
ω2b fore = 90.73377,
ω2b back = 1.00000, P2b = 0.00266

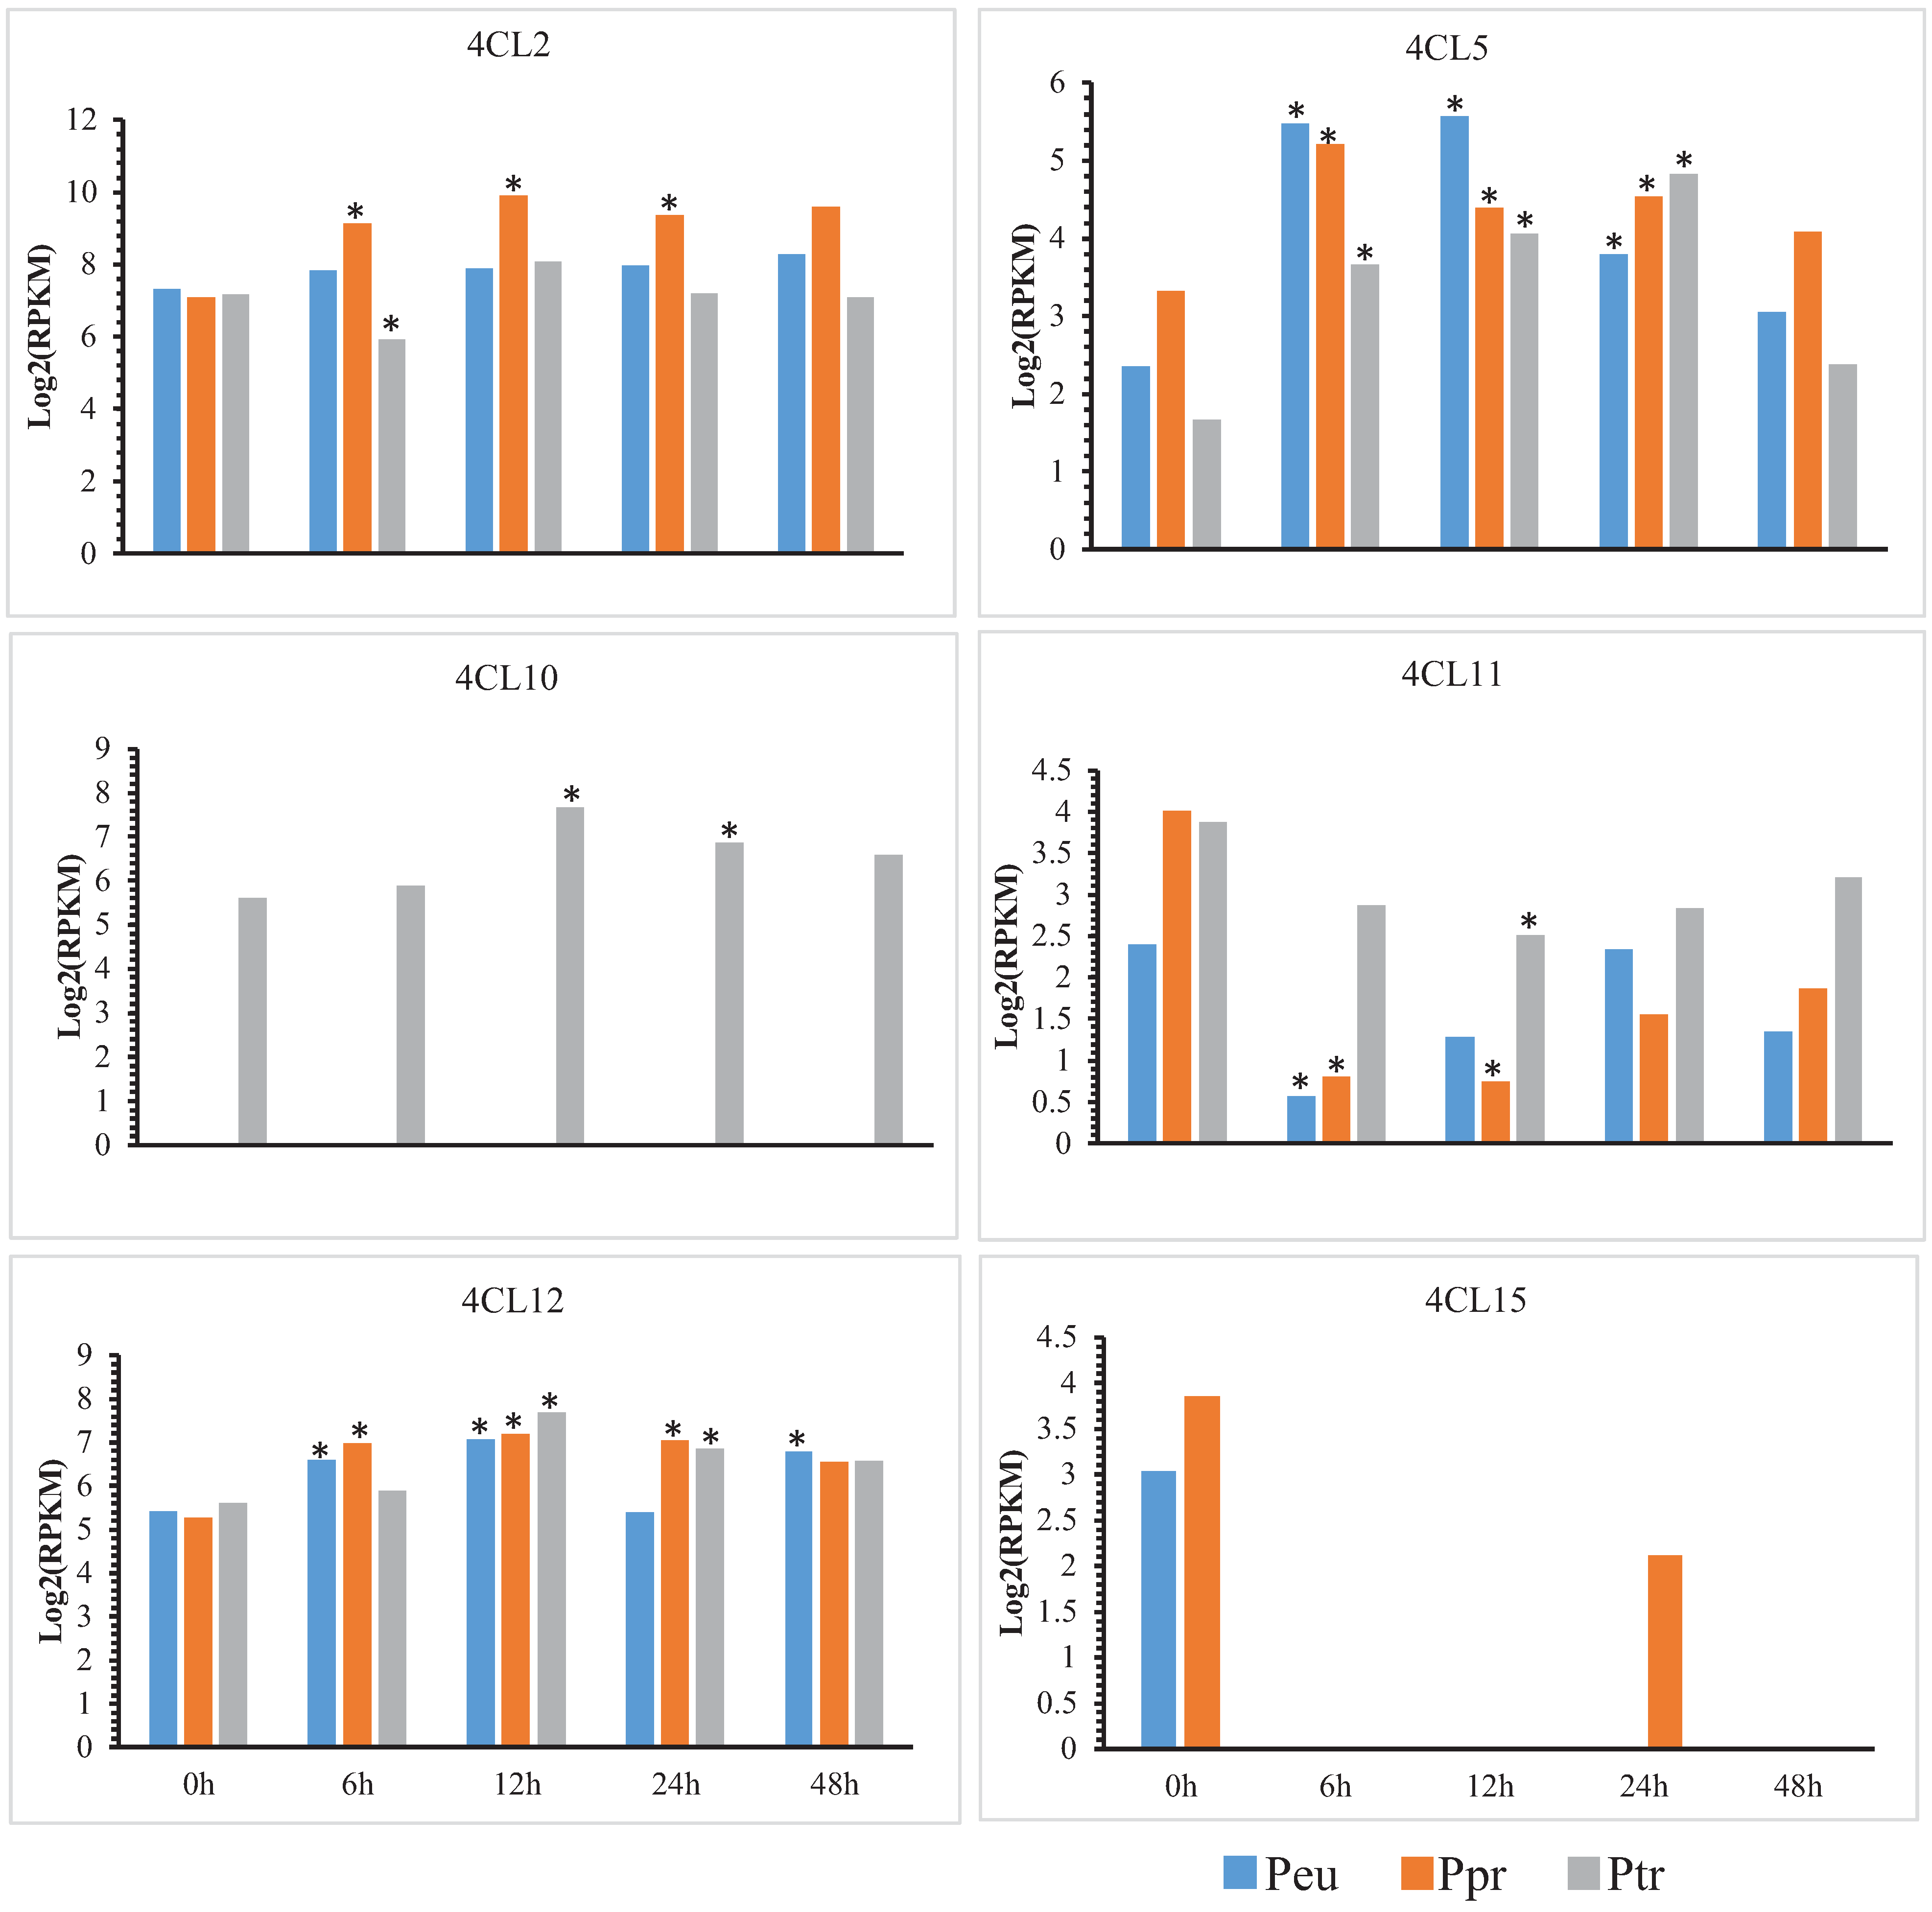
3.5. Changes in Expression of Orthologs Evolved under Salt Stress

We also examined possible differences in expression of the 4CL genes between the salt-sensitive species P. trichocarpa and the two salt-tolerant species (P. euphratica and P. pruinosa) during responses to salt stress. Gene expression was measured in terms of RPKM values by mapping reads from the transcriptomes of control and salt-stressed calluses and it is very meaningful to do the similar experiments with different plant tissue or cuttings in the future. Thresholds of log2 (RPKMsalt/RPKMcontrol) > 1 and p < 0.05 were used to define significant differences in gene expression. Based on the thresholds and log2 ratio values, we found that expression levels of five 4CL genes of the two salt-tolerant species (P. euphratica and P. pruinosa) significantly changed under salt stress, while the orthologous or homologous genes in the salt-sensitive P. trichocarpa showed similar but weaker changes. Expression levels of three 4CL genes (4CL2, 4CL11 and 4CL12) was significantly changed in one or both desert poplars in response to salt stress than in the salt-sensitive P. trichocarpa (Figure 6). However, expression of 4CL5 significantly decreased in response to salt stress in all three poplars. It should be noted that one of the three genes with an induced increased expression (4CL12) showed positive selection in the analyses described above. In contrast, a pair of rapidly evolved orthologs of the two desert poplars (Peu4CL15 and Ppr4CL15, ω > 1) were only expressed under normal conditions (not under salt stress), suggesting that they also respond, negatively, to salt stress. In addition, we found that some 4CL genes (e.g., 4CL9 and 4CL10) were not expressed in either un-stressed or stressed calluses of any of the three poplar species. All these expression patterns suggest that some 4CL genes may have played some roles in the evolution of salt-tolerance in P. euphratica and P. pruinosa. Furthermore, spatial and diachronic divergences in expression profiles of all 4CL genes of the species have developed, suggesting possible functional divergences between them.
Figure 5. Distribution of dN and dS for 16 pairs of the putative 4CL orthologs between P. pruinosa and P. euphratica. The orthologs with dN/dS > 1 fall above the red line while those with dN/dS = 0.5–1 fall between the green and red lines. The name and the value (dN/dS) of 16 pairs of genes were listed in the Table S3.
Genes 06 00901 g005

4. Conclusions

We have characterized the 4CL gene family in poplars by a comprehensive analysis of gene structures, phylogenetic relationships, conserved motifs, molecular evolution and expression profiles. And we have identified 20, 20, 20 and 12 4CL genes from P. trichocarpa, P. euphratica, P. pruinosa, and S. suchowensis genomes, respectively. The 4CL genes identified clustered into two clades, between which different selection pressures were detected. One gene (4CL12 in the 4CL-like clade) showed positive selection along the lineage comprising the two desert poplars. In addition, expression of three 4CL genes (4CL2, 4CL11, and 4CL12) was induced substantially more strongly in one or both desert poplars in response to salt stress than in the salt-sensitive P. trichocarpa. Taken together, our findings suggest that the evolution of the 4CL genes may have contributed to the development of salt tolerance in the two desert poplars.
Figure 6. Expression analysis of the orthologous 4CL genes under salt stress. Transcription analysis of the relative expression levels of six orthologous 4CL genes specific to three species under salt stress except 4CL9, which was not expressed in neither un-stressed nor stressed calluses, and the orthologous genes (4CL15) with ω (dN/dS) > 1 in P. pruinosa and P. euphratica. The y-axis shows the log2-transformed RPKM values of genes expressed in callus after different periods of salt stress, and the x-axis shows the time point under salt stress. The star (*) represents the expression of genes under salt stress that reached the threshold of log2 (RPKMsalt/RPKMcontrol) > 1 or < −1 and indicates a significance of p < 0.05.
Genes 06 00901 g006

Supplementary Files

Supplementary File 1

Data Deposit

The unpublished RNA-Seq data sets from P. trichocarpa of Illumina sequencing in are available at the NCBI Sequence Read Archive (SRA) database with the project accession number: PRJNA284202.

Acknowledgments

This research was supported by the National Key Project for Basic Research (grant No. 2012CB114504), the National High-Tech Research and Development Program of China (863 Program, grant No. 2013AA102605) and the National Science Foundation of China (No. 31270562, 31470620).

Author Contributions

Jian-Quan Liu and Dong-Shi Wan conceived and designed the experiments; Cai-Hua Zhang and Tao Ma analyzed the data and wrote the text; Wen-Chun Luo and Jian-Mei Xu created the figures.

Conflicts of Interest

The authors declare no conflict of interest.

References

  1. Lee, D.; Meyer, K.; Chapple, C.; Douglas, C.J. Antisense suppression of 4-coumarate:Coenzyme a ligase activity in Arabidopsis leads to altered lignin subunit composition. Plant Cell 1997, 9, 1985–1998. [Google Scholar] [CrossRef] [PubMed]
  2. Hu, W.J.; Kawaoka, A.; Tsai, C.J.; Lung, J.; Osakabe, K.; Ebinuma, H.; Chiang, V.L. Compartmentalized expression of two structurally and functionally distinct 4-coumarate:CoA ligase genes in aspen (Populus tremuloides). Proc. Natl. Acad. Sci. USA 1998, 95, 5407–5412. [Google Scholar] [CrossRef] [PubMed]
  3. Hahlbrock, K.; Scheel, D. Physiology and molecular biology of phenylpropanoid metabolism. Annu. Rev. Plant Physiol. Plant Mol. Biol. 1989, 40, 347–369. [Google Scholar] [CrossRef]
  4. Dixon, R.A.; Paiva, N.L. Stress-induced phenylpropanoid metabolism. Plant Cell 1995, 7, 1085–1097. [Google Scholar] [CrossRef] [PubMed]
  5. Yuan, Y.; Yu, S.; Yu, J.; Zhan, Z.; Li, M.; Liu, G.; Wang, X.; Huang, L. Predicting the function of 4-coumarate:CoA ligase (LJ4CL1) in Lonicera japonica. Int. J. Mol. Sci. 2014, 15, 2386–2399. [Google Scholar] [CrossRef] [PubMed]
  6. Bairoch, A. Prosite: A dictionary of sites and patterns in proteins. Nucleic Acids Res. 1991, 19, 2241–2245. [Google Scholar] [CrossRef] [PubMed]
  7. Fulda, M.; Heinz, E.; Wolter, F.P. The fadD gene of Escherichia coli K12 is located close to rnd at 39.6 min of the chromosomal-map and is a new member of the AMP-binding protein family. Mol. Gen. Genet. 1994, 242, 241–249. [Google Scholar] [CrossRef] [PubMed]
  8. Becker-André, M.; Schulze-Lefert, P.; Hahlbrock, K. Structural comparison, modes of expression, and putative cis-acting elements of the two 4-coumarate:CoA ligase genes in potato. J. Biol. Chem. 1991, 266, 8551–8559. [Google Scholar] [PubMed]
  9. Ragg, H.; Kuhn, D.N.; Hahlbrock, K. Coordinated regulation of 4-coumarate:CoA ligase and phenylalanine ammonia-lyase mRNAs in cultured plant cells. J. Biol. Chem. 1981, 256, 10061–10065. [Google Scholar] [PubMed]
  10. Zhao, Y.; Kung, S.D.; Dube, S.K. Nucleotide sequence of rice 4-coumarate:CoA ligase gene, 4-CL.1. Nucleic Acids Res. 1990. [Google Scholar] [CrossRef]
  11. Uhlmann, A.; Ebel, J. Molecular cloning and expression of 4-coumarate:Coenzyme a ligase, an enzyme involved in the resistance response of soybean (Glycine max L.) against pathogen attack. Plant Physiol. 1993, 102, 1147–1156. [Google Scholar] [CrossRef] [PubMed]
  12. Voo, K.S.; Whetten, R.W.; O’Malley, D.M.; Sederoff, R.R. 4-Coumarate:Coenzyme a ligase from loblolly pine xylem (isolation, characterization, and complementary DNA cloning). Plant Physiol. 1995, 108, 85–97. [Google Scholar] [CrossRef] [PubMed]
  13. Lee, D.; Ellard, M.; Wanner, L.A.; Davis, K.R.; Douglas, C.J. The Arabidopsis thaliana 4-coumarate:CoA ligase (4CL) gene: Stress and developmentally regulated expression and nucleotide sequence of its cDNA. Plant Mol. Biol. 1995, 28, 871–884. [Google Scholar] [CrossRef] [PubMed]
  14. Ehlting, J.; Büttner, D.; Wang, Q.; Douglas, C.J.; Somssich, I.E.; Kombrink, E. Three 4-coumarate:Coenzyme a ligases in Arabidopsis thaliana represent two evolutionarily divergent classes in angiosperms. Plant J. 1999, 19, 9–20. [Google Scholar] [CrossRef] [PubMed]
  15. Kajita, S.; Katayama, Y.; Omori, S. Alterations in the biosynthesis of lignin in transgenic plants with chimeric genes for 4-coumarate:Coenzyme a ligase. Plant Cell Physiol. 1996, 37, 957–965. [Google Scholar] [CrossRef] [PubMed]
  16. Lee, D.; Douglas, C.J. Two divergent members of a tobacco 4-coumarate:Coenzyme a ligase (4CL) gene family (cDNA structure, gene inheritance and expression, and properties of recombinant proteins). Plant Physiol. 1996, 112, 193–205. [Google Scholar] [CrossRef] [PubMed]
  17. Harding, S.A.; Leshkevich, J.; Chiang, V.L.; Tsai, C.J. Differential substrate inhibition couples kinetically distinct 4-coumarate:Coenzyme a ligases with spatially distinct metabolic roles in quaking aspen. Plant Physiol. 2002, 128, 428–438. [Google Scholar] [CrossRef] [PubMed]
  18. Allina, S.M.; Pri-Hadash, A.; Theilmann, D.A.; Ellis, B.E.; Douglas, C.J. 4-coumarate:Coenzyme a ligase in hybrid poplar properties of native enzymes, cDNA cloning, and analysis of recombinant enzymes. Plant Physiol. 1998, 116, 743–754. [Google Scholar] [CrossRef] [PubMed]
  19. Cukovic, D.; Ehlting, J.; VanZiffle, J.A.; Douglas, C.J. Structure and evolution of 4-coumarate:Coenzyme a ligase (4CL) gene families. Biol. Chem. 2001, 382, 645–654. [Google Scholar] [CrossRef] [PubMed]
  20. Raes, J.; Rohde, A.; Christensen, J.H.; van de Peer, Y.; Boerjan, W. Genome-wide characterization of the lignification toolbox in Arabidopsis. Plant Physiol. 2003, 133, 1051–1071. [Google Scholar] [CrossRef] [PubMed]
  21. Neves, G.; Marchiosi, R.; Ferrarese, M.; Siqueira-Soares, R.; Ferrarese-Filho, O. Root growth inhibition and lignification induced by salt stress in soybean. J. Agron. Crop Sci. 2010, 196, 467–473. [Google Scholar] [CrossRef]
  22. Schmelzer, E.; Kruger-Lebus, S.; Hahlbrock, K. Temporal and spatial patterns of gene expression around sites of attempted fungal infection in parsley leaves. Plant Cell 1989, 1, 993–1001. [Google Scholar] [CrossRef] [PubMed]
  23. Lindermayr, C.; Möllers, B.; Fliegmann, J.; Uhlmann, A.; Lottspeich, F.; Meimberg, H.; Ebel, J. Divergent members of a soybean (Glycine max L.) 4-coumarate:Coenzyme a ligase gene family. Eur. J. Biochem. 2002, 269, 1304–1315. [Google Scholar] [CrossRef] [PubMed]
  24. Costa, M.A.; Bedgar, D.L.; Moinuddin, S.G.; Kim, K.W.; Cardenas, C.L.; Cochrane, F.C.; Shockey, J.M.; Helms, G.L.; Amakura, Y.; Takahashi, H.; et al. Characterization in vitro and in vivo of the putative multigene 4-coumarate:CoA ligase network in Arabidopsis: Syringyl lignin and sinapate/sinapyl alcohol derivative formation. Phytochemistry 2005, 66, 2072–2091. [Google Scholar] [CrossRef]
  25. Ottow, E.A.; Brinker, M.; Teichmann, T.; Fritz, E.; Kaiser, W.; Brosché, M.; Kangasjärvi, J.; Jiang, X.; Polle, A. Populus euphratica displays apoplastic sodium accumulation, osmotic adjustment by decreases in calcium and soluble carbohydrates, and develops leaf succulence under salt stress. Plant Physiol. 2005, 139, 1762–1772. [Google Scholar] [CrossRef] [PubMed]
  26. Chen, S.; Li, J.; Fritz, E.; Wang, S.; Hüttermann, A. Sodium and chloride distribution in roots and transport in three poplar genotypes under increasing NaCl stress. For. Ecol. Manage. 2002, 168, 217–230. [Google Scholar] [CrossRef]
  27. Browicz, K. Chorology of Populus euphratica olivier. Arbor. Kornickie 1977, 22, 5–27. [Google Scholar]
  28. Thevs, N.; Buras, A.; Zerbe, S.; Kühnel, E.; Abdusalih, N.; Ovezberdiyeva, A. Structure and wood biomass of near-natural floodplain forests along the central asian rivers tarim and amu darya. Forestry 2011. [Google Scholar] [CrossRef]
  29. Ma, T.; Wang, J.; Zhou, G.; Yue, Z.; Hu, Q.; Chen, Y.; Liu, B.; Qiu, Q.; Wang, Z.; Zhang, J.; et al. Genomic insights into salt adaptation in a desert poplar. Nat. Commun. 2013. [Google Scholar] [CrossRef] [PubMed]
  30. Tuskan, G.A.; Difazio, S.; Jansson, S.; Bohlmann, J.; Grigoriev, I.; Hellsten, U.; Putnam, N.; Ralph, S.; Rombauts, S.; Salamov, A.; et al. The genome of black cottonwood, Populus trichocarpa (Torr. & Gray). Science 2006, 313, 1596–1604. [Google Scholar] [PubMed]
  31. Nordberg, H.; Cantor, M.; Dusheyko, S.; Hua, S.; Poliakov, A.; Shabalov, I.; Smirnova, T.; Grigoriev, I.V.; Dubchak, I. The genome portal of the Department of Energy Joint Genome Institute: 2014 updates. Nucleic Acids Res. 2014, 42, D26–D31. [Google Scholar] [CrossRef] [PubMed]
  32. Ma, T.; Liu, J. Genome of Populus pruinosa. Unpublished data. 2015. [Google Scholar]
  33. Dai, X.; Hu, Q.; Cai, Q.; Feng, K.; Ye, N.; Tuskan, G.A.; Milne, R.; Chen, Y.; Wan, Z.; Wang, Z.; et al. The willow genome and divergent evolution from poplar after the common genome duplication. Cell Res. 2014, 24, 1274–1277. [Google Scholar] [CrossRef] [PubMed]
  34. Cell wall genomics. Available online: http://cellwall.genomics.purdue.edu/families/index.html (accessed on 10 September 2015).
  35. Lamesch, P.; Berardini, T.Z.; Li, D.; Swarbreck, D.; Wilks, C.; Sasidharan, R.; Muller, R.; Dreher, K.; Alexander, D.L.; Garcia-Hernandez, M. The Arabidopsis information resource (tair): Improved gene annotation and new tools. Nucleic Acids Res. 2012, 40, D1202–D1210. [Google Scholar] [CrossRef] [PubMed]
  36. Eddy, S.R. Profile hidden markov models. Bioinformatics 1998, 14, 755–763. [Google Scholar] [CrossRef] [PubMed]
  37. Finn, R.D.; Bateman, A.; Clements, J.; Coggill, P.; Eberhardt, R.Y.; Eddy, S.R.; Heger, A.; Hetherington, K.; Holm, L.; Mistry, J.; et al. Pfam: The protein families database. Nucleic Acids Res. 2014, 42, D222–D230. [Google Scholar] [CrossRef] [PubMed]
  38. Larkin, M.A.; Blackshields, G.; Brown, N.P.; Chenna, R.; McGettigan, P.A.; McWilliam, H.; Valentin, F.; Wallace, I.M.; Wilm, A.; Lopez, R.; et al. Clustal W and Clustal X version 2.0. Bioinformatics 2007, 23, 2947–2948. [Google Scholar] [CrossRef] [PubMed]
  39. Saitou, N.; Nei, M. The neighbor-joining method: A new method for reconstructing phylogenetic trees. Mol. Biol. Evol. 1987, 4, 406–425. [Google Scholar] [PubMed]
  40. Edgar, R.C. Muscle: Multiple sequence alignment with high accuracy and high throughput. Nucleic Acids Res. 2004, 32, 1792–1797. [Google Scholar] [CrossRef] [PubMed]
  41. Tamura, K.; Stecher, G.; Peterson, D.; Filipski, A.; Kumar, S. Mega6: Molecular evolutionary genetics analysis version 6.0. Mol. Biol. Evol. 2013, 30, 2725–2729. [Google Scholar] [CrossRef] [PubMed]
  42. Ferraiolo, J.; Jun, F.; Jackson, D. Scalable Vector Graphics (SVG) 1.0 Specification; Iuniverse: Bloomington, IN, USA, 2000. [Google Scholar]
  43. Bailey, T.L.; Boden, M.; Buske, F.A.; Frith, M.; Grant, C.E.; Clementi, L.; Ren, J.; Li, W.W.; Noble, W.S. MEME SUITE: Tools for motif discovery and searching. Nucleic Acids Res. 2009. [Google Scholar] [CrossRef] [PubMed]
  44. Schultz, J.; Milpetz, F.; Bork, P.; Ponting, C.P. Smart, a simple modular architecture research tool: Identification of signaling domains. Proc. Natl. Acad. Sci. USA 1998, 95, 5857–5864. [Google Scholar] [CrossRef] [PubMed]
  45. Letunic, I.; Doerks, T.; Bork, P. Smart 7: Recent updates to the protein domain annotation resource. Nucleic Acids Res. 2012, 40, D302–D305. [Google Scholar] [CrossRef] [PubMed]
  46. Yang, Z. PAML 4: Phylogenetic analysis by maximum likelihood. Mol. Biol. Evol. 2007, 24, 1586–1591. [Google Scholar] [CrossRef] [PubMed]
  47. O’Brien, K.P.; Remm, M.; Sonnhammer, E.L. Inparanoid: A comprehensive database of eukaryotic orthologs. Nucleic Acids Res. 2005, 33, D476–D480. [Google Scholar] [CrossRef] [PubMed]
  48. Alexeyenko, A.; Tamas, I.; Liu, G.; Sonnhammer, E.L. Automatic clustering of orthologs and inparalogs shared by multiple proteomes. Bioinformatics 2006, 22, e9–e15. [Google Scholar] [CrossRef] [PubMed]
  49. Yang, Z.; Wong, W.S.; Nielsen, R. Bayes empirical bayes inference of amino acid sites under positive selection. Mol. Biol. Evol. 2005, 22, 1107–1118. [Google Scholar] [CrossRef] [PubMed]
  50. Yang, Z.; Nielsen, R.; Goldman, N.; Pedersen, A.M. Codon-substitution models for heterogeneous selection pressure at amino acid sites. Genetics 2000, 155, 431–449. [Google Scholar] [PubMed]
  51. Luo, W.; Wan, D.; Liu, J. Transcriptome changes in four poplars in response to salt stress. Unpublished data. 2015. [Google Scholar]
  52. Zhang, J.; Jiang, D.; Liu, B.; Luo, W.; Lu, J.; Ma, T.; Wan, D. Transcriptome dynamics of a desert poplar (Populus pruinosa) in response to continuous salinity stress. Plant Cell Rep. 2014, 33, 1565–1579. [Google Scholar] [CrossRef] [PubMed]
  53. Gu, R.S.; Jiang, X.N.; Guo, Z.C. Organogenesis and plantlet regeneration in vitro of Populus euphratica (In Chinese). Acta Bot. Sin. 1999, 41, 29–33. [Google Scholar]
  54. Zhang, F.; Yang, Y.; He, W.; Zhao, X.; Zhang, L. Effects of salinity on growth and compatible solutes of callus induced from Populus euphratica. In Vitro Cell. Dev. Biol. Plant 2004, 40, 491–494. [Google Scholar] [CrossRef]
  55. Chang, S.; Puryear, J.; Cairney, J. A simple and efficient method for isolating RNA from pine trees. Plant Mol. Biol. Rep. 1993, 11, 113–116. [Google Scholar] [CrossRef]
  56. Langmead, B.; Trapnell, C.; Pop, M.; Salzberg, S.L. Ultrafast and memory-efficient alignment of short DNA sequences to the human genome. Genome Biol. 2009. [Google Scholar] [CrossRef] [PubMed]
  57. Mortazavi, A.; Williams, B.A.; McCue, K.; Schaeffer, L.; Wold, B. Mapping and quantifying mammalian transcriptomes by RNA-Seq. Nat. Methods 2008, 5, 621–628. [Google Scholar] [CrossRef] [PubMed]
  58. Robinson, M.D.; McCarthy, D.J.; Smyth, G.K. Edger: A bioconductor package for differential expression analysis of digital gene expression data. Bioinformatics 2010, 26, 139–140. [Google Scholar] [CrossRef] [PubMed]
  59. Zhang, J.; Feng, J.; Lu, J.; Yang, Y.; Zhang, X.; Wan, D.; Liu, J. Transcriptome differences between two sister desert poplar species under salt stress. BMC Genomics 2014. [Google Scholar] [CrossRef] [PubMed]
  60. Xu, Z.; Zhang, D.; Hu, J.; Zhou, X.; Ye, X.; Reichel, K.L.; Stewart, N.R.; Syrenne, R.D.; Yang, X.; Gao, P.; et al. Comparative genome analysis of lignin biosynthesis gene families across the plant kingdom. BMC Bioinformatics 2009. [Google Scholar] [CrossRef] [PubMed]
  61. Zhang, J. Positive selection, not negative selection, in the pseudogenization of rcsa in Yersinia pestis. Proc. Natl. Acad. Sci. USA 2008. [Google Scholar] [CrossRef] [PubMed]

