Article

Change of Soil Carbon Fractions and Water-Stable Aggregates in a Forest Ecosystem Succession in South China

1
Institute of Ecology and Environmental Sciences, South China Botanical Garden, Chinese Academy of Sciences, Guangzhou 510650, China
2
University of the Chinese Academy of Sciences, Beijing 100049, China
*
Author to whom correspondence should be addressed.
Forests 2015, 6(8), 2703-2718; https://doi.org/10.3390/f6082703
Submission received: 8 May 2015 / Revised: 22 July 2015 / Accepted: 24 July 2015 / Published: 5 August 2015

Abstract

:
In order to evaluate the dynamics of carbon storage during forest succession and explore the significance of water relations and soil stability in forest environments, a study was conducted in 2011. This study investigated the dynamics of soil organic carbon (SOC) fractions and its protection through aggregation along the successional forests. An experiment in South China examined pine forest (PF), pine and broadleaved mixed forest (PBMF), and monsoon evergreen broadleaf forest (MEBF), which represent the early, middle, and advanced succession stages, respectively. Soil was sampled at 0–15, 15–30, 30–45, and 45–60 cm depths. We analyzed active, slow, and passive organic carbon, as well as particulate organic matter carbon (POM-C) and nitrogen (POM-N), and measured the weight and concentration of water-stable aggregates in four classes (>2000 μm, 250–2000 μm, 53–250 μm, and <53 μm). The results suggested that various carbon fractions and the percentage of active and passive carbon to total organic carbon (TOC) increased with forest succession. The percentage of water-stable aggregates in >2000 μm (0–15 cm and 15–30 cm) and <53 μm (45–60 cm) in MEBF was significantly higher than in PBMF and PF. The SOC content of all size classes of water-stable aggregates in 0–45 cm were significantly increased with forest succession. In conclusion, forest succession contributed to the accumulation of carbon storage, and the increasing percentage of silt- and clay-size (<53 μm) fraction improved the stability of soil organic matter (SOM).

1. Introduction

Soil organic carbon (SOC) can be divided into three conceptual fractions, namely the active SOC (the mean residence time (MRT) is about 1–5 years), slow SOC (MRT is about 20–40 years), and passive SOC (MRT is about 200–1500 years) [1]. The active SOC with a short turnover time, such as particulate organic carbon (POC), is considered a biologically available source of carbon (C) and responds faster to environmental changes than total SOC [2]. The passive SOC has also been shown to be very sensitive to temperature and priming effects; it can imply the long-term positive feedback of SOC decomposition in a warming world [3].
Soil aggregates are the arrangement of soil particles of different sizes joined by organic and inorganic materials [4], and their stability can be used as an index of soil structure [5]. The structure of soil protects the soil organic matter and influences organic matter turnover and soil fertility [6]. Water-stable aggregation is a method to evaluate soil aggregation. Water-stable aggregation provides useful information on soil aggregate stability. Water-stable aggregation is usually formed by macroaggregates (>250 μm) and microaggregates (<250 μm) [7]. Macroaggregation is very sensitive to changes in land use and cultivation practices [7,8,9], whereas microaggregation is much less so [8,10].
Recently, many studies have investigated the effects of land-use change on SOC and water-stable aggregates [11,12,13,14,15]. However, very little research concentrated on forests. A number of studies performed in forests have focused primarily on the conversion of forests to savanna, cropland, or bare fallow land. Most of the results suggested that forest can protect and enhance SOC content and soil aggregate stability [16,17,18,19,20]. Nevertheless, there is a lack of information about the continuous maintenance of forest succession on carbon fractions and soil aggregation. Forest succession is a particular process of land cover change, during which the gradual succession of aboveground vegetation results in the change of litter quantities and qualities, root biomass, and soil properties, and these lead to changes of carbon in SOC fractions and water-stable aggregates.
The object of our work was to evaluate the dynamics of soil organic carbon fractions and aggregation along a forest succession gradient and to reveal the possible mechanisms of C accumulation and SOC protection in an old-growth forest. We studied a Dinghushan monsoon evergreen broadleaved forest (MEBF) and two of its successional forests, i.e., pine and broadleaved mixed forest (PBMF) and pine forest (PF), and measured the content of various carbon fractions and water-stable aggregates in each successional stage of the lower subtropical forest.
We hypothesized that: (1) SOC fractions, and particularly passive SOC, would continuously increase over forest succession; (2) forest succession would result in greater SOC within C-enriched water-stable macroaggregates; and (3) forest succession would improve the proportion of microaggregates, and this size class of aggregates would also improve the stability of SOC, because the particles in small aggregates (<250 μm) are bound by older and more stable forms of organic matter.

2. Materials and Methods

2.1. Site Description

This study was conducted at the Dinghushan Biosphere Reserve (DBR) (23°09′21″ N–23°11′30″ N, 112°30′39″ E–112°33′41″ E), an area of 1155 ha in southern China, about 90 km west of Guangzhou city. It has a typical subtropical monsoon humid climate with a mean annual temperature of 21 °C. The lowest monthly mean temperature is 12.6 °C in January and the highest is 28.0 °C in July. The average annual precipitation is 1927 mm, of which about 80% falls during the wet season between April and September. The bedrocks of DBR are classified as sandstone and shale belonging to the Devonian Period. Soils are classified in the Ultisol order and Udult suborder according to the USDA (United States Department Of Agriculture) soil classification system [21].
The DBR was established in 1950 to protect a remnant of undisturbed natural MEBF in the subtropics. In the reserve, we studied three forest communities, a pine forest, a pine and broadleaved mixed forest, and monsoon evergreen broadleaved forest, respectively. Previous studies show that they represent a sequence of forest succession from early pioneer, transition, to climax old-growth stages in the region [22,23,24]. During natural succession, heliophytes gradually invade the pine forests to form mixed forests, and mesophytes subsequently invade the mixed forests and eventually transform them into evergreen broadleaf forests [23,25]. The dominant species in tree strata are Pinus massoniana in the PF, Castanopsis chinensis, Pinus massoniana and Schima superba in the PBMF, and Castanopsis chinensis, Cryptocarya concinna, Schima superba, Machilus chinensis, and Cryptocarya chinensis in the MEBF [24,26]. According to 14C measurements of bulk soil organic carbon, Shen et al. state that PF, PBMF, and MEBF have a duration of soil genesis ranging approximately from 500 to 1000 years with maximum C-apparent ages of 2883, 5572, and 8663 aB.P., respectively. They further demonstrate that the δ13C values of soil organic carbon from the top (0–5 cm) ~40 cm layers vary by a range of –24.4~–20.1‰, –27.4~–24.1‰, and –27.5~–22.2‰, respectively, for PF, PBMF, and MEBF, while they remain steady for the 40 to 160 cm soil layers for all the study sites [27]. These support the sequence of successional stages with a rich assemblage of evergreen broadleaf tree species which are most native to the tropics and subtropics for climax MEBF, a gradual natural succession of some pioneer broadleaf species for transition PBMF [22,23], and a pioneer plantation community established by the dominant Pinus massoniana after 1950s clear-cutting of primary Masson pine trees for PF [28]. Table 1 presents some characteristics of the forest ecosystem studied.
Table 1. Characteristics of the three forests.
Forest TypeCoordinateForest Age (Years)Community Biomass (Mg ha1)
PF23°09′ N, 112°33′ E60122.5
PBMF23°10′ N, 112°32′ E110164.1
MEBF23°10′ N, 112°32′ E400290.4
PF: pine forest; PBMF: pine and broadleaved mixed forest; MEBF: monsoon evergreen broadleaf forest.

2.2. Soil Sampling and Treatments

In July 2011, we collected mineral soil samples from a south-facing slope nearby each of the three permanent experimental sites (10,000 m2 for each forest) that have been established since 1978. In each forest, after removing the surface litter layer, eight soil cores down to 60 cm were sampled from five random replicate plots of 20 m × 20 m in an area with a distance of at least 20 m from each other. This sampling approach was chosen in order to minimize the variation at each site. Each of the cores was separated into four layers, 0–15, 15–30, 30–45, and 45–60 cm, respectively. The eight cores from each layer were thoroughly mixed into a composite sample. There were 60 samples in total (three forests × five plots per forest × four soil layers per plot). The soil samples were placed in plastic bags, which were sealed and immediately taken to the laboratory. We divided each sample into two sub-samples. Half the sample was passed through a 2 mm sieve and air dried to determine the content of different carbon fractions, including active C, passive C, particulate organic matter carbon (POM-C), and nitrogen (POM-N). The other half of the soil sample was used for aggregate measurements. Soil was wet-sieved and separated into four aggregate classes (>2000 μm, 250–2000 μm, 53–250 μm, and <53 μm), and the SOC concentrations in micro-aggregates (<250 μm) and macro-aggregates (>250 μm) were assessed.

2.3. Laboratory Analyses and Calculations

2.3.1. SOC Fractions

Active SOC was determined using the KMnO4 oxidation method [29], in which soil samples containing about 15 mg SOC were put into 333 mmol·L−1 KMnO4 solution (25 mL), oscillated for 1 h to oxidize active SOC, then centrifuged for 5 min at 4000 × g, and the supernatants diluted 1:250 with deionized water. Blank samples, which contained no soil, were analyzed in each run. The absorbance of the samples and blanks were read on a split-beam spectrophotometer at 565 nm. The amount of active SOC was quantified by the amount of KMnO4 consumption. Passive SOC was measured using acid hydrolysis [30], putting 2 g of soil in a test tube containing 6 N HCl, boiling the soils for 16 h, and then washing the samples to a pH of 7.0 with distilled water; the samples were dried in an oven at 55 °C, and the carbon of these samples was quantified as passive SOC by using wet combustion. The slow SOC was defined as the difference between the SOC and the sum of active and passive SOC.

2.3.2. POM-C and POM-N from the Whole Soil

POM-C and POM-N (53–2000 μm) were measured using the method described by Cambardella and Elliott [31]. Twenty grams of the <2 mm air-dried soil was dispersed with 50 mL of 5 g·L−1 sodium hexametaphosphate solution by manually shaking the mixture for 5 min then setting it on a reciprocal shaker (90 rpm) for 15 h. The dispersed soil sample was passed subsequently through a 53 μm stainless steel sieve and rinsed thoroughly with distilled water. The material remaining on the sieve, defined as the particulate organic matter (POM) fraction, was dried at 50 °C to constant moisture contents, weighed, and finely ground to 0.15 mm for carbon and nitrogen measurement. Carbon was determined by titration with a Fe2+ solution after dichromate oxidation [32]. Nitrogen was determined by an Automatic N analyzer (the Kjeldhal K06 Full Auto Analyzer, Shanghai Shengsheng Automation Analysis Instruments Co., Ltd., Shanghai, China).

2.3.3. Water-Stable Aggregate Fractionation

A 100 g sample of air-dried bulk soil (passed through an 8 mm sieve) was placed on the top of a set of nested sieves (2000, 250, and 53 μm). Samples were slaked with deionized water for 30 min at 25 °C. The nested sieves were gently oscillated (3.8 cm amplitude of 30 strokes min−1) within a column of water for 30 min. Floating free particulate organic matter was removed during the wet sieving and not included in the analysis [33]. Four water-stable aggregate fractions were obtained: (i) large macroaggregates (>2 mm), (ii) small macroaggregates (0.25–2 mm), (iii) microaggregates (0.053–0.25 mm), and (iv) silt-plus clay-sized particles (<0.053 mm). All water-stable aggregate fractions were gently back-washed into an aluminum pan and dried at 50 °C to constant moisture contents [34]. Sand contents of all aggregate fractions were determined and aggregate weight percentages were corrected to make comparisons between soils with different sand contents [34].
Aggregate weight % = (Total fraction weight − same-sized sand weight in fraction)/∑ sand corrected weights.

2.3.4. SOC Concentration from the Bulk Soil and Each Aggregate Size Class

SOC concentrations from the bulk soil and from each water-stable aggregate size class were determined by titration with a Fe2+ solution after dichromate oxidation [32].

2.4. Statistical Analysis

Two-way analysis of variance (ANOVA) was used to examine the effect of forest types, soil depths, and forest type × soil depths on the proportion of water-stable aggregates and the content of aggregate particulate organic carbon. Duncan’s test was used to separate treatment means when the ANOVA was significant. Statistical significance was assessed at the p < 0.05 level. Pearson’s linear correlation coefficients were used to test the correlate relationship between SOC and the C concentration of different size-class aggregates. Data analyses including the correlation analysis were carried out using SPSS (Version 11.5, SPSS Inc., Chicago, IL, USA). Figures were plotted using Origin 8.

3. Results

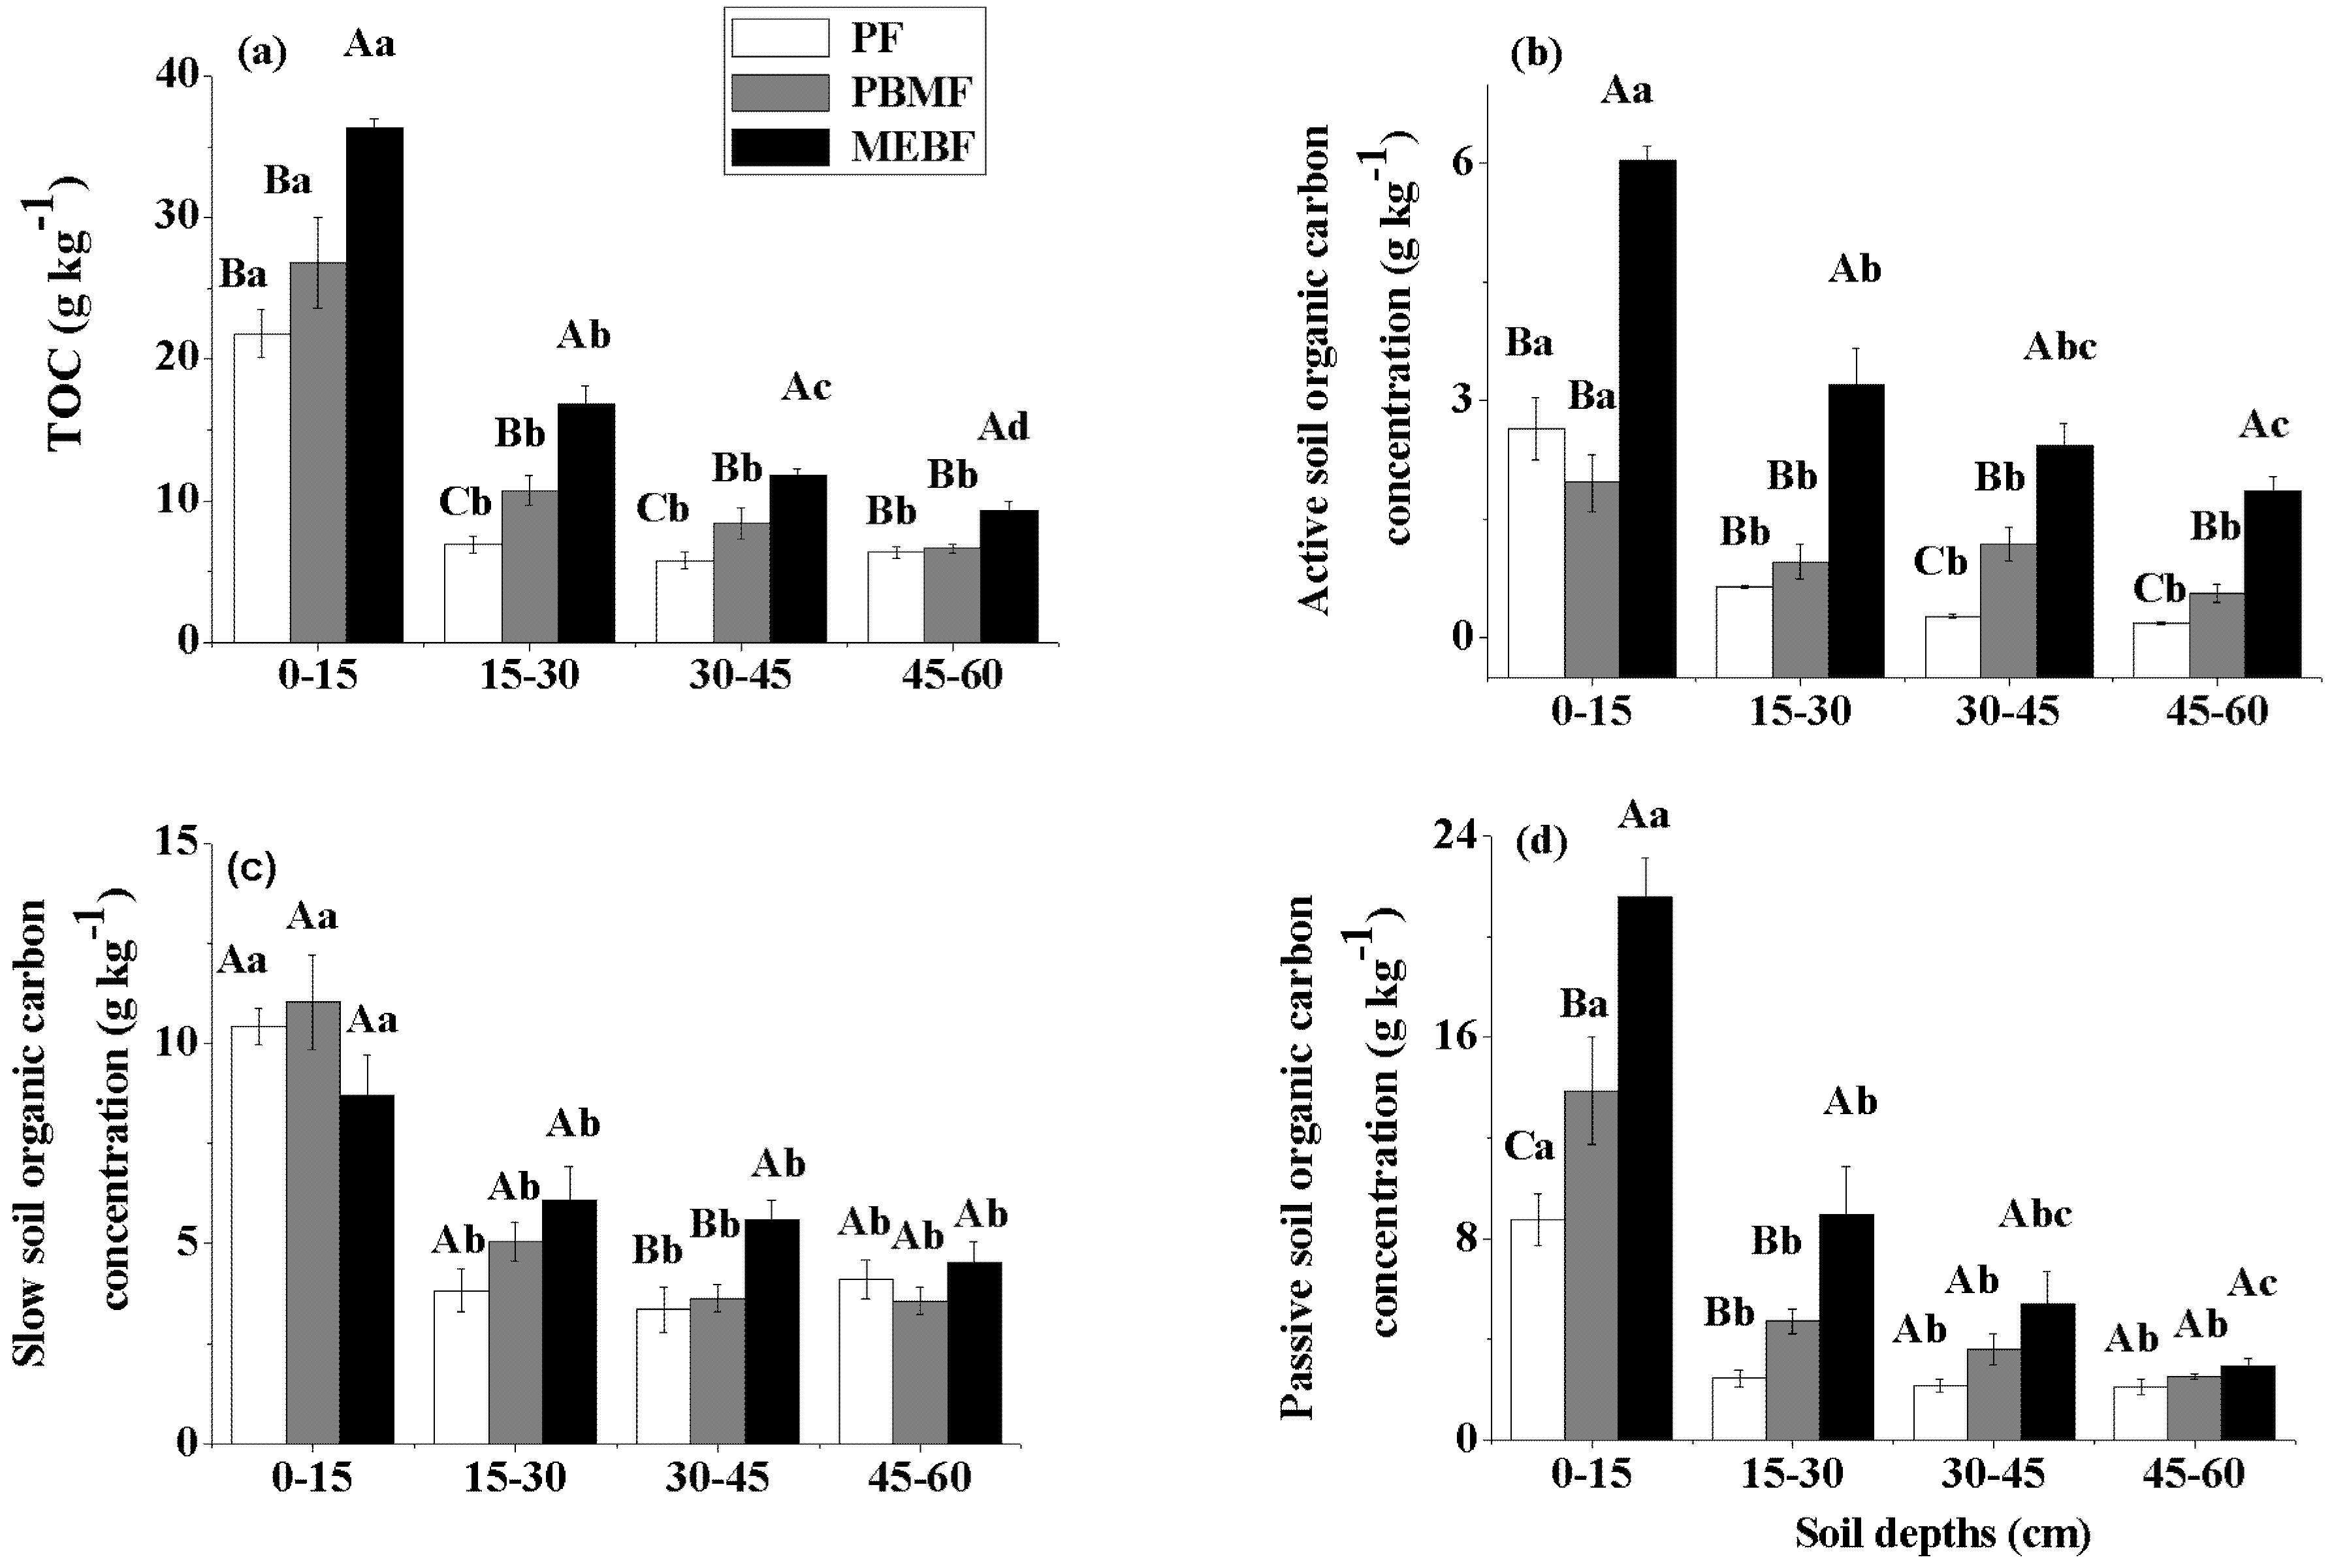
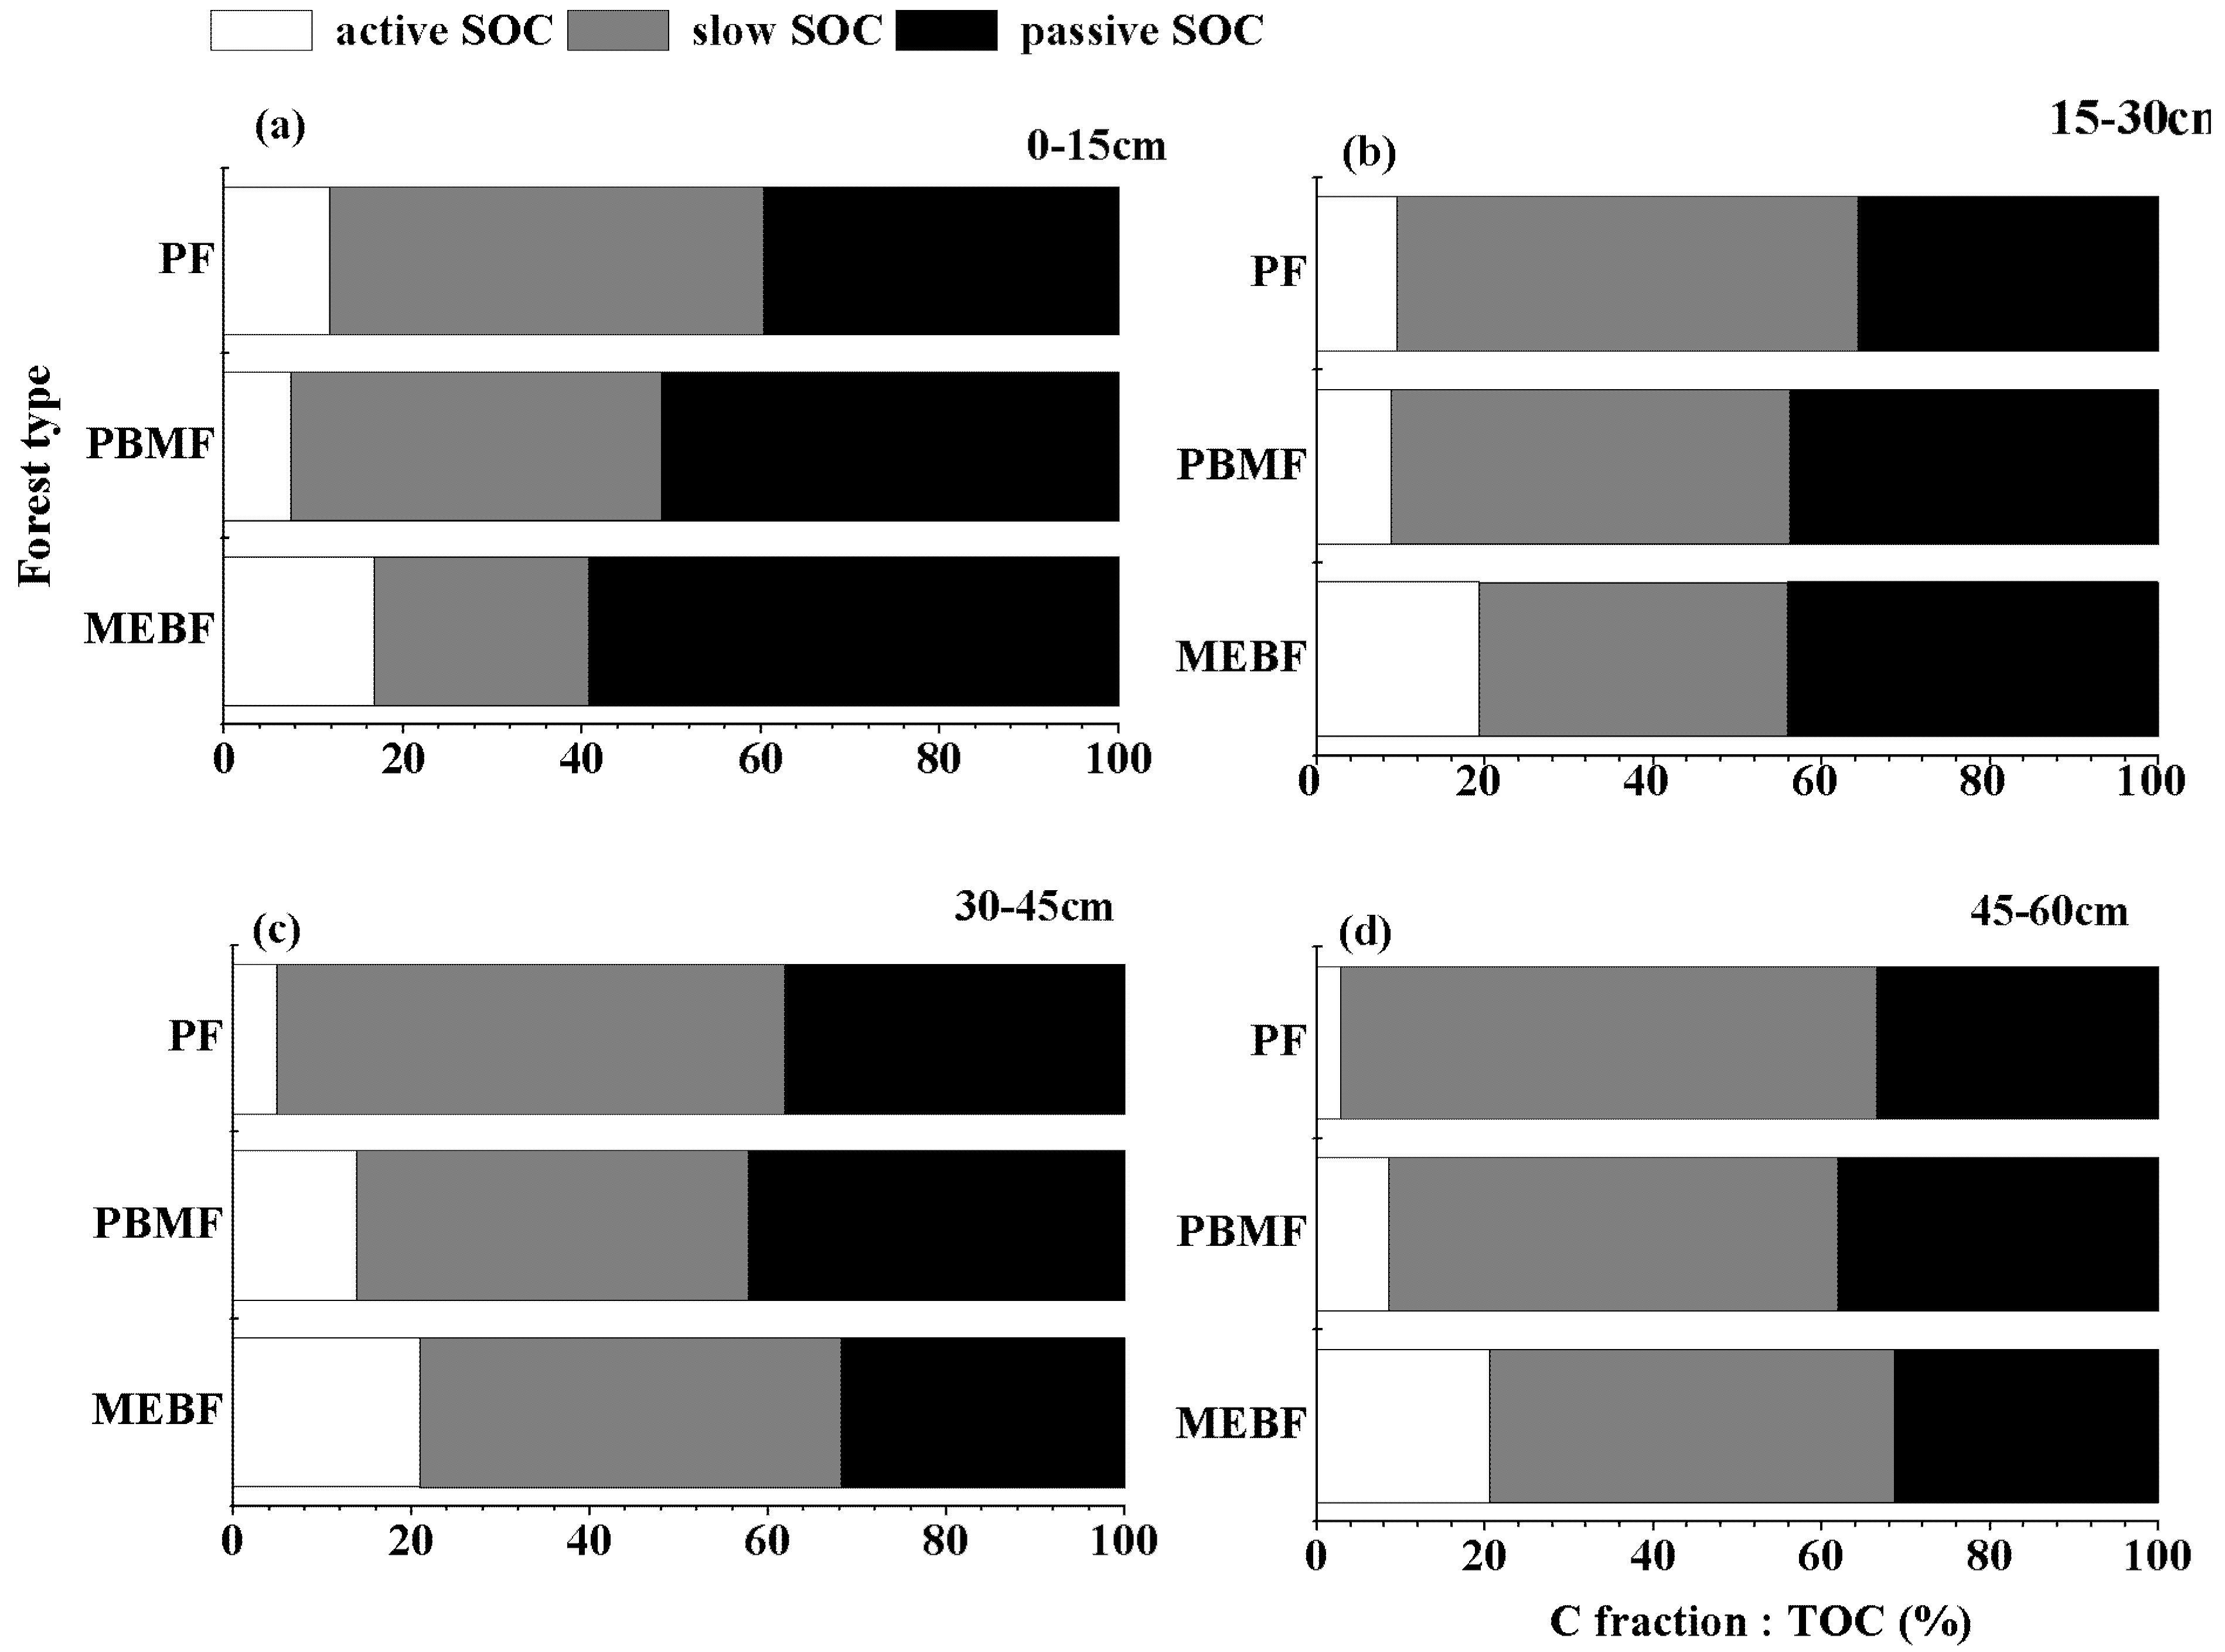
3.1. Organic Carbon Concentration in Soil Fractions
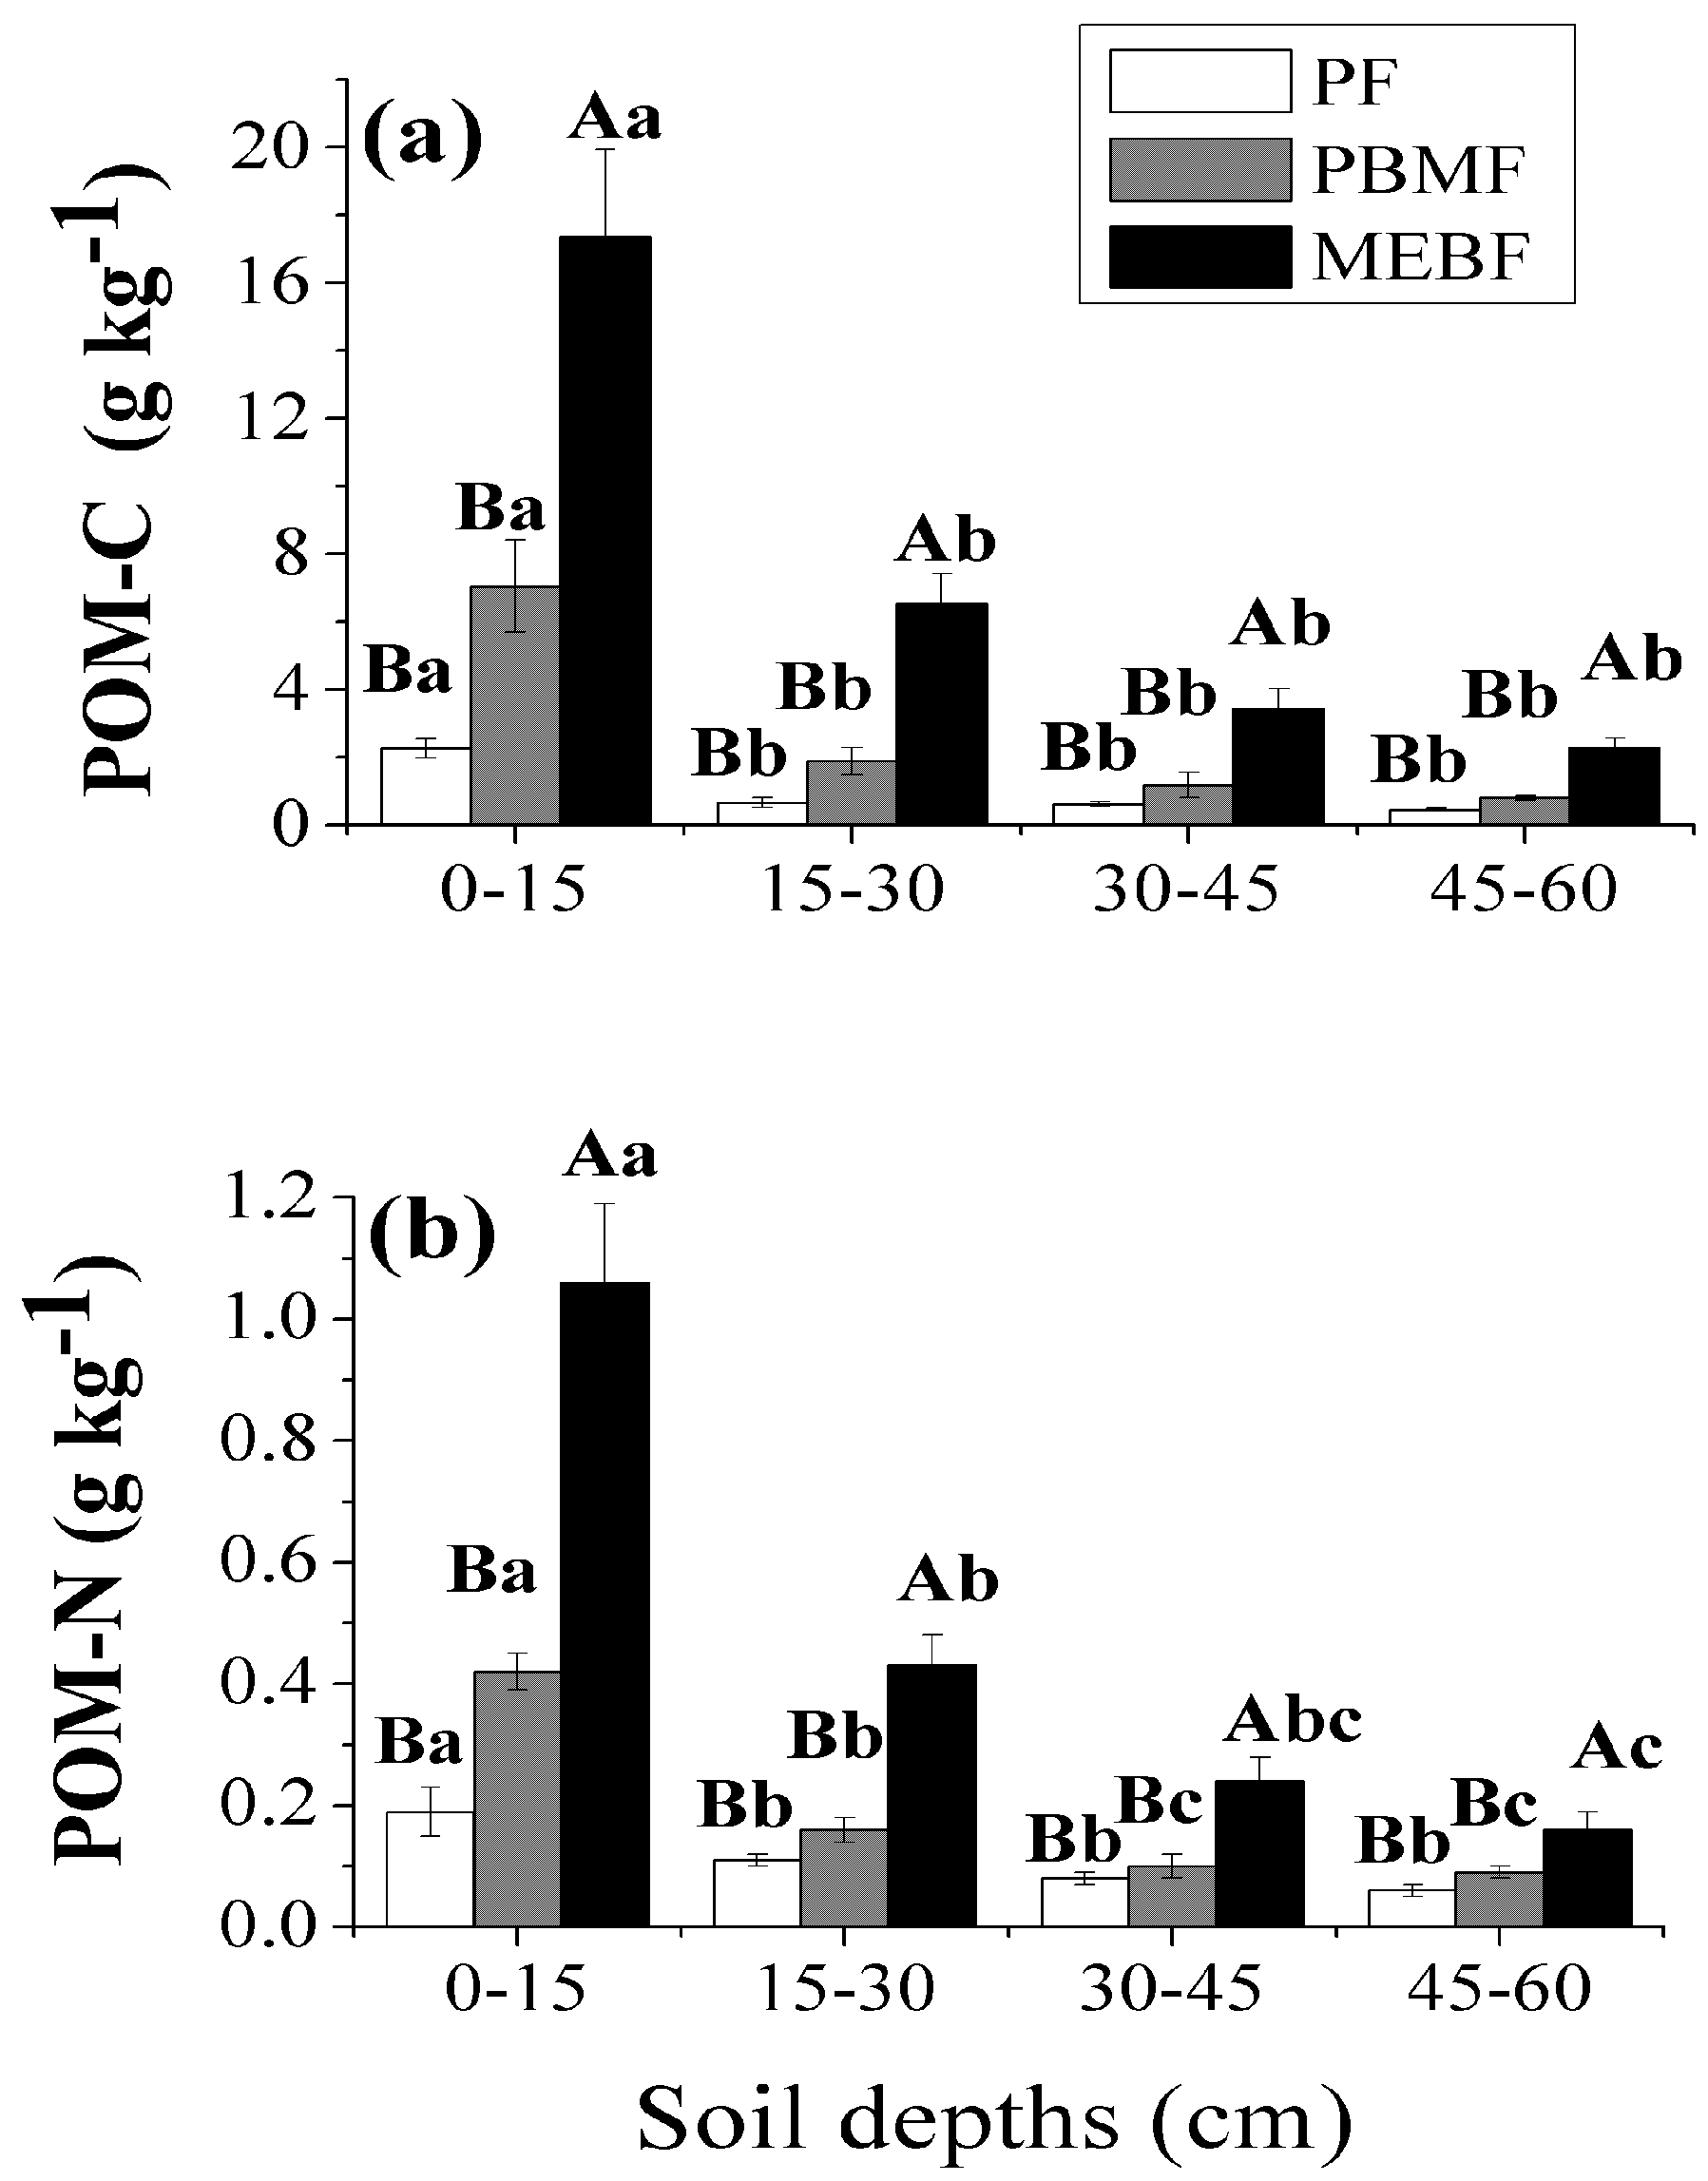
Results showed that forest type, soil depth, and their interaction significantly influenced total organic carbon (TOC), active SOC, and passive SOC. However, forest type did not affect slow SOC (Table 2). The concentration of TOC in the soils increased with forest succession. Total organic carbon concentrations were significantly higher in MEBF than in PBMF and PF (Figure 1).
Table 2. Significance of the effects of forest type, soil depths, and forest type × soil depths on the various soil organic carbon (C) fractions in the two-way analysis of variance (ANOVA).
TOCActive SOC Slow SOCPassive SOCPOM-CPOM-N
FPFPFPFPFPFP
Forest type44.70.00118.10.001.50.2429.20.0052.70.0064.90.00
Soil depth176.30.0068.00.0056.80.0077.40.0045.20.0052.30.00
Forest type × Soil depth4.00.007.30.003.00.025.80.0011.40.0014.70.00
TOC, total organic carbon; SOC, soil organic carbon; POM-C, particulate organic matter carbon; POM-N, particulate organic matter nitrogen; ANOVA, analysis of variance.
Figure 1. Total soil organic carbon (TOC) (a); active soil organic carbon (SOC) (b); slow SOC (c); and passive SOC (d) concentrations in the three forests. Different uppercase letters indicate a significant difference between different stages of forest succession at p < 0.05. For the same forest and SOC fraction, different lowercase letters indicate significant differences between depths at p < 0.05. PF: pine forest; PBMF: pine and broadleaved mixed forest; MEBF: monsoon evergreen broadleaf forest.
Forests 06 02703 g001
Forest succession also influenced the C fractions (Figure 1). Active SOC increased with forest succession (Figure 1b). The concentrations of active SOC among the three forests were significantly different in the order of PF < PBMF < MEBF, but there was no significant difference between PF and PBMF in 0–15 cm and 15–30 cm (Figure 1b). The significant difference of slow SOC content among the three forests was only found at the 30–45 cm depth, and also in the order of PF < PBMF < MEBF (Figure 1c). The passive SOC content among the three forests was significantly different at the 0–15 and 15–30 cm depths. In 0–15 cm, the passive SOC in MEBF was 35.7% and 59.4% higher than PBMF and PF. In 15–30 cm, the passive SOC in MEBF was 47.6% and 72.6% higher than PBMF and PF (Figure 1d).
Average concentrations of TOC, active SOC, slow SOC, and passive SOC all decreased with soil depth (Figure 1). In PF and PBMF, TOC, active SOC, slow SOC, and passive SOC concentrations were significantly higher at 0–15 cm compared with the other three soil depths, but there were no significant differences found among the depths of 15–30 cm, 30–45 cm, and 45–60 cm (Figure 1).
The proportion of active SOC to TOC increased with forest succession (Figure 2). However, the slow SOC proportion decreased with succession, so that MEBF had the least slow SOC proportion. While the passive SOC proportion also increased with forest succession, the significant difference was only found in 0–15 cm.
Figure 2. The proportions of different carbon (C) fractions to total organic carbon (TOC) in the three forests. PF: pine forest; PBMF: pine and broadleaved mixed forest; MEBF: monsoon evergreen broadleaf forest.
Forests 06 02703 g002

3.2. POM-C and POM-N from the Whole Soil

The concentrations of POM-C and POM-N significantly increased along forest succession in all of the soil layers (Table 2; Figure 3). Especially in the 0–15 cm soil layer, the POM-C concentration in PF, PBMF, and MEBF was 2.3, 7.0, and 17.4 g kg−1, respectively. Moreover, in 0–15 cm, the POM-N concentrations in PF, PBMF, and MEBF were 0.2, 0.4, and 1.1, g kg−1, respectively. Along the soil profile, the content of POM-C at the 0–15 cm depth was significantly higher than other soil layers, but there were no significant differences among the other three depths. The content of POM-N in PF had the same trend as POM-C.
Figure 3. The concentration of particulate organic matter carbon (POM-C) (a) and nitrogen (POM-N) (b) from the whole soil in the three forests. Different uppercase letters indicate significant differences between different forests at p < 0.05. For the same forest and particulate organic matter (POM) fraction, different lowercase letters indicate significant differences between depths at p < 0.05. PF: pine forest; PBMF: pine and broadleaved mixed forest; MEBF: monsoon evergreen broadleaf forest.
Forests 06 02703 g003

3.3. The Proportion of Water-Stable Aggregates in Soil

Our results showed that forest type, soil depth, and their interaction significantly affected the proportion of >2000 μm aggregates (p < 0.01). However, soil depth affected the 250–2000 μm and <53 μm water-stable aggregates fractions significantly (p < 0.01) (Table 3). In the 0–15 cm and 15–30 cm soil depths, the proportion of water-stable aggregates significantly differed in >2000 μm among the three forests (Table 4). The proportion of the >2000 μm water-stable aggregates fraction in MEBF was significantly higher than in PBMF and PF. In the 30–45 cm depth, there was no significant difference in all size classes among the forests. In the 45–60 cm soil depth, the proportion of water-stable aggregates significantly increased in <53 μm with forest succession. The proportion of the <53 μm water-stable aggregates fraction in MEBF was 72.6% and 19.2% higher than in PF and PBMF.
Table 3. Significance of the effects of forest type, soil depths, and forest type × soil depths on the proportion of water-stable aggregates in the two-way analysis of variance (ANOVA).
>2000 μm250–2000 μm53–250 μm<53 μm
FPFPFPFP
Forest type18.90.003.40.040.10.902.10.13
Soil depths57.40.002.50.078.70.0014.90.00
Forest type × Soil depths4.00.000.90.500.90.531.60.16
F and P was used to denote the significance.
Table 4. The proportion of dry soil weight of different size class aggregates in the three forests.
Soil Depth (cm)Forest Type% of Dry Soil Weight of Different Size Class Aggregates
>2000 μm250–2000 μm53–250 μm<53 μm
0–15PF18.2 ± 4.7 B66.8 ± 3.4 A11.1 ± 1.6 A4.0 ± 0.6 A
PBMF26.2 ± 4.1 B62.9 ± 5.3 A6.7 ± 1.2 A4.3 ± 0.4 A
MEBF40.7 ± 4.6 A46.3 ± 6.6 B6.6 ± 1.4 A6.4 ± 3.3 A
15–30PF7.4 ± 2.2 B75.1 ± 2.5 A14.3 ± 3.3 A3.3 ± 0.6 A
PBMF4.9 ± 1.9 B72.3 ± 4.3 A14.2 ± 1.0 A8.6 ± 3.2 A
MEBF14.5 ± 1.9 A64.2 ± 4.3 A15.1 ± 3.3 A6.2 ± 1.1 A
30–45PF3.9 ± 1.4 A68.1 ± 6.3 A21.5 ± 6.0 A6.5 ± 2.7 A
PBMF3.0 ± 1.1 A67.9 ± 3.4 A21.8 ± 2.7 A7.30 ± 0.8 A
MEBF10.0 ± 3.5 A68.3 ± 4.1 A14.6 ± 1.1 A7.1 ± 1.2 A
45–60PF2.5 ± 0.9 A75.6 ± 4.8 A17.7 ± 4.0 A4.2 ± 0.9 B
PBMF1.7 ± 0.5 A69.1 ± 3.1 A21.9 ± 3.5 A7.3 ± 0.2 AB
MEBF4.5 ± 1.8 A63.4 ± 4.1 A23.4 ± 3.8 A8.7 ± 1.6 A
For a given forest and water-stable aggregate fractions, different uppercase letters indicate a significant difference between forests at p < 0.05. PF: pine forest; PBMF: pine and broadleaved mixed forest; MEBF: monsoon evergreen broadleaf forest.

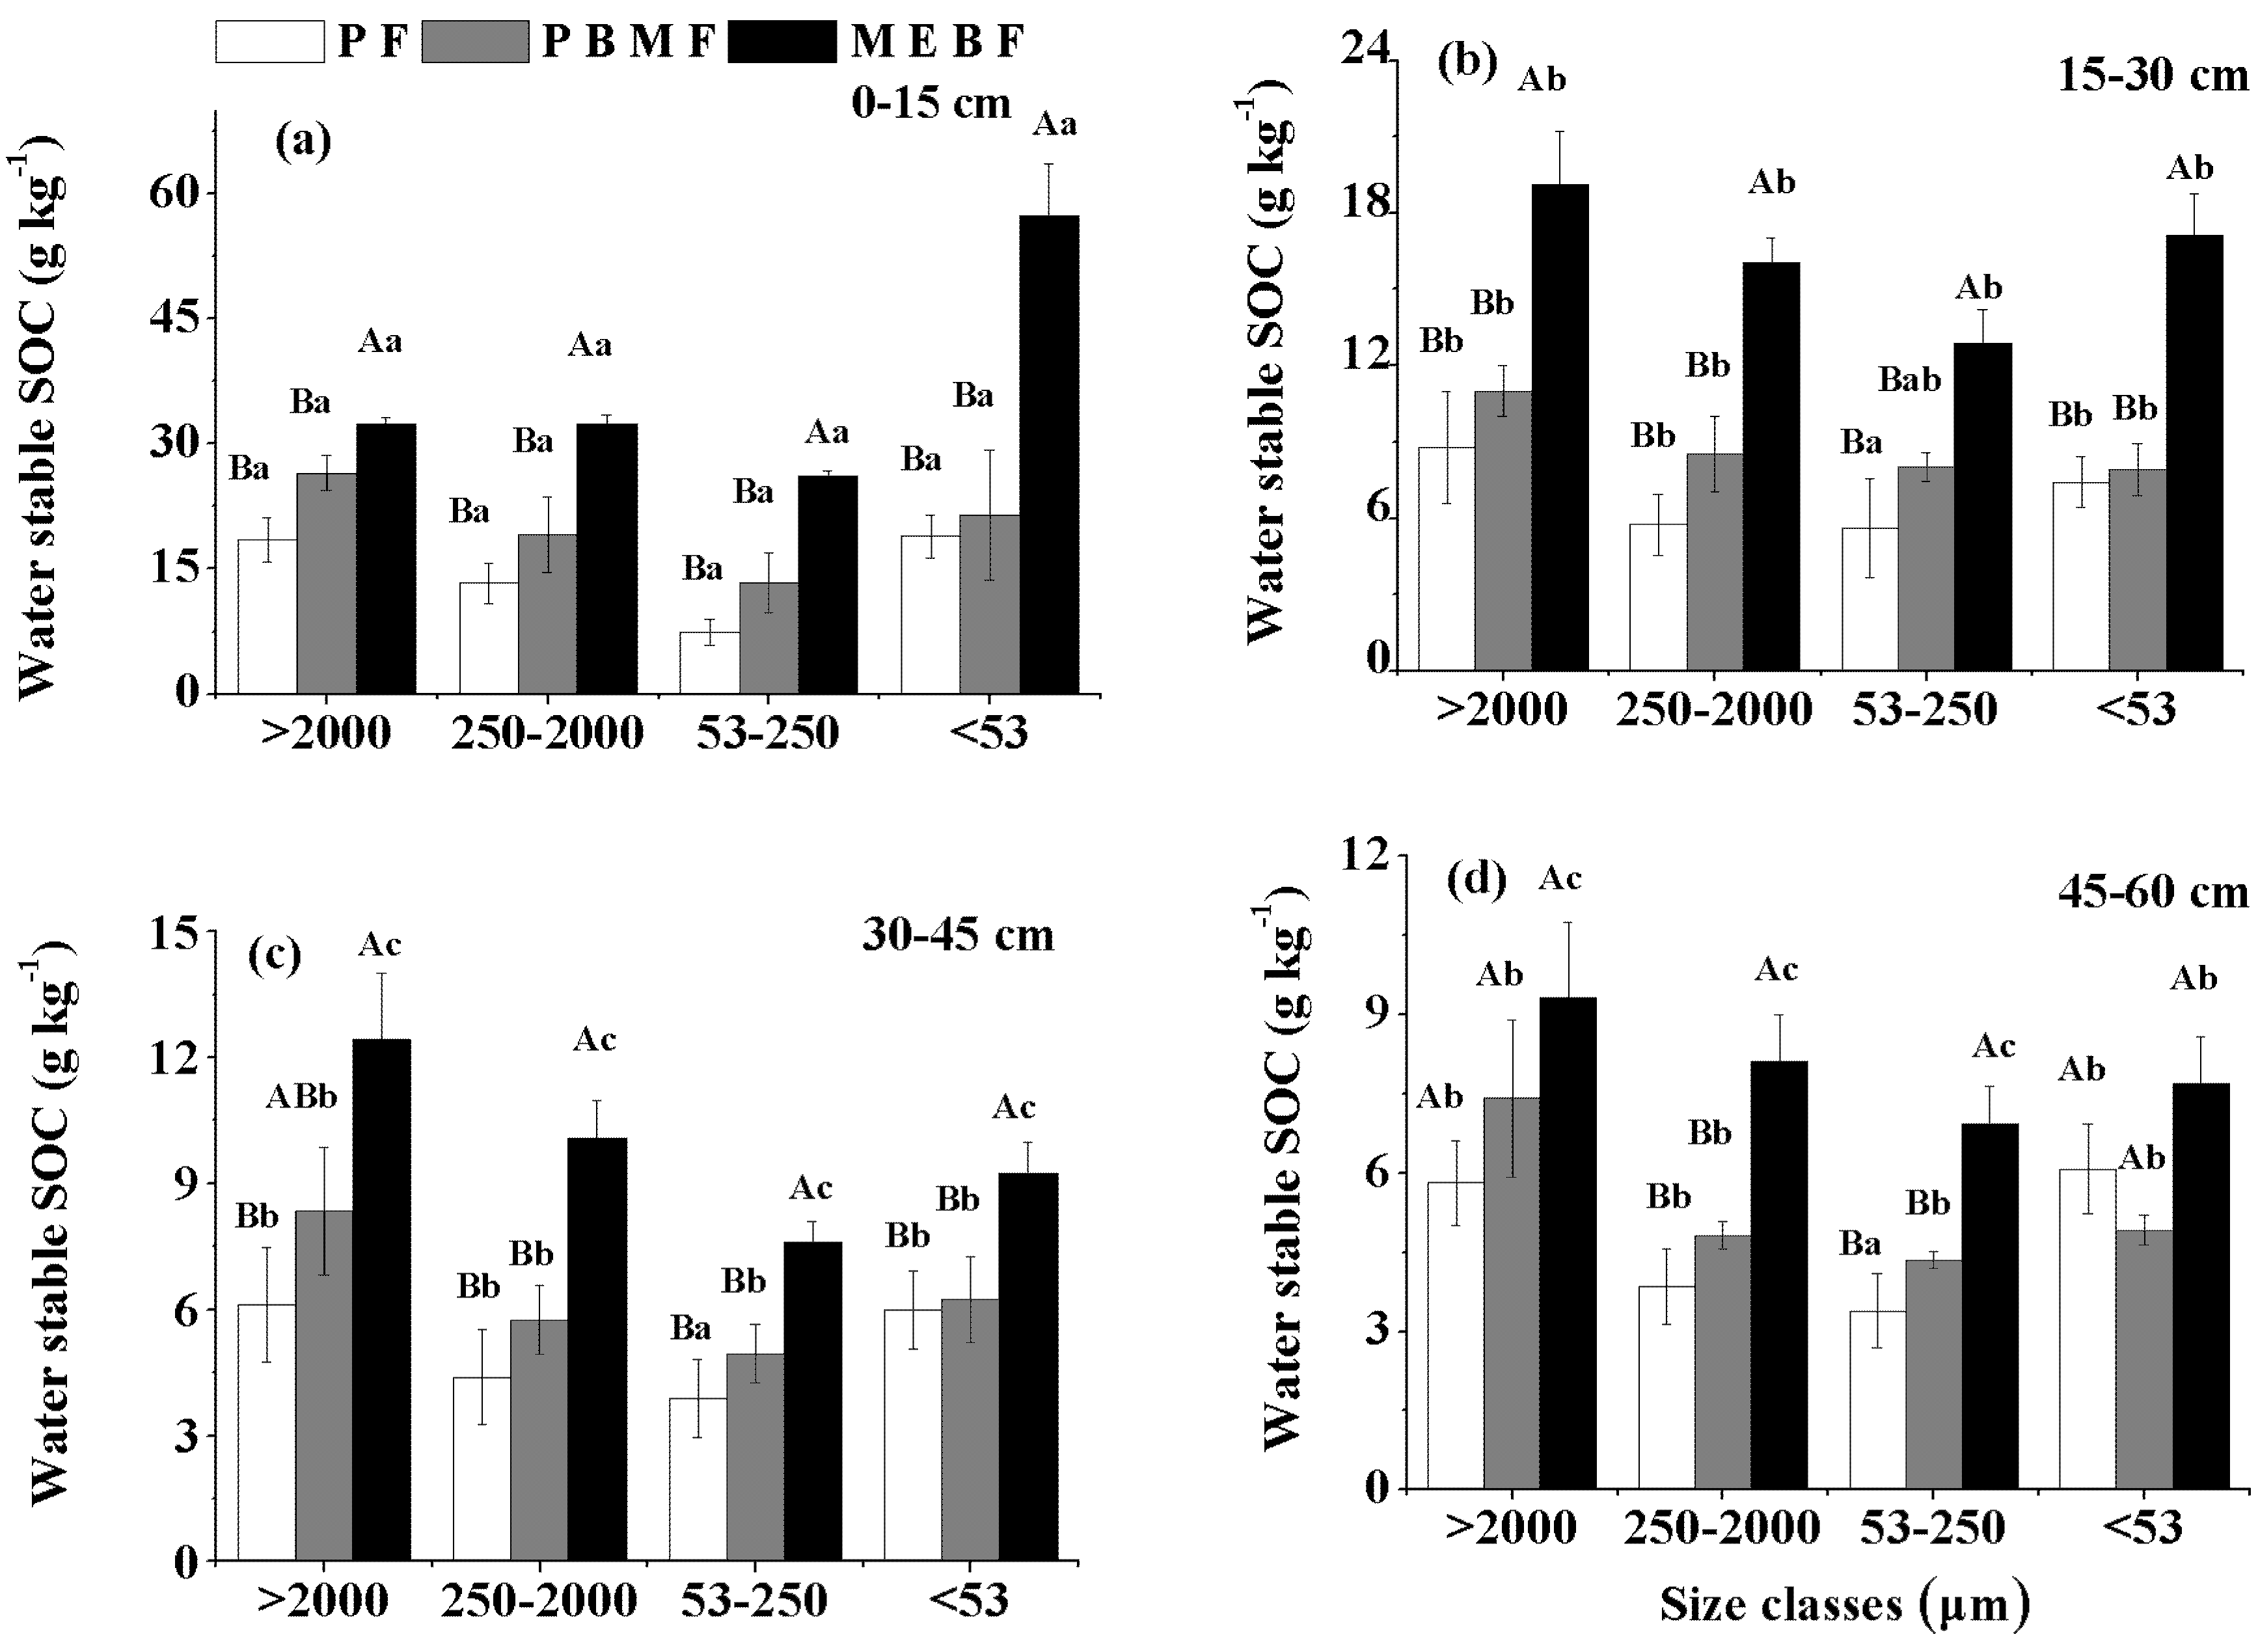
3.4. Sand-Free SOC Concentration in Water-Stable Aggregates

Water-stable aggregate size classes in the 0–15, 15–30, and 30–45 cm soil depths were significantly increased with forest succession in the order PF < PBMF < MEBF (Table 5; Figure 4). In the 45–60 cm soil depth, however, only the small macroaggregate and microaggregate concentrations increased with succession. Along the soil depths, water-stable aggregate SOC concentrations significantly declined with an increase in soil depth (except the size class of 53–250 μm in PF).
Table 5. Significance of the effects of forest type, soil depths, and forest type × soil depths on the content of water-stable aggregate particulate organic carbon in the two-way analysis of variance (ANOVA).
>2000 μm250–2000 μm53–250 μm<53 μm
FPFPFPFP
Forest type14.10.0034.10.0036.10.0023.90.00
Soil depths51.90.0053.30.0036.30.0045.30.00
Forest type × Soil depths1.30.283.90.006.60.009.90.00
F and P was used to denote the significance.
Figure 4. Sand-free soil organic carbon (SOC) concentration in all water-stable aggregate fractions in 0–15 cm (a); 15–30 cm (b); 30–45 cm (c); and 45–60 cm (d) in a forest succession. Error bars represent standard deviation. PF: pine forest; PBMF: pine and broadleaved mixed forest; MEBF: monsoon evergreen broadleaf forest. Different uppercase letters indicate significant differences between treatments at p < 0.05. For the same forest and aggregate fraction, different lowercase letters indicate significant differences between depths at p < 0.05.
Forests 06 02703 g004

3.5. Relationship between SOC Fractions and Water-Stable Aggregation

Significant linear relationships were found between TOC concentration and the proportion of water-stable aggregate fractions for the three forests studied (Table 6). The proportions of large macroaggregates (>2 mm) were positively related with TOC and various carbon fraction concentrations, whereas small macroaggregates’ and microaggregates’ proportions were negatively related with SOC fractions.
Table 6. Pearson’s coefficients of correlation (R) between the various soil organic carbon (C) fractions and the proportion of water-stable aggregates (n = 5). Water-stable large macroaggregates (>2000 μm), small macroaggregates (250–2000 μm), microaggregates (53–250 μm), and silt-plus clay-sized particles (<53 μm) for the three forests.
Water-Stable Aggregate Size (μm)Active SOCSlow
SOC
Passive SOCPOM-CPOM-N
>2000250–200053–250<53
TOC 0.892 **−0.551 **−0.561−0.0460.836 **0.820 **0.954 **0.868 **0.851 **
Active SOC 0.760 **−0.572 **−0.370 **−0.035 0.532 **0.824 **0.820 **0.831 **
Slow SOC0.667 **−0.251−0.566 **−0.191 0.681 **0.507 **0.488 **
Passive SOC0.914 **−0.630 **−0.516 **0.019 0.909 **0.888 **
POM-C0.845 **−0.625 **−0.471 **0.130 0.981 **
POM-N0.849 **−0.608 **−0.487 **0.102
TOC, total organic carbon; SOC, soil organic carbon; POM-C, particulate organic matter carbon; POM-N, particulate organic matter nitrogen; **: p < 0.01.

4. Discussion

4.1. Change of Various C Fractions along Forest Succession Gradient

Our results found that the concentration of active C, slow C, passive C, POM-C, and POM-N all increased with forest succession (Figure 1 and Figure 3). This finding was consistent with our hypothesis and there is considerable evidence for this in previous studies. Côté et al. [35] found soil carbon and nitrogen mineralization are related to forest type and age. Jia et al. [36] suggested soil organic carbon and total nitrogen increased quickly with secondary forest succession. This result can be attributed to the following three reasons. First, to our knowledge, the more litter input the greater the carbon storage. In our experimental site, the above-ground biomass in PF, PBMF, and MEBF was 122.5, 164.1, and 290.4 Mg ha−1, respectively [37]. The litter input in PF, PBMF, and MEBF was 3.31, 8.50, and 8.28 Mg ha−1 year−1, respectively. In addition, there was a significant difference in the rate of surface litter decomposition among the three forests; the greatest was in MEBF, the lowest was in PF, and PBMF was intermediate [38]. These result in the greater concentration of organic carbon in MEBF [39]. Second, root turnover is the major resource of soil C. Some studies have found an increase in root biomass and root tip abundance in the fine root system with the increasing age of old-growth forest [40]. Accordingly, the higher TOC and C fraction concentrations in MEBF likely result from major input to soil organic matter from the decomposition of dead tree roots.
Additionally, our results showed a significantly higher proportion of passive C in MEBF and PBMF than in PF in surface soils (0–15 cm and 15–30 cm) (Figure 2d), but a higher proportion of active C in deep soil layers (30–45 cm and 45–60 cm) (Figure 2b). There may be two reasons to explain this result. First, increased above-ground litter results in overall positive mineral soil priming. Total soil C and passive C increased with added litter [41]. Therefore, in our study site, as the amount of litterfall increased along the successional gradient, the passive C increased correspondingly. Second, more than 70% of the fine root mass was concentrated in the top 20 cm of soil [42,43]. Thus a large amount of litter falling on the soil surface and root necromass in the surface soil increased the accumulation of passive C in the MEBF and PBMF [37,44]. Why did the proportion of active C fraction increase in the deep soils in the middle and late stages of forest succession? Fontaine et al. [45] showed that the supply of fresh plant-derived carbon to the subsoil stimulated the microbial mineralization of 2567 ± 226-year-old carbon. Any change in land use and agricultural practice that increases the distribution of fresh carbon along the soil profile could, however, stimulate the loss of ancient buried carbon [45]. Thus, in our experiment, the increasing in root biomass in the middle and late stages of forest succession probably delivers fresher C to the subsoil and stimulates microbe activity. Finally, it resulted in the increase of active C in the deep soil of PBMF and MEBF.

4.2. Change of Soil Aggregation and Organic C Protection along Forest Succession Gradient

Quantification of SOC content in the different fraction size classes showed that the highest concentration of particulate organic carbon in water-stable aggregates was found in MEBF, then PBMF, and, lastly, PF. Furthermore, we observed that for the surface soil (0–15 cm and 15–30 cm), the proportion of large macroaggregates (>2 mm) increased with forest succession. However, in the deeper soil (45–60 cm), small macroaggregate (0.25–2 mm) proportion decreased with succession but the silt- and clay-size fraction (<0.053 mm) increased with the increasing age of the forest. As suggested earlier by Monnier [46], the formation of stable macroaggregates is strongly linked to soil organic matter dynamics. Our results are consistent with this. The result may be attributed to the various arbuscular mycorrhizal fungi (AMF) species in the different stages of forest succession. A large number of studies reported that there is a positive correlation between AMF hyphae and aggregate stabilization in natural systems [47,48,49]. Thus, in our experiment, the middle and late stages of forest succession probably enhance AMF diversity [50] so that it improves the proportion of macroaggregates (>2 mm) in the surface soil. Furthermore, in our study, we found that the proportions of large macroaggregates (>2 mm) were positively related with TOC and various carbon fraction concentrations. Thus, the proportion of large macroaggregates (>2 mm) in the surface soil increased with forest succession, which could contribute to promote SOC accumulation in old-growth forest. Although the proportion of silt-plus-clay aggregates is negatively related to the SOC content, it plays an important role in the protection and stabilization of soil C. Six et al. [51] suggested that silt- and clay-protected soil organic matter (SOM) is one of the three protected SOM pools. The C in this smallest fraction size is more stabilized than the other size classes [48,52,53]. The stabilization of soil organic C by association with silt- and clay-sized particles is directly related to the silt-plus-clay content of the soil [51]. Thus, in our experiment, the higher proportion and content of silt-plus-clay aggregate in the deep soil (45–60 cm) in MEBF might improve the stabilization of SOC in this old forest.
Generally, water-stable aggregates provide physical protection for C and reduce soil erodibility [33]. The formation of these aggregates is enhanced by root and faunal activity. Root penetration decreases the proportion of relatively unstable macroaggregates but increases the proportion of relatively stable microaggregates [54]. In our study site, the fine root biomass increased with the forest age [44]. Therefore, the greatest fine roots in MEBF probably influenced the soil structure around the roots and induced the formation of microaggregates.

5. Conclusions

In conclusion, various carbon fractions and the percentage of active and passive carbon to TOC increased with forest succession. The percentage of water-stable aggregates in >2000 μm (0–15 and 15–30 cm) and <53 μm (45–60 cm) in the late stage of forest succession was higher than this in the early and middle stages. The increasing carbon fractions and the increasing proportion of macroaggregates in topsoil in the late stage of forest succession were contributed to the accumulation of carbon storage, and the increasing proportion of silt- and clay-size fraction improved the stability of SOC. Thus, it is of great importance to study the mechanisms and significance of water relations and soil stability in forest environments.

Acknowledgments

This work was funded by the Strategic Priority Research Program—Climate Change: Carbon Budget and Relevant Issues of the Chinese Academy of Sciences (No. XDA05050205) and the National Natural Science Foundation of China (No. 31100411). Yu Wang and Qiandong Zhu (Jinan University) are gratefully acknowledged for the field assistance in soil sampling. We also thank Lianping Wen and Jiaqian Chen for their assistance during laboratory analyses.

Author Contributions

Huimin Xiang is the lead author. She participated in the study design and modification, and field work along with her supervisor, Dazhi Wen. Lingling Zhang was responsible for all the data analyses. Huimin Xiang did all the laboratory analyses. Dazhi Wen was responsible for the initial study design and study establishment.

Conflicts of Interest

The authors declare no conflict of interest.

References

  1. Parton, W.J.; Schimel, D.S.; Cole, C.V.; Ojima, D.S. Analysis of factors controlling soil organic matter levels in great plains grasslands. Soil Sci. Soc. Am. J. 1987, 51, 1173–1179. [Google Scholar] [CrossRef]
  2. Chen, X.M.; Liu, J.X.; Deng, Q.; Yan, J.H.; Zhang, D.Q. Effects of elevated CO2 and nitrogen addition on soil organic carbon fractions in a subtropical forest. Plant Soil 2012, 357, 25–34. [Google Scholar] [CrossRef]
  3. Guenet, B.; Sabrina, J.; Bardoux, G.; Abbadie, L.; Chenu, C. Evidence that stable C is as vulnerable to priming effect as is more labile C in soil. Soil Biol. Biochem. 2012, 52, 43–48. [Google Scholar] [CrossRef]
  4. Amezketa, E. Soil aggregate stability: A review. J. Sustain. Agric. 1999, 14, 83–151. [Google Scholar] [CrossRef]
  5. Bronick, C.J.; Lal, R. Soil structure and management: A review. Geoderma 2005, 124, 3–22. [Google Scholar] [CrossRef]
  6. Elliott, E.T. Aggregate structure and carbon, nitrogen, and phosphorus in native and cultivated soils. Soil Sci. Soc. Am. J. 1986, 50, 627–633. [Google Scholar] [CrossRef]
  7. Chaney, K.; Swift, R.S. The influence of organic matter on aggregate stability in some British soils. J. Soil Sci. 1984, 35, 223–230. [Google Scholar] [CrossRef]
  8. Oades, J.M. Soil organic matter and structural stability mechanisms and implications for management. Plant Soil 1984, 76, 319–337. [Google Scholar] [CrossRef]
  9. Angers, D.A. Changes in soil aggregation and organic carbon under corn and alfalfa. Soil Sci. Soc. Am. J. 1992, 56, 1244–1249. [Google Scholar] [CrossRef]
  10. Besnard, E.; Chenu, C.; Balesdent, J.; Puget, P.; Arrouaya, D. Fate of particulate organic matter in soil aggregates during cultivation. Eur. J. Soil Sci. 1996, 47, 495–503. [Google Scholar] [CrossRef]
  11. Veum, K.S.; Goyne, K.W.; Kremer, R.; Motavalli, P.P. Relationships among water stable aggregates and organic matter fractions under conservation management. Soil Sci. Soc. Am. J. 2012, 76, 2143–2153. [Google Scholar] [CrossRef]
  12. Zhao, H.; Lv, Y.Z.; Wang, X.K.; Zhang, H.L.; Yang, X.M. Tillage impacts on the fractions and compositions of soil organic carbon. Geoderma 2012, 189, 397–403. [Google Scholar] [CrossRef]
  13. Andruschkewitsch, R.; Geisseler, D.; Koch, H.J.; Ludwig, B. Effects of tillage on contents of organic carbon, nitrogen, water-stable aggregates and light fraction for four different long-term trials. Geoderma 2013, 192, 368–377. [Google Scholar] [CrossRef]
  14. Linsler, D.; Geisseler, D.; Loges, R.; Taube, F.; Ludwig, B. Temporal dynamics of soil organic matter composition and aggregate distribution in permanent grassland after a single tillage event in a temperate climate. Soil Tillage Res. 2013, 126, 90–99. [Google Scholar] [CrossRef]
  15. Plaza-Bonilla, D.; Cantero-Martínez, C.; Vinas, P.; Alvaro-Fuentes, J. Soil aggregation and organic carbon protection in a no-tillage chronosequence under Mediterranean conditions. Geoderma 2013, 193–194, 76–82. [Google Scholar] [CrossRef] [Green Version]
  16. Singh, S.; Singh, J.S. Microbial biomass associated with water-stable aggregates in forest, savanna and cropland soils of a seasonally dry tropical region, India. Soil Biol. Biochem. 1995, 27, 1027–1033. [Google Scholar] [CrossRef]
  17. Singh, S.; Singh, J.S. Water-stable aggregates and associated organic matter in forest, savanna and cropland soils of a seasonally dry tropical region, India. Biol. Fertil. Soils 1996, 22, 76–82. [Google Scholar] [CrossRef]
  18. Spaccini, R.; Zena, A.; Igwe, C.A.; Mbagwu, J.S.C.; Piccolo, A. Carbohydrates in water-stable aggregates and particle size fractions of forested and cultivated soils in two contrasting tropical ecosystems. Biogeochemistry 2001, 53, 1–22. [Google Scholar] [CrossRef]
  19. Caravaca, F.; Lax, A.; Albaladejo, J. Aggregate stability and carbon characteristics of particle-size fractions in cultivated and forested soils of semiarid Spain. Soil Tillage Res. 2004, 78, 83–90. [Google Scholar] [CrossRef]
  20. An, S.S.; Mentler, A.; Mayer, H.; Blum, W.E.H. Soil aggregation, aggregate stability, organic carbon and nitrogen in different soil aggregate fractions under forest and shrub vegetation on the Loess Plateau, China. Catena 2010, 81, 226–233. [Google Scholar] [CrossRef]
  21. Buol, S.W.; Southard, R.J.; Graham, R.C.; McDaniel, P.A. Soil Genesis and Classification, 5th ed.; Iowa State University Press: Iowa, IA, USA, 2003; pp. 339–347. [Google Scholar]
  22. Wang, B.S.; Ma, M.J. The successions of the forest community in Dinghushan. Trop. Subtrop. For. Ecosyst. Res. 1982, 1, 142–156. (In Chinese) [Google Scholar]
  23. Peng, S.L.; Wang, B.S. Forest succession at Dinghushan, Guangdong, China. J. Trop. Subtrop. Bot. 1992, 7, 75–80. (In Chinese) [Google Scholar]
  24. Kong, G.H.; Huang, Z.L.; Zhang, Q.M.; Liu, S.Z.; Mo, J.M.; He, D.Q. Type, structure, dynamics and management of the lower subtropical evergreen broad-leaved forest in the Dinghushan Biosphere Reserve of China. Tropics 1997, 6, 335–350. [Google Scholar] [CrossRef]
  25. Tang, X.L.; Liu, S.G.; Zhou, G.Y.; Zhang, D.Q.; Zhou, C.Y. Soil-atmospheric exchange of CO2, CH4, and N2O in three subtropical forest ecosystems in southern China. Global Chang. Biol. 2006, 12, 546–560. [Google Scholar] [CrossRef]
  26. Yan, J.H.; Zhang, D.Q.; Zhou, G.Y.; Liu, J.X. Soil respiration associated with forest succession in subtropical forests in Dinghushan Biosphere Reserve. Soil Biol. Biochem. 2009, 41, 991–999. [Google Scholar] [CrossRef]
  27. Shen, C.D.; Yi, W.X.; Sun, Y.M.; Xing, C.P.; Yang, Y.; Peng, S.L.; Li, Z.A. 14C apparent ages and δ13C distribution of forest soils in Dinghushan Natural Reserve. Quat. Sci. 2000, 20, 335–344. (In Chinese) [Google Scholar]
  28. Brown, S.; Lenart, M.T.; Mo, J.M.; Kong, G.H. Structure and organic matter dynamics of a human-impacted pine forest in a MAB reserve of subtropical China. Biotropica 1995, 27, 276–289. [Google Scholar] [CrossRef]
  29. Blair, G.J.R.; Lefroy, D.B.; Lisle, L. Soil carbon fractions based on their degree of oxidation, and the development of a carbon management index for agricultural system. Aust. J. Agric. Res. 1995, 46, 1459–1466. [Google Scholar] [CrossRef]
  30. Leavitt, S.W.; Follett, R.F.; Paul, E.A. Estimation of the slow and fast cycling soil organic carbon pools from 6 N HCl hydrolysis. Radiocarbon 1996, 38, 230–231. [Google Scholar]
  31. Cambardella, C.A.; Elliott, E.T. Particulate soil organic matter changes across a grassland cultivation sequence. Soil Sci. Soc. Am. J. 1992, 56, 777–783. [Google Scholar] [CrossRef]
  32. Lu, R.K. Soil Physical and Chemical Analysis, Description of Soil Profiles; Standard Press of China: Beijing, China, 1996; pp. 107–108. (In Chinese) [Google Scholar]
  33. Tan, Z.; Lal, R.; Owens, L.; Izaurralde, R.C. Distribution of light and heavy fraction of soil organic carbon as related to land use and tillage practice. Soil Tillage Res. 2007, 92, 53–59. [Google Scholar] [CrossRef]
  34. Six, J.; Callewaert, P.; Lenders, S.; de Gryze, S.; Morris, S.J.; Gregorich, E.G.; Paul, E.A.; Paustian, K. Measuring and understanding carbon storage in afforested soils by physical fractionation. Soil Sci. Soc. Am. J. 2002, 66, 1981–1987. [Google Scholar] [CrossRef]
  35. Côté, L.; Brown, S.; Pare, D.; Fyles, J.; Bauhus, J. Dynamics of carbon and nitrogen mineralization in relation to stand type, stand age and soil texture in the boreal mixedwood. Soil Biol. Biochem. 2000, 32, 1079–1090. [Google Scholar] [CrossRef]
  36. Jia, G.M.; Cao, J.; Wang, C.Y.; Wang, G. Microbial biomass and nutrients in soil at the different stages of secondary forest succession in Ziwulin, northwest China. For. Ecol. Manag. 2005, 217, 117–125. [Google Scholar] [CrossRef]
  37. Liu, S.; Luo, Y.; Huang, Y.H.; Zhou, G.Y. Studies on the community biomass and its allocations of five forest types in Dinghushan Nature Reserve. Ecol. Sci. 2007, 26, 387–393. (In Chinese) [Google Scholar]
  38. Zhang, D.Q.; Ye, W.H.; Yu, Q.F.; Kong, G.H.; Zhang, Y.C. The litter-fall of representative forests of successional series in Dinghushan. Acta Ecol. Sin. 2000, 20, 938–944. (In Chinese) [Google Scholar]
  39. Zhou, G.Y.; Liu, S.G.; Li, Z.A.; Zhang, D.Q.; Tang, X.L.; Zhou, C.Y.; Yan, J.H.; Mo, J.M. Old-growth forests can accumulate carbon in soils. Science 2006, 314, 1417. [Google Scholar] [CrossRef] [PubMed]
  40. Hertel, D.; Hölscher, D.; Köhler, L.; Leuschner, C. Changes in fine root system size and structure during secondary succession in a Costa Rican montane oak forest. Ecol. Stud. 2006, 185, 283–297. [Google Scholar]
  41. Crow, S.E.; Lajtha, K.; Bowden, R.D.; Yano, Y.; Brant, J.B.; Caldwell, B.A.; Sulzman, E.W. Increased coniferous needle inputs accelerate decomposition of soil carbon in an old-growth forest. For. Ecol. Manag. 2009, 258, 2224–2232. [Google Scholar] [CrossRef]
  42. Asaye, Z.; Zewdie, S. Fine root dynamics and soil carbon accretion under thinned and un-thinned Cupressus lusitanica stands in Southern Ethiopia. Plant Soil 2003, 366, 261–271. [Google Scholar] [CrossRef]
  43. Peng, S.L.; Hao, Y.R. The dynamics of forest root and its distribution during succession. Acta Sci. Nat. Univ. Sunyatseni. 2005, 44, 65–69. (In Chinese) [Google Scholar]
  44. Wen, D.Z.; Wei, P.; Kong, G.H.; Ye, W.H. Production and turnover rate of fine roots in two lower subtropical forest sites at Dinghushan. Acta Phytoecol. Sin. 1999, 23, 361–369. (In Chinese) [Google Scholar]
  45. Fontaine, S.; Barot, S.; Barré, P.; Bdioui, N.; Mary, B.; Rumpel, C. Stability of organic carbon in deep soil layers controlled by fresh carbon supply. Nature 2007, 450, 277–280. [Google Scholar] [CrossRef] [PubMed]
  46. Monnier, G. Action des matiéres organiques sur la stabilité structurale des sols. Ann. Agron. 1965, 16, 327–400. (In French) [Google Scholar]
  47. Miller, R.M.; Jastrow, J.D. Hierarchy of root and mycorrhizal fungal interactions with soil aggregation. Soil Biol. Biochem. 1990, 22, 579–584. [Google Scholar] [CrossRef]
  48. Jastrow, J.D.; Miller, R.M. Soil aggregate stabilization and carbon sequestration: Feedbacks through organomineral associations. In Soil Processes and the Carbon Cycle; Lal, R., Kimble, J.M., et al., Eds.; CRC Press: Boca Raton, FL, USA, 1998; pp. 207–223. [Google Scholar]
  49. Wilson, G.W.T.; Rice, C.W.; Rillig, M.C.; Springer, A.; Hartnett, D.C. Soil aggregation and carbon sequestration are tightly correlated with the abundance of arbuscular mycorrhizal fungi: Results from long-term field experiments. Ecol. Lett. 2009, 12, 452–461. [Google Scholar] [CrossRef] [PubMed]
  50. Liu, C.L.; Zuo, W.Y.; Zhao, Z.Y.; Qiu, L.H. Bacterial diversity of different successional stage forest soils in Dinghushan. Acta Microbiol. Sin. 2012, 52, 1489–1496. (In Chinese) [Google Scholar]
  51. Six, J.; Conant, R.T.; Oaul, E.A.; Paustian, K. Stabilization mechanisms of soil organic matter: Implications for C-saturation of soils. Plant Soil 2002, 241, 155–176. [Google Scholar] [CrossRef]
  52. Six, J.; Elliott, E.T.; Paustia, K.; Doran, J.W. Aggregation and soil organic matter accumulation in cultivated and native grassland soils. Soil Sci. Soc. Am. J. 1998, 62, 1367–1377. [Google Scholar] [CrossRef]
  53. Gale, W.J.; Cambardella, C.A.; Bailey, T.B. Root-derived carbon and the formation and stabilization of aggregates. Soil Sci. Soc. Am. J. 2000, 64, 201–207. [Google Scholar] [CrossRef]
  54. Six, J.; Bossuyt, H.; Degryze, S.; Denef, K. A history of research on the link between (micro) aggregates, soil biota, and soil organic matter dynamics. Soil Tillage Res. 2004, 79, 7–31. [Google Scholar] [CrossRef]

