1. Introduction
The relationship between the water and energy sectors—for example the energy required to distribute, collect, and treat water and wastewater and the water required to extract and process fossil fuels and to generate electricity—is of increasing interest to policymakers and planners. A growing population has placed a stress on water resources, which is exacerbated by an increased demand for water for energy production. The decreasing water quality and increasing depth and distance to raw water sources increases the strain that is already on the available water supply. As regions look at more energy intensive options such as conveying water greater distances and treating lower quality water with technologies such as desalination, the energy required to treat and transport raw water increases. Since constraints on one of these two resources exacerbate the strains on the other, solutions to the problem of limited resources often address both constraints simultaneously.
As population and water demand increase, there is a need for new freshwater sources. Because brackish water is abundant, desalination of brackish water represents one possible alternative supply. However, desalination is an energy intensive treatment method which remains an inhibitor to its broader adoption. At the same time, concerns about carbon emissions and their effects on the climate favor the use of renewable energy over conventional fossil fuels. However, renewable energy technologies such as wind and solar are intermittent, which can present a challenge to grid operation if large-scale storage (such as batteries, pumped hydroelectric, or compressed air energy storage) is not available [
1]. One possible solution is to couple solar photovoltaic (PV) with desalination that can be operated intermittently, such that stored, treated water is a proxy for energy storage. At the same time, using the water facility only when solar power is available reduces fluctuations in power supply to the electric grid, adding value to the integrated facility.
This research evaluates the potential of co-locating desalination plants for inland brackish groundwater treatment and solar PV generation. This project explores the spatial component using Geographic Information Systems (GIS) to assess the co-location of solar and brackish groundwater resources to estimate the potential for an integrated facility to solve several problems simultaneously. Because Texas has an isolated electric system, growing population, water scarcity, and an abundance of solar energy and brackish groundwater, it is used as a testbed for this analysis. However, the approach developed here is applicable outside Texas. Using temporally and spatially resolved solar irradiance and brackish groundwater depth and quality data, a framework was developed to evaluate these resources. This framework is intended to be useful for policy makers, regional planners and project developers as they look towards alternative water supply in water stressed areas.
Literature surrounding the technical and economical aspects of coupling desalination and solar PV exist, as does research on the availability of these resources. The coupling of desalination with renewable energy is also a growing field of research [
2,
3]. Similar research has also been conducted on the sustainable siting of co-located seawater desalination facilities with solar PV factoring in technical, social and economical impacts such as solar insolation, ocean salinity, water temperature, water stress, population and ability to pay [
4], as has research on resource optimization of wind-powered brackish groundwater RO desalination [
5]. What is lacking from the literature is methodologies for determining the optimal locations of co-located facilities for brackish groundwater reverse osmosis (RO) and PV based on resource characteristics at a given location. This research aims to fill that knowledge gap. While the authors are aware of the environmental concerns associated with greenhouse gas emissions and disposal of the brine waste stream, the aim of this paper is not to address these issues but rather to deliver a framework for the geographic analysis of the solar and water resources impacting a coupled PV-RO facility.
2. Background on Solar-Powered Desalination and Brackish Groundwater
While the population in Texas is expected to grow 82% from 2010 to 2060, water use is estimated to grow only 22% due to decreases in agricultural water use from efficiency improvements and municipal water use from conservation measures [
6]. Municipal water demand is expected to increase from 4.9 million acre-feet in 2010 to 8.4 million acre-feet in 2060 while natural fresh water supplies are estimated to decrease 10% over this period [
6]. Therefore, at the current rate of production and consumption, future supplies of water will not meet future demand unless alternative sources are tapped. Given the existing strain on freshwater along with a wealth of solar and brackish water resources, this research will focus on Texas as a testbed; however, the research methodology and results will be broadly applicable to areas with similar resources and prevailing conditions.
Texas has an abundance of brackish groundwater, thought to be more than 2.7 billion acre-feet [
7], which can possibly be desalinated and used to meet public needs. Brackish groundwater is defined as water with a total dissolved solids (TDS) concentration of 1000 to 10,000 mg/L. For comparison, seawater has a TDS concentration of 35,000 mg/L. The Texas Commission on Environmental Quality (TCEQ) has set a primary standard concentration for TDS of 500 mg/L and a secondary standard of 1000 mg/L for public use [
7].
RO is the most common type of desalination technology worldwide, accounting for 60% of desalination capacity in 2010 [
8]. In Texas, RO accounts for 80% of desalination systems in operation [
9]. RO applies pressure to a solution on one side of a selective membrane to reverse the natural flow of solvent to the side with higher solute concentration. The solute remains, while the pure solvent passes to the other side, thereby producing freshwater. Electrodialysis, a less common desalination method accounting for 3.6% of desalination capacity worldwide in 2010 [
8], uses electromotive forces applied to electrodes that are adjacent to both sides of a membrane to purposely move salt ions through the membrane leaving behind freshwater. ED is best applied to treatment of brackish-water with TDS up to 5000 mg/L and is not economical for higher concentrations [
10], except in cases where ED is used for partial treatment [
11]. Both methods are used coupled with PV systems [
10]. RO and ED are the most common forms of desalination to be coupled with PV [
10]. Thermal methods of desalination, accounting for 34.8% of desalination worldwide in 2010 [
8], are not well-suited for coupling with PV because they are heat-based as opposed to electricity-driven.
PV cells are a rapidly growing technology with costs decreasing over time. The price of solar PV modules in 1987 was roughly $9/W [
12]. From 1998 to 2011 the price fell from $4.90/W to $1.28/W [
13]. Typical PV levelized cost of energy (LCOE) are in the range of $0.20–$0.40/kWh for low latitudes with high insolation of 2500 kWh/m
2/year, $0.30–$0.50/kWh for 1500 kWh/m
2/year (which is typical of Southern Europe), and $0.50–$0.80 per kWh for high latitudes with 1000 kWh/m
2/year [
12].
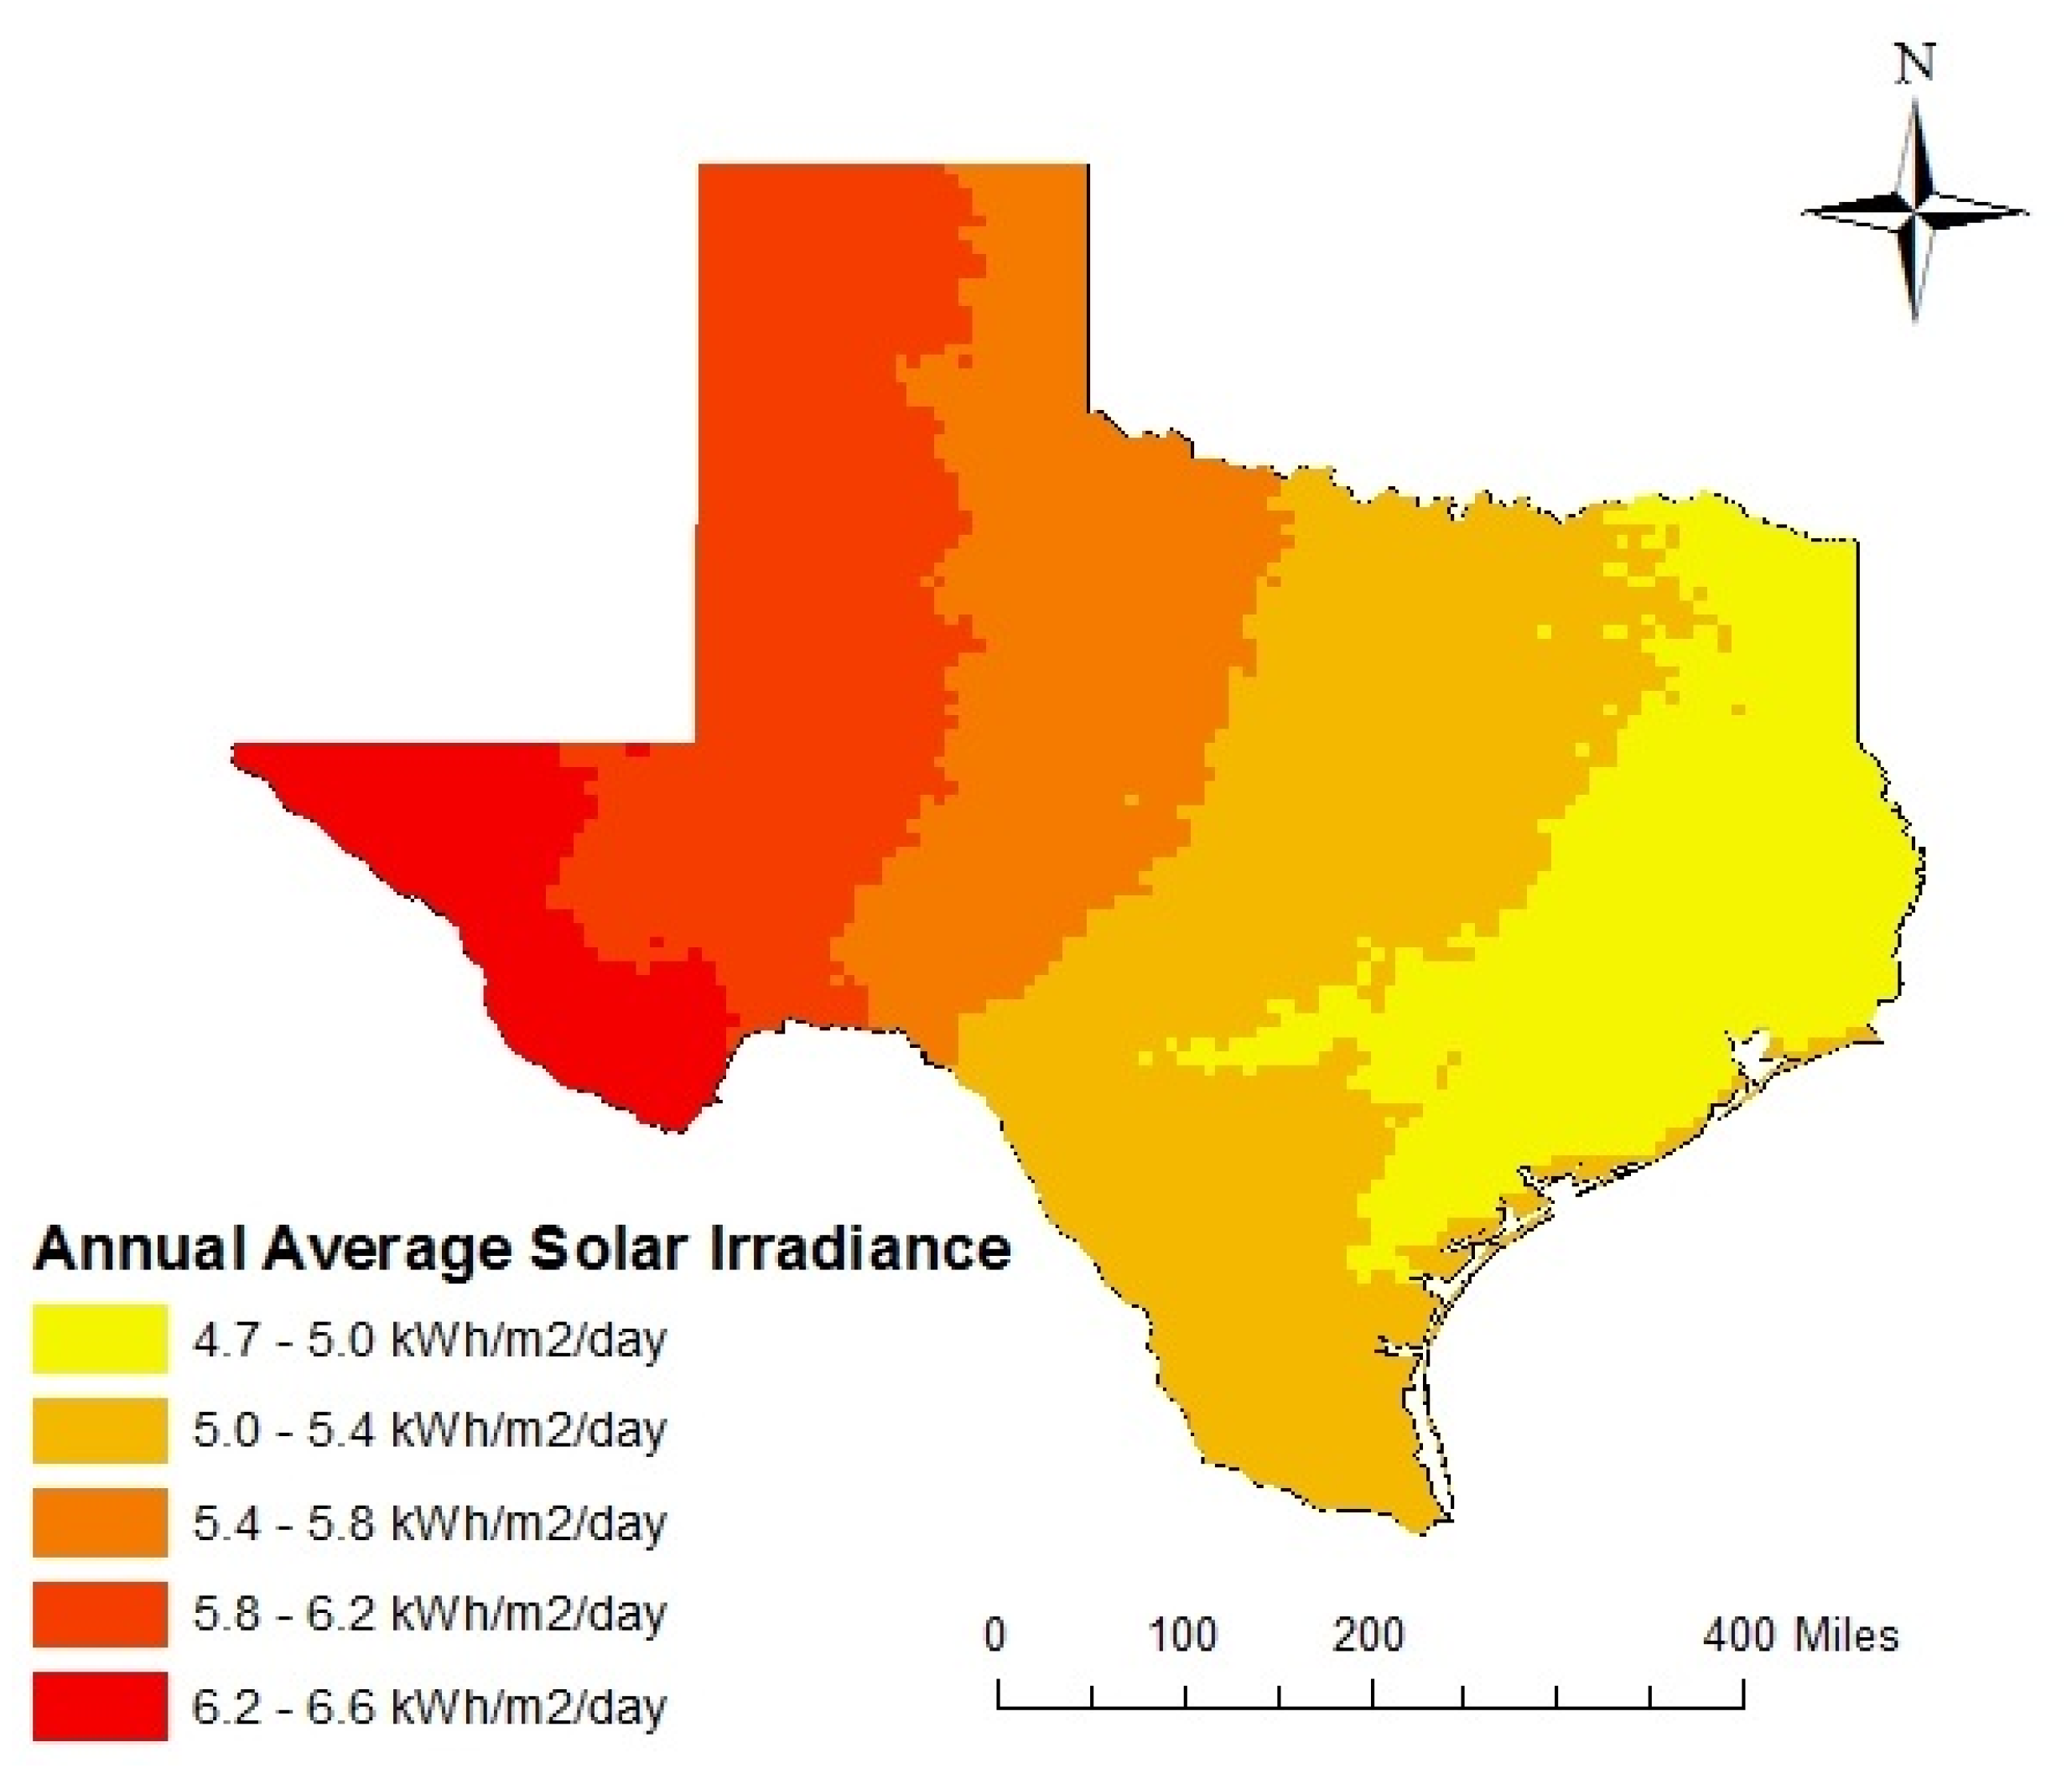
In Texas, the solar energy potential, or the amount of solar radiation available to a solar PV cell, ranges from 872 to 1310 kWh/m
2/year during the winter and from 2150 to 2884 kWh/m
2/year during the summer [
14]. The high end of the range corresponds to the western portion of the state while the low end corresponds to the eastern portion of the state. Annual average global tilt solar radiation across Texas is shown in
Figure 1. There is a range from 4.76 kWh/m
2/day to 6.58 kWh/m
2/day from east to west.
Figure 1.
Global tilt solar radiation across Texas from the National Renewable Energy Laboratory (NREL)’s National Solar Radiation Database dataset [
15].
Figure 1.
Global tilt solar radiation across Texas from the National Renewable Energy Laboratory (NREL)’s National Solar Radiation Database dataset [
15].
The most common combination of renewable energy and desalination employed worldwide is PVRO, and accounts for 31% of renewable energy-powered desalination installation [
16]. If solar energy can be located near the desalination plant, using solar panels directly for desalination eliminates the need to incorporate solar energy into the grid, although grid interconnectedness provides support for the system and could allow for continuous operation of the desalination plant.
The energy intensity of desalinating brackish groundwater has been estimated to be 0.5–3 kWh/m
3 of product (or treated) water [
17] while other sources estimate this value to be 1–2.5 kWh/m
3 of product water [
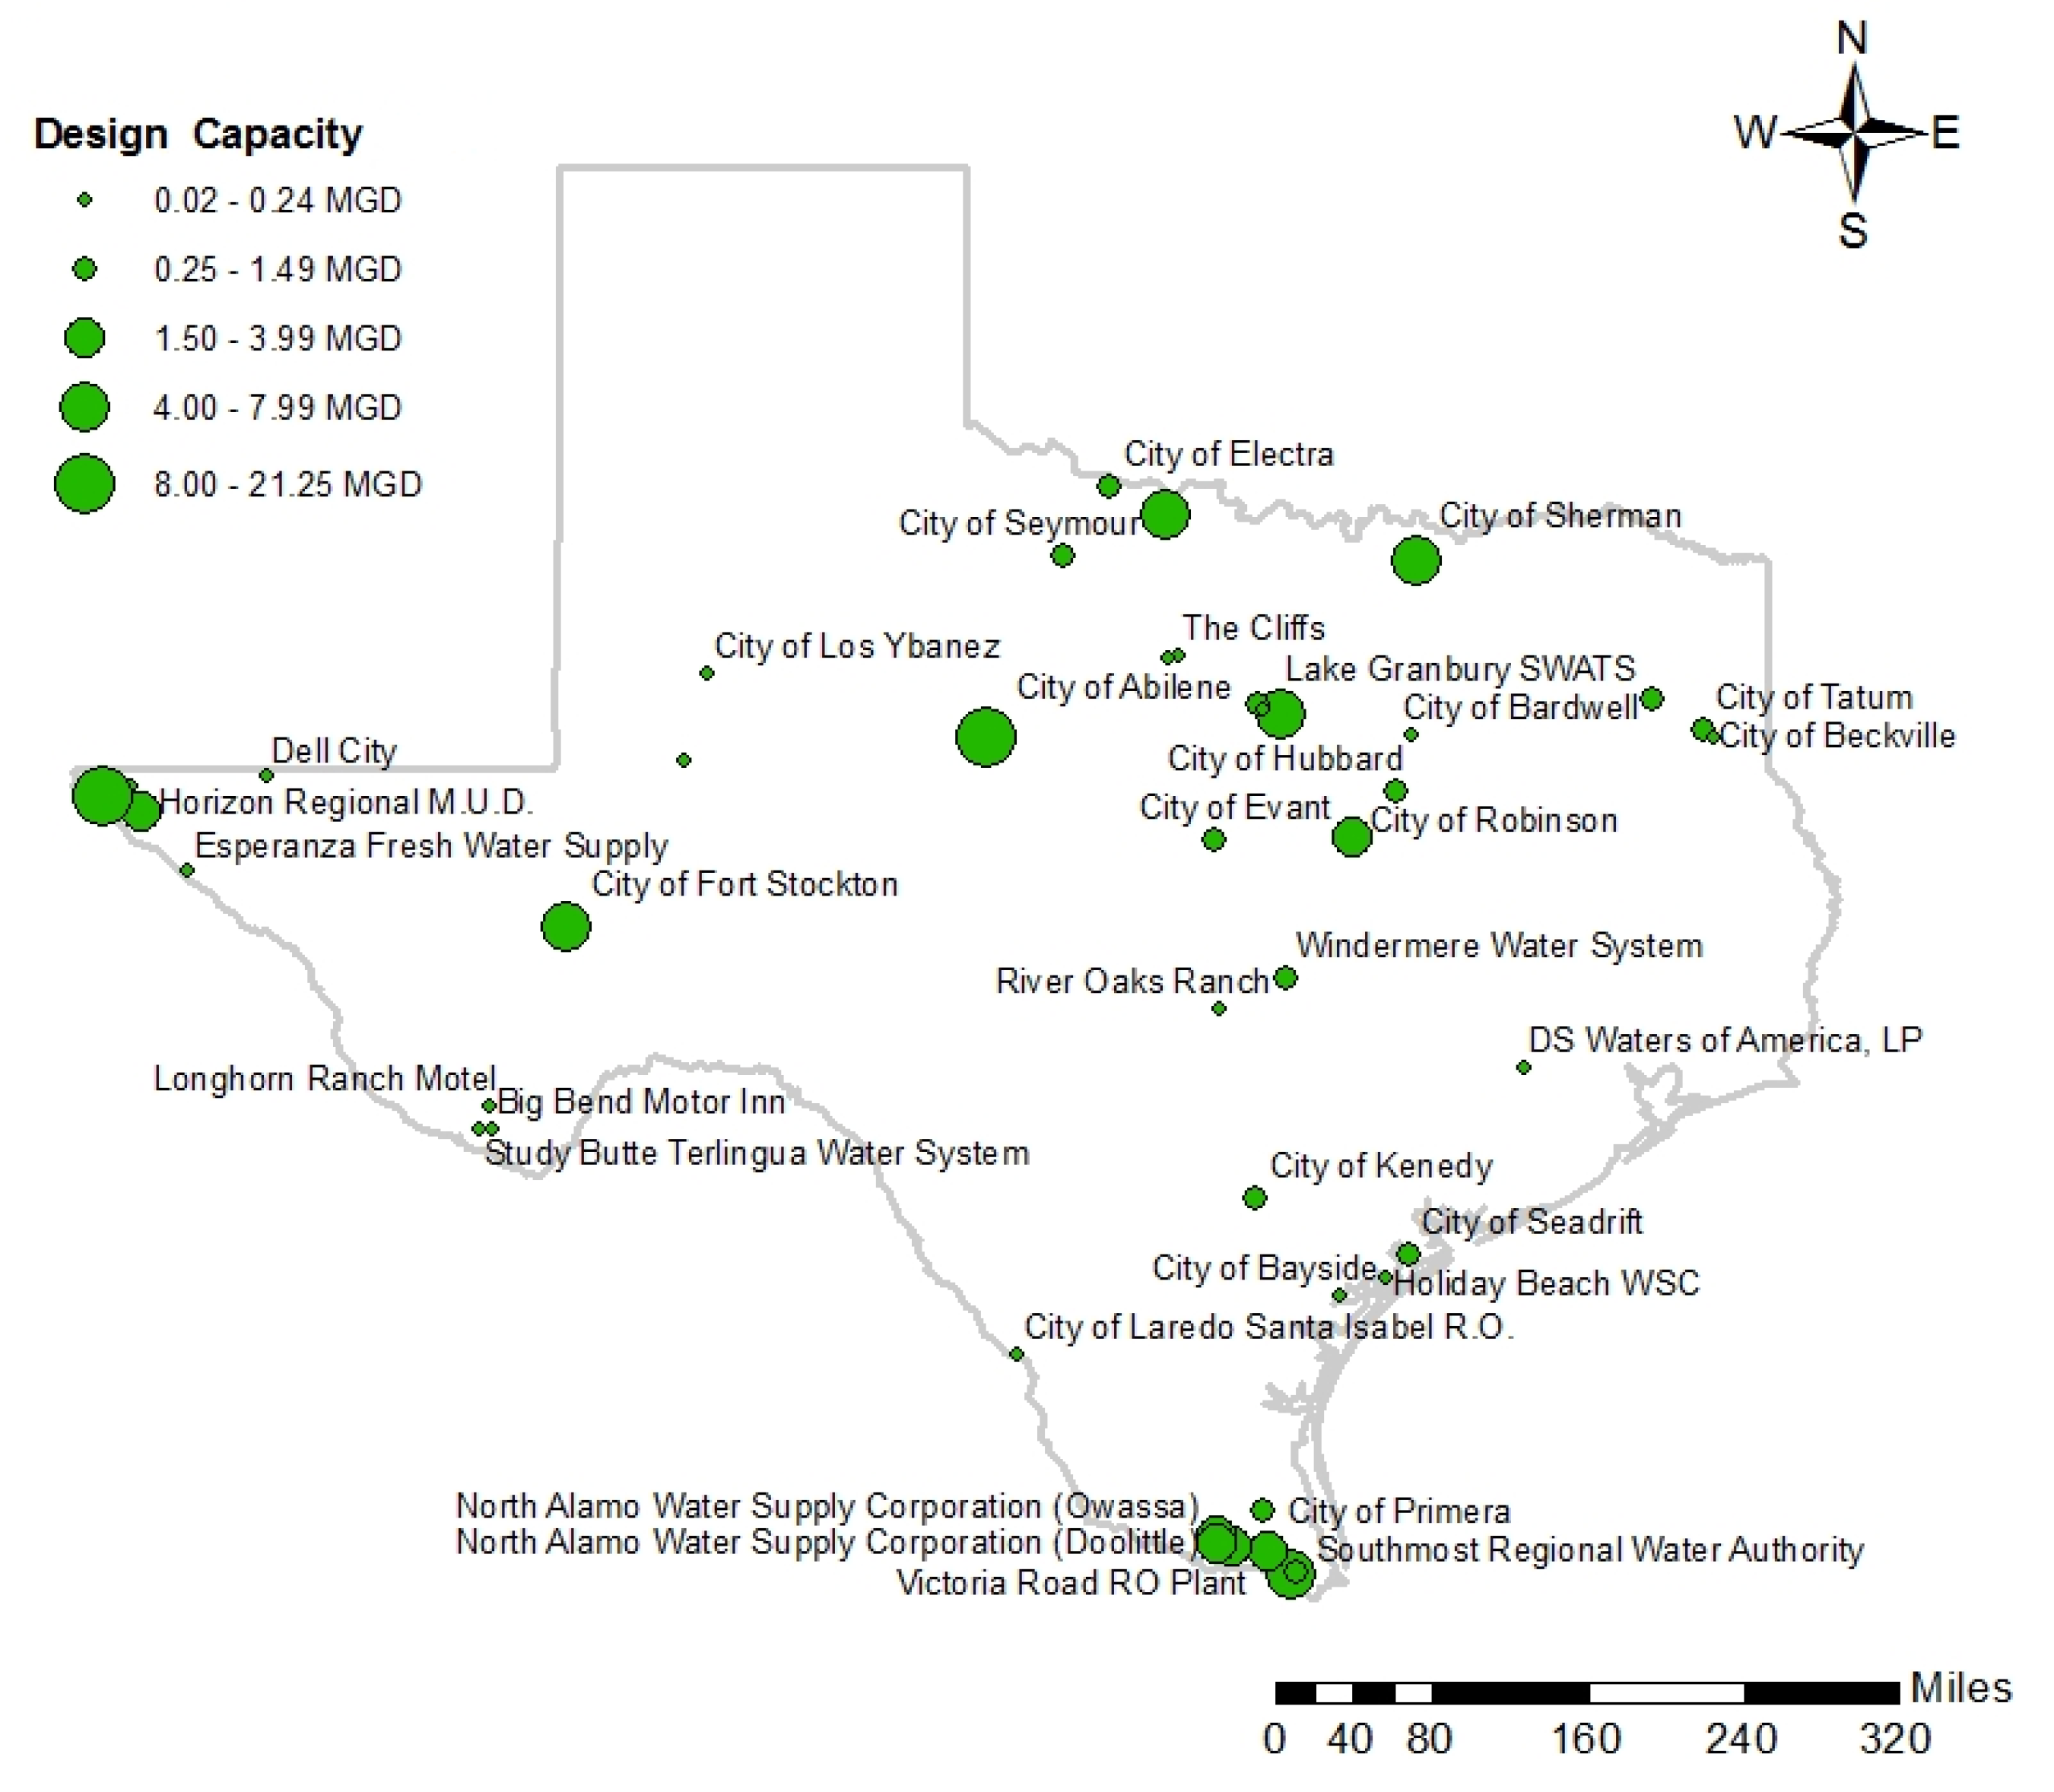
18]. The energy requirement is proportional to the TDS concentration as well as the depth to the groundwater source. There are currently 46 brackish water desalination plants in Texas [
19]. Twelve of these facilities treat brackish surface water and account for a design capacity of 50 million gallons per day (56,000 acre-feet per year) [
19]. Thirty-four of these facilities use brackish groundwater as their raw water source, which acounts for a design capacity of 73 million gallons per day (81,760 acre-feet per year) [
19]. In the 2012 State Water Plan, 5 out of 16 regional water planning groups recommended brackish groundwater desalination as a water management strategy, accounting for 181,568 acre-feet by the year 2060 [
19]. Desalination plants currently in operation in Texas are spread throughout the state, as shown in
Figure 2. Only the northern portion of the state, known as the panhandle, does not have desalination facilities.
Figure 2.
Existing desalination plants and their design capacities in Texas.
Figure 2.
Existing desalination plants and their design capacities in Texas.
This research focuses on RO desalination since the majority of desalination facilities in Texas already utilize this technology. PV cells will be the primary focus of solar power generation because PV technology can produce energy from both direct and diffuse radiation as opposed to other concentrating solar power (CSP) technologies, which can only make use of the direct radiation. Diffuse radiation is the radiation that is scattered from the direct beam by the atmosphere. Integrating PV with desalination and using water storage as a proxy for energy storage can advance the implementation of these two technologies by each one solving the problems of the other.
4. Results and Analysis
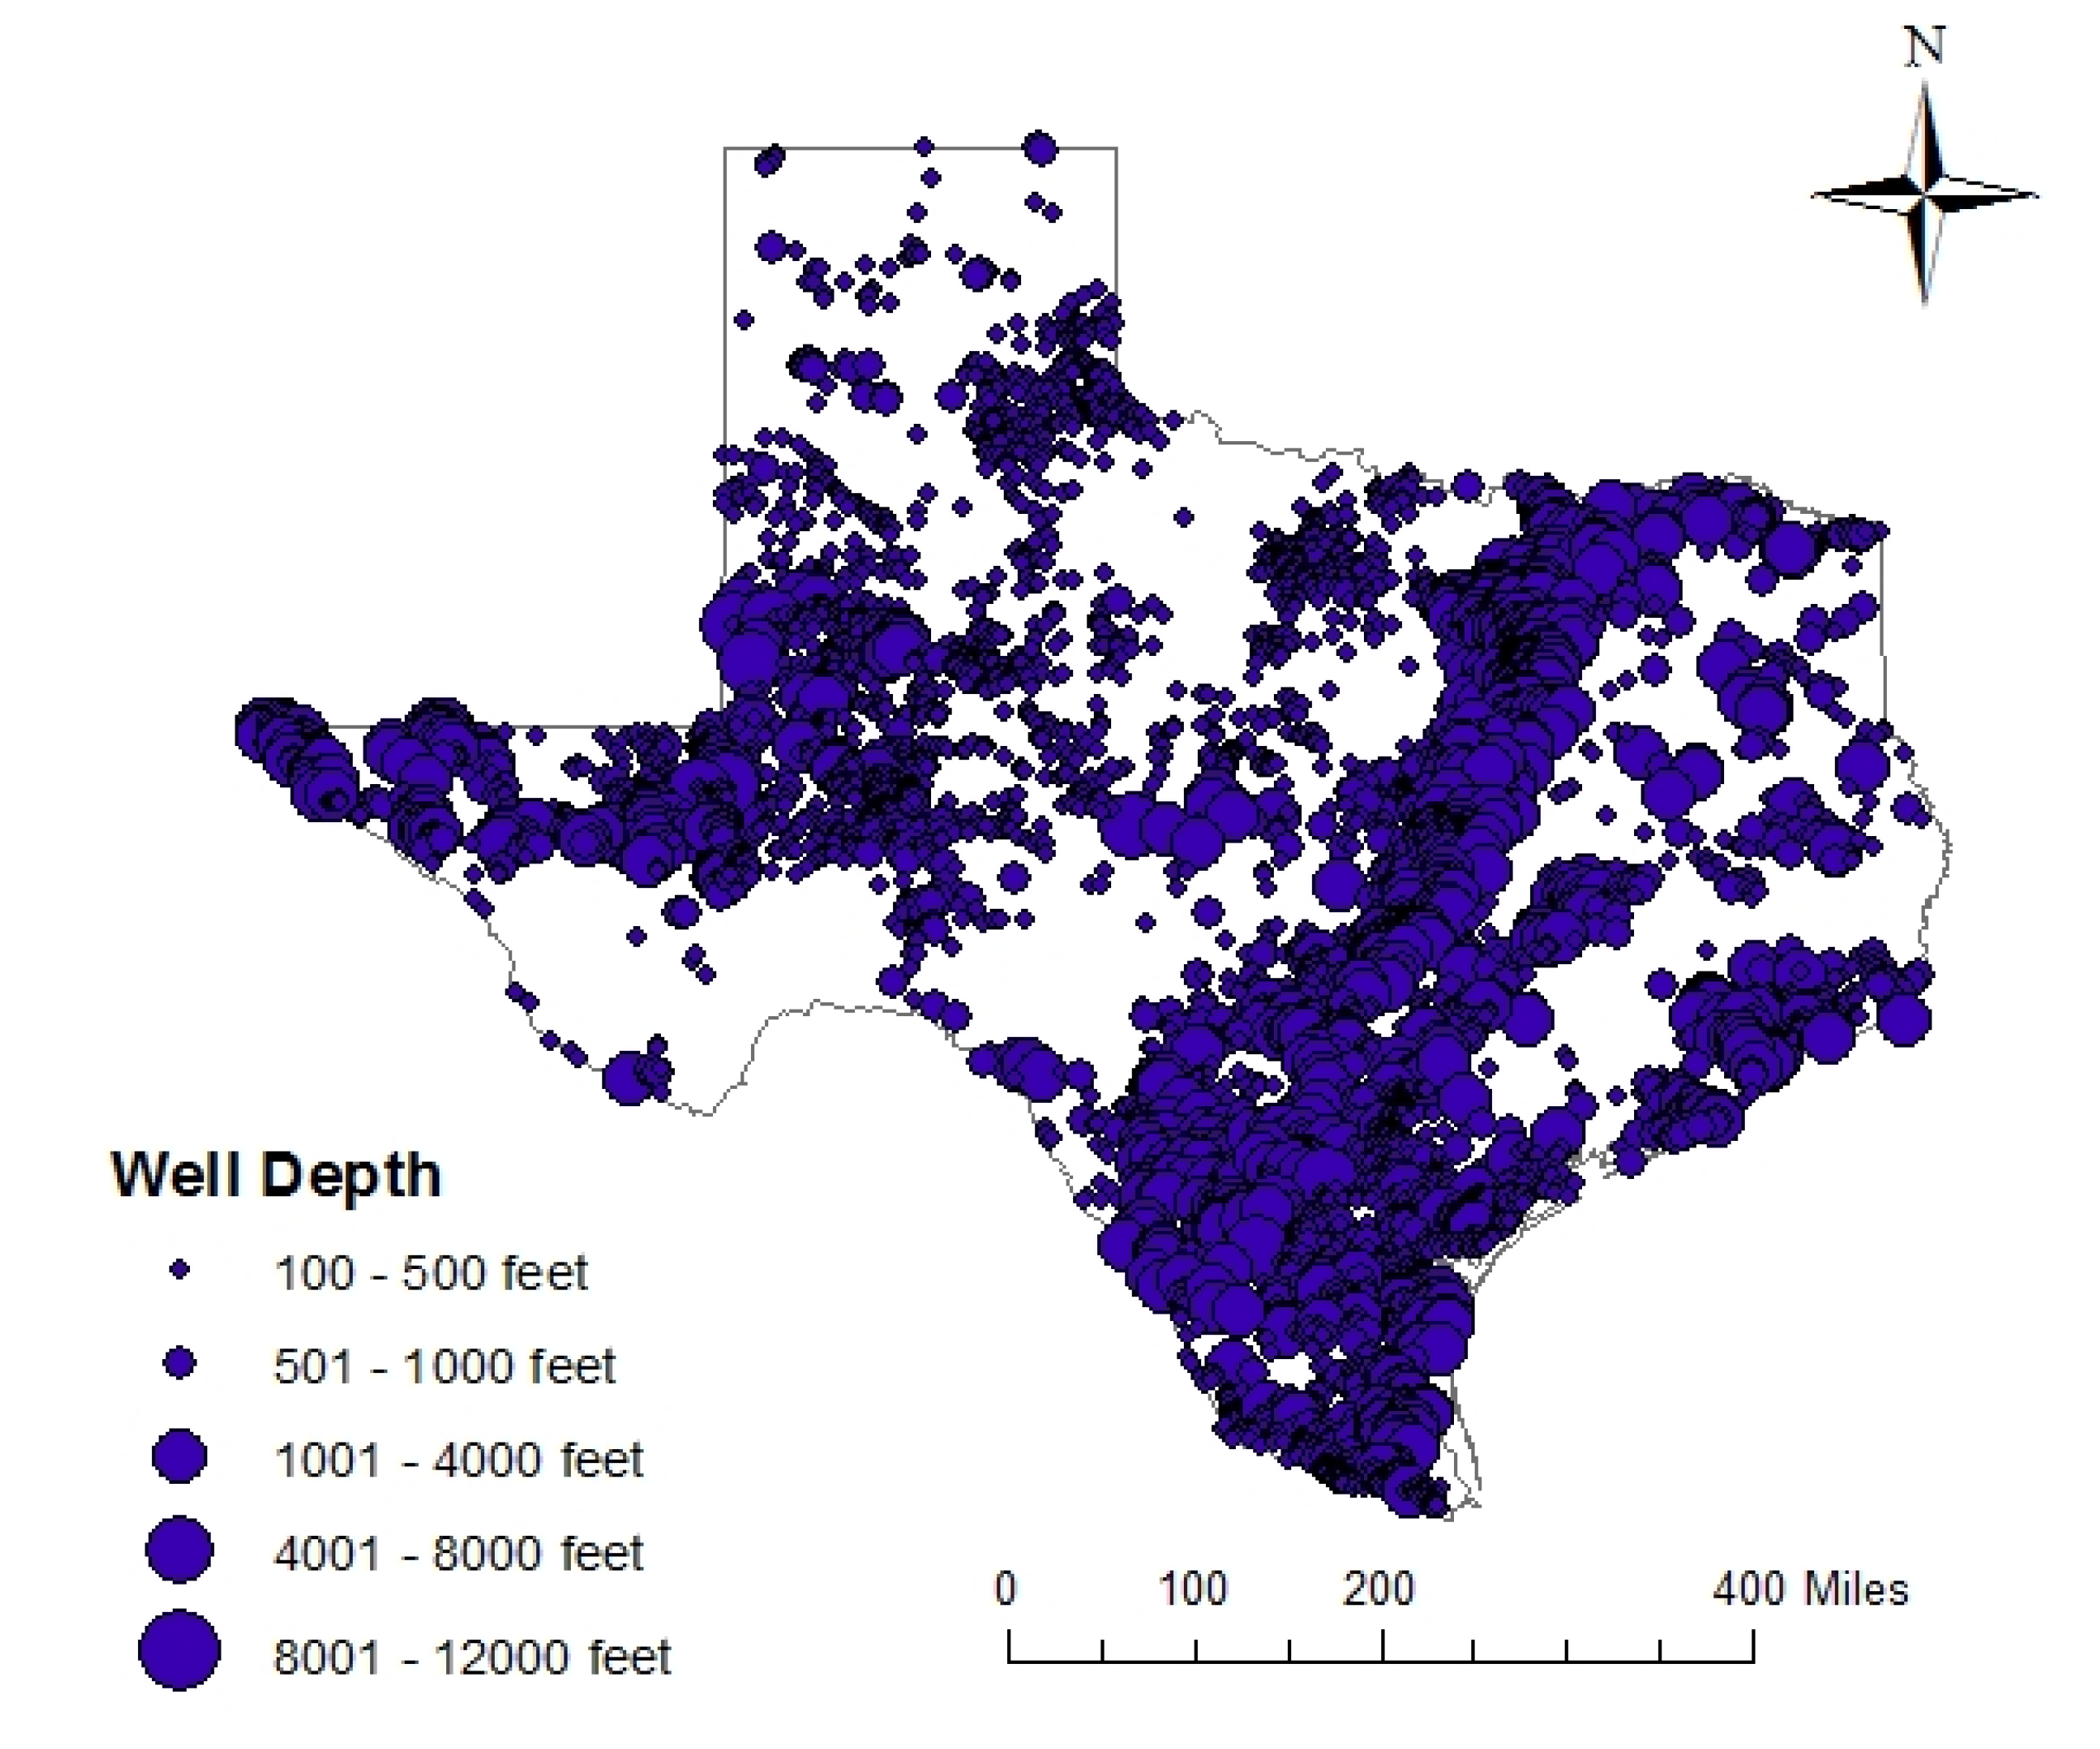
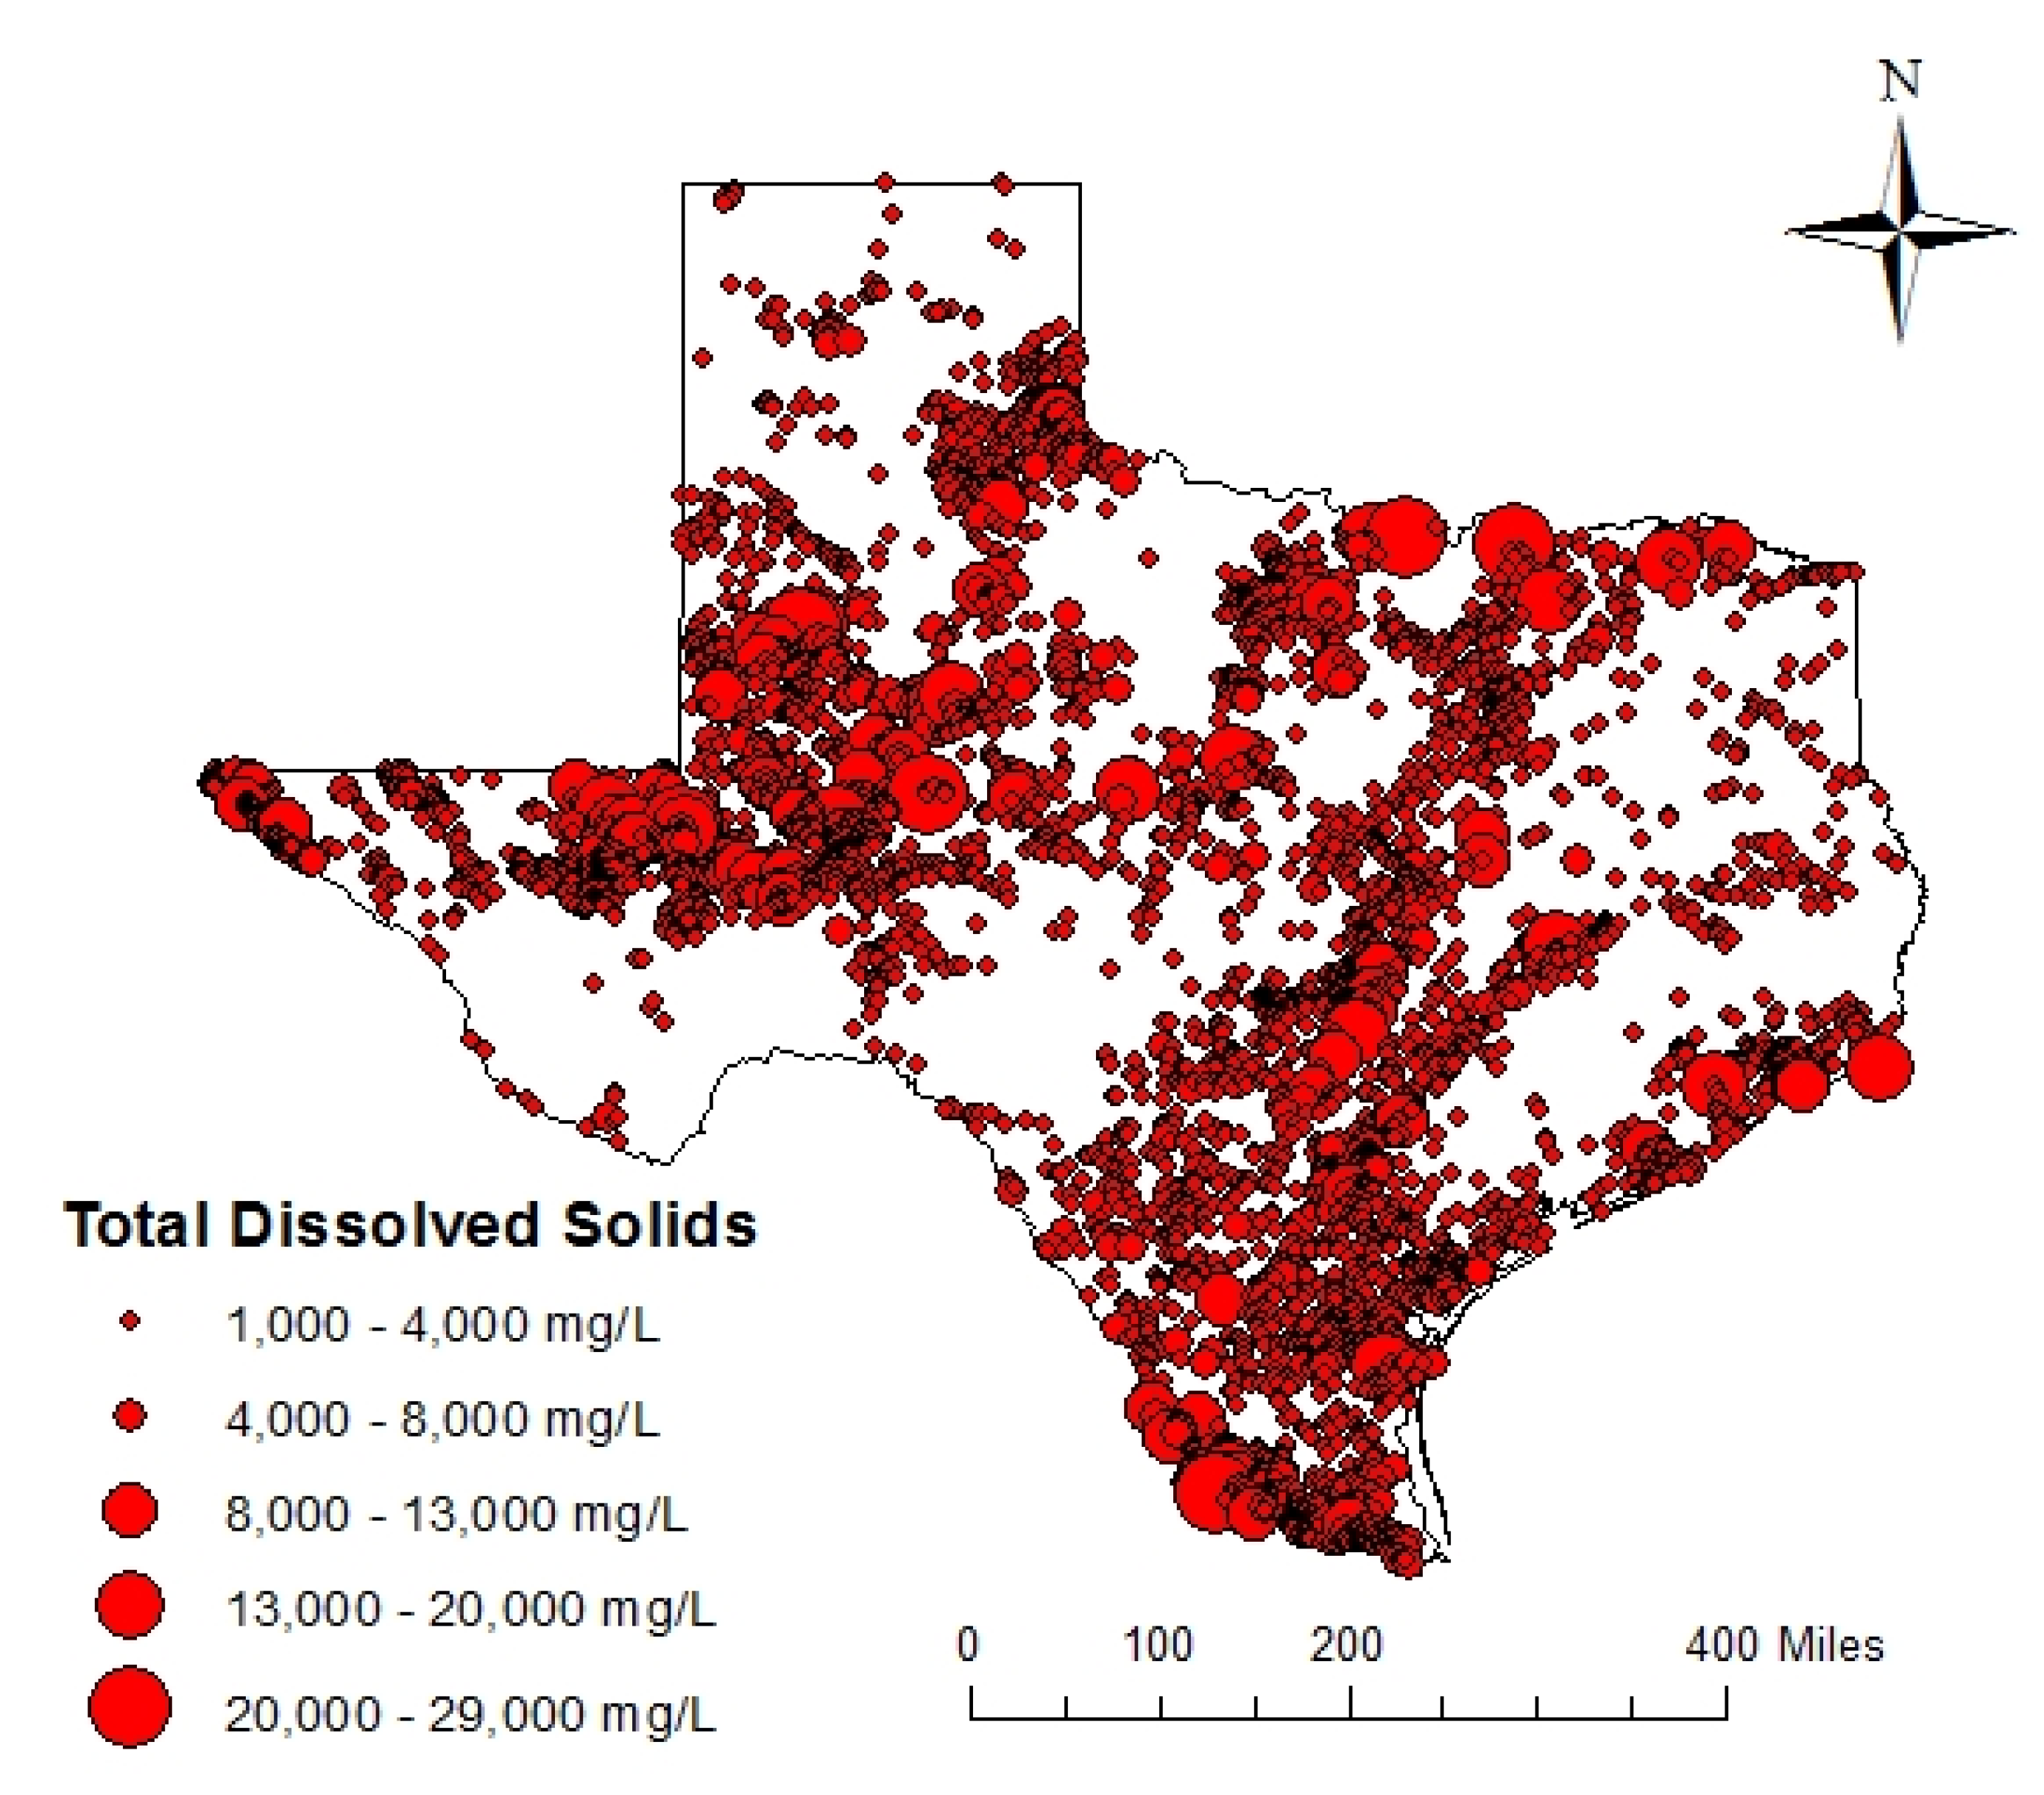
Brackish water wells with depths in the range of 100–12,000 feet and TDS in the range of 1000–30,000 mg/L across Texas are depicted on the maps in
Figure 3 and
Figure 4.
Figure 3 shows the wells with greater well depths with larger blue circles and
Figure 4 shows the same wells with the larger red circles representing higher TDS concentrations.
Figure 3.
Each dot represents a well from the Texas Water Development Board (TWDB) database. The larger dots represent greater distances to brackish water level.
Figure 3.
Each dot represents a well from the Texas Water Development Board (TWDB) database. The larger dots represent greater distances to brackish water level.
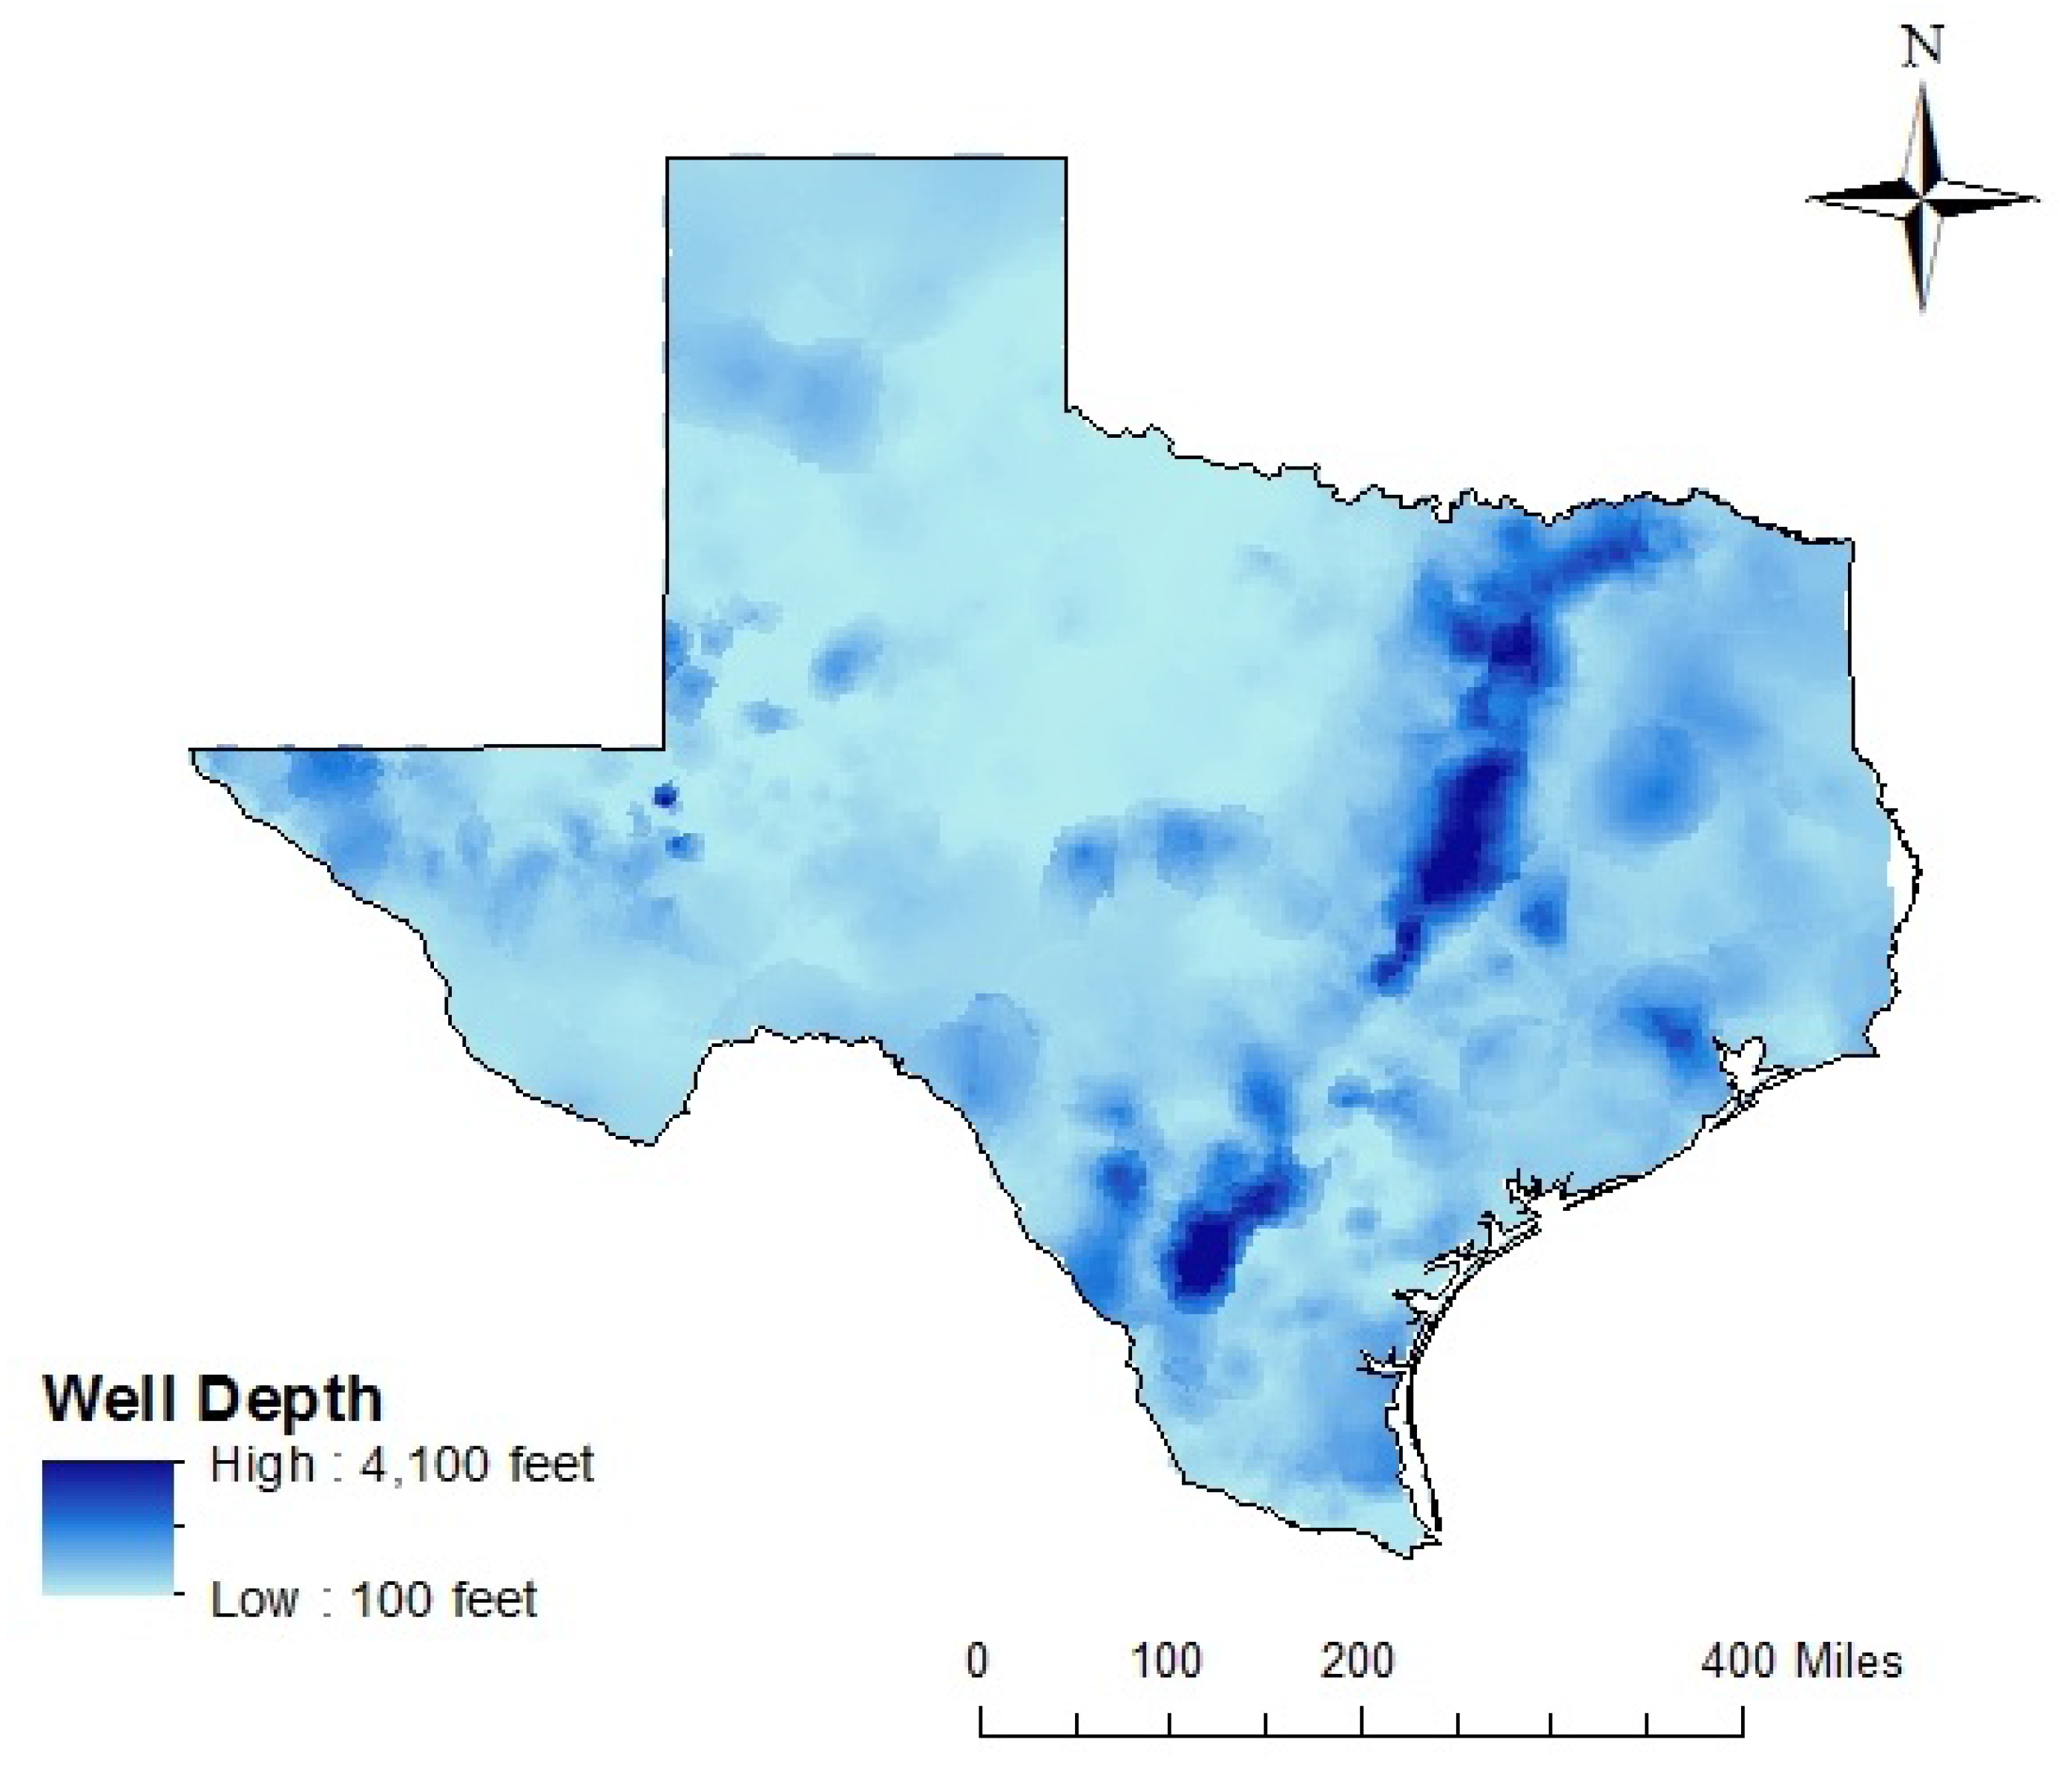
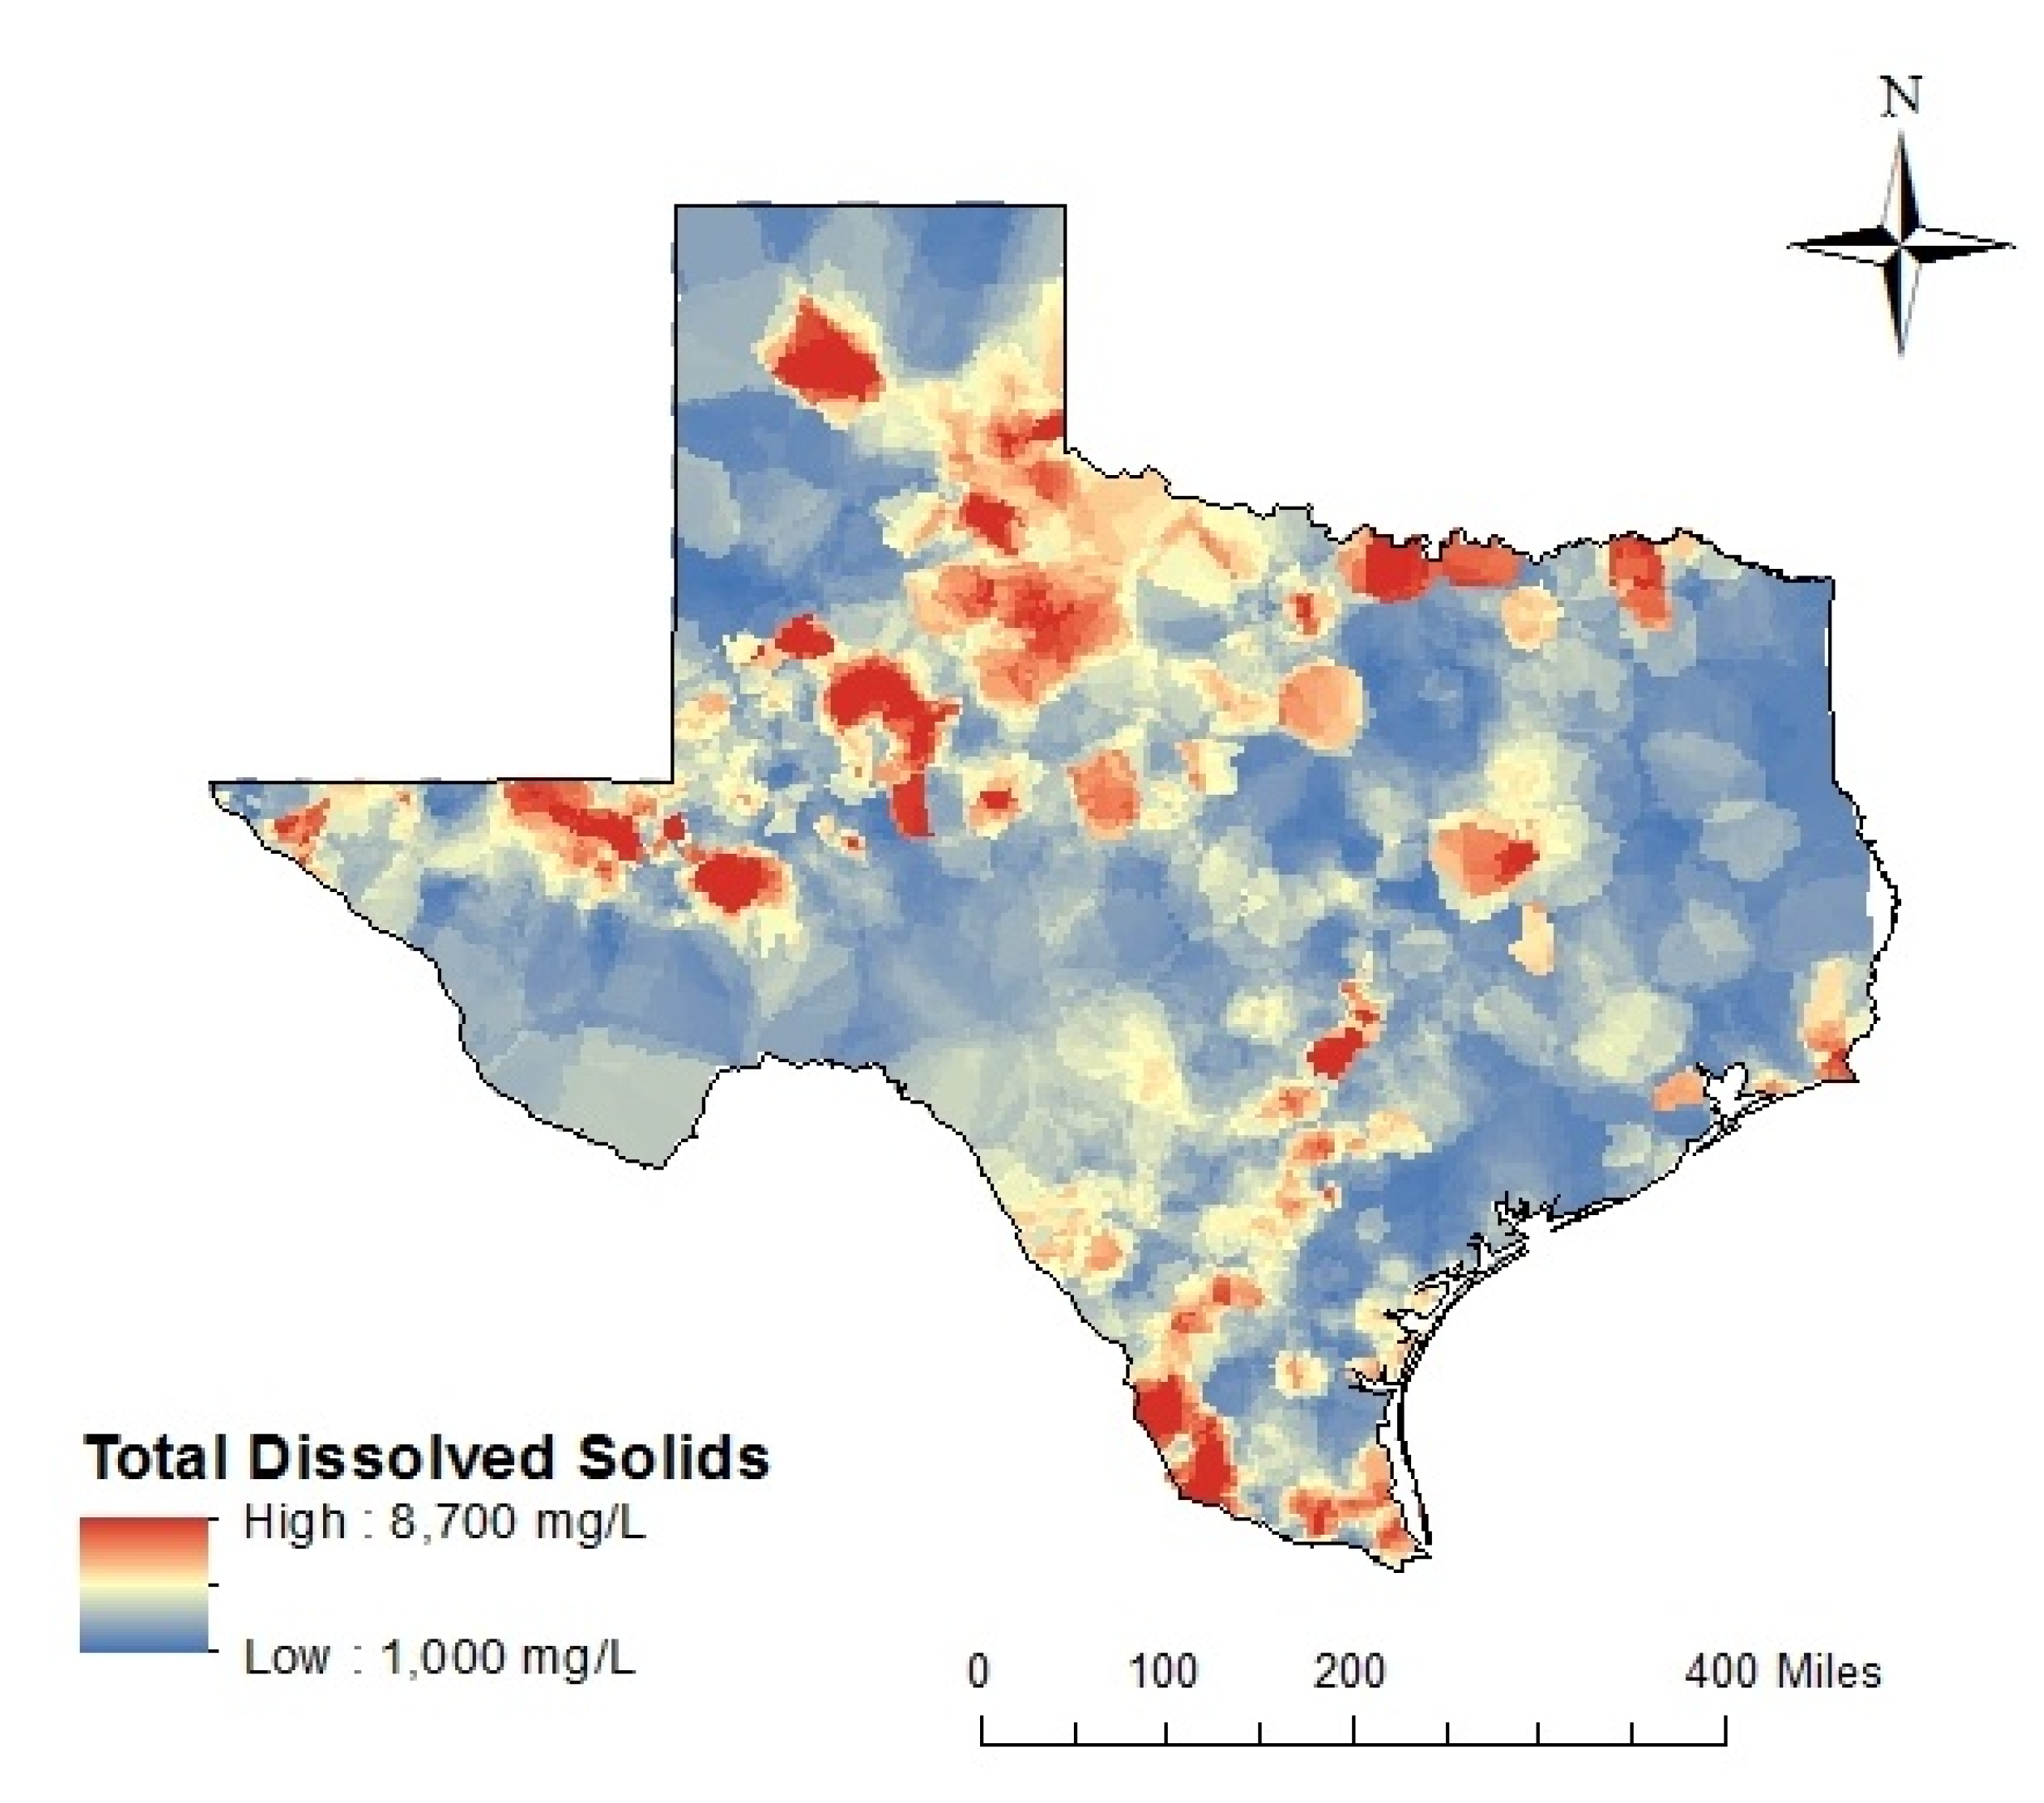
Wells appear to be concentrated in the southern tip of Texas and along the coast as well as in the northwestern portion of the state. Well depth and TDS concentrations seem to be uniformly spread in these regions. The depth and TDS concentrations of the wells was also depicted after interpolation across the state was performed as a way to predict the depth and TDS concentration at any location across Texas based on the known values for existing wells, as shown in
Figure 5 and
Figure 6.
Figure 4.
Each dot represents a well from the TWDB database. The larger dots represent higher total dissolved solids concentration for that well.
Figure 4.
Each dot represents a well from the TWDB database. The larger dots represent higher total dissolved solids concentration for that well.
Figure 5.
The depth of wells across Texas after interpolation was used to estimate well depth for areas without data.
Figure 5.
The depth of wells across Texas after interpolation was used to estimate well depth for areas without data.
Figure 6.
The total dissolved solids concentration of the brackish groundwater across Texas after interpolation was performed to estimate total dissolved solids (TDS) concentrations for areas without data.
Figure 6.
The total dissolved solids concentration of the brackish groundwater across Texas after interpolation was performed to estimate total dissolved solids (TDS) concentrations for areas without data.
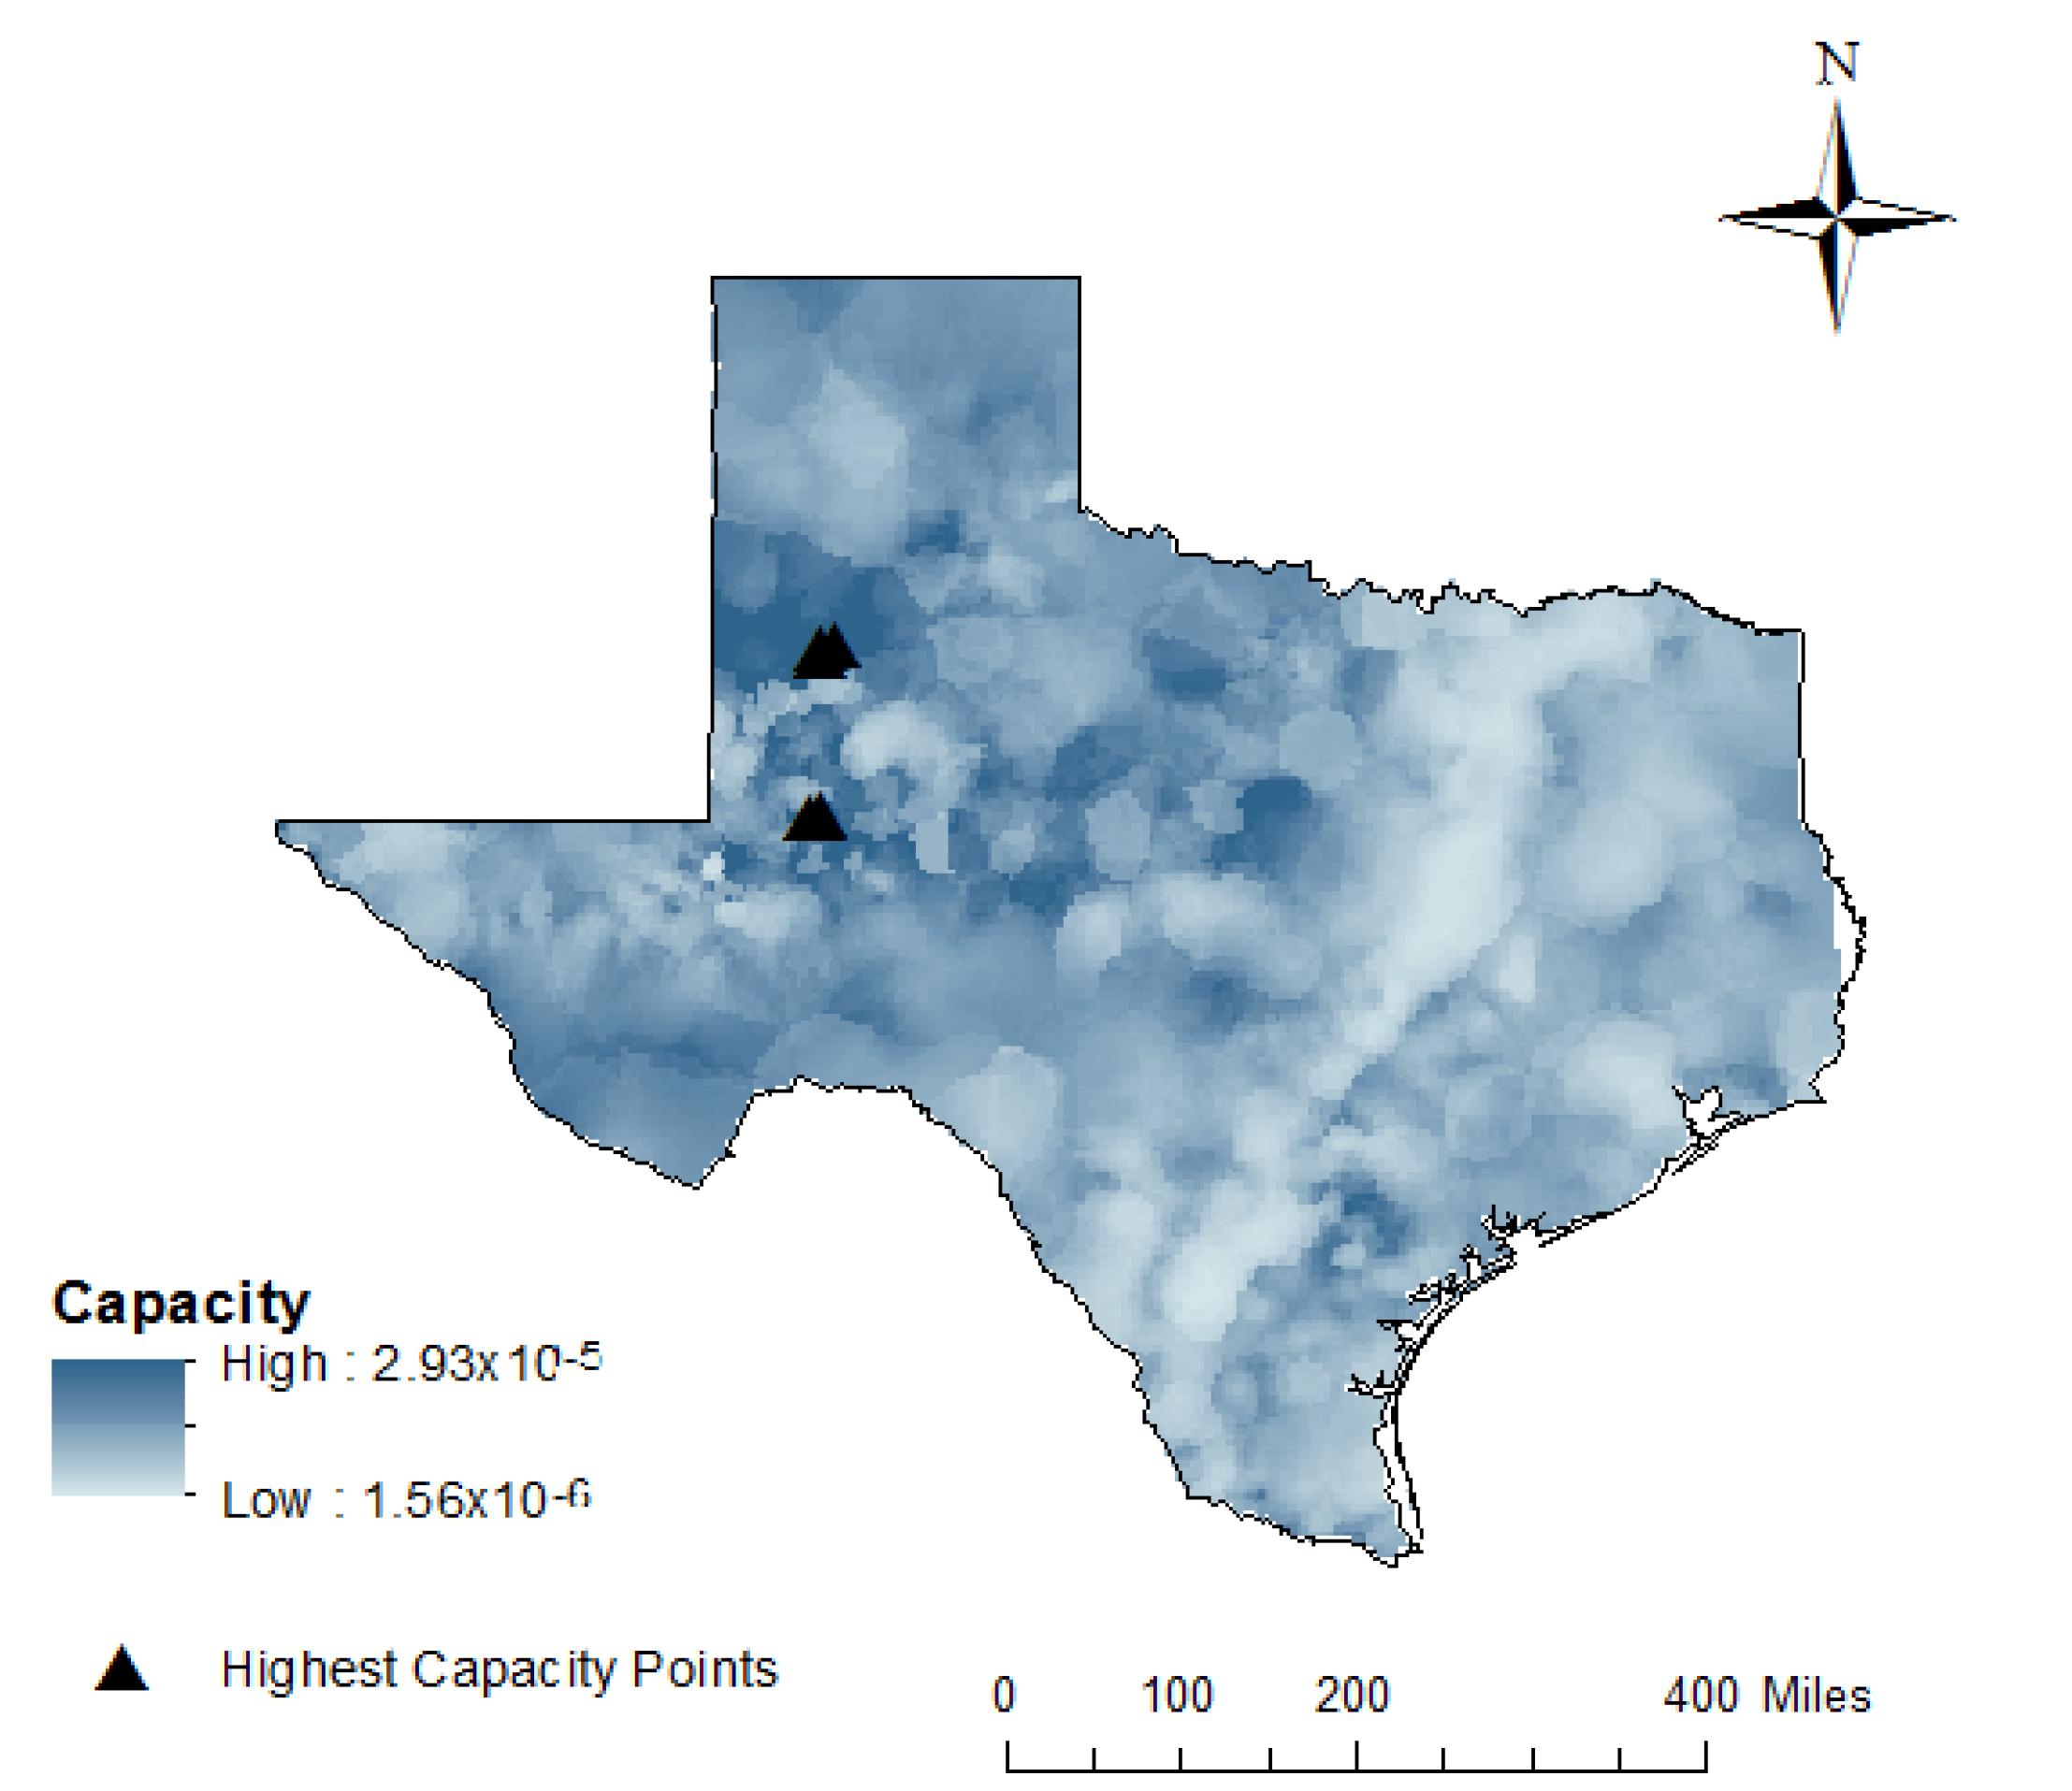
Figure 7 shows the capacity (as a volumetric flow rate,
v) that one square meter of PV array could produce and the location of the six highest calculated capacities.
Table 1 shows the values of the variables that resulted in these highest capacities.
Figure 7.
Desalination capacity across Texas calculated using well characteristic and solar radiation data.
Figure 7.
Desalination capacity across Texas calculated using well characteristic and solar radiation data.
Table 1.
Variable Values for Six Points with the Highest Capacities.
Table 1.
Variable Values for Six Points with the Highest Capacities.
| Longitude | Latitude | Capacity | TDS | Well Depth | GTR |
|---|
| (Decimal Degrees) | (Decimal Degrees) | (m3/s) | (mg/L) | (m) | (Wh/m2/day) |
|---|
| –102.1313625 | 33.42166 | 2.927 × 10⁻⁵ | 1142 | 42.4 | 6008 |
| –102.1313625 | 33.3767 | 2.923 × 10⁻⁵ | 1141 | 42.5 | 5998 |
| –102.1313625 | 32.02784 | 2.889 × 10⁻⁵ | 1142 | 43.4 | 5992 |
| –102.1313625 | 32.0728 | 2.888 × 10⁻⁵ | 1142 | 43.4 | 5992 |
| –101.9964763 | 33.46663 | 2.886 × 10⁻⁵ | 1173 | 41.0 | 5968 |
| –102.2212867 | 32.02784 | 2.850 × 10⁻⁵ | 1157 | 44.0 | 6024 |
The framework for the optimization performed is important because it helps tease out the non-obvious tradeoffs. While it might appear obvious that low salinity, shallow depths to brackish groundwater and high solar insolation would be ideal, they might not be available at the same location. In instances when they are not, it can be difficult to know which variable plays a less important role and to what degree. Optimization helps to answer these questions.
5. Discussion and Conclusions
Using the methodology presented herein, a PV system covering an area of 1 m2 is capable of producing roughly 2.93 × 10⁻⁵ m3/s in some regions of Texas if located where optimal conditions are present. These optimal conditions include low well depth, low TDS and high solar radiation. By using PV to power the pumping and RO processes that are a part of desalination, the negative impacts of carbon emissions from such an energy-intensive process are reduced compared to if conventional fossil fuel sources are used.
Interestingly, locations with deeper wells also have higher TDS concentrations. However, this is not always the case, as is evident in the northern region. The area with deeper wells across Texas going from the southwest to the northeast part of the state follows along Interstate 35. While it is not certain, this could be because there is a lot of development along Interstate 35, including some of Texas' largest cities such as Dallas, Fort Worth, Austin and San Antonio. The Trinity and Carrizo-Wilcox aquifers, two of Texas' major aquifers, also run a similar path across Texas. The Balcones Escarpment, or Balcones Fault, runs from the southwest of Texas and up, also following a similar path through Texas. While there might be a correlation between the area of deeper wells across Texas, the natural land and water systems, and the development along it, the authors merely wish to point out these patterns but did not evaluate their relationship.
More than providing information for Texas, this research presents a framework for analyzing the optimal locations of a co-located desalination facility and PV array by optimizing the utilization of the combination of resources available. This method could be applied to other locations where the input conditions are very different to help planners and others who must contemplate options for where to site water treatment facilities. This analysis, being performed on a statewide level, crosses many aquifers. This approach used a kriging interpolation which uses a distance-weighted averaging approach to estimate the value at an unknown point based on neighboring points. The appropriateness of this approach should be tested and other alternative interpolation methods could be analyzed to determine which most accurately predicts well characteristics at locations where measuerments have not been taken in order to improve the results of this analysis. The study could be scaled down to an individual aquifer level, thereby improving our understanding of individual aquifer characteristics and potential for desalination of brackish water from them. Another consideration that needs to be addressed before implementing new solar-powered desalination facilities is whether there is a sufficient supply of water available to protect aquifers from the harmful effects of overuse, such as land subsidence. The disposal of the brine waste stream is also of environmental concern and methods for disposal should also be evaluated.
For this research, a sensitivity analysis would help quantify the trade-offs associated with siting a co-located facility based on the solar resources or water resources available. Considering the large spread of desalination plants currently in Texas, an economic analysis could be performed to determine the cost of installing PV at desalination facilities currently in operation that meet the optimal conditions set forth in this report. Future research might also include analyzing different solar technologies, such as concentrating solar power or solar thermal power, and other renewable energy sources such as wind and geothermal as well as different desalination technologies,
i.e., thermal treatment methods. By coupling wind and solar power with RO desalination, the co-located facility could operate for longer hours during the day, since wind is stronger at night [
24].


