

Abstract
Short periods of intense rainfall may be associated with significant impacts on society, particularly urban flooding. Climate model projections have suggested an intensification of precipitation under scenarios of climate change. This is in accordance with the hypothesis that precipitation intensities will increase with temperature according to the thermodynamic Clausius–Clapyeron (CC) relation (a rate of ∼6–7% °C−1)—a warmer atmosphere being capable of holding more moisture. Consequently, CC scaling between temperature and extreme precipitation has been demonstrated in numerous studies and in different locations, with higher than CC scaling (so-called super CC scaling) observed for sub-daily extremes. Here we use a new dataset of UK hourly precipitation to identify seasonal scaling relationships between mean daily temperature and 99th percentile hourly precipitation intensities. Pooling the data for the whole UK indicates only slightly higher than CC scaling in spring and summer at higher temperatures, notably less than the 2xCC scaling observed in other regions. Both the highest hourly intensities and the highest scaling in the UK occur in summer and so for this season the dependency of the scaling relationship on large scale circulation conditions is examined using a set of air flow indices. A shear vorticity index (indicative of large-scale flow cyclonicity) is noted to have the greatest influence on the relationship, approaching 2xCC at higher temperatures when shear vorticity is negative (anticyclonic rotation). An examination of the occurrence of intense events indicates that these can occur under cyclonic and anticyclonic conditions but that in the south-east of England the latter conditions disproportionately favour their occurrence. These results suggest that changes in circulation regimes could modify the expected changes in precipitation intensities prescribed by CC scaling and arising as a consequence of future warming.
Export citation and abstract BibTeX RIS

Content from this work may be used under the terms of the Creative Commons Attribution 3.0 licence. Any further distribution of this work must maintain attribution to the author(s) and the title of the work, journal citation and DOI.
1. Introduction
One of the most significant potential consequences associated with a warming climate in many parts of the world, including the UK, is the increased occurrence of flooding. The UK Climate Change Risk Assessment (Defra 2012) has estimated that the combined domestic and commercial insurance claims for flood related damage may increase almost three-fold by the 2050s (central estimate, medium emissions scenario). Significant flooding may not just be associated with prolonged periods of wet weather but also with short, intense periods of rainfall. In August 2004 intense rainfall of ∼50 mm hr−1 at Boscastle in SW England resulted in over 100 m3 s−1 of flood water and a 3–4.5 m surge with homes flooded, cars swept away and ∼100 people needing assistance to safety (Doe 2004). More recently, ∼50 mm of rain fell in around 2 h over Newcastle upon Tyne in northern England on 28 June 2012, resulting in over 1200 properties being affected by flooding (Newcastle City Council 2013).
Climate model experiments have suggested an intensification of extreme precipitation in a warming climate (Collins et al 2013) which may be explained physically by the capacity of warm air to hold more moisture. This is supported by observational analyses which have indicated an increase in atmospheric moisture (Trenberth et al 2003, Trenberth 2011). The theoretical basis of this relationship is provided by the Clausius–Clapeyron relation (hereafter referred to as 'CC'). This states that if relative humidity remains constant then atmospheric humidity will increase at a rate that follows the saturation vapour pressure dependency on temperature (a rate of ∼6–7% °C−1 of surface warming), and is a significant consideration in understanding future changes in extreme rainfall (e.g. Allen and Ingram 2002, Pall et al 2007). Westra et al (2013) have provided empirical support for this, showing that the median intensity of annual global maximum precipitation changes in proportion with global mean temperatures at a rate of 5.9% to 7.7% °C−1. An understanding of the processes responsible for intense rainfall is therefore important both in terms of identifying the likely future changes in such events in response to a warming atmosphere and being able to evaluate their representation by climate models.
Observational evidence of CC scaling between temperature and extreme precipitation has been provided at both daily (e.g. Haerter et al 2010, Utsumi et al 2011) and sub-daily timescales (e.g. Lenderink and van Meijgaard 2008, Hardwick Jones et al 2010). Haerter et al (2010) determined that for six stations in Germany daily precipitation extremes generally increased in intensity at a rate below CC. Utsumi et al (2011) examined the scaling of daily extremes globally and identified a latitudinal (and therefore temperature) dependence of the scaling, with a monotonic increase of extremes with temperature at high latitudes and a monotonic decrease in the tropics. Liu and Allan (2012) also conducted a global scale analysis using satellite-based observing systems, finding an increase in precipitation of ∼6% K−1 (percentile dependent) but that precipitation showed no significant response when only the global land area was considered. Berg et al (2009) indicate that seasonality is important in the scaling relationship for daily precipitation, finding that the overall relationship masks a general increase in intensities with temperature in winter and a decrease in summer over Europe. Using a regional climate model simulation however they suggest that these relationships are a superposition of the relative contribution of large-scale and convective precipitation, identifying a seasonally dependent increase in the intensity of convective precipitation up to temperatures of ∼15–20 °C.
Several studies have demonstrated differing scaling relationships at sub-daily and daily timescales (e.g. Haerter et al (2010), Panthou et al (2014)). For hourly precipitation extremes scaling is not constant across the temperature distribution. A lower rate of increase or even a decrease in precipitation intensities has been observed at the upper end of the temperature distribution, typically above ∼24 °C (Hardwick Jones et al 2010, Lenderink et al 2011). A number of studies have indicated super-CC scaling on sub-daily timescales, for example, Lenderink and van Meijgaard (2008) found that at De Bilt in the Netherlands hourly precipitation extremes increased at 2xCC for temperatures above ∼12 °C, and extended this work to find consistent results for four additional locations in Western Europe (Lenderink and van Meijgaard 2010). Lenderink et al (2011) found that hourly precipitation extremes in both Hong Kong and the Netherlands follow a 2xCC dependency, noting the consistency of the scaling for both locations between a dew point temperature range of 12–20 °C. Hardwick Jones et al (2010) also found super-CC scaling in some regions of Australia for temperatures up to 20–26 °C. A comparison of these studies also highlights the effect of event duration. Haerter et al (2010) and Hardwick Jones et al (2010) both identified a decrease in scaling at higher temperatures for rainfall durations of longer than ∼30 min. A review of studies of the precipitation-temperature relationship is provided in Westra et al (2014).
Recent research has indicated a dependence of this scaling on rainfall type, distinguishing between convective and stratiform rainfall as latent heat release during convective storms may invigorate the storm leading to stronger uplift, moisture convergence and super-CC scaling. Berg et al (2013) used sub-hourly data from Germany to detect super-CC scaling limited to convective precipitation, with stratiform precipitation characterized by ∼CC scaling. Panthou et al (2014) also note that for Canada for short durations (≤1 h) and below 20 °C, the rainfall intensity increases with temperature, with a shift from (super-)CC scaling to sub-CC scaling with the longer durations more typical of synoptic-scale rainfall. Similar approaches have been adopted in other regions, for example, Berg and Haerter (2013), Loriaux et al (2013), Molnar et al (2014).
In this paper we use newly compiled hourly precipitation data for the UK to quantify the seasonal scaling between hourly precipitation intensity and mean temperature. Furthermore, building upon the recent work examining differences in scaling between convective and stratiform rainfall we use atmospheric circulation indices to investigate the dependency of this relationship for different large-scale atmospheric regimes. These indices are further used to explore the wider role of large-scale influences on intense hourly rainfall for the UK. Such analyses will help assess the potential for increases in rainfall intensities as a consequence of a warming atmosphere as hypothesized by the CC relation. Further, by examining the influences of both large-scale conditions and their interaction with local thermodynamics it is hoped to gain a better understanding of the drivers of intense rainfall on sub-daily timescales.
2. Data and methods
We use an hourly rainfall dataset compiled from three sources: the UK Met Office Integrated Data Archive System (UK Meteorological Office 2012), tipping bucket rain gauge data from ∼1300 gauges across England and Wales from the Environment Agency (EA); 11 gauges from the Scottish Environmental Protection Agency. These data have been subjected to various quality control procedures to identify suspect values, accumulated totals and periods of gauge malfunction (Blenkinsop and Fowler 2014).
Any data identified as suspect were treated as missing for the purpose of this analysis. For all gauges an individual year/season is only considered if no more than 15% of data is missing. To apply a dataset which adequately captures the behaviour of extremes, gauges with a sufficient record length are required. However, imposing a requirement for too long a record limits the available data and the capacity for meaningful analysis. A length of 20 years was considered an appropriate compromise—the period 1992–2011 providing the greatest number of available gauges. Gauges were therefore excluded from the analysis if more than 15% of all years/seasons over this period were missing. As a result, 315 gauges were available for analysis (figure 1) for the period 1992–2011, although due to variations in the amount of missing data the number of usable gauges differed seasonally: DJF—228; MAM—269; JJA—224; SON—282.
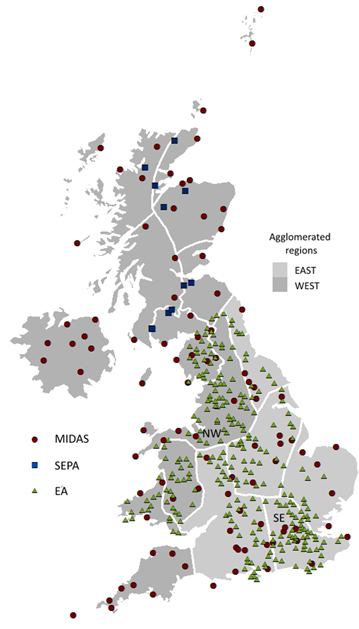
Figure 1. Map of rain gauges used in this analysis and their source. Station selection is subject to the criteria detailed in the text and not all stations are used for each season. The shaded areas identify two agglomerated regions used to examine spatial consistency of CC scaling—the light shaded region is referred to as east, the dark shaded region as west. These are made up from the smaller UK extreme precipitation regions defined by Jones et al (2014) of which South East (SE), North West (NW) are referred to later.
Download figure:
Standard image High-resolution imageWhilst the UK daily precipitation climatology has been well described, hourly precipitation has, to date, received little attention. Blenkinsop and Fowler (2014) used the dataset described here to show that for most of the year hourly precipitation intensities are greatest to the west of the UK, decreasing to the east, reflecting the dominance of westerly synoptic-scale weather systems. However, in summer (JJA) the greatest intensities are in the south and the lowest in northern Scotland, reflecting the increased role of local-scale convective storms. Analysis of the median annual maxima (RMED) statistic and peaks over threshold (POT) events show similar spatial patterns and that for most locations intense hourly events are most likely to occur in summer.
Mean daily temperature (average of mean daily maximum and minimum) for each rain gauge location was obtained from the UKCP09 observed gridded dataset (Perry and Hollis 2005, Perry et al 2009)5 . This is based on surface observations and covers the UK at a 5 × 5 km resolution for the period 1960–2011 and provides data for all the gauges used in this analysis.
Finally, daily atmospheric circulation characteristics are represented by the circulation indices described by Jenkinson and Collison (1977). These have been demonstrated to be a means of objectively classifying daily circulation into Lamb Weather Types (LWTs) affecting the UK (Jones et al 1993). Three of the indices are examined here: flow direction (d), flow strength (s) and shear vorticity (z), using the series produced by Jones et al (2013)6 using reanalysis data (mean sea-level pressure data are used for selected grid points at a resolution of 5° latitude by 10° longitude) for the synoptic hour 1200. These provide the means for a relatively coarse scale assessment of circulation influence on scaling as the same indices values are applied across the UK on a given day and do not take account of whether the flow type was transient or persistent.
Here, we use the method previously applied by Hardwick Jones et al (2010) to identify seasonal scaling relationships for hourly precipitation with daily mean temperature. Maximum hourly intensities from each wet day (Pmax) are calculated and are compared with the daily mean temperature (Tavg). To correspond with the calculation of mean daily temperatures, Pmax is determined using a 24 h period terminating at 0900. The values of Pmax (by definition Pmax > 0) are then allocated to one of 10 Tavg bins. Variable bin widths are used such that each bin has approximately equal numbers of data values (as in Hardwick Jones et al 2010, Utsumi et al 2011) and so differences in the number of observations per bin can be ignored. The nth quantile (qn) of each bin is then estimated for each location and the scaling exponent (α) of extreme precipitation with temperature is quantified using an exponential regression by fitting a least-squares linear regression to the logarithm of precipitation amount (as in Hardwick Jones et al (2010)).
3. Results
3.1. Extreme precipitation scaling with temperature
An example of the application of this method for an individual site, Bracknell in SE England (region SE in figure 1), is shown in figure 2 for summer (JJA), indicating a CC scaling between q99 and Tavg. However, the possibility that the estimation of qn and α may not be robust to the amount of data in each bin was investigated by repeating this process for each station using two approaches. Firstly, by analysing each station independently as described and secondly by pooling neighbouring stations before estimating q99. Pooling was undertaken by identifying up to five neighbouring gauges subject to a maximum separation distance of 15 km. This meant that not all gauges were allocated a neighbouring gauge for pooling but prevented those with potentially large differences in precipitation characteristics from being pooled. The variability of this relationship across the UK and the resulting distribution of the scaling for summer is shown in figure 3(a) using the pooled gauges approach. The median of the distribution approximates that of CC scaling at 6.9% °C−1 but in other seasons the scaling is typically lower: 3.2% °C−1 (DJF), 4.7% °C−1 (MAM), 3.9% °C−1 (SON). These statistics were almost identical to those obtained when estimating q99 using the single station approach (6.9% °C−1 (JJA), 3.7% °C−1 (DJF), 4.8% °C−1 (MAM), 4.0% °C−1 (SON)). This average scaling does not approach the 2xCC noted elsewhere although the potential for super-CC scaling at individual locations is demonstrated for JJA, however, this may arise as a statistical consequence of sampling a large number of sites. Other studies have noted a spatial dependency in the scaling (e.g. Panthou et al (2014)—Canada, Hardwick Jones et al (2010)—Australia) however the results here did not display a pattern that might indicate regional climatic controls on the temperature-precipitation relationship in any season (figure 3(b), JJA only). Figure 3(c) however indicates that for JJA scaling is lower for lower percentiles (q50–q95), with an absence of scaling for the median, although as for q99 all percentiles are characterized by a relatively large range. For DJF the opposite pattern occurs (not shown) with a decrease in scaling from 11.4% °C−1 for q50 to 3.2% °C−1 for q99. Again, similar results were obtained using single gauges and so subsequent discussion is confined only to the pooled gauge approach.

Figure 2. Scaling relationships between summer (JJA) mean daily temperature (Tavg) and maximum hourly precipitation (Pmax). For each of ten temperature bins the 99th percentile (q99) is calculated and an exponential regression (least-squared linear regression using the log of precipitation) is fitted as denoted by the solid line. Example shown is for Bracknell for the period 1992–2011 (SE Region in figure 1). The dashed grey lines denote CC scaling and the vertical lines denote the temperature bins: temperature-precipitation pairs are plotted at the mean of the temperature bin boundaries.
Download figure:
Standard image High-resolution image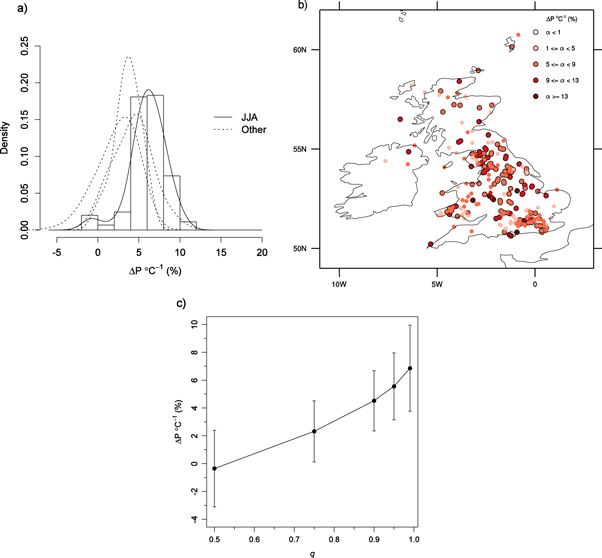
Figure 3. (a) Distribution of the scaling exponent (α) for JJA q99 for all UK gauges estimated from linear regression coefficients as described in the text. Distributions for other seasons are summarized by the dotted lines. (b) Spatial distribution of α for JJA, outlined symbols denote statistical significance at the 95% level. (c) Variation of the UK mean α for JJA for different precipitation percentiles (q), error bars denote ±1 s.d.
Download figure:
Standard image High-resolution imageIn part, variability in the scaling relationship may be due to the application of the linear regression approach as a single extreme event, particularly in the upper or lower temperature bins, can strongly influence the linear regression. Furthermore, several studies have also noted that linear scaling may not hold consistently across the whole temperature distribution (e.g. Lenderink and van Meijgaard (2008), Hardwick Jones et al (2010)). It is therefore concluded that linear relationships are not an appropriate means by which extreme precipitation-temperature scaling should be characterized in this dataset. Therefore, the gauge-estimated Tavg and qn(Pmax) relationships for the UK were pooled (as in Berg et al 2009, Hardwick Jones et al 2010, Utsumi et al (2011)) to obtain a larger sample and visualized with scatter density plots (figure 4) for each season. A LOESS-estimated relationship (locally-weighted scatterplot smoothing (Cleveland 1979)) between the two variables is then used to describe the scaling behaviour across the UK as a whole.

Figure 4. Seasonal density plots showing Tavg bins and qn (Pmax) for pooled UK gauges. Solid blue lines indicate the LOESS-estimated relationship between log10 (qn(Pmax)) for q99, q90 and q75 and Tavg, the dashed red lines indicate CC and 2xCC scaling.
Download figure:
Standard image High-resolution imageFigure 4 confirms that the relationship between extreme hourly precipitation and temperature varies throughout the year and in some seasons is also not adequately summarized by a linear relationship. In summer, whilst the overall relationship for q99 approximates CC scaling, the relationship is sub-CC up to ∼15 °C but exceeds it above this threshold. For lower quantiles, the same change point in the scaling is observed but the overall scaling is weaker. A similar relationship is observed in spring though the point of inflexion occurs at ∼10 °C. Although this is at a lower temperature than in summer it represents a more extreme part of the seasonal temperature distribution and is only evident for q99, with the scaling at ∼1.5x CC above this threshold. In autumn, there is only a slight change in the scaling at higher temperatures whilst in winter scaling is sub-CC with evidence of a decrease above ∼6 °C. It is also noteworthy that the absolute magnitude of q99 is greatest in summer, emphasizing the importance of this season for potential flooding from short-duration, intense rainfall events. The seasonal differences identified could point to a shift in rain type from stratiform to convective rain. This would be at a lower temperature in spring compared to summer because solar heating is strong relative to air mass temperature (producing 'April showers') whereas in autumn convection is restricted mostly to warm air-masses early in the season.
It is possible that the relationships identified in figure 4 for the whole UK may arise as a consequence of the uneven spatial distribution of gauges; however, the scaling relationships for winter and summer are consistent with those obtained from a gridded radar product with uniform coverage (Chan et al 2015). The consistency of these results across the UK was examined further for summer using the extreme rainfall regions determined by Jones et al (2014) and highlighted in figure 1. Using individual regions would however yield too few temperature-precipitation pairs to robustly estimate a LOESS fit so two large regions were aggregated from these regions—'eastern' (broadly low elevation) and 'western' (higher elevation), comprising 104 and 120 gauges respectively and depicted by the two shaded regions in figure 1. These reflect in very general terms the different topographic influences on UK rainfall. This regional analysis showed that the summer pattern of slightly greater than CC scaling at high temperatures is consistent for both parts of the UK although in spring the increased scaling at higher temperatures is only detected for the eastern domain (not shown). In winter, the dominance of large-scale systems across the whole UK means that both regions have similar, sub-CC scaling, although with higher precipitation amounts in the west reflecting the higher mean rainfall in this region due to orographic enhancement.
3.2. Large scale drivers of intense rainfall
Extreme UK daily precipitation in winter and autumn has been shown to be strongly influenced by synoptic-scale 'atmospheric rivers' (Lavers and Villarini 2013). These are located in the lower troposphere within the warm sector of extra-tropical cyclones (Neiman et al 2011) which forms a filament associated with the cyclonic circulation and have been identified as an important mechanism in causing floods (Lavers et al 2011). An improved understanding of the atmospheric 'precursors' for intense summer rainfall is similarly important, not only for the improvement of flood forecasting but also for the assessment of the representation of intense rainfall in climate models. Wasko and Sharma (2014) demonstrate an approach that allows the incorporation of additional covariates in the estimation of precipitation scaling for individual stations but this may not be appropriate where the relationship is non-linear. Therefore, we begin to examine the influence of large-scale circulation by firstly examining the dependency of the scaling relationships identified above by using the flow direction (d), flow strength (s) and shear vorticity (z) indices to subset days, repeating the above analysis to assess their influence on summer q99(Pmax). Secondly, we consider the wider dependency of the occurrence of intense events on relevant indices. For this analysis, Pmax was recalculated using a 24 h period ending at 0000 as the flow indices represent daily atmospheric conditions at a central time of 1200.
To examine the scaling dependency on the flow indices two groups based on each index were compared in turn to maintain a sufficient sample size to estimate qn. Figures 5(a) and (b) show a clear dependency of the scaling relationship on z. For days where z < 0 (negative shear vorticity indicative of anticyclonic rotation) approximately 2xCC scaling is observed at higher temperatures. In contrast, where z > 0 (positive shear vorticity indicative of cyclonic rotation) the scaling relationship is approximately CC across the whole temperature range. This behaviour is also apparent for spring but is absent in autumn and winter (not shown) which suggests that it is the behaviour on days with anticyclonic flow which has a significant role in accounting for the seasonal differences in scaling observed in figure 4. In summer (and to a lesser extent spring), anticyclonic conditions are associated with large, positive anomalies of maximum daily temperature (Blenkinsop et al 2009) but also with localized, showery events which are more likely to be convective in nature, in contrast with cyclonic conditions which are more often associated with large-scale weather systems.

Figure 5. Density plots showing Tavg bins and q99 (Pmax) for pooled UK gauges for summer (JJA). Solid blue lines indicate the LOESS-estimated relationship between log10(q99(Pmax)) and Tavg, the dashed red lines indicate CC and 2xCC scaling. Days have been separated between those where (a) z < 0, (b) z > 0, (c) 105 < d < = 285, (d) 285 < d and d < = 105, (e) s lower than median and (f) s greater than median.
Download figure:
Standard image High-resolution imageFor d the scaling was examined for 180° sectors, at 15° intervals (0°–180°, 15°–195°...), to assess the different air masses that affect the UK. As some ranges of d occur relatively infrequently these groups were necessarily wide. A similar, though less pronounced contrast in scaling as observed for z was noted between conditions when flow was from southerly and westerly directions compared with northerly and easterly flow (figures 5(c) and (d)). An enhanced scaling is observed for temperatures over ∼18 °C (figure 5(c)) under the former conditions with more consistent CC scaling under the latter (figure 5(d)). A comparison of the LWTs associated with the conditions z < 0 and 105 < d ≤ 285 indicated that the former are predominantly classified as an anticyclonic weather type (66% of days) whereas the latter are predominantly divided between anticyclonic, cyclonic and a combination of southerly, south-westerly or westerly weather types (33, 30 and 32% respectively).
Finally, a similar examination of the influence of flow strength (figures 5(e) and (f)) was undertaken by examining days in groups of those below (weak flow) and above (strong flow) the median s. Scaling is approximately CC in both instances with only slightly lower scaling under stronger flow conditions.
The dependency of intense events on large scale dynamics is considered by further examining the summer relationship between z and Pmax. For each gauge, Pmax data was this time binned according to the value of z. Figure 6(a) shows the distribution of the proportion of wet events (Pmax ≥ 0.2) across all gauges and indicates the strong dependence of rainfall occurrence on z. The distribution of the median Pmax (q50) for each z bin (figure 6(b)) also indicates that typical maximum daily intensities are associated with higher positive z values, i.e. strongly cyclonic shear vorticity. This is indicative of increased moderate intensities under cyclonic flow conditions. Figure 6(c) however, shows that considering the UK as a whole, for more intense events denoted by the 99th percentile (q99(Pmax)) of each vorticity bin there is less dependency on z. This indicates that such events are less dependent on the occurrence of cyclonic shear vorticity. It is however noted that for z < 0, 65% of the most intense events indicated by the outliers are derived from the South East region (red circles) denoted in figure 1 (SE, 36 gauges), compared with only 15% for z > 0.
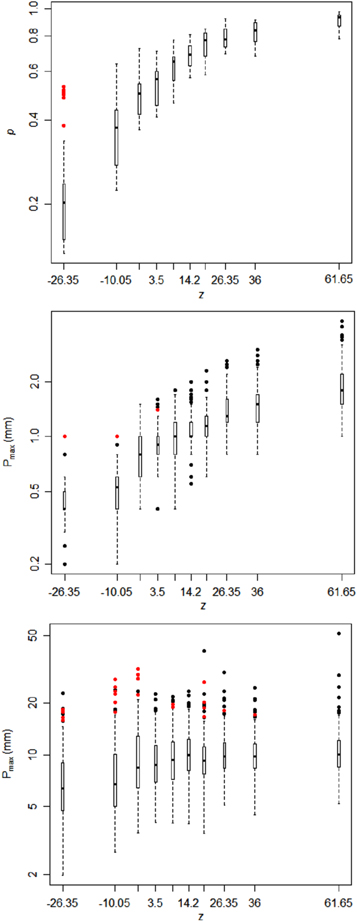
Figure 6. Distribution of (a) the summer (JJA) proportion (p) of wet events (Pmax ≥ 0.2) for all gauges for 10 shear vorticity (z) bins, (b) JJA Pmax for all gauges for 10 shear vorticity (z) bins for q50, (c) as for b) but for q99. Outliers for each bin are shown by circles—red circles identify events from gauges in the SE region, all other regions identified by black circles—and are determined as upper (lower) quartile + (−) 1.5 times the inter quartile range.
Download figure:
Standard image High-resolution imageFigure 7 considers the spatial variation in the influence of z further by comparing the distributions of Pmax using the Jones et al (2014) extreme rainfall regions—here the South East and North West (NW, 32 gauges) regions are compared for conciseness. This shows that the latter is characterized by more intense events across the whole distribution when z > 0 but the former region has a longer tail and higher intensities for the highest ∼10% of events when z < 0. We note however, that care is needed in the interpretation of these results as the tail of the distribution may be highly sensitive to sampling error.
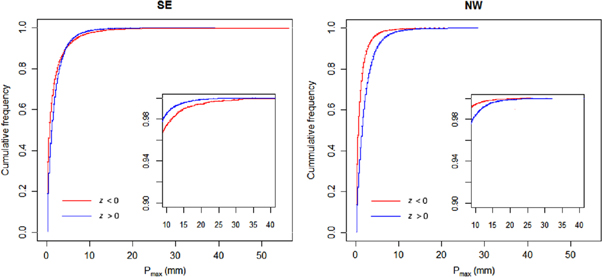
Figure 7. Cumulative distributions of Pmax for South East (SE) and North West (NW) regions for negative and positive shear vorticities (z) for summer (JJA). Insets show upper tails of the distributions.
Download figure:
Standard image High-resolution imageTo examine the influence of z on the occurrence of defined intense events, a POT approach was used to identify specific events. POT1 was used to identify events for JJA, this representing the largest 1 × n events, where n is the number of years in the record (i.e. a complete 20 year record would identify the 20 largest hourly totals). The declustering algorithm described by Ferro and Segers (2003) was used to identify independent rainfall events. This applies an extremal index based on event inter-exceedence times to identify independent clusters from which the maxima may be extracted to identify potential POT events. Events were again separated into those occurring when z < 0 and z > 0 to maintain sufficient data samples in each category to robustly compare the influence of z on POT1. Again the SE and NW regions were compared.
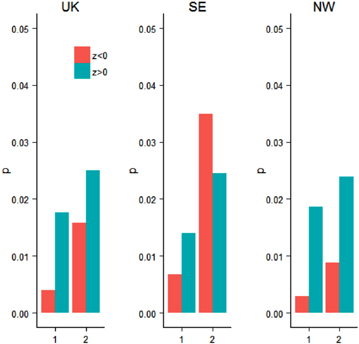
For both regions the probability of rainfall occurrence (p) is more likely when z > 0 (p = 0.57 and 0.78 respectively), compared with when z < 0 (p = 0.2 and 0.34 respectively), as demonstrated in figure 6. Across the UK as a whole the probability of a POT1 event occurring is greater when z > 0 (UK, figure 8), partly reflecting the more frequent rainfall occurrence under this condition. However, when only wet days are considered (i.e. conditional upon rainfall occurrence) whilst the probability of a POT1 event remains greatest for z > 0 for the UK as a whole (including NW), for SE the probability of a POT1 event is highest when z < 0, i.e. if it rains in SE then it is more likely to be intense if z < 0. This is also consistent with figure 6 and may be related to the occurrence of higher summer temperatures in this area compared to other parts of the UK. These days are therefore more frequently sampled from the upper temperature range of the JJA plot in figure 4 in this region and thus more likely to produce a higher POT1 event. In the SE of England therefore, negative z is less likely to produce rainfall but if rainfall occurs it is more likely to be an intense event than if z is positive.
Figure 8. Probabilities of POT1 occurrence for the whole UK and for the SE and NW regions for summer (JJA). For z < 0 and z > 0 plots show (1) probability of a POT1 event based on all days; (2) probability of a POT1 event given rainfall occurrence.
Download figure:
Standard image High-resolution image
4. Discussion and conclusions
This paper examines the scaling relationship between mean air temperature and extreme hourly precipitation using a new UK hourly precipitation dataset. This showed that the distribution of a linear scaling relationship between mean daily temperature and the 99th percentile of maximum hourly precipitation across all the gauge locations is centred around 6.9% °C−1 in summer (approximate CC scaling) but is lower at other times of the year. However, we consider that the use of a linear model is problematical to characterize the relationship, particularly with relatively short gauge records. Furthermore, after pooling the data we find evidence that the relationship between these variables is non-linear as identified in other regions (e.g. Lenderink and van Meijgaard (2008), Hardwick Jones et al (2010)). In spring and summer, at lower temperatures the scaling is sub-CC but exceeds CC scaling at higher temperatures, although notably less than the 2xCC scaling observed elsewhere (e.g. Lenderink and van Meijgaard (2008), Hardwick Jones et al (2010)). A similar scarcity of locations displaying super-CC scaling was noted in Switzerland by Molnar et al (2014). In autumn and winter a fairly consistent sub-CC scaling is observed. The scope for regional analyses is limited by data availability but the same general relationships are identified for western and eastern regions in most seasons.
Representation of the large-scale atmospheric circulation over the UK through the use of airflow indices has shown that these seasonal differences reflect the superposition of different scaling relationships for different circulation regimes, defined largely by differences in shear vorticity (z), which represents the cyclonicity of the flow. Super-CC scaling is identified in spring and summer on higher temperature days with negative z. Seasonal differences in scaling may therefore be at least partly related to seasonal variation in the large-scale atmospheric circulation and hence precipitation type.
Trenberth et al (2003) have summarized the factors influencing the characteristics of precipitation and indicate that the prospect of changes in atmospheric circulation add complexity to likely local changes in precipitation. The dependency of the form of relationship between temperature and precipitation extremes on circulation characteristics is an example of one such mechanism, demonstrating that future changes in intense rainfall may not necessarily be solely prescribed by a simple interpretation of CC scaling. The results here suggest that more frequent anticyclonic conditions as well as a warming on such days could produce more intense rainfall events and so a better understanding of large-scale dynamics and local thermodynamics is important.
The association of extreme precipitation with large-scale atmospheric regimes has received considerable attention, particularly for daily totals in relation to 'atmospheric rivers' but how large scale drivers may interact with thermo-dynamic processes and influence sub-daily extremes is not so well explored (Boucher et al 2013). The results presented in this paper complement recent research using both modelled outputs and observed data which have used a range of techniques to identify disparate scaling behaviour characteristic of stratiform and convective precipitation types (e.g. Berg et al 2009, Berg and Haerter 2013, Loriaux et al 2013, Molnar et al 2014, Panthou et al 2014). These analyses are consistent with the higher scaling observed for the UK in spring and summer, and may be reflecting a transition from the dominance of large-scale to localized convective rain with higher temperatures in these seasons. It may be therefore that greater atmospheric instability (associated with high surface temperatures) favours convective rain invigorated by latent heat release resulting in enhanced updraughts. Alternatively, it may be a consequence of quasi-stationary storms in light wind conditions typical of anti-cyclonic regimes. One of the limitations of the flow indices used here is through their relative temporal and spatial coarseness and therefore their inability to provide detailed dynamic, local scale conditions.
This paper does demonstrate that large scale dynamics as well as local thermodynamic processes exert an influence over intense UK sub-daily rainfall but that greater understanding of these and their spatial variability is required. Examination of Pmax and POT1 events for SE England indicates that for this region the highest intensities are associated with negative shear vorticity (indicative of anticyclonic flow) and that the effect of increased rainfall from super-CC scaling may be most important here. This is perhaps consistent with the identification of a high convective available potential energy (CAPE) in this region (Holley et al 2014) along with limited analyses of thunderstorm climatologies for the UK which have indicated greater storm incidence in the south eastern part of the UK (Holt et al 2001, van Delden 2001).
As well as providing a potential contributory mechanism for future increases in intense rainfall (Lenderink et al 2011, Yu and Li 2012) and thus flash floods under conditions of a warming atmosphere, the relationships and processes identified here could have important applications in the assessment of climate model projections of future intense UK summer rainfall. The emerging generation of very high-resolution climate modelling experiments (e.g. Kendon et al 2012, Ban et al 2014) provides the opportunity to use climate models to improve future projections as well as our understanding of processes. These models have been demonstrated to reproduce aspects of the observed temperature-precipitation scaling relationship (Chan et al 2015) consistent with projections of an intensification of hourly extreme precipitation (Kendon et al 2014). However, whilst the results presented here suggest that more frequent anticyclonic conditions as well as a warming on such days would produce more intense rainfall events, Chan et al (2015) identify a decrease in scaling at high temperatures in future model simulations that is associated with a shift to anticyclonic conditions. This appears at odds with our results but one possible explanation is the long-term shift to anticyclonic conditions in the future impacting on moisture availability, but which doesn't appear to be the case for short-term departures to anticyclonic conditions in the present-day. Their simulations of future rainfall do project an increase in rainfall intensities but sample higher temperatures not found in the current climatology and which behave in a different way. Moisture availability may be a major constraint on precipitation intensity (e.g. Pall et al (2007), Berg et al (2009)) and where relevant data is available combined temperature–humidity measures such as dew point temperature may be used ( e.g. Lenderink and van Meijgaard (2008), Lenderink et al (2011)). The provision and analysis of high quality sub-daily observations such as those used here are an essential part of assessing and understanding such processes and models.
A more detailed process understanding of intense sub-daily events does require the analysis of additional local-scale predictors and the development of appropriate methods to do so. Ongoing work will therefore examine the role of local thermodynamic drivers coupled with influences of large scale dynamics on intense rainfall using the dataset described here as well as other global sub-daily precipitation datasets. Such analyses will provide the means to identify where useful information may be extracted from both very-high resolution and more coarse climate models. This, in turn is an important step in providing more credible projections of future changes in intense summer rainfall.
Acknowledgments
This research was undertaken as part of the CONVEX project which is supported by the United Kingdom NERC Changing Water Cycle programme (grant NE/I006680/1). It was also supported by the NERC-funded SINATRA project (NE/K008595/1). Hayley Fowler is funded by the Wolfson Foundation and the Royal Society as a Royal Society Wolfson Research Merit Award (WM140025) holder. Elizabeth Kendon gratefully acknowledges funding from the Joint Department of Energy and Climate Change (DECC) and Department for Environment Food and Rural Affairs (Defra) Met Office Hadley Centre Climate Programme (GA01101). The hexagon scatter density plots were produced using the R package 'hexbin' by Dan Carr and ported by Nicholas Lewin-Koh and Martin Maechler, available from http://cran.r-project.org/web/packages/hexbin/index.html. We thank the two anonymous reviewers whose comments helped improve the paper.
Footnotes
- 5
This data is available for non-commercial use from the UK Met Office at www.metoffice.gov.uk/climatechange/science/monitoring/ukcp09/.
- 6
This data and associated LWTs are available from the Climatic Research Unit, University of East Anglia at: www.cru.uea.ac.uk/cru/data/lwt/.