Article

Energy Consumption of a Battery Electric Vehicle with Infinitely Variable Transmission

by
Francesco Bottiglione
1,†,
Stefano De Pinto
1,2,†,
Giacomo Mantriota
1,* and
Aldo Sorniotti
2,†
1
Dipartimento di Meccanica, Matematica e Management, Politecnico di Bari, Bari 70176, Italy
2
Department of Mechanical Engineering Sciences, University of Surrey, Guildford GU2 7XH, UK
*
Author to whom correspondence should be addressed.
These authors contributed equally to this work.
Energies 2014, 7(12), 8317-8337; https://doi.org/10.3390/en7128317
Submission received: 21 October 2014 / Revised: 20 November 2014 / Accepted: 3 December 2014 / Published: 12 December 2014

Abstract

:
Battery electric vehicles (BEVs) represent a possible sustainable solution for personal urban transportation. Presently, the most limiting characteristic of BEVs is their short range, mainly because of battery technology limitations. A proper design and control of the drivetrain, aimed at reducing the power losses and thus increasing BEV range, can contribute to make the electrification of urban transportation a convenient choice. This paper presents a simulation-based comparison of the energy efficiency performance of six drivetrain architectures for BEVs. Although many different drivetrain and transmission architectures have been proposed for BEVs, no literature was found regarding BEVs equipped with infinitely variable transmissions (IVTs). The analyzed drivetrain configurations are: single- (1G) and two-speed (2G) gear drives, half toroidal (HT) and full toroidal (FT) continuously variable transmissions (CVTs), and infinitely variable transmissions (IVTs) with two different types of internal power flow (IVT-I and IVT-II). An off-line procedure for determining the most efficient control action for each drivetrain configuration is proposed, which allows selecting the optimal speed ratio for each operating condition. The energy consumption of the BEVs is simulated along the UDC (Urban Driving Cycle) and Japanese 10-15 driving cycle, with a backward facing approach. In order to achieve the lowest energy consumption, a trade-off between high transmission efficiency and flexibility in terms of allowed speed ratios is required.

Graphical Abstract

1. Introduction

Hybrid electric vehicles (HEVs) and battery electric vehicles (BEVs) are emerging as feasible solutions, especially for urban mobility, because of their environmental performance, including zero emission driving. HEVs and BEVs are characterized by different architectures according to the transmission system layout and number of propulsion units [1,2,3]. Both HEVs and BEVs use electric motors (EMs) as primary or secondary sources of mechanical power. Compared with internal combustion engines (ICEs), EMs have better torque characteristics. In fact, at low speeds, including null speed, they can work at their maximum torque, without the need for a friction clutch and the related auxiliary systems, whilst at high speed the operation is limited by a constant power region [4]. HEVs and BEVs usually work in several states: for example, hybrid mode (which can include several sub-states), all-electric mode, brake regeneration mode and battery charging mode. In particular, the all-electric mode can pose limitations in terms of maximum vehicle speed or reduced acceleration performance and gradeability, depending on the maximum EM speed and torque. At the moment EMs for BEVs are usually coupled with single-speed transmissions even if this configuration constrains their performance, especially in case of electric motors characterized by a limited speed range. For this reason automotive research is moving towards transmission systems that can improve EM performance in HEVs and BEVs [5].
A first possible solution to increase the performance of electric drivetrains is the adoption of two-speed transmission systems [6,7], in which the two gear ratios are chosen with particular focus on acceleration and gradeability performance (first gear) and top speed (second gear). Moreover, as the efficiency of an electric drivetrain is a function of torque and speed, a two-speed transmission system increases the flexibility in the selection of the operating region, thus bringing potential energy efficiency benefits [8,9,10,11].
In a recent work [12], Yang et al. describe the development of a new powertrain with two continuously variable transmission modes, based on the operation of two electric motors and a system of clutches and brakes. This system is a modification of the General Motors front-wheel-drive 2-mode hybrid electric drivetrain, with the addition of two new electric-only modes with the aim of increasing torque and acceleration performance in hybrid mode and, at the same time, achieving the best electric-only efficiency.
Powertrain efficiency could be improved by employing continuously variable transmissions (CVTs) in HEVs and BEVs with different architectures, like that of the new Honda Civic Hybrid, adopting an ICE with a pushbelt CVT and a permanent magnet synchronous motor [13,14]. In fact, compared to a manual or automatic gearbox, the CVT enhances the efficiency performance of the electric motor drive because the speed ratio continuously varies thus maintaining the operating condition of the electric motor closer to the most efficient region. However, despite by definition CVTs allow seamless variation of the gear ratio, their acceptance in the world market has been quite limited because of their peculiar driveability characteristics [15]. In HEVs the electric motor can be either coupled to the ICE or directly to the wheels through power split devices [16,17] that can increase the number of possible operating conditions. In general the power split device is an infinitely variable transmission (IVT) that can be mechanical [18,19] or electrical with one (Toyota Prius, Lexus CT200h, Ford C-Max) or two (Chevrolet Tahoe Hybrid) electric motors [20]. CVTs have a well-defined speed ratio range with a minimum value greater than zero, whilst IVTs are characterized by a lower limit of the speed ratio range that can be also zero or negative, thus eliminating the need for a friction clutch in case of ICEs. In past research various power split devices were theoretically analyzed with focus on efficiency [21,22,23] and in some cases they were experimentally implemented and assessed on vehicles. For example, [24,25] experimentally verified some power split configurations on a test rig, also adopted for the characterization of particular operating conditions, like that of neutral gear in [26], and the evaluation of possible novel transmission layouts in [27]. In HEVs and BEVs with IVTs, during brake regeneration the transmission works in reverse mode, with a lower efficiency than in direct mode [28,29]. Although many different drivetrain architectures have been proposed, no literature was found regarding BEVs equipped with IVTs.
The aim of this work is to compare the energy consumption of an urban battery electric vehicle equipped with different transmission layouts: single-speed (1G), two-speed (2G), half toroidal CVT (HT), full toroidal CVT (FT), series-IVT with Type I power flow (IVT-I) [25], and parallel-IVT with Type II power flow (IVT-II) [24]. The energy saving potential of each layout is computed using a backward facing simulation model, in conditions of constant speed and along the UDC (Urban Driving Cycle) and Japanese 10-15 urban driving cycle. The gear ratio selection is carried out according to look-up tables, deriving from an off-line optimization algorithm. By using the numerical model of each transmission, the off-line optimization maximizes the efficiency of the powertrain for all possible operating conditions [30,31,32]. The IVT efficiency is evaluated through the simple approach in [33] and considering the effect of the operating conditions on the CVT efficiency.

2. BEV Simulation Model

The case-study vehicle is an urban passenger car, implemented in the form of a physical prototype within the European Union FP7 PLUS-MOBY project [34]. The simulation model is developed following a backward facing approach. It includes the aerodynamic drag force, tire rolling resistance and the efficiencies of the mechanical components. The model is suitable for the calculation of the energy consumption with different transmission layouts, all coupled with a final reduction gear having fixed gear ratio (Table 1). The mass of the vehicle is varied according to the transmission type (Table 2) for a fair assessment of the energy consumption results.
Table 1. Vehicle parameters [7].
Pinion-ring gear speed ratioτdiff1:4.474 [-]
Tire radiusRw0.29 [m]
Electric motor inertiaIm0.016 [kg·m2]
First gear ratioτ11:2.724 [-]
Second gear ratioτ21:1.251 [-]
Minimum CVT speed ratio τ CVT min 0.4 [-]
Maximum CVT speed ratio τ CVT max 2.5 [-]
Rolling friction coefficient—constant termf00.01 [-]
Rolling friction coefficient—linear termf10 [s·m−1]
Rolling friction coefficient—quadratic termf26.5 × 10−6 [s2·m−2]
Aerodynamic drag coefficientCx0.32 [-]
Frontal areaS1.407 [m2]
Table 2. Transmission and vehicle weights.
ArchitecturesTransmission Mass [kg]Vehicle Mass + 2 Passengers [kg]
Single-speed (1G)13867
Two-speed (2G)20870
Half Toroidal CVT (HT)22872
Full Toroidal CVT (FT)22872
IVT Type I (IVT-I)30880
IVT Type II (IVT-II)30880

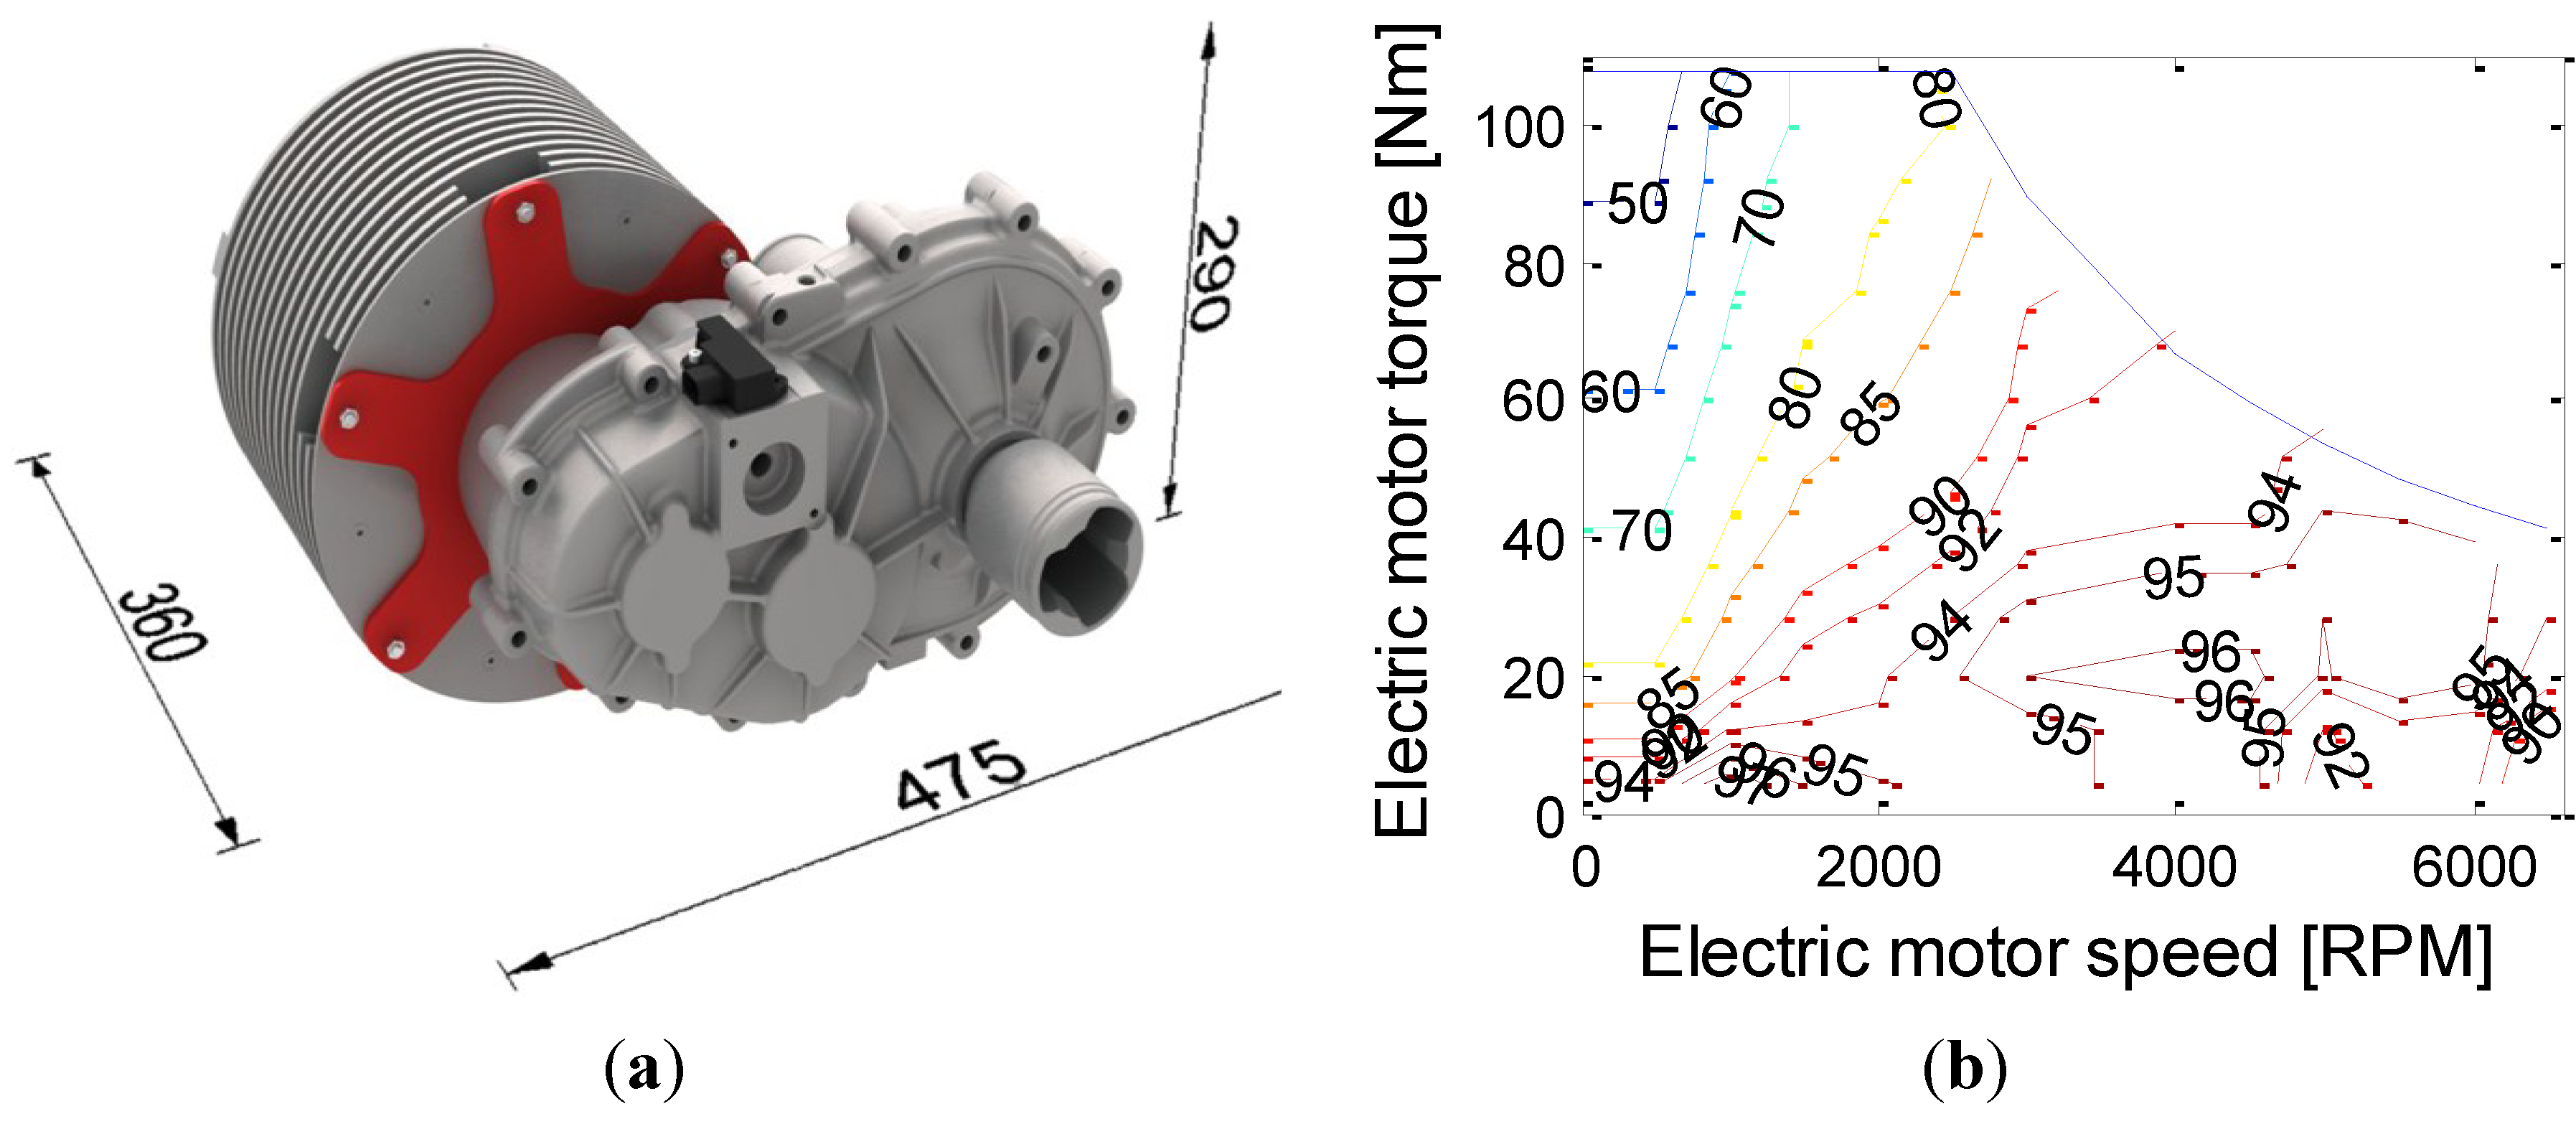
2.1. Electric Motor and Inverter Model

In the specific implementation of this paper, the rear axle of each layout is powered by a 28 kW peak power Permanent Magnet (PM) electric motor, shown in Figure 1a. As depicted in Figure 1b the electric motor has a maximum torque of 108 Nm in the constant torque region, maximum speed of 6500 rpm and it is characterized by a large region in which the efficiency is higher than 90%. At higher speeds its operation is limited to a constant power region.
Figure 1. (a) Permanent Magnet (PM) electric motor coupled with the 1G transmission and (b) electric motor drive efficiency as a function of torque and speed.
Energies 07 08317 g001

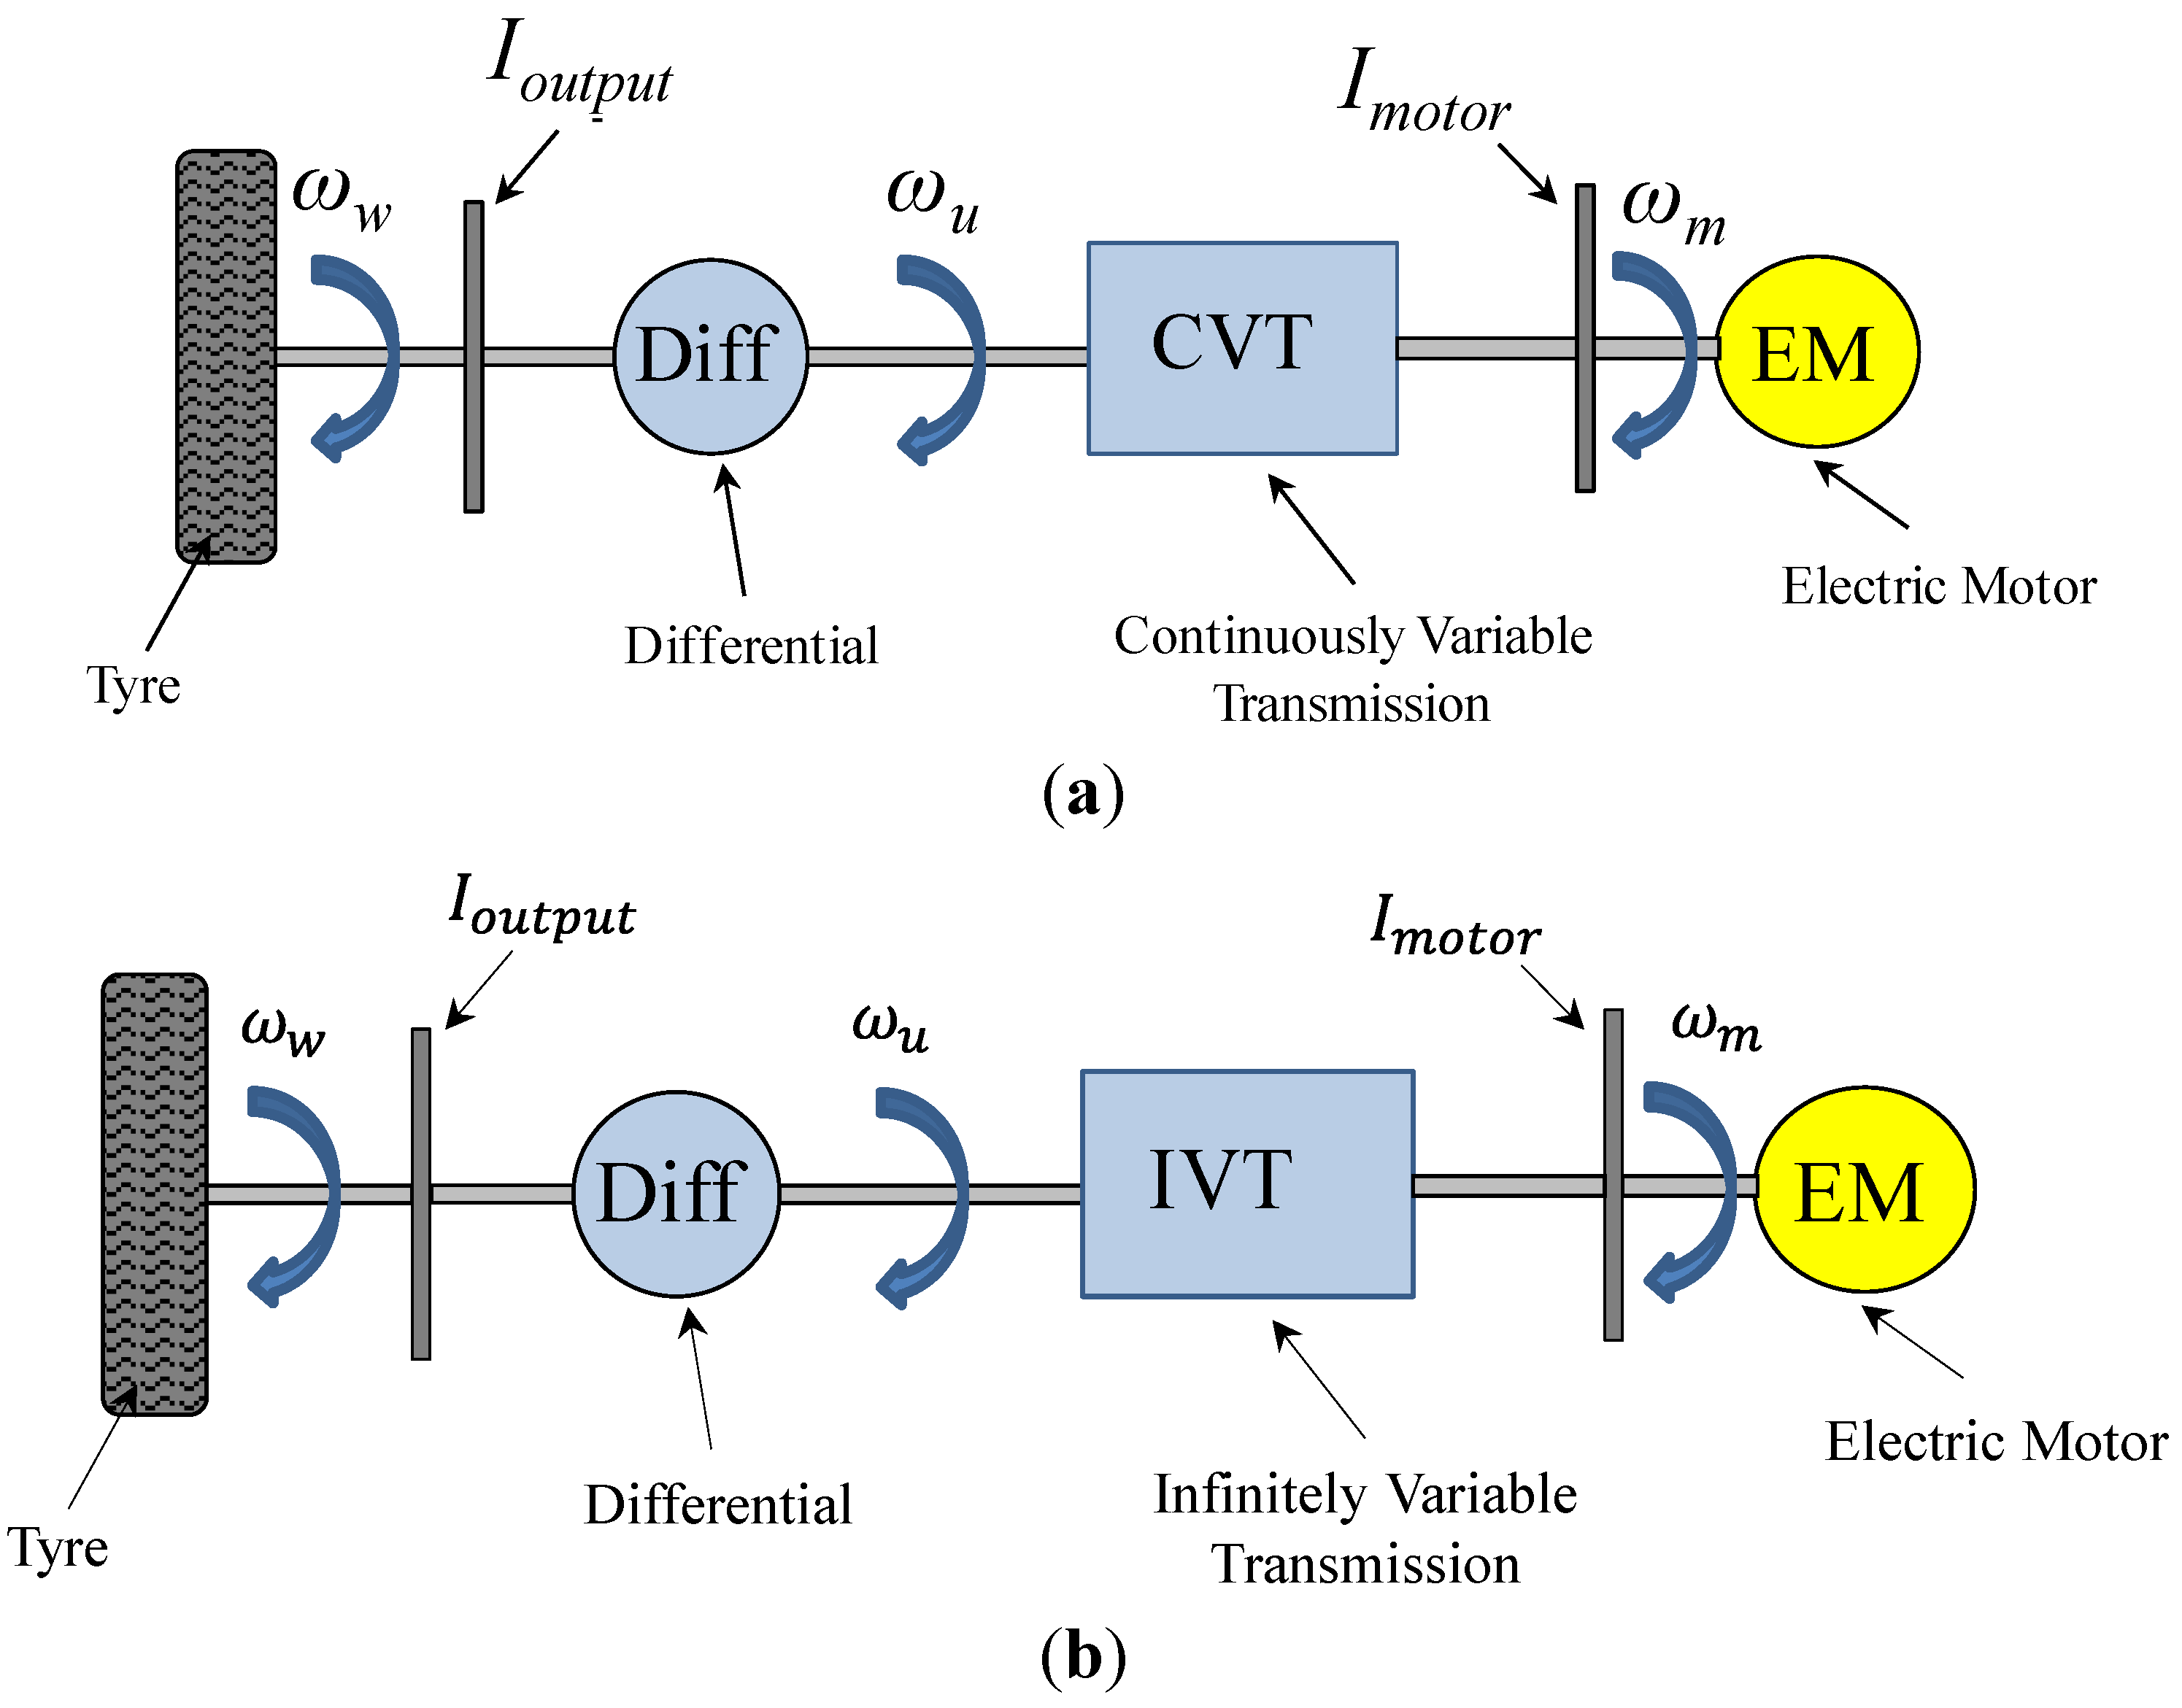
2.2. Transmission Model

In this study the following transmission layouts are compared:
(i)
1G transmission;
(ii)
2G transmission;
(iii)
HT transmission (Figure 2a);
(iv)
FT transmission (Figure 2a);
(v)
HT CVT within a series-IVT with Type I power flow (Figure 2b);
(vi)
HT CVT within a parallel-IVT with Type II power flow (Figure 2b).
BEVs currently on the market typically adopt 1G transmission systems, because of their simplicity and the intrinsically favorable EM torque characteristics. Typical step-ratio transmission prototypes (mostly 2G transmissions) for BEVs provide seamless gearshifts, not to penalize vehicle acceleration performance if the gearshift is actuated in the constant power region of the EM drive.
CVTs and IVTs allow the stepless continuous variation of the gear ratio between the limits imposed by the hardware design. This allows the EM to work closer to the most efficient region while vehicle speed and torque demand are changing.
Figure 2. Vehicle layouts with (a) CVT and (b) IVT. (a) Schematic of the BEV with a CVT; (b) Schematic of the BEV with an IVT.
Energies 07 08317 g002

2.2.1. 1G and 2G Transmissions

The most common BEV drivetrain layout consists of a central EM with a 1G transmission and a differential, in order to reduce manufacturing costs and weight. Although existing BEVs usually adopt single-speed transmissions, this configuration constrains their performance, especially in case of electric motors characterized by a limited speed range [6]. In fact, the single gear ratio is chosen as a trade-off between gradeability, requiring a low value of the gear ratio, and top speed, requiring a high value of the gear ratio.
In a two-speed electric drivetrain, the first gear ratio is selected for providing the required longitudinal acceleration and gradeability performance, whilst the second gear ratio can be designed to provide the specified top speed. Moreover the proper control of the gear selection within a 2G transmission can reduce the energy consumption through the reduction of the electric drivetrain power losses [7]. The gear ratio of the case study 1G transmission is 1:1.251. The first gear ratio of the case study 2G transmission is 1:2.724, and the second gear ratio is 1:1.251. The final reduction ratio is 1:4.474 as shown in Table 1. Transmission efficiency is expressed through a look-up table, as a function of the input torque, speed and operating temperature.

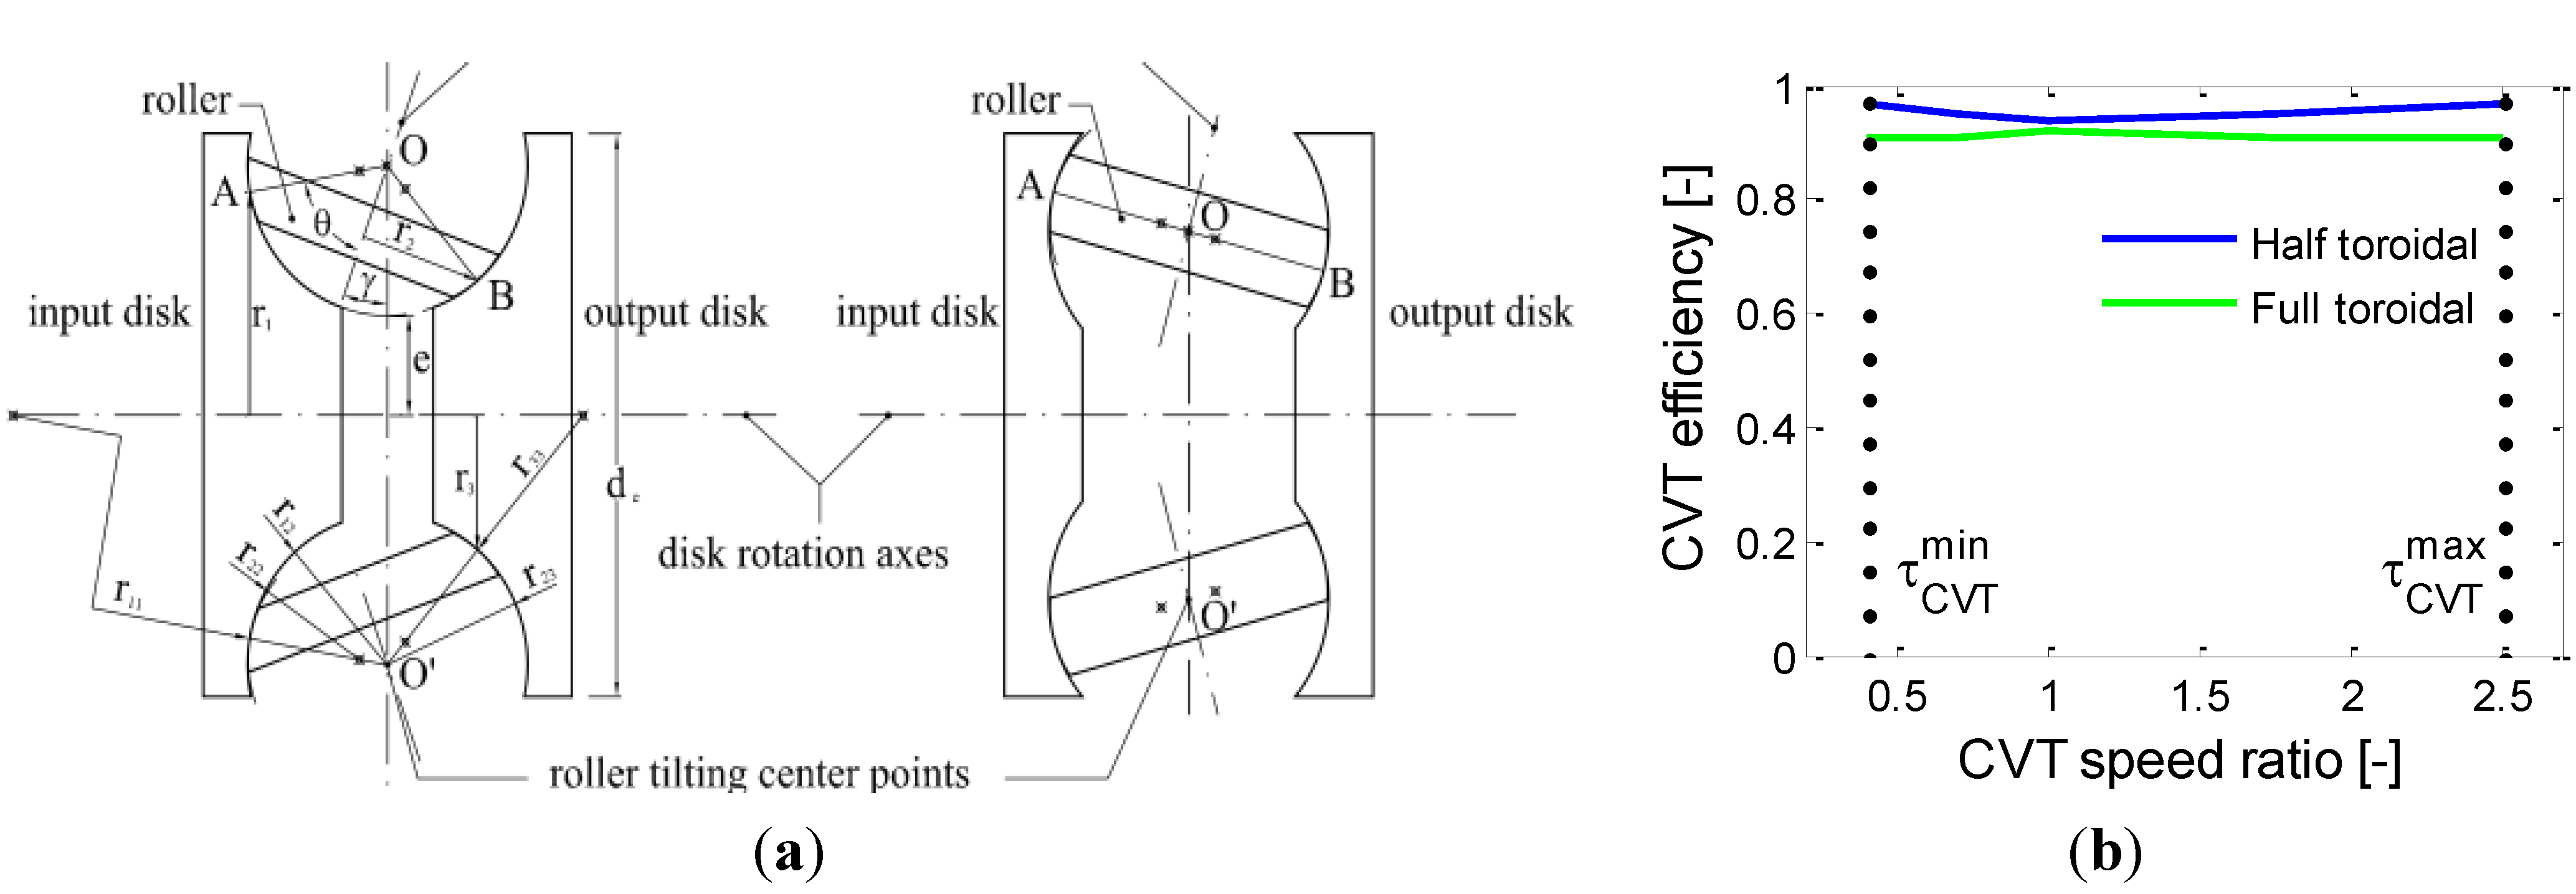
2.2.2. HT and FT CVTs
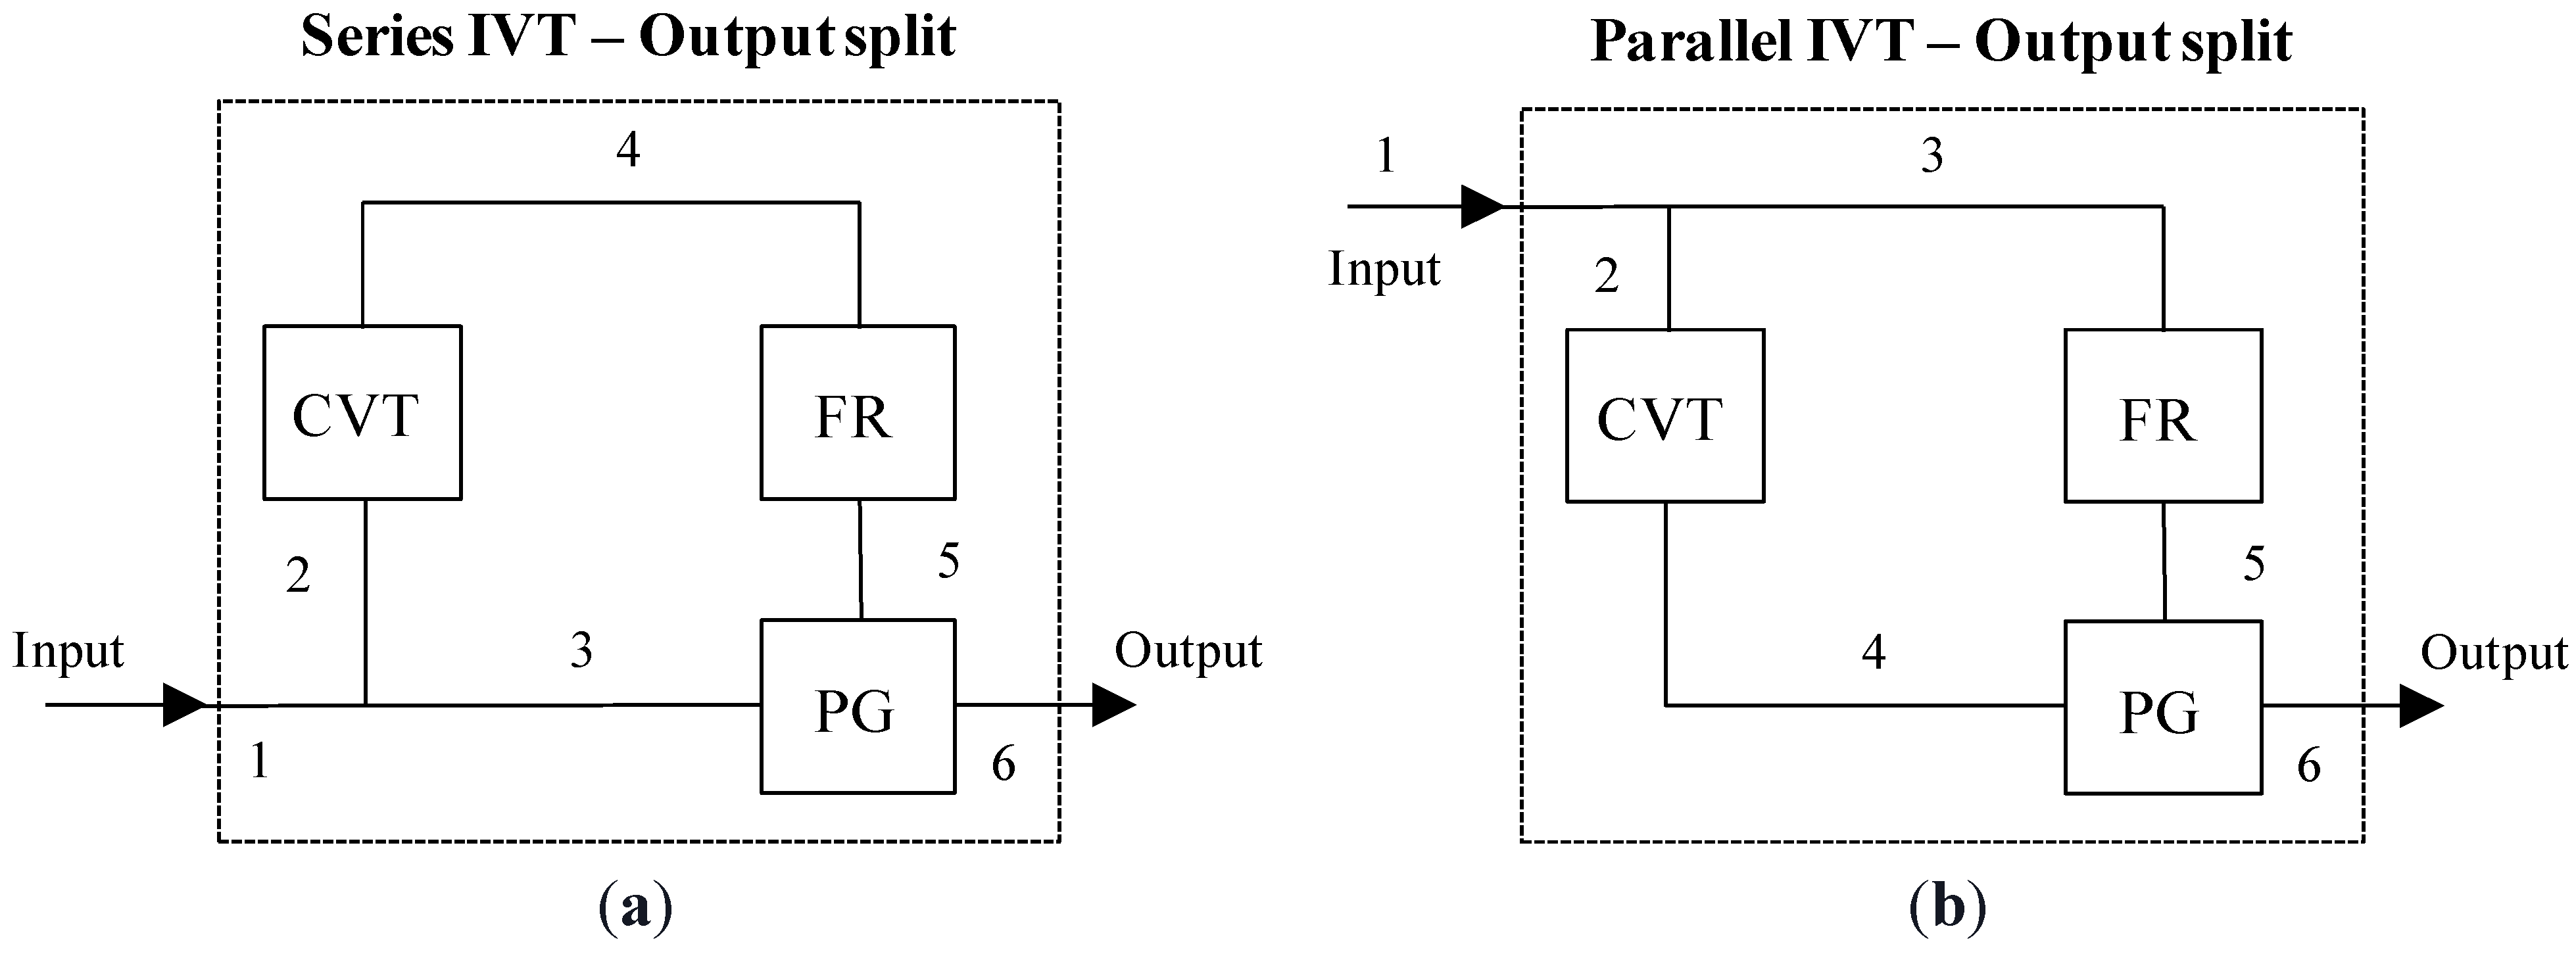
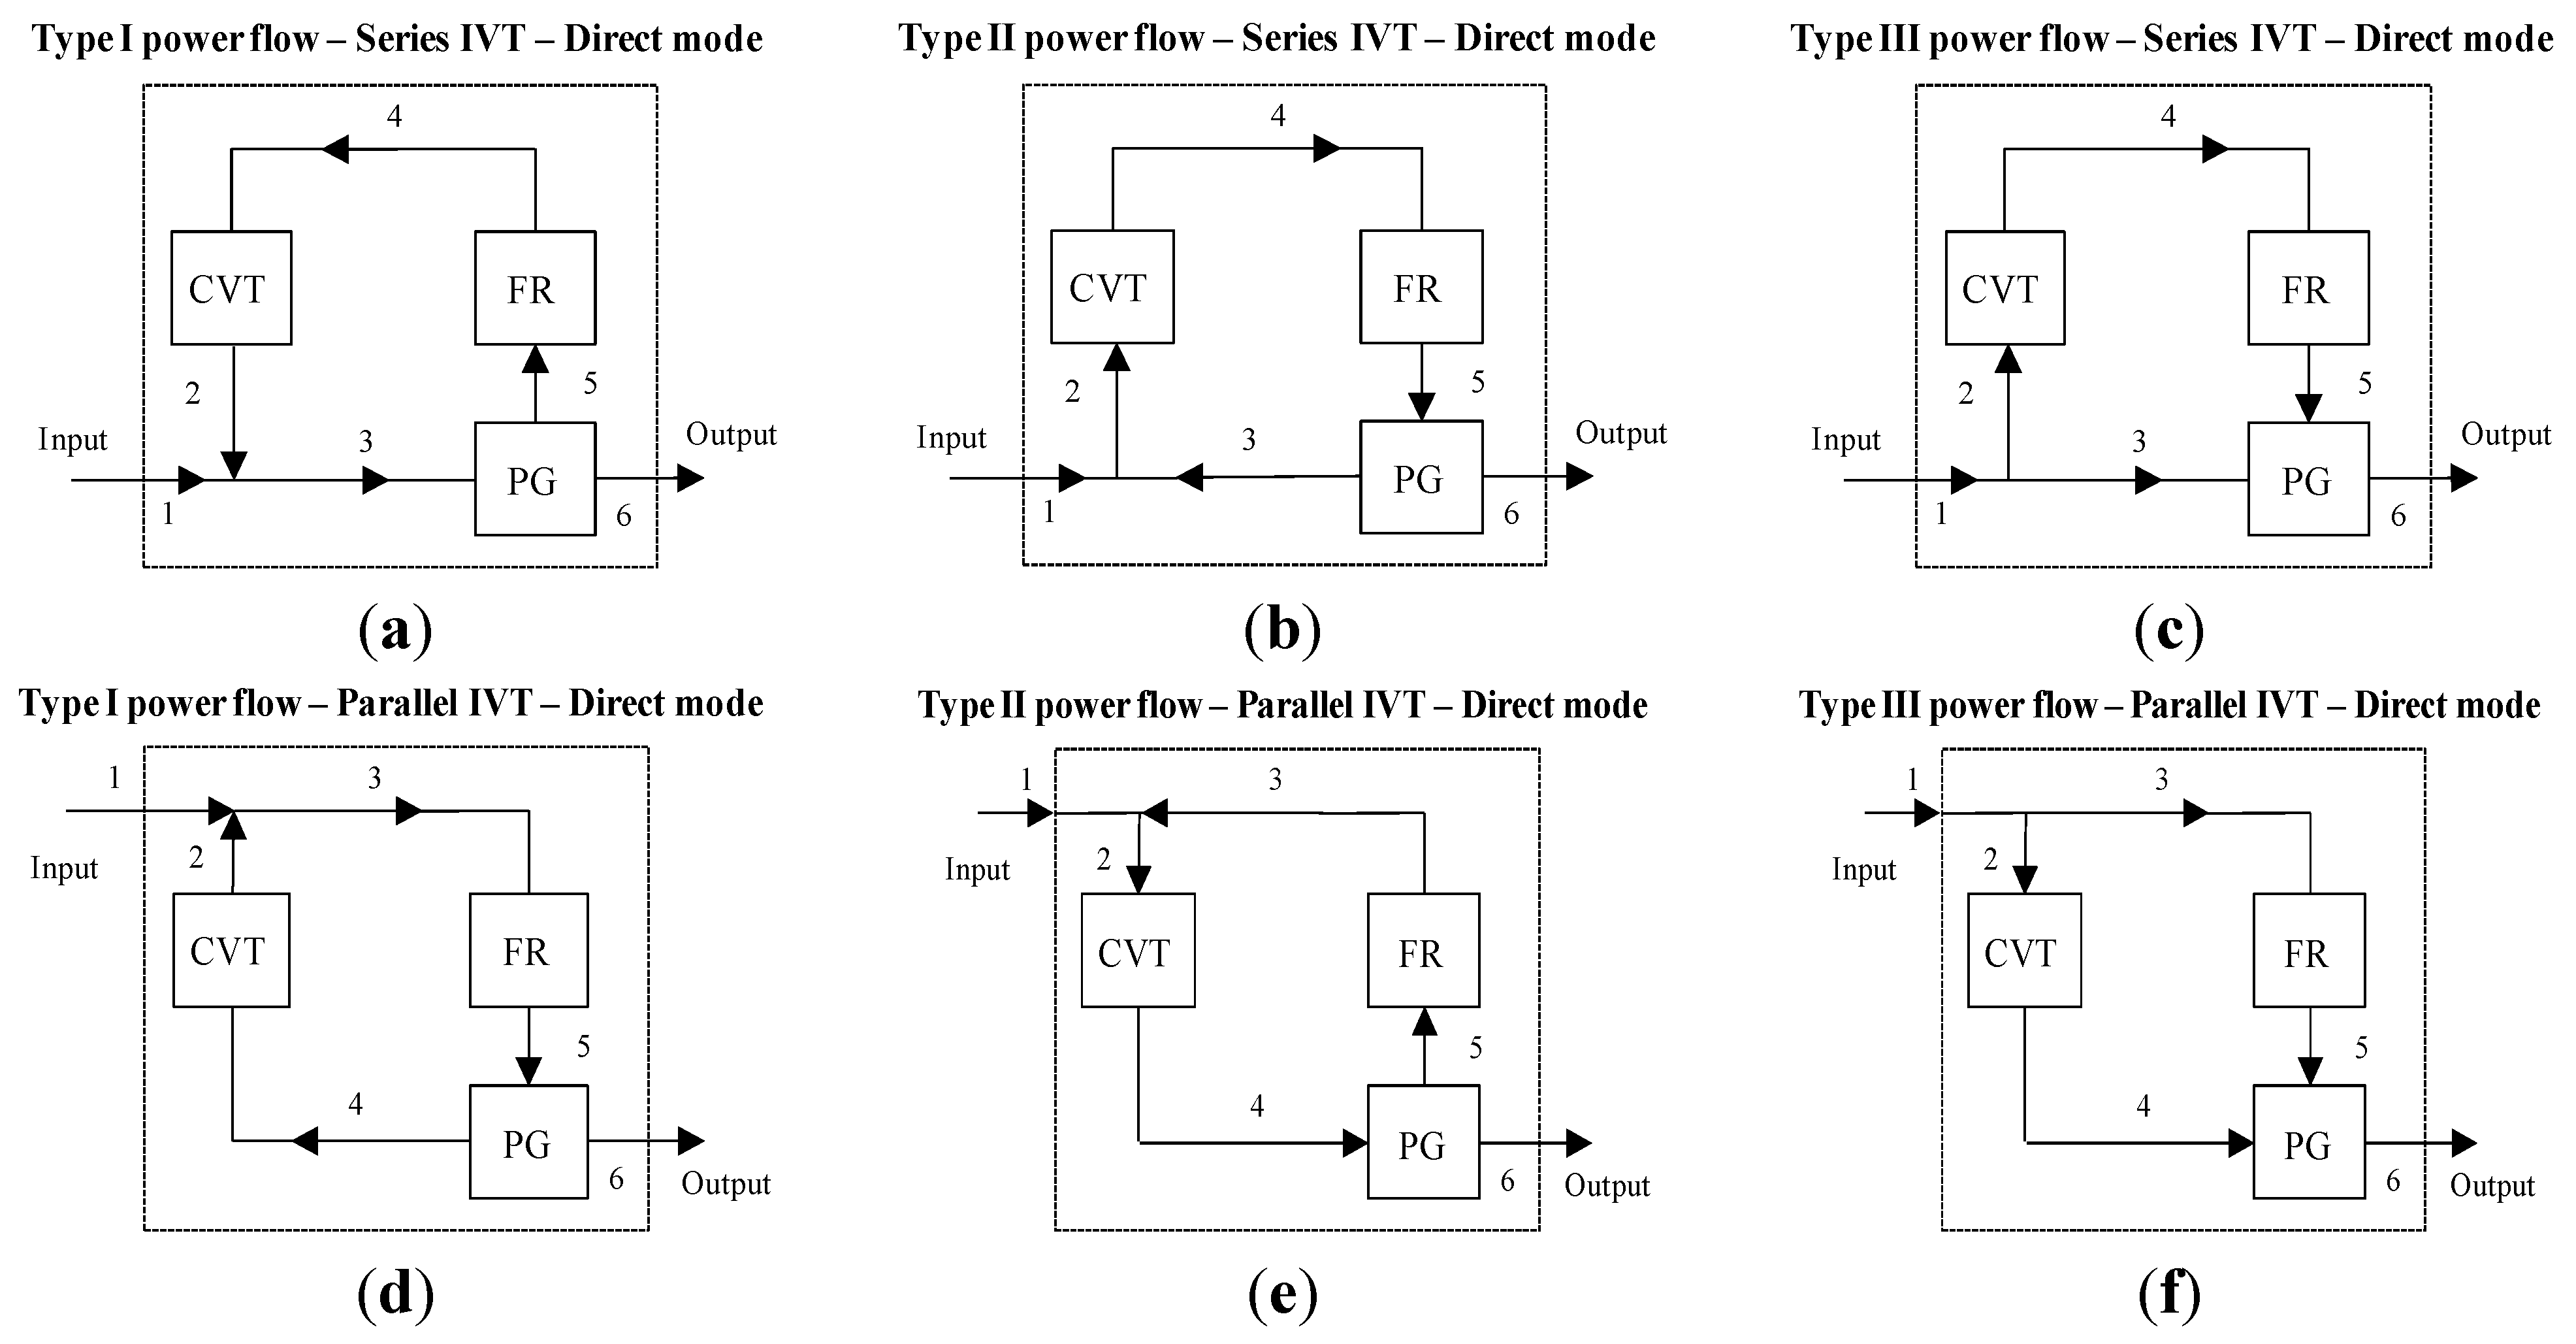
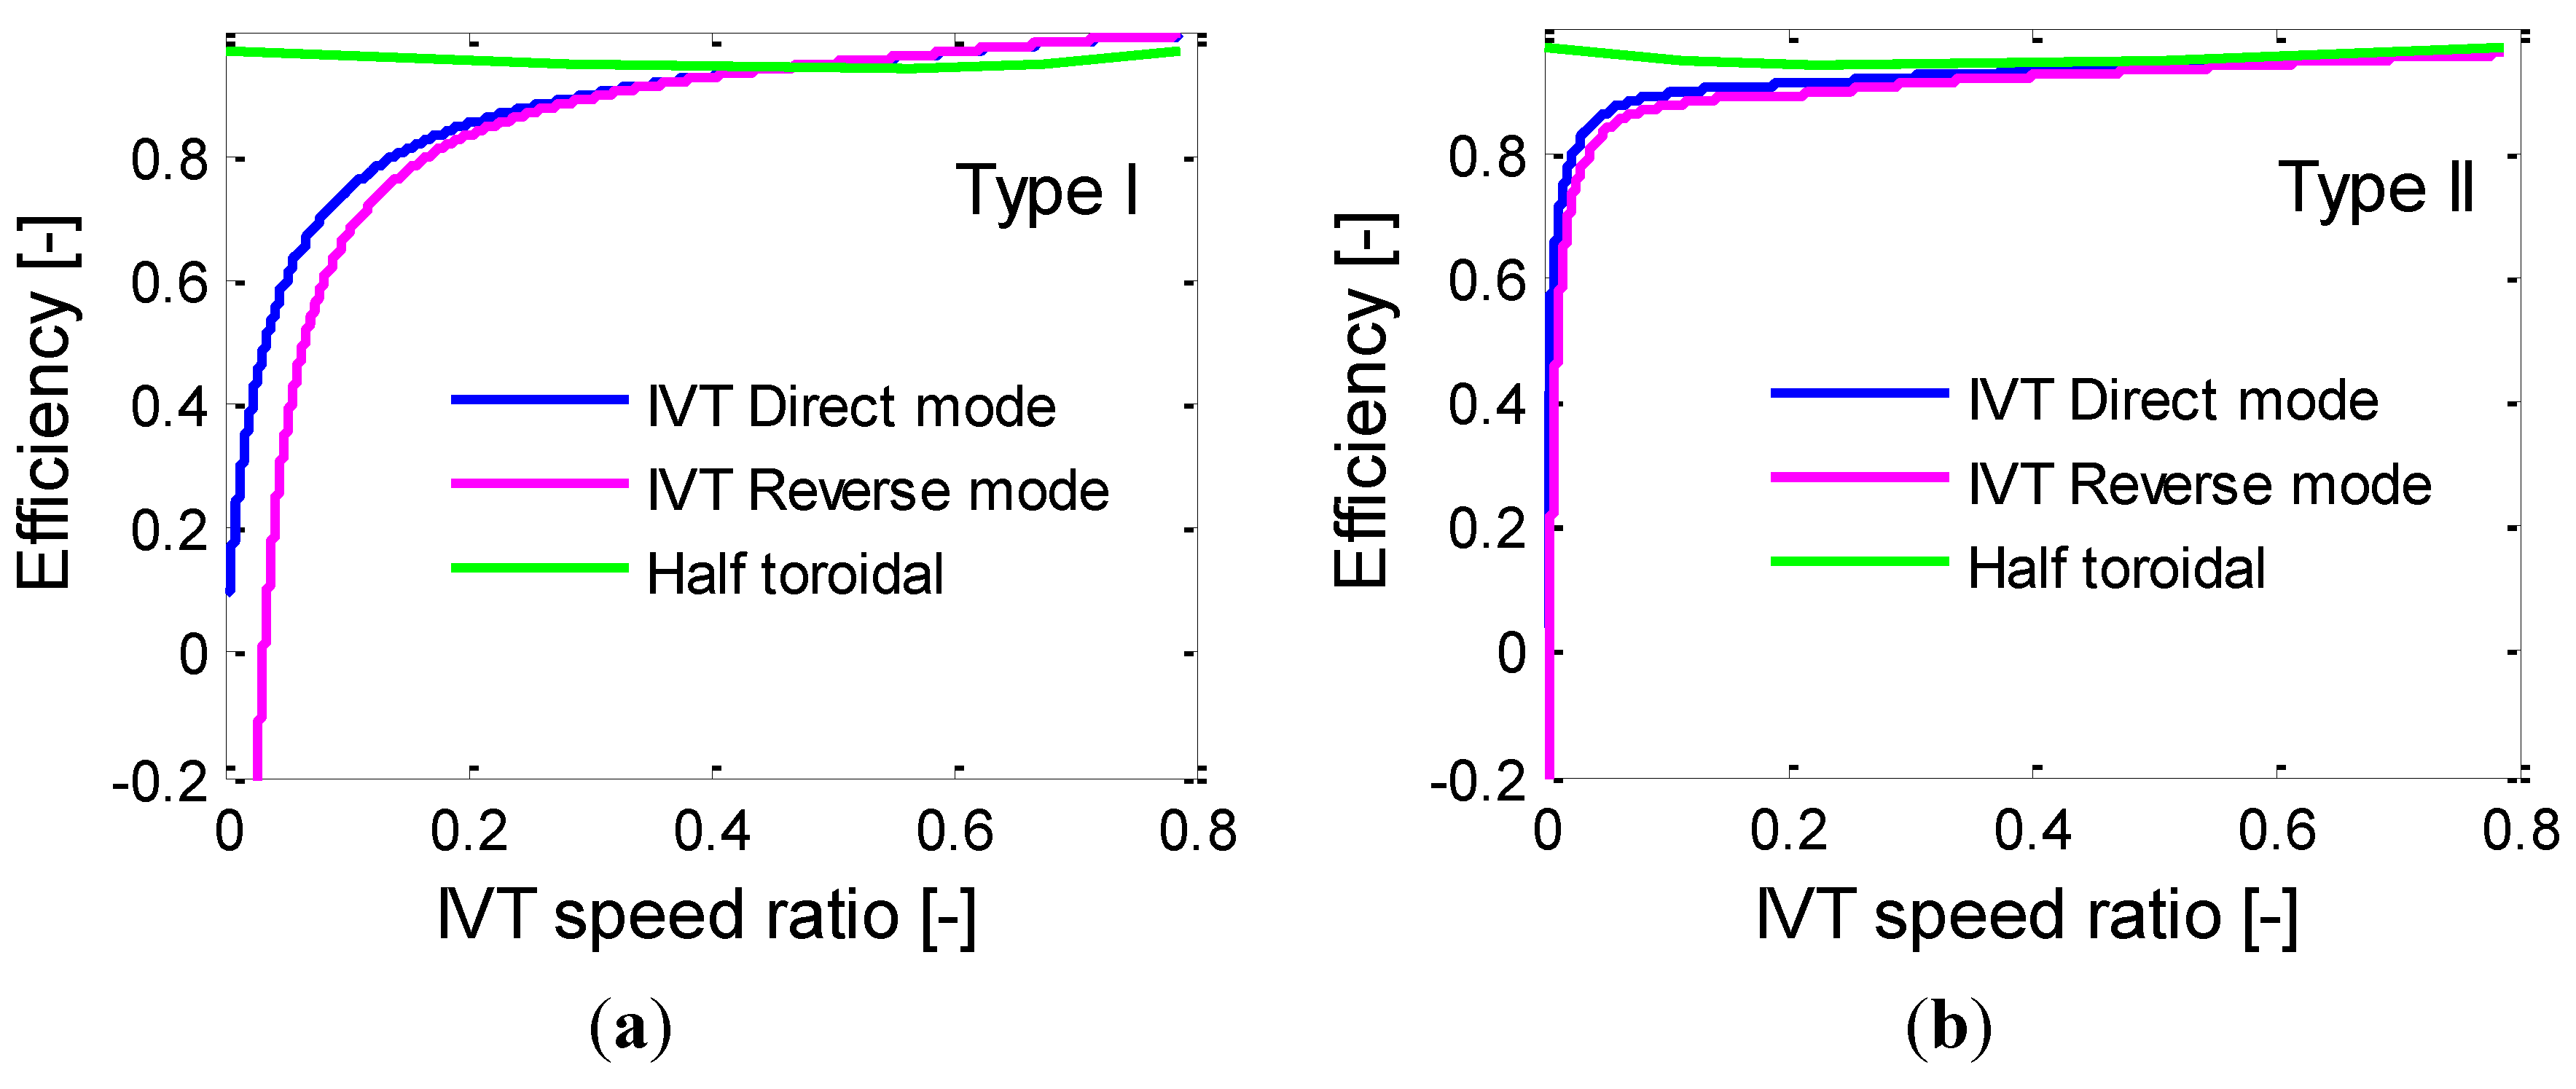
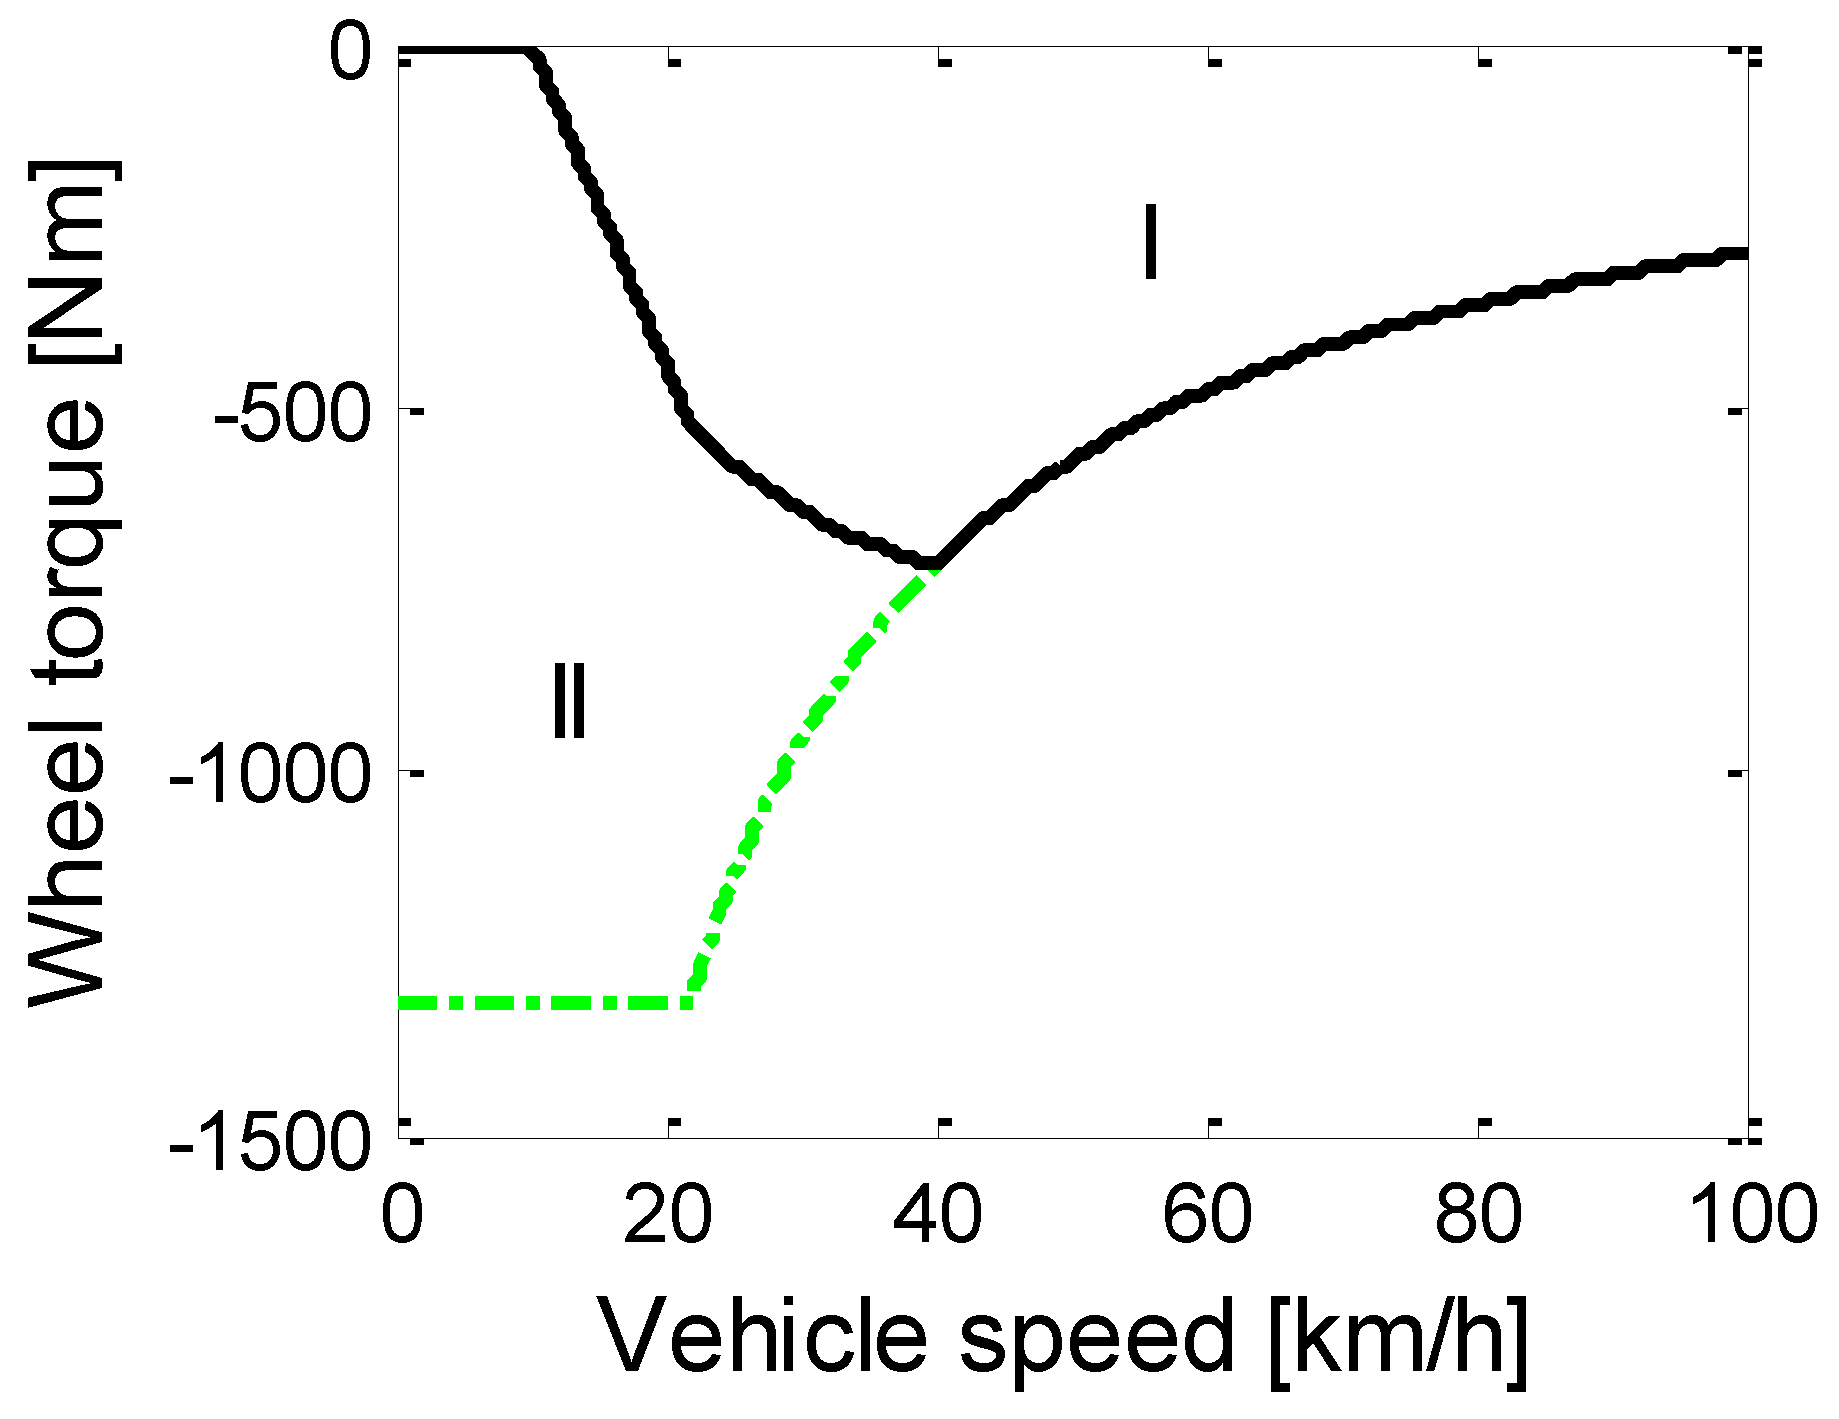
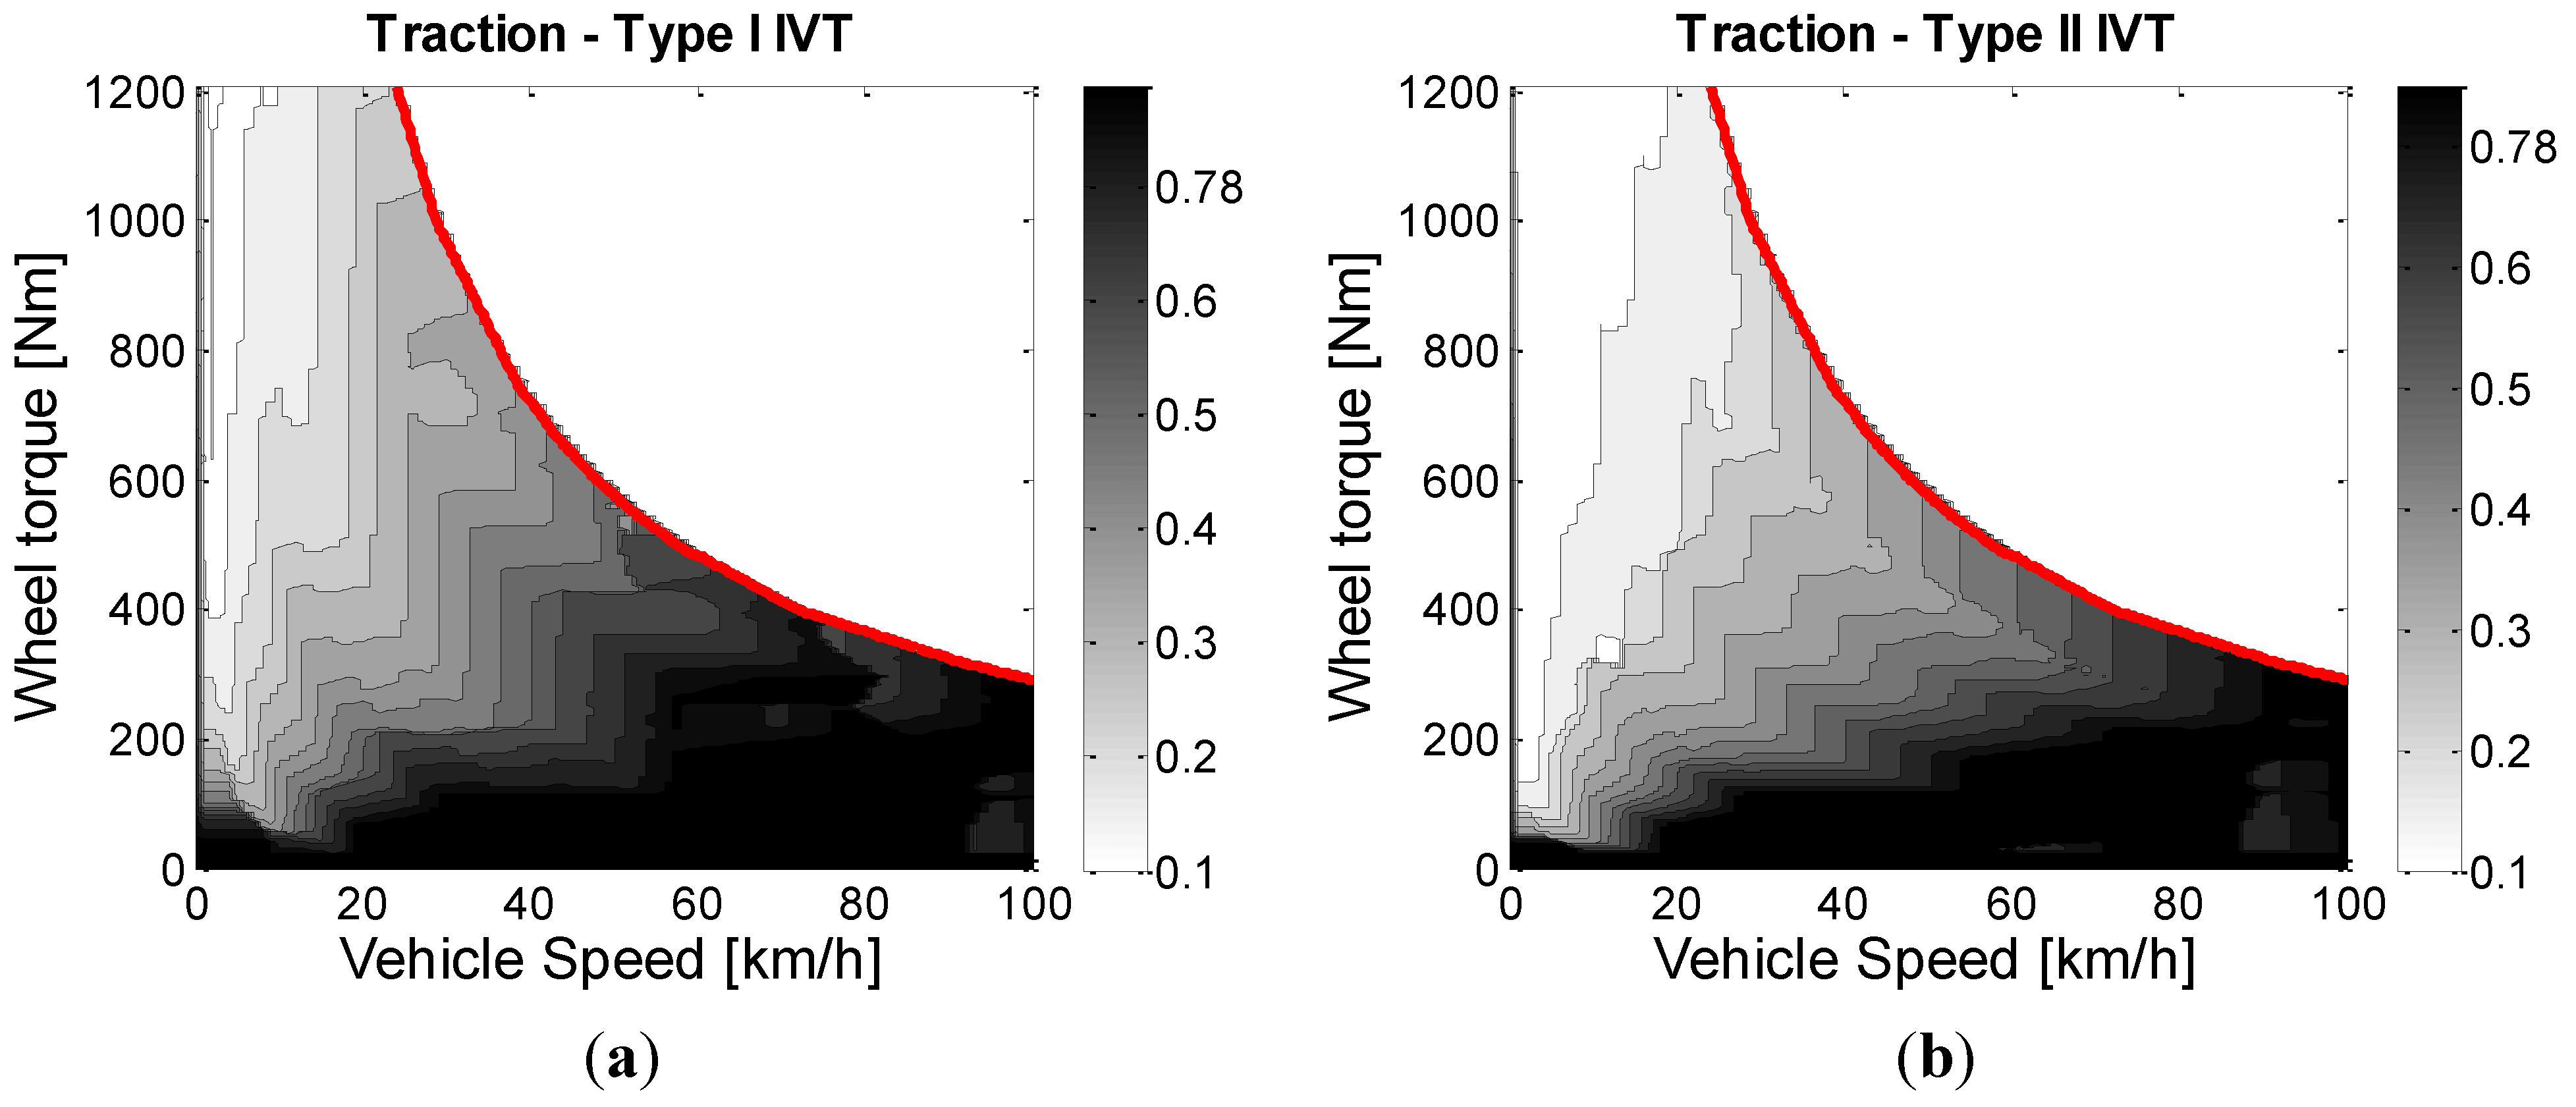
Due to their high torque capacity and infinite number of gear ratios between two finite limits, half and full toroidal CVTs [35] are extensively used for many applications such as ICE-driven cars and trucks.
These systems can introduce some benefits such as weight and volume reduction due to the absence of a clutch [36,37]. The main components of these transmissions are the input and output discs depicted in Figure 3a, designed to create a toroidal cavity. The very thin oil film between each disc and the power rollers allows torque transmission by shearing actions. The speed ratio can rapidly change according to the driver torque demand by varying the inclination angles of the power rollers.
Reference [35] shows that the efficiency of the toroidal drives depends on the output torque, the clamping force, the speed ratio and weakly on the input angular velocity, if thermal effects are neglected. Moreover, the clamping force can be tuned to make the transmission work at maximum efficiency, the value of which is almost independent from the output torque [38]. It results that the HT and FT CVT efficiency in the simulation model is given as a function of the speed ratio, as shown in Figure 3b. The efficiency of the FT traction drive is 4%–5% less than that of the HT (Figure 3b).
Figure 3. (a) Half- (left side) and full- (right side) toroidal CVTs with input disk, power rollers and output disk (adapted from [35]); (b) The efficiency, η CVT , of HT and FT variators as function of the CVT speed ratio, τ CVT  .
Energies 07 08317 g003

2.2.3. IVTs

IVTs have an infinite speed ratio range including the neutral gear state and do not need the friction clutch. These transmissions consist of three different elements: a CVT (hydraulic, mechanical, electrical), a planetary gear (PG) and a fixed ratio (FR) drive. The CVTs used in this work are the HT and FT configurations because of their high efficiency and reduced size compared to V-belt or chain CVTs [39]. The three elements (CVT, PG and FR) can be combined into a series or parallel IVT [23,24,25].
As depicted in Figure 4, the series and parallel IVTs are characterized by different power flows according to the working condition. [23,24,25] demonstrated that three possible power flows, Type I, II and III can occur in the transmission (Figure 5). The power flow depends on the operational conditions and kinematic features of the IVTs and CVTs. Types I (Figure 5a,d) and II (Figure 5b,e) are characterized by a backward or forward power re-circulation, whilst in Type III (Figure 5c,f) the power is split into two branches and no re-circulation occurs. Type III power flow occurs only if the ratio range of the IVT is within the maximum and minimum limits of the CVT speed ratio, which is not the case of the series and parallel IVTs under investigation.
For series and parallel IVTs the overall speed ratio, τ IVT  , is a linear monotonic function of the CVT speed ratio, τ CVT . The minimum and maximum speed ratio values of the CVT ( τ CVT min , τ CVT max ) are mechanically imposed by the geometry of the toroid (or half toroidal cavity), whilst the minimum and maximum limits of the IVT ( τ IVT min , , τ IVT max ) must be chosen according to the particular applications, i.e., tractors, hybrid electric or battery electric vehicles. Once the limits of the overall speed ratio have been chosen, then the fixed ratio and the planetary gear ratio can be calculated [24,25].
The IVTs of this work are designed for an urban BEV characterized by a top speed of 100 km/h. The lower limit τ IVT min of the overall speed ratio is zero, whilst the upper limit is chosen based on the maximum value of vehicle speed and the maximum speed of the optimal operating line of the electric motor (5500 rpm). τ IVT max is equal to 0.7883 for both the series and parallel IVTs considered here. Their characteristics are summarized in Table 3.
Figure 4. (a) Series [25] and (b) parallel [24] IVT schemes.
Energies 07 08317 g004
Figure 5. Classifications of the power flows in series and parallel IVTs. (ac) Type I–III power flow–Series IVT–Direct mode; (df) Type I–III power flow–Parallel IVT–Direct mode.
Energies 07 08317 g005
Table 3. Planetary gear (PG) and fixed ratio (FR) drives ratios of the IVT transmissions with power flows of Type I or II.
ArchitecturePlanetary Gear Ratio τPGFixed Ratio Drive Ratio τFRPower Flow
Series IVT0.938−6.03Type I
Parallel IVT0.3753−0.24Type II
In [22,23,24,25,26] the respective authors demonstrated that the power flow changes passing from positive to negative values of the overall speed ratio. However, when considering that τIVT ≥ 0, a Type I power flow occurs in the series architecture whilst a Type II power flow occurs in the parallel architecture. Based on [21,33] the efficiency of the transmission in direct mode can be expressed as a function of the kinematic parameters ( τ CVT  ,  τ PG  ,  τ FR ) and the efficiency of the only CVT. In fact the losses in the CVT are higher than the losses in the planetary gear and fixed ratio transmission. The efficiencies in direct operation, η IVT Type I direct and η IVT Type II direct , are defined as the absolute value of the ratio between the output power, P 6 , and the input power, P 1 . Their formulations are reported in Equations (1) and (2) for both series- and parallel-IVTs:
η IVT Type I direct = | P 6 P 1 | = 1 1 + ( 1 η CVT η CVT ) | ( 1 τ PG  ) τ FR τ CVT  τ PG  + ( 1 τ PG  ) ( τ CVT τ FR ) |
η IVT Type II direct = | P 6 P 1 | = 1 1 + ( 1 η CVT ) | τ PG  τ CVT  τ PG  τ CVT τ FR ( τ PG 1 ) |
Because of the requirement to perform the energy recovery in braking, the transmission must be a reversible mechanism. IVTs are usually reversible drives that may work in direct or reverse mode. However, when the transmission operates in a reverse mode, a condition of irreversibility can occur, which means that the power cannot be delivered from output to input [28]. For this reason it is interesting to study the efficiency of the IVT drives in both direct and reverse modes (Figure 6).
Figure 6. Overall speed ratio and efficiencies for (a) Type I and (b) Type II IVTs in direct and reverse mode.
Energies 07 08317 g006
As for the direct operation, the efficiencies of the IVTs in reverse operation, η IVT Type I reverse and η IVT Type II reverse , are functions of the kinematic relations within the transmission and efficiency of the variator. The expressions are shown in Equations (3) and (4):
η IVT Type I reverse = | P 1 P 6 | = 1 ( 1 η CVT ) | ( 1 τ PG ) τ FR τ CVT  τ PG  + ( 1 τ PG  ) ( τ CVT τ FR ) |
η IVT Type II reverse = | P 1 P 6 | = 1 ( 1 η CVT η CVT ) | τ PG  τ CVT τ PG  τ CVT τ FR ( τ PG  1 ) |
In direct mode, the efficiency (blue line) in Figure 6 is always higher than in reverse mode and is always positive, which means that the power can always be transmitted from branch 1 to 6 (Figure 4). On the contrary, for low values of the IVT speed ratio the efficiency in reverse mode can be negative (non-reversible transmission). This is true especially for the Type I power flow (Figure 6a). Furthermore, the efficiency of the IVT with Type I power flow can be higher than the efficiency of the CVT (in particular for large speed ratios, Figure 6a), whereas the efficiency of the IVT with Type II power flow is always less than the efficiency of the CVT (Figure 6b).

2.3. Vehicle Model

The energy consumption is evaluated through a backward facing model that tracks the velocity profile of the UDC (Figure 7) and Japanese 10-15 (Figure 8) driving cycles [40,41], which are characterized by the absence of altitude variations and wind. Wheel speed is related to the vehicle speed through the wheel radius, R w , thus neglecting the wheel slip. The electric motor power in direct mode is:
P e = 1 η m η tr { [ M g ( f 0 + f 1 v + f 2 v 2 ) + 0.5 ρ S v 2 C x + m a ] v } + 1 η m ( I m ω m ω ˙ m )
where M in Equation (5) is the total mass of the vehicle with two passengers and the other parameters are explained in Table 1. Powertrain inertias other than that of the EM are neglected for simplicity.
Figure 7. UDC urban part without repetitions (a) and required output power (b).
Energies 07 08317 g007
Figure 8. Japanese 10-15 driving cycle (a) and required output power (b).
Energies 07 08317 g008
In the reverse mode, which usually occurs during braking, the mechanical power is partially recuperated through the electric motor that works as a generator, and it is stored in the battery pack. Part of the braking power may be dissipated by the conventional friction brakes. The battery is modeled through the approach presented in [42]. This model is selected because it has already been experimentally validated for several commercial Li-ion batteries (e.g., Sony US18650 and Panasonic CGR18650) and because of its low computational requirements. The model is based on publicly available data supplied by battery manufacturers, e.g., the curves of terminal voltage during constant current discharge at constant temperature.
The maximum braking torque at the wheel allowed by the electric motor (when neglecting drivetrain efficiency) is shown in Figure 9 for the 2G transmission. In general the maximum regenerative wheel torque characteristic includes both regions I and II, circumscribed by the green line. In this work the authors considered only region I for brake regeneration, as depicted through the black line in Figure 9. In fact, by using the whole wheel torque characteristic, the vehicle could not be steadily kept in standstill conditions as it would tend to move backward after reaching the zero-speed condition (or depending on the controller it would tend to oscillate). As a consequence, at low speed it is necessary that the driver regulates the torque through the friction brakes. The transition from brake regeneration to the friction brakes must be characterized by some form of progressivity, which justifies the reduction of regenerative torque in region I at low values of vehicle speed. In any case, as the efficiency of the EM drive is usually low for low speed operation, this limitation of the regeneration capability does not pose any specific issue in terms of energy consumption. When the required braking torque at the wheel is, in absolute value, less than the maximum allowed regenerative wheel torque, then the friction brakes are not involved. On the contrary, when the braking torque is, in absolute value, larger than the maximum regenerative torque, then the related exceeding braking power is dissipated by the friction brakes.
Figure 9. Maximum braking wheel torque characteristic as function of vehicle speed (2G).
Energies 07 08317 g009

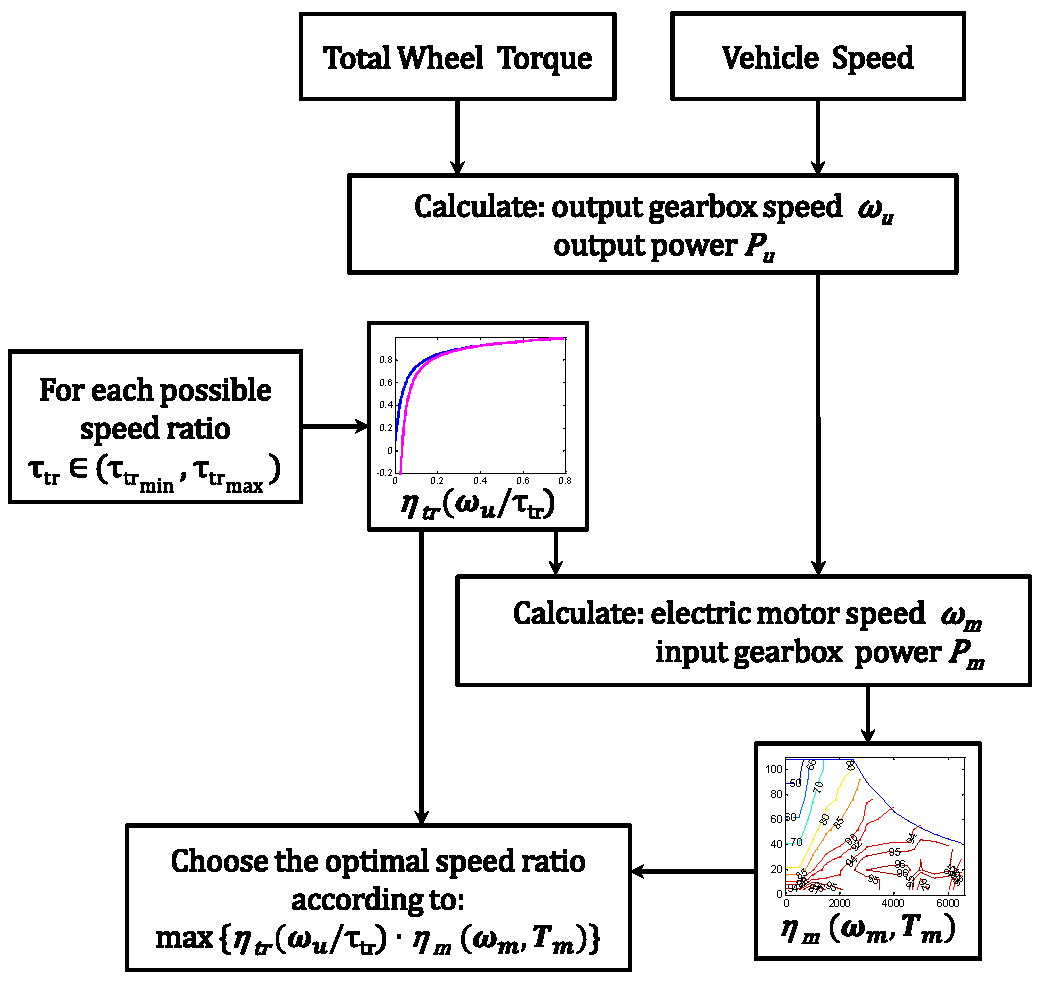
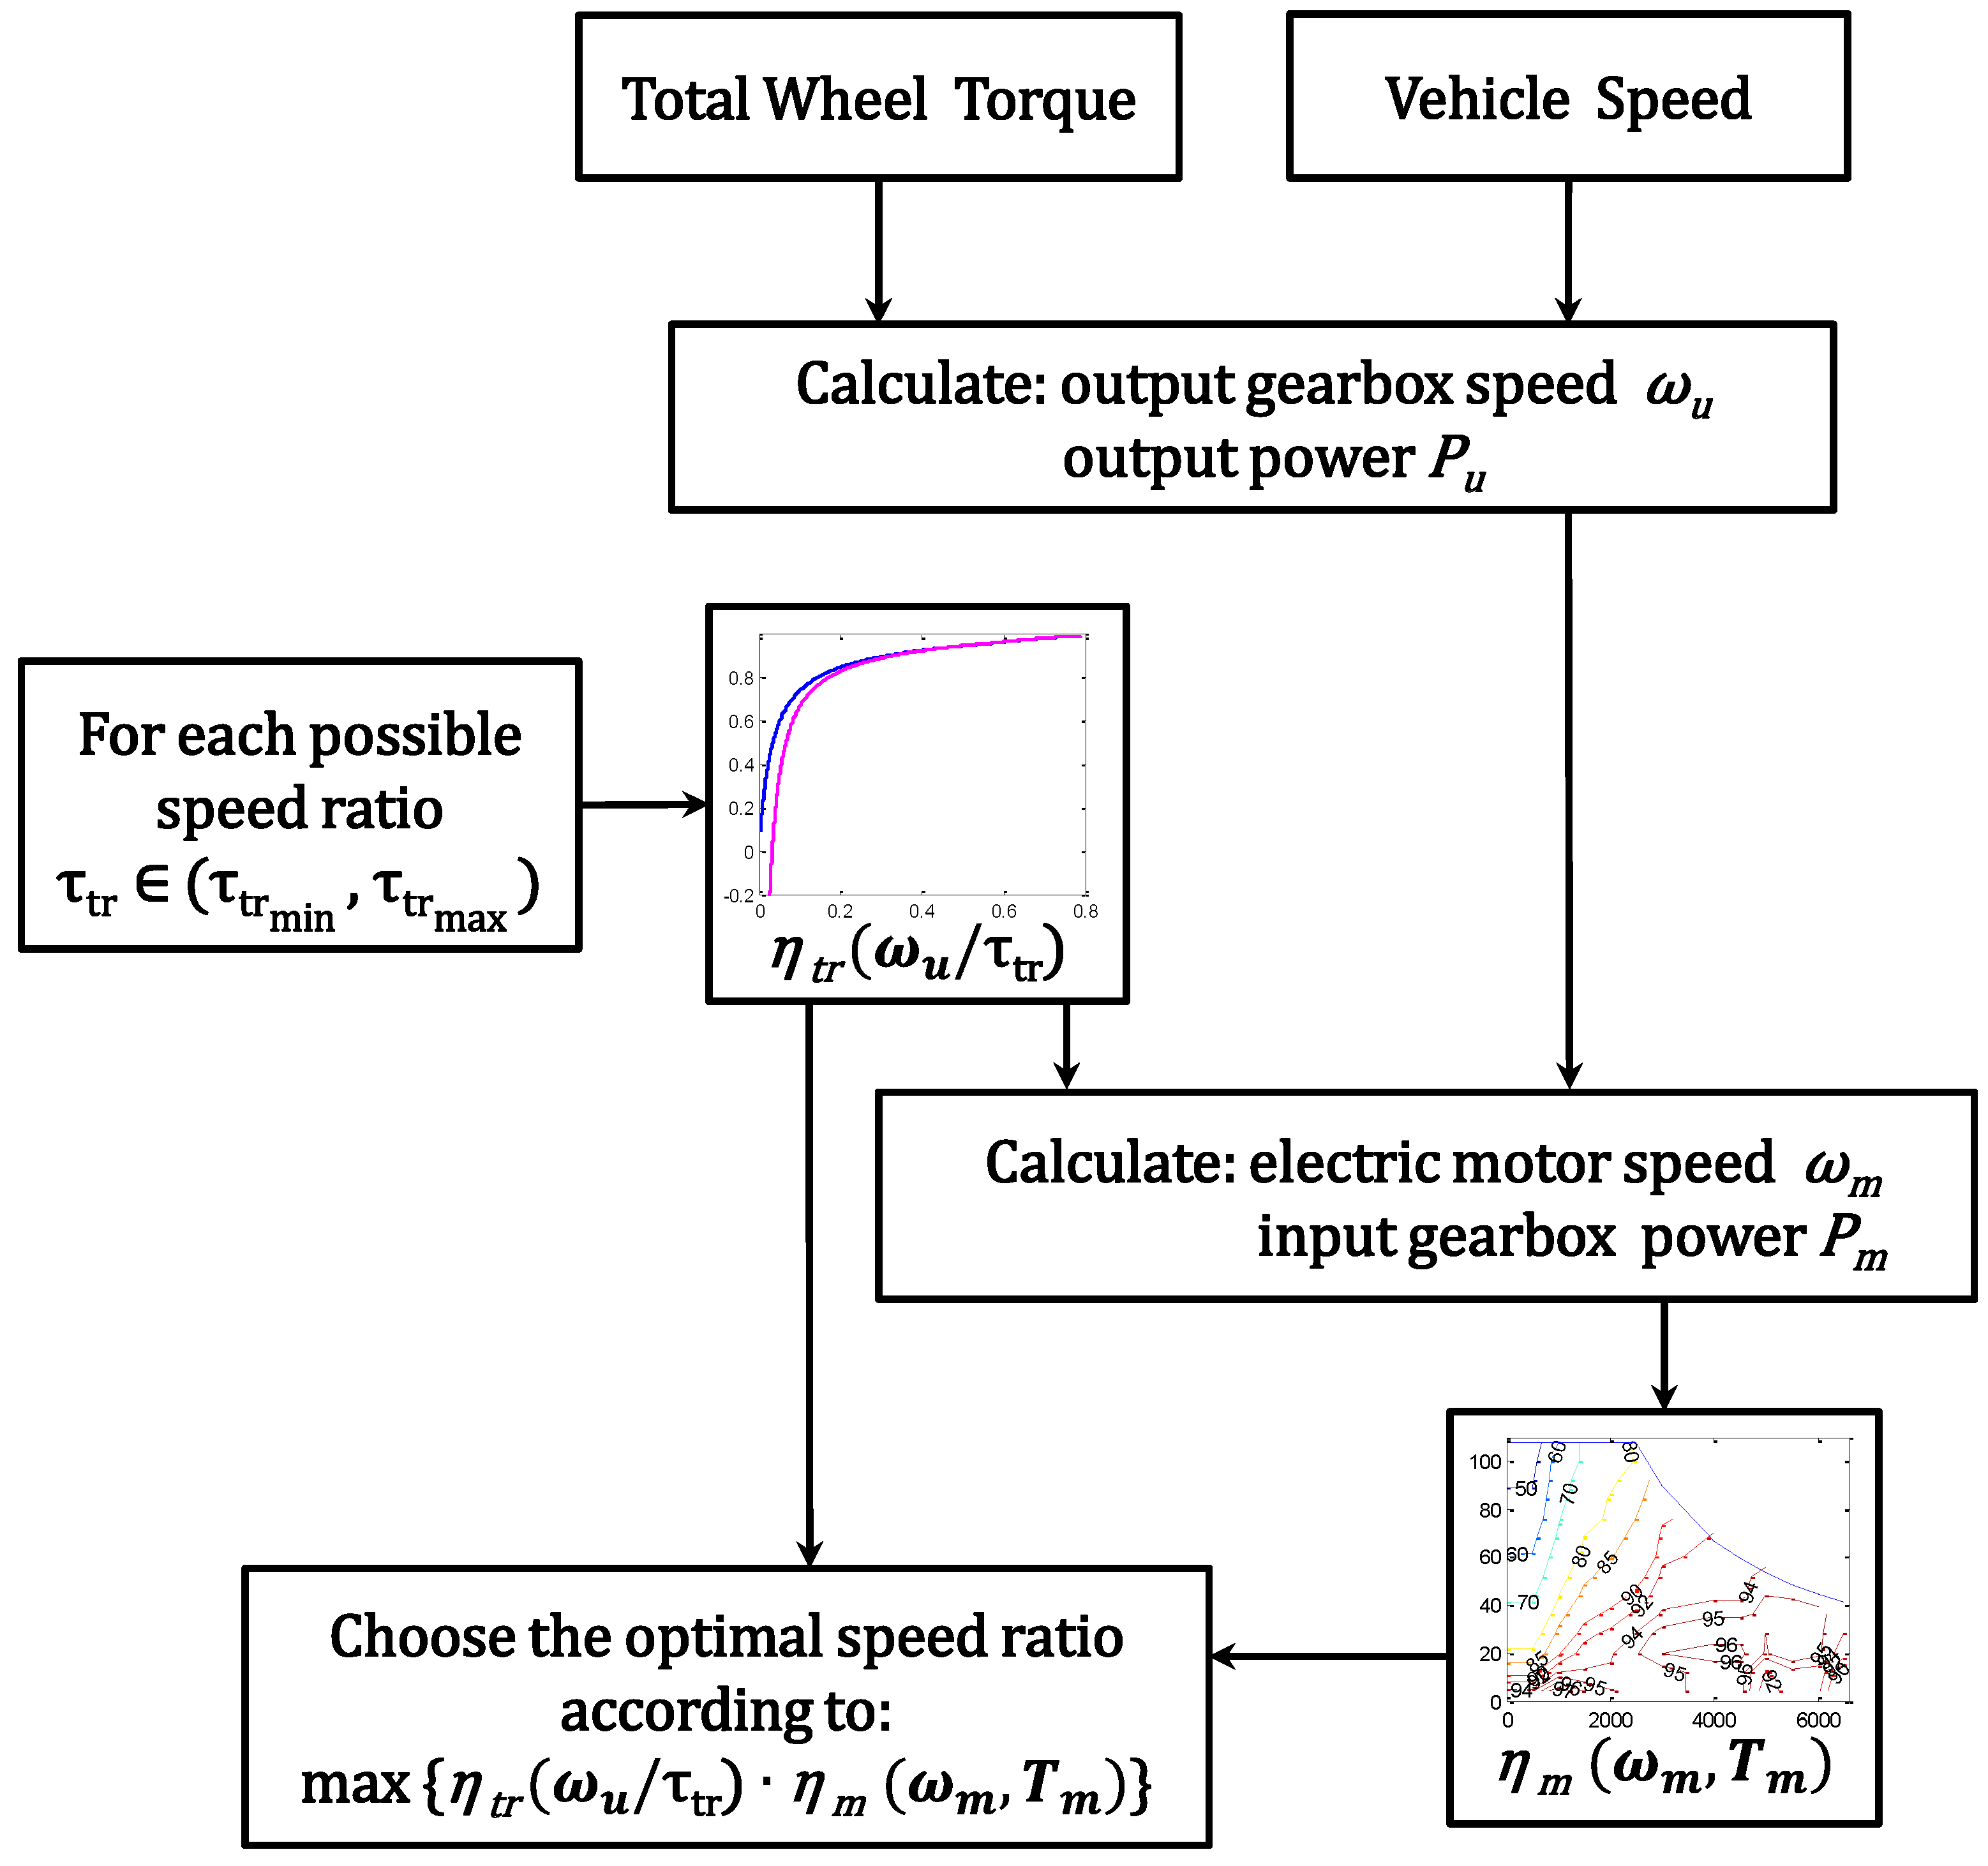
3. Optimization Procedure

In order to compare the energy consumption performance of the case study transmissions, all of them have been simulated in optimal conditions [43,44,45]. The energy consumption minimization (i.e., the computation of the optimal gear ratio, τ transm , for minimum drivetrain power loss) is performed through the maximization of the cost function c ( τ transm ) :
c ( τ transm ) = η drivetrain ( τ transm )
that is the overall efficiency of the powertrain (electric motor + transmission).
The maximization problem is then formulated specifying the constrained values of motor speed and torque:
τ trasm { τ trasm min , τ trasm max }   c ( τ trasm ) = max { η tr ( ω tr , T tr ) η m ( ω m , T m ) } T m min T m T m max ω m min ω m ω m max
Equation (7) cannot be solved analytically since the electric power Equation (5) is non-linear and incorporates variable efficiencies through look-up tables. It is therefore more appropriate to use an off-line computation of the optimal gear ratio. A Matlab function was created to generate an optimal speed ratio look-up table, indexed by vehicle speed and wheel torque demand, which can be used for an online implementation (in this case a backward facing simulation). To compute the look-up table, a brute-force algorithm was used [30,31,32,45]. Between all the gear ratios (selected with reasonable discretization) verifying Equation (5) and the constraints in Equation (7) for a specific combination of speed and wheel torque, the one with the highest overall powertrain efficiency is the solution of the optimization problem. This procedure is repeated for all possible operating points in terms of wheel torque demand and vehicle speed.
The optimization of the drivetrain management, schematically shown in Figure 10 for the layout with IVT, is here described in detail. Starting from input values of wheel torque and vehicle speed, the output power requirement and the output speed of the transmission are known. The final drive efficiency is considered constant and equal to 1 for simplicity. The efficiency of the transmission is evaluated for all possible values of the transmission speed ratio through look-up tables and, for the IVT case, taking into account the circulating power within the transmission. For each value of the speed ratio, the output speed and torque of the electric motor are known (motor inertia is neglected). The efficiency of the electric motor is then evaluated through a look-up table, as a function of the electric motor torque and speed. The overall efficiency of the drivetrain (motor + transmission) is calculated for all (discretized) values of the transmission speed ratio. In conclusion, the optimal value of the transmission ratio is calculated as that corresponding to the maximum value of drivetrain efficiency for given wheel torque and speed. The discretization steps in the selection of the operating points are 1 km/h for vehicle speed, and 10 Nm for gearbox output torque. The optimization is used for all the architectures with more than one gear ratio (2G, CVTs and IVTs) and the output of the procedure is a driving performance chart, function of wheel torque demand and speed, which establishes the optimal speed ratio for all operating conditions.
Figure 10. Flow-chart of the optimization algorithm for the IVT layout.
Energies 07 08317 g010
An example of optimization results for traction and regeneration is shown in Figure 11 and Figure 12 for the architectures with Type I and Type II IVTs. Interestingly, the regions with low vehicle speed and high wheel torque for both Types I and II are characterized by a low value of the optimal speed ratio (i.e., τ IVT = 0.1 ).
Figure 11. Traction driving chart for (a) Type I IVT and (b) Type II IVT.
Energies 07 08317 g011
Figure 12. Regeneration driving chart for (a) Type I IVT and (b) Type II IVT.
Energies 07 08317 g012

4. Energy Consumption of a BEV at Constant Speed and in Driving Cycles

The backward facing vehicle model was implemented in Matlab/Simulink for evaluating the energy consumption of a BEV in steady-state conditions and along driving cycles. The simulations are performed for the six case study drivetrain architectures with the optimal gear selection imposed by the look-up tables derived through the off-line optimization. The vehicle is characterized by 28 kW of installed electric motor peak power, with a top speed requirement of about 100 km/h, which is actually limited by the maximum speed of the motor (and not by the installed power). The same permanent magnet motor with a base speed of 2500 rpm and a top speed of 6500 rpm is considered in the comparative analysis, and a rear-wheel-drive vehicle configuration is assumed. The main values used in the simulations are reported in Table 1 and Table 2.

4.1. Constant Speed Energy Consumption

The results are reported for steady-state conditions at different vehicle speeds. Figure 13 shows that the Type I IVT outperforms the other transmissions. Indeed, in the working conditions of Figure 13a the IVT-I works in high efficiency operating points, in particular at high vehicle speed, as a consequence of the optimization of the selected speed ratio. Figure 13b shows the relative percentage difference of the energy consumption of the investigated transmissions, with respect to the IVT-I. The significant difference of about 8% between the FT CVT and the IVT-I for the selected vehicle speeds is due to the difference in transmission efficiency and operating points of the electric motor.
Figure 13. (a) Absolute energy consumption at constant speed and (b) relative percentage difference.
Energies 07 08317 g013
For example, the average FT CVT efficiency is about 91% for the whole range of CVT speed ratios, whilst the IVT efficiency is higher than 93% for significant values of the IVT speed ratio. The difference in terms of consumption is an increasing function of vehicle speed, when comparing the IVT-I with the 1G and 2G drives. This characteristic is a consequence of the optimization procedure, which selects the highest speed ratio values for the IVTs in order to increase transmission efficiency.

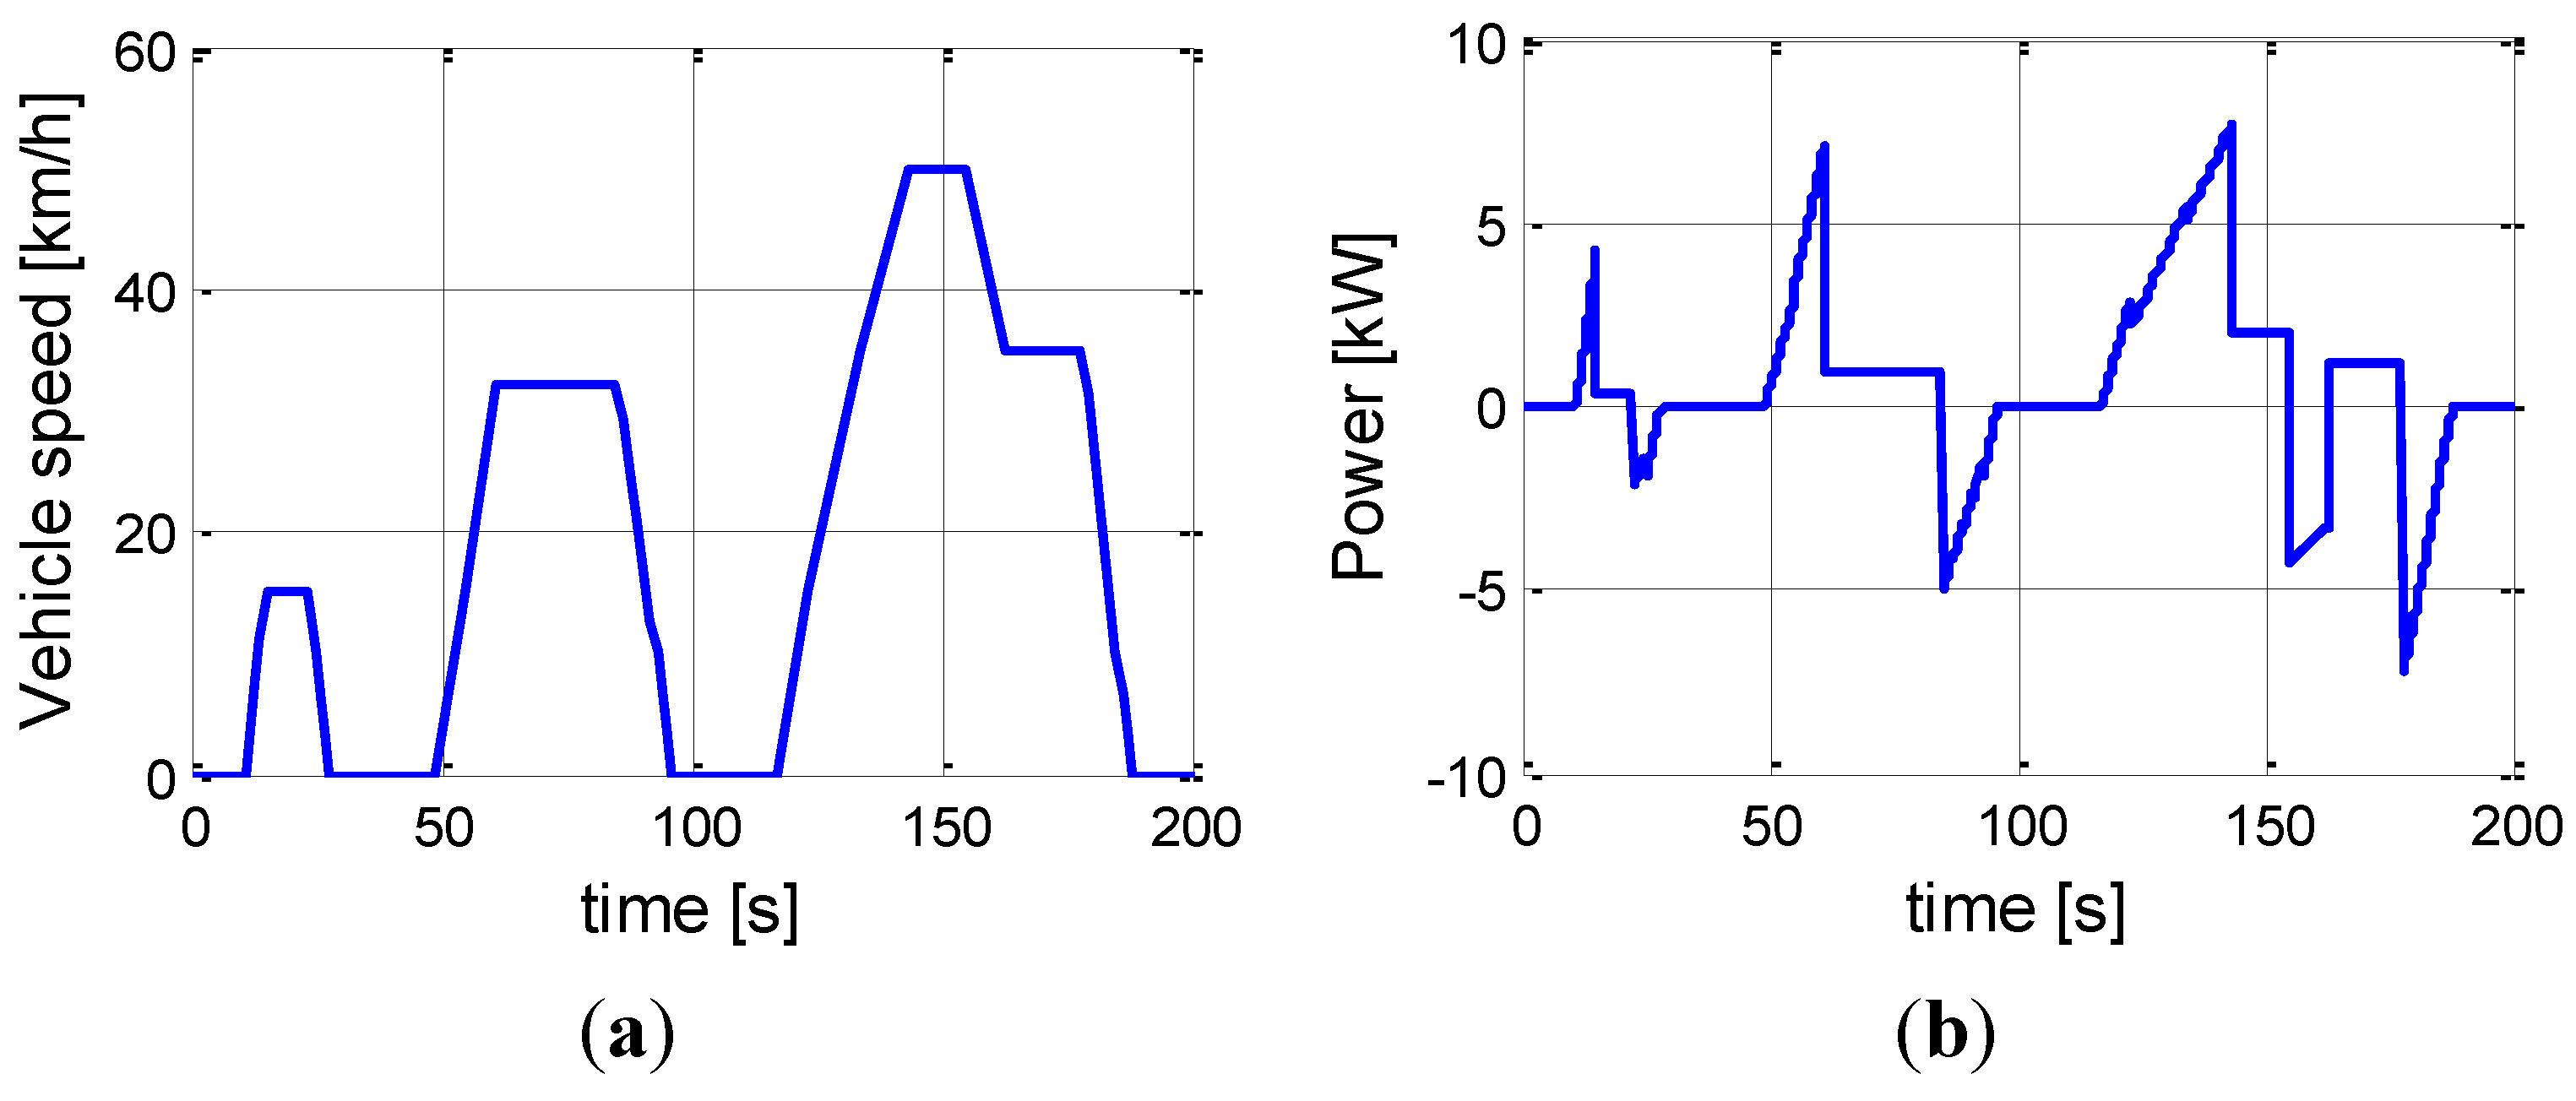
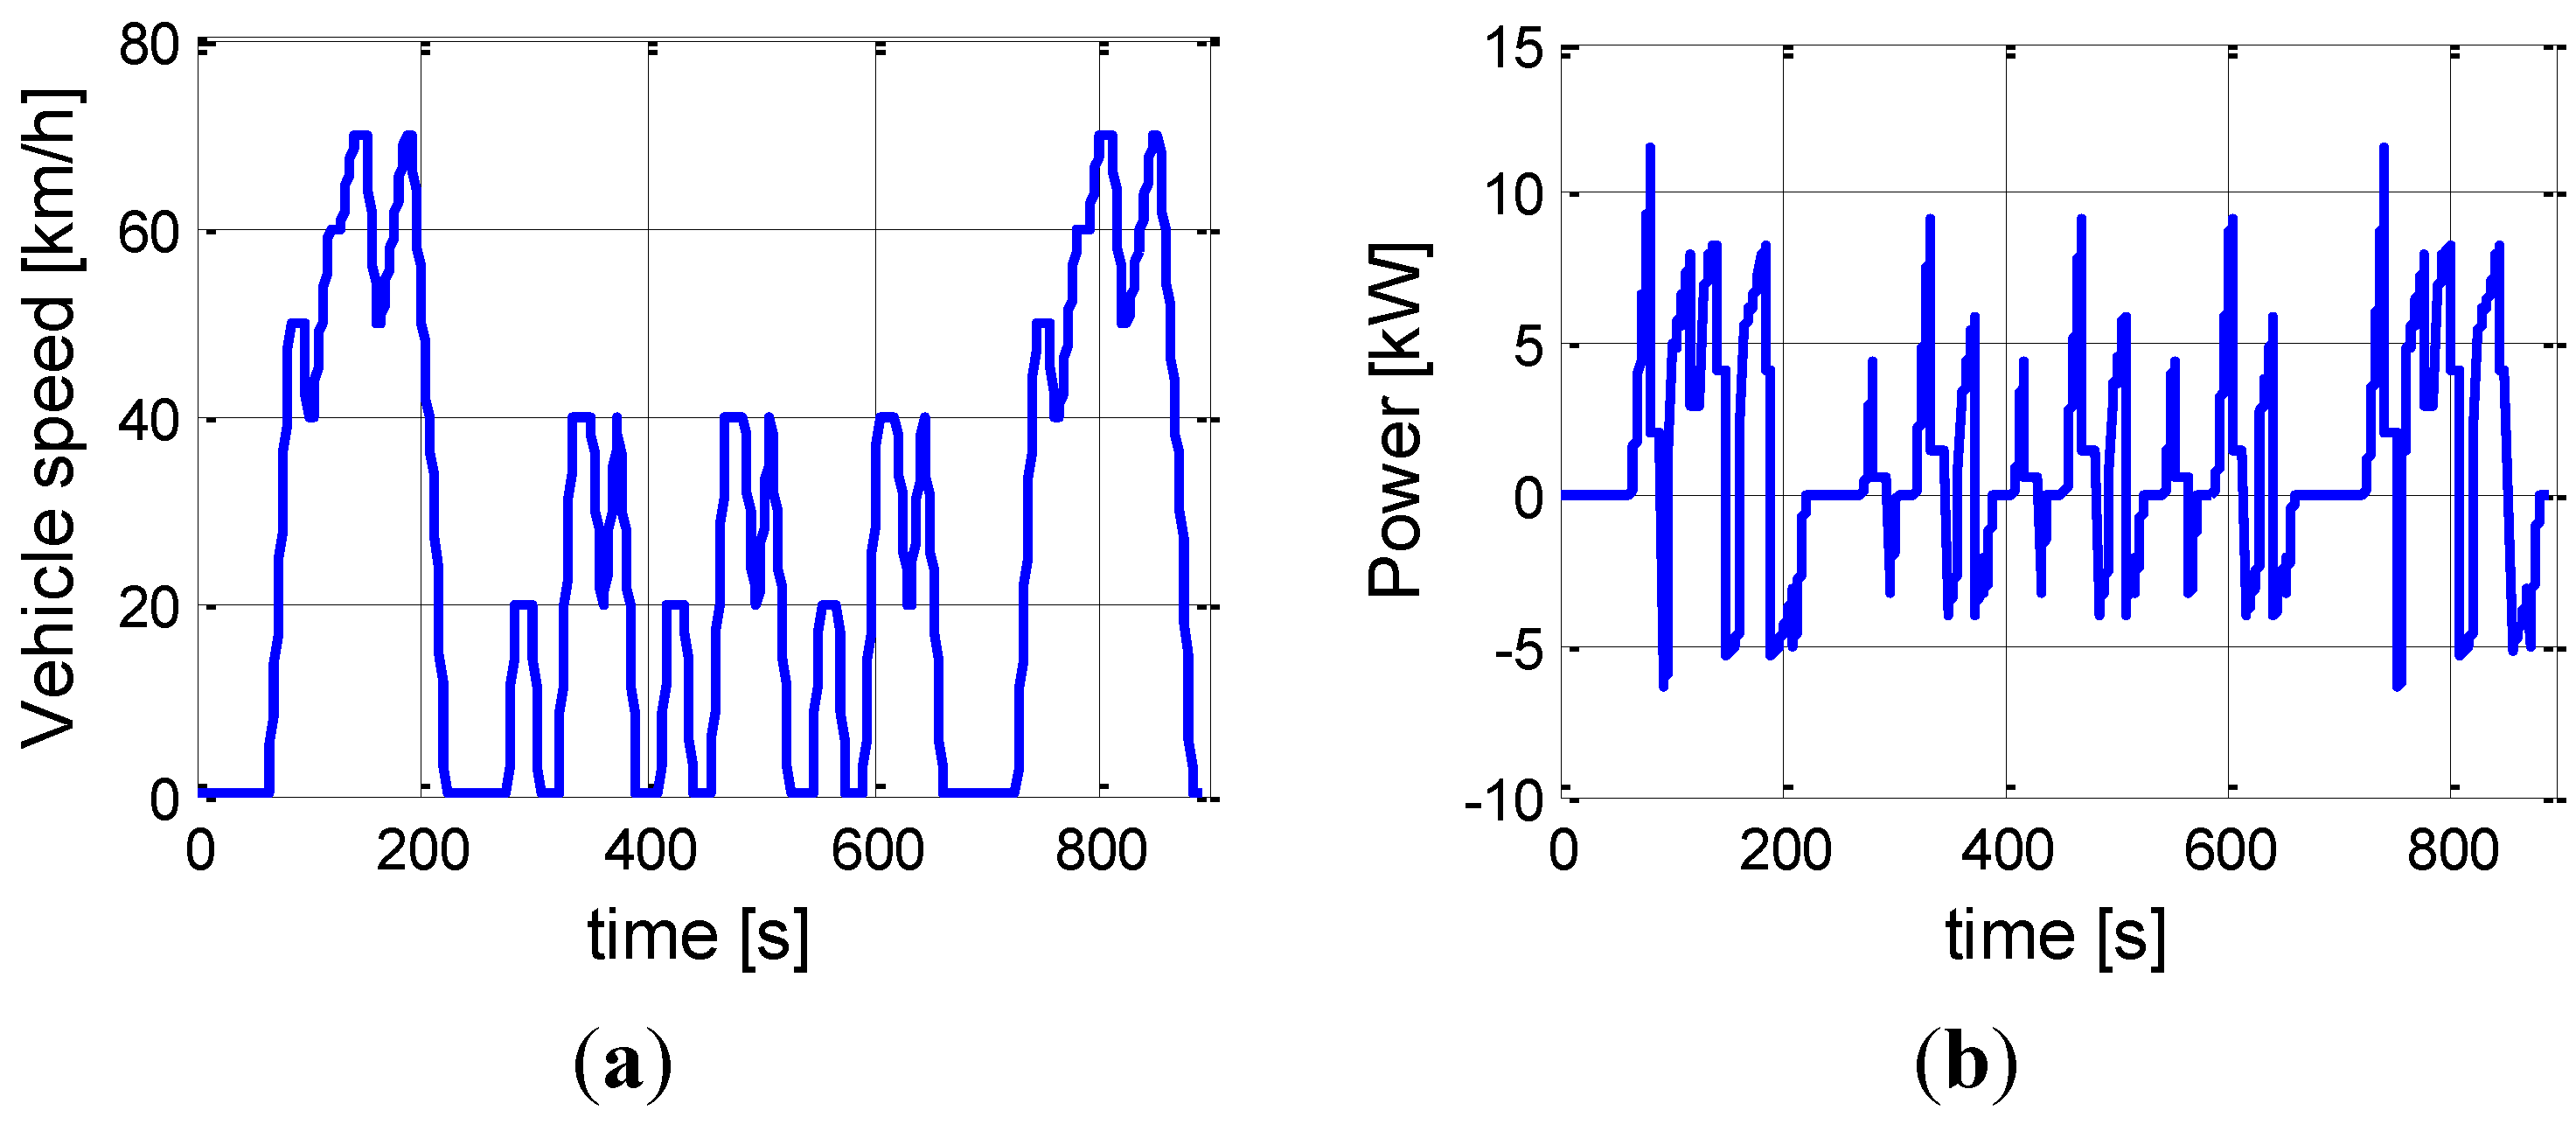
4.2. Energy Consumption along the UDC and Japanese 10-15 Driving Cycle

The comparison between the six layouts was performed also along the UDC and the Japanese 10-15 (J10-15) urban driving cycle. Figure 14 shows the optimal speed ratio for all the architectures in the first fourth (200 s long) of the UDC. The optimal speed ratio of the 2G and CVT transmissions clearly follows the trend of the driving schedule: the larger the vehicle speed, the larger the ratio. This result is a consequence of the fact that the efficiency of the two-speed transmission and the CVTs weakly depends on the speed ratio and velocity, so the optimization converges to the speed ratio values that maximize the efficiency of the EM drive. Since the efficiency of the specific EM (evaluated in the PLUS-MOBY project) is large at relatively large motor speeds, the optimal CVT ratio is always significantly lower than the maximum allowed ratio (i.e., 2.5, see Table 1).
On the contrary, the optimal speed ratio of the IVTs does not follow a similar trend. In fact, the efficiency of the IVTs is low and significantly varies at low speed ratios (Figure 6), whilst it is high and approximately constant at large speed ratios. It follows that the optimization converges to working points that are the best compromise between the optimal efficiency of the EM and the transmission. As shown in Figure 14 and Figure 15, when vehicle speed is very low or high, the optimal control sets low values of motor speed and large values of the speed ratio. In intermediate conditions the speed ratio is reduced to optimize the drivetrain efficiency. As a further consequence of the optimization, the optimized speed ratio of Type I and Type II IVTs is always larger than 0.3, both in direct (traction) and reverse (regenerative braking) modes. For this reason, the IVT drives never work in conditions of non-reversibility.
Figure 14. Optimal speed ratios of 2G, CVTs, and IVTs as functions of time along the UDC.
Energies 07 08317 g014
The energy consumption has been calculated for all the drivetrain architectures under investigation. The best performer is the IVT transmission with power flow of Type I. The calculated energy consumption is of 186.6 Wh in the UDC and 330.2 Wh in the J10-15 (Table 4 and Table 5). However, the simulated energy consumption of the HT drive is only 0.2% and 3.5% larger respectively in the UDC and J10-15, so the HT transmission is the most convenient choice when considering that in these calculations the power losses in the planetary gear and in the fixed ratio drive of the IVT have been neglected, and also the larger cost, size and weight of the IVT-I compared to HT drive. When comparing the HT with the 1G and 2G transmissions, the possibility to change the operating point of the EM allows the HT to obtain an energy consumption reduction of about 13% and 20% in the two driving schedules, with respect to the 1G transmission. This is achieved although the efficiency of the HT transmission is, on average, comparable to the efficiency of the constant ratio drives. The IVT-I also outperforms the 2G drive (about 10% energy saving in the UDC and 12% in the J10-15).
Figure 15. Optimal motor speed and powertrain efficiency as a function of time.
Energies 07 08317 g015
Table 4. Energy consumption in Wh along the UDC.
ArchitecturesTraction [Wh]Regeneration [Wh]Total [Wh]∆%
Full Toroidal CVT (FT)281.4−79.6206.010.4
Half Toroidal CVT (HT)271.7−83.9187.00.2
Single-speed (1G)289.3−79.4209.912.5
Two-speed (2G)287.9−82.4205.510.1
IVT Type I (IVT-I)276.1−84.5186.60
IVT Type II (IVT-II)280.9−82.3193.63.8
Table 5. Energy consumption in Wh along the J10-15.
ArchitecturesTraction [Wh]Regeneration [Wh]Total [Wh]∆%
Full Toroidal CVT (FT)508.19−135.44372.7512.9
Half Toroidal CVT (HT)482.16−140.51341.653.5
Single-speed (1G)531.43−135.51395.9219.9
Two-speed (2G)512.50−144.24368.2611.5
IVT Type I (IVT-I)475.82−145.67330.150
IVT Type II (IVT-II)487.00−140.38346.625.0
Table 4 and Table 5 also show that the variable ratio drives, and in particular the HT drive and the IVT-I, improve the energy consumption along the driving cycles with respect to the 1G and 2G, both reducing the energy consumption in traction and increasing the energy recovery in braking. In addition to the energy consumption benefits, the IVTs bring improvements in maximum gradeability and acceleration performance, not quantitatively shown here. In fact the electric motor torque is increased by a factor 1 / τ IVT , which implies an increase of the traction force and longitudinal acceleration.

5. Conclusions

The paper compared the energy efficiency performance achievable with six different drivetrain architectures for BEVs. The drivetrain configurations under analysis are: single- (1G) and two-speed (2G) gear drives, half toroidal (HT) and full toroidal (FT) continuously variable transmissions (CVTs), and infinitely variable transmissions (IVTs) with two different types of internal power flow (IVT-I and IVT-II). For each of the analyzed variable speed transmissions, optimal gear selection maps were calculated by taking into account the efficiency of the electric motor and the transmission, and defining the optimal speed ratio for all the operating points of the drivetrain.
The energy consumption of the BEVs was simulated along the UDC and Japanese 10-15 driving schedules, with a backward facing approach. The possibility given by the variable gear drives to change the speed ratio in order to improve the efficiency of the electric motor drive is generally beneficial, since most of the variable drives under investigation outperform the single-speed and two-speed transmissions (along the considered driving cycles, but not in conditions of constant speed) for the case study vehicle parameters and the significant simplifications adopted within this study. The increased flexibility of the transmission in terms of speed ratio range is really effective only if the average efficiency of the transmission is high and the efficiency map of the electric motor drive is significantly variable as a function of torque and speed (like in this application). Indeed, for the specific vehicle the two best transmissions are the IVT with power flow of Type I (IVT-I) and the half toroidal CVT (HT), for which the UDC energy consumption is almost the same. This occurs because although the ratio spread of the IVT-I is infinitely large (larger than for the HT), the efficiency of the IVT-I is lower. Furthermore, the IVT-I is much more complicated and expensive than the HT. Finally, the results of this study tend to be favorable to the IVT-I configuration because the efficiency of its epicyclical gearset was set to 1 during the simulations.
More precisely, the calculated energy consumption obtained with the traditional single-speed transmission is more than 10% higher in the UDC and more than 15% higher in the J10-15 driving cycle, than with the IVT-I and HT transmissions. As a consequence, the adoption of continuously variable drives in BEVs, and in particular of HT transmissions, has some potential to improve vehicle mileage. However, this preliminary simulation results need further and much more detailed simulation and experimental analyses. For example, more realistic efficiency maps of the IVTs, including the power losses in the epicyclical gearset, could significantly change the outcome of the comparison. Also, different efficiency maps of the electric motor drives, with much more uniform efficiency distributions for the variety of operating conditions, could bring significantly different outcomes from those outlined in this initial study.

Acknowledgments

The research leading to these results has received funding from the European Union Seventh Framework Programme FP7/2007-2013 under grant agreement No. 605502 (PLUS-MOBY project) and grant agreement No. 608784 (FREE-MOBY project).

Author Contributions

Stefano De Pinto prepared the simulation models, designed the optimization algorithms, and obtained the simulation results. Stefano De Pinto and Francesco Bottiglione jointly prepared the first version of the manuscript. Giacomo Mantriota and Aldo Sorniotti were responsible for the guidance and a number of key suggestions.

Conflicts of Interest

The authors declare no conflict of interest.

References

  1. Tie, S.F.; Tan, C.W. A review of energy sources and energy management system in electric vehicles. Renew. Sustain. Energy Rev. 2013, 20, 82–102. [Google Scholar] [CrossRef]
  2. Miller, J. Propulsion Systems for Hybrid Vehicles; IET Power and Energy Series; The Institution of Engineering and Technology: Stevenage, UK, 2004. [Google Scholar]
  3. Husain, I. Electric and Hybrid Vehicles: Design Fundementals; CRC Press Taylor & Francis Group: London, UK, 2005. [Google Scholar]
  4. Ren, Q.; Crolla, D.A.; Morris, A. Effect of transmission design on electric vehicle (EV) performance. In Proceedings of the IEEE Vehicle Power and Propulsion Conference (VPPC 09), Dearborn, MI, USA, 7–10 September 2009; pp. 1260–1265.
  5. Hutchinson, T.; Burgess, S.; Herrmann, G. Current hybrid-electric powertrain architectures: Applying empirical design data to life cycle assessment and whole-life cost analysis. Appl. Energy 2014, 119, 314–329. [Google Scholar] [CrossRef]
  6. Sorniotti, A.; Holdstock, T.; Pilone, G.L.; Viotto, F.; Bertolotto, S.; Everitt, M.; Barnes, R.J.; Stubbs, B.; Westby, M. Analysis and simulation of the gearshift methodology for a novel two-speed transmission system for electric powertrains with a central motor. J. Automob. Eng. 2012, 226, 915–929. [Google Scholar] [CrossRef]
  7. De Pinto, S.; Camocardi, P.; Sorniotti, A.; Mantriota, G.; Perlo, P.; Viotto, F. A four-wheel-drive fully electric vehicle layout with two-speed transmissions. In Proceedings of the IEEE Vehicle Power and Propulsion Conference (VPPC ’14), Coimbra, Portugal, 27–30 October 2014.
  8. Hofman, T.; Dai, C.H. Energy efficiency analysis and comparison of transmission technologies for an electric vehicle. In Proceedings of the 2010 IEEE Vehicle Power and Propulsion Conference (VPPC), Lille, France, 1–3 September 2010; pp. 1–6.
  9. Derse, M.J. Forward-Looking Solutions for Transmissions in Electric Vehicles: Transmission Concepts for Electric Vehicles/Potentials from System and Component Perspective; Neumayer Tekfor Group: Offenburg, Germany, 2008. [Google Scholar]
  10. Zhu, B.; Zhang, N.; Walker, P.; Zhan, W.; Yueyuan, W.; Ke, N.; Zhou, X. Two Motor Two Speed Power-Train System Research of Pure Electric Vehicle; SAE Technical Paper 2013-01-1480; Society of Automotive Engineer (SAE): Warrendale, PA, USA, 2013. [Google Scholar]
  11. Zhu, B.; Zhang, N.; Walker, P.; Zhan, W.; Zhou, X.; Wei, Y.; Ke, N. Gear shift schedule design for multi-speed pure electric vehicles. Proc. Inst. Mech. Eng. D J. Automob. Eng. 2014, 2014. [Google Scholar] [CrossRef]
  12. Yang, H.; Smith, A.; Swales, S.; Maguire, J. Development of two-mode hybrid powertrain with enhanced EV capability. SAE Int. J. Engines 2011, 4, 1058–1070. [Google Scholar]
  13. Sorniotti, A.; Subramanyan, S.; Turner, A.; Cavallino, C.; Viotto, F.; Bertolotto, S. Selection of the Optimal Gearbox Layout for an Electric Vehicle; SAE Technical Paper 2011-01-0946; Society of Automotive Engineer (SAE): Warrendale, PA, USA, 2011. [Google Scholar]
  14. Gunji, D.; Fujimoto, H. Efficiency analysis of powertrain with toroidal continuously variable transmission for electric vehicles. In Proceedings of the Industrial Electronics Society, IECON 2013, Vienna, Austria, 10–13 November 2013; pp. 6614–6619.
  15. Wicke, V.; Brace, C.J.; Deacon, M.; Vaughan, N.D. Preliminary Results from Driveability Investigations of Vehicles with Continuously Variable Transmissions. Available online: http://people.bath.ac.uk/enscjb/eindhoven_wicke1.pdf (accessed on 4 December 2014).
  16. Riderknecht, S.; Meier, T. Electric power train configurations and their transmissions systems. In Proceedings of the International Symposium on Power Electronics Electrical Drives Automation and Motion (SPEEDAM’10), Pisa, Italy, 14–16 June 2010; pp. 1564–1568.
  17. Meier, T.; Riderknecht, S.; Fietzek, R. Electric power train configurations with appropriate transmissions systems. In Proceedings of the SAE 2011 World Congress & Exhibition, Detroit, MI, USA, 12–14 April 2011.
  18. Gramling, J. Fully Integrated IVT-Regenerative Braking; SAE Technical Paper 2014-01-1727; Society of Automotive Engineer (SAE): Warrendale, PA, USA, 2014. [Google Scholar]
  19. Carbone, G.; Mangialardi, L.; Mantriota, G. Fuel Consumption of a Mid Class Vehicle with Infinitely Variable Transmission; SAE Technical Paper 2001-01-3692; Society of Automotive Engineer (SAE): Warrendale, PA, USA, 2001. [Google Scholar]
  20. Miller, J.M. Hybrid electric vehicle propulsion system architectures of the e-CVT type. IEEE Trans. Power Electron. 2006, 21, 756–767. [Google Scholar] [CrossRef]
  21. De Pinto, S.; Mantriota, G. A simple model for compound split transmissions. Proc. Inst. Mech. Eng. D J. Automob. Eng. 2014, 228, 547–562. [Google Scholar] [CrossRef]
  22. Mangialardi, L.; Mantriota, G. Power flows and efficiency in infinitely variable transmissions. Mech. Mach. Theory 1999, 34, 973–994. [Google Scholar] [CrossRef]
  23. Mantriota, G. Power split continuously variable transmission systems with high efficiency. Proc. Inst. Mech. Eng. D J. Automob. Eng. 2001, 215, 357–368. [Google Scholar] [CrossRef]
  24. Mantriota, G. Performances of a parallel infinitely variable transmission with a type II power flow. Mech. Mach. Theory 2002, 37, 555–578. [Google Scholar] [CrossRef]
  25. Mantriota, G. Performances of a series infinitely variable transmission with a type I power flow. Mech. Mach. Theory 2002, 37, 579–597. [Google Scholar] [CrossRef]
  26. Bottiglione, F.; de Pinto, S.; Mantriota, G. Infinitely variable transmissions in neutral gear: Torque ratio and power re-circulation. Mech. Mach. Theory 2014, 74, 285–298. [Google Scholar] [CrossRef]
  27. Bottiglione, F.; Mantriota, G. MG-IVT: An infinitely variable transmission with optimal power flows. J. Mech. Des. 2008, 130, 112603:1–112603:10. [Google Scholar] [CrossRef]
  28. Bottiglione, F.; Mantriota, G. Reversibility of power-split transmissions. J. Mech. Des. 2011, 133, 084503:1–084503:5. [Google Scholar] [CrossRef]
  29. Bottiglione, F.; Mantriota, G. Effect of the ratio spread of CVU in automotive kinetic energy recovery systems. J. Mech. Des. 2013, 135, 061001:1–061001:9. [Google Scholar] [CrossRef]
  30. Holdstock, T.; Sorniotti, A.; Everitt, M.; Fracchia, M.; Bologna, S.; Bertolotto, S. Energy consumption analysis of a novel four-speed dual motor drivetrain for electric vehicles. In Proceedings of the IEEE Vehicle Power and Propulsion Conference, Seoul Olympic Parktel, Seoul, Korea, 9–12 October 2012.
  31. Sorniotti, A.; Boscolo, M.; Turner, A.; Cavallino, C. Optimization of a multi-speed electric axle as a function of the electric motor properties. In Proceedings of the IEEE Vehicle Power and Propulsion Conference, Lille, France, 1–3 September 2010.
  32. Sorniotti, A.; Holdstock, T.; Everitt, M.; Fracchia, M.; Viotto, F.; Cavallino, C.; Bertolotto, S. A novel clutchless multiple–speed transmission for electric axles. Int. J. Powertrains 2013, 2, 103–131. [Google Scholar] [CrossRef]
  33. Bottiglione, F.; de Pinto, S.; Mantriota, G. A simple approach for hybrid transmission efficiency. In Proceedings of the 7th WSEAS International Conference of Energy & Environment, Kos, Greece, 14–17 July 2012.
  34. MOBY, Workpackage. Available online: http://www.moby-ev.eu/plusmoby (accessed on 4 December 2014).
  35. Carbone, G.; Mangialardi, L.; Mantriota, G. A comparison between the performance of full and half toroidal traction drives. Mech. Mach. Theory 2004, 39, 921–942. [Google Scholar] [CrossRef]
  36. Shinojima, T.; Toyoda, T.; Miyata, S.; Imanishi, T.; Inoue, E.; Machida, H. Development of the next-generation half-toroidal CVT with geared neutral and power-split systems for 450 Nm engines. In Proceedings of the International Continuously Variable and Hybrid Transmission Congress, Davis, CA, USA, 23–25 September 2004; pp. 46–54.
  37. Toyoda, T. Fuel economy improvement items with toroidal continuously variable transmission. In Proceedings of the 2010 CVT-Hybrid International Conference, Maastricht, The Netherlands, 17–19 November 2010; pp. 67–72.
  38. Bottiglione, F.; Carbone, G.; de Novellis, L.; Mangialardi, L.; Mantriota, G. Mechanical hybrid KERS based on toroidal traction drives: An example of smart tribological design improve terrestrial vehicle performance. Adv. Tribol. 2013, 2013, 918387:1–918387:9. [Google Scholar] [CrossRef]
  39. Carbone, G.; Mangialardi, L.; Mantriota, G. Influence of clearance between plates in metal pushing V-belt dynamics. J. Mech. Des. 2002, 124, 543–557. [Google Scholar] [CrossRef]
  40. Silva, C.; Ross, M.; Farias, T. Evaluation of energy consumption, emissions and cost of plug-in hybrid vehicles. Energy Convers. Manag. 2009, 50, 1635–1643. [Google Scholar]
  41. Silva, C.; Ross, M.; Farias, T. Analysis and simulation of “low-cost” strategies to reduce fuel consumption and emissions in conventional gasoline light-duty vehicles. Energy Convers. Manag. 2009, 50, 215–222. [Google Scholar] [CrossRef]
  42. Gao, L.; Liu, S.; Dougal, R. Dynamic lithium-ion battery model for system simulation. IEEE Trans. Compon. Packag. Technol. 2002, 25, 495–505. [Google Scholar] [CrossRef]
  43. Frank, A.A. Engine optimization concepts for CVT-hybrid systems to obtain the best performance and fuel efficiency. In Proceedings of the International Continuously Variable and Hybrid Transmission Congress, Davis, CA, USA, 23–25 September 2004.
  44. Ribau, P.; Silva, C.; Sousa, J. Efficiency, cost and life cycle CO2 optimization of fuel cell hybrid and plug-in hybrid urban buses. J. Appl. Energy 2014, 129, 320–335. [Google Scholar]
  45. Karbowski, D.; Kwon, J.; Kim, N.; Rousseau, A. Instantaneously Optimized Controller for a Multimode Hybrid Electric Vehicle; SAE Technical Paper 2010-01-0816; Society of Automotive Engineer (SAE): Warrendale, PA, USA, 2010. [Google Scholar]

