


Abstract
High-rate GNSS has attracted increasing attention and numerous applications in geohazard monitoring and early warning. In this paper, we investigate three current existing single-receiver approaches for real-time GNSS seismology, comparing their observation models for equivalence and assessing the impact of main error components. We propose some refinements to the variometric approach and especially consider compensating the geometry error component by using the accurate initial coordinates before the earthquake to eliminate the drift trend in the integrated coseismic displacements. After careful corrections of satellite ephemeris, ionospheric delay, tropospheric delay and geometry errors, the refined variometric approach and the temporal point positioning (TPP) method have equivalent mathematical model with the converged precise point positioning (PPP). We evaluated the precision of the variometric and TPP approaches with various error correction schemes and duration time using numerous data sets and demonstrated that few centimetres accuracy of coseismic displacements is achievable even for 20 min interval. We applied these single-receiver approaches to process 1 Hz GPS data collected from the Tohoku-Oki earthquake (Mw 9.0, 2011 March 11) in Japan to capture coseismic displacement, and further, inverted the obtained displacement fields for fault slip distribution and moment magnitude. Comparisons of the results obtained using the refined variometric approach and TPP, as well as the converged PPP, displayed very good consistence both in coseismic displacements within few centimetres and in the slip distribution patterns and moment magnitudes.
1 INTRODUCTION
Recent destructive earthquakes that struck Sumatra, Indonesia (Mw 9.2) in 2004, Wenchuan, China (Mw 7.9) in 2008, Maule, Chile (Mw 8.8) in 2010 and Tohoku, Japan (Mw 9.0) in 2011 have once again brought us to focus the urgent need for earthquake monitoring and early warning. An earthquake monitoring and early warning system, providing rapid vital earthquake information (coseismic displacements, location of the earthquake source and its magnitude, etc.) for hazard assessment and mitigation, has traditional been based on seismic instruments (Crowell et al.2009). However, for large seismic events, it is difficult for traditional seismic instruments to produce accurate and reliable displacements because of the saturation of broadband seismometers and problematic integration of strong-motion data into displacements due to sensor rotation and tilt (Trifunac & Todorovska 2001; Wang et al.2013). In contrast, high-rate (e.g. 1 Hz or higher frequency) GNSS measures displacements directly, and GPS-based seismic source characterization has been demonstrated in near- and far-field with remarkable results (Nikolaidis et al.2001; Larson et al.2003; Bock et al.2004; Ohta et al.2008; Yokota et al.2009; Avallone et al.2011; Crowell et al.2012; Melgar et al.2012). Compared with the traditional seismometers and accelerations, GNSS can measure arbitrarily large dynamic displacements without saturation (Bock et al.2004), making them particularly valuable in case of large earthquakes and tsunamis (Larson et al.2003; Allen & Ziv 2011).
GNSS relative positioning approach is usually adopted to estimate seismic displacements since centimetre-level accuracy can be achieved in real-time by processing double-differenced carrier-phase observables (Bock et al.2000; Crowell et al.2009; Ohta et al.2012; Colombelli et al.2013). However, relative positioning method requires a local reference station, which might itself be displaced during a large seismic event, resulting in misleading GNSS analysis results. The reference station should be sufficiently far from the focal region, but must also be part of a subnetwork that has relatively short baselines (usually within several tens of kilometres). As the baseline length increases, the accuracy of relative positioning would be significantly reduced because the atmospheric effects and satellite ephemeris errors become less common and thus cannot be effectively cancelled out by double-difference technique. Meanwhile, the relative/network approach is time-consuming, particularly difficult for the challenging simultaneous and real-time analysis of GNSS data from hundreds or thousands of ground stations.
In recent years, several single-receiver approaches for real-time GNSS seismology, which can overcome the reference station problem of the relative positioning approach, have been successfully developed and applied to GNSS seismology (Colosimo et al.2011; Wright et al.2012; Li et al.2013a,b; Zhang & Guo 2013). One available method is real-time precise point positioning (PPP, Zumberge et al.1997) relied on precise satellite orbit and clock products (Caissy et al.2012), which can provide ‘absolute’ seismic displacements under a global reference frame. Especially, with the development of PPP integer ambiguity fixing solution (Ge et al.2008; Geng et al.2012; Li et al.2013c), PPP can achieve comparable accuracy as relative positioning (Li et al.2013a). However, real-time PPP needs a long (re)convergence period, of about 30 min, to resolve integer phase ambiguities and achieve centimetre-level accuracy. The usefulness of the PPP-based displacement would be significantly reduced if an earthquake happens during a PPP (re)convergence period (Collins et al.2009).
In comparison with PPP, Colosimo et al. (2011) proposed a variometric approach to determine the change of position between two adjacent epochs (namely delta position) based upon the time single-differences of the carrier phase observations, and then displacements of the station are obtained by a single integration of the delta positions. This approach does not suffer from convergence process, but the single integration from delta positions to displacements is accompanied by a drift due to the potential uncompensated errors. Usually, a limited duration of 3–4 min may be enough for large displacements retrieving. Under the assumption that the variometric-based displacement has a linear trend within few minutes, the estimated displacements after linear trend removal are demonstrated to be at a level of a few centimetres (Branzanti et al.2013).
Li et al. (2013b) presented a temporal point positioning (TPP) method to quickly capture coseismic displacements with a single GNSS receiver in real-time, which directly calculates the displacement of one epoch relative to the chosen initial epoch (before the earthquake) with known coordinates. The TPP approach can overcome the convergence problem of PPP, and also avoids the integration and detrending process of the variometric approach. The performance of TPP is demonstrated to be at few centimetres level of displacement accuracy for even 20 min interval with real-time precise orbit and clock (POPC) products.
In this study, we first present and compare the observation models and processing strategies of the current existing single-receiver methods for real-time GNSS seismology. Furthermore, we propose several refinements to the variometric approach in order to eliminate the drift trend in the integrated coseismic displacements. The mathematical relationship between these methods is discussed in detail and their equivalence is also proved. The impact of error components such as satellite ephemeris, ionospheric delay, tropospheric delay and geometry change on the retrieved displacements are carefully analysed and investigated. Finally, the performance of these single-receiver approaches for real-time GNSS seismology is validated using 1 Hz GPS data collected during the Tohoku-Oki earthquake (Mw 9.0, 2011 March 11) in Japan. It is shown that few centimetres accuracy of coseismic displacements is achievable.
2 SINGLE-RECEIVER APPROACHES FOR REAL-TIME GNSS SEISMOLOGY
In this section, we describe the technical details of current single-receiver GNSS seismology approaches. Furthermore, several refinements are proposed to improve the performance of the variometric approach. Finally, we discuss the mathematical relationship among them.
2.1 Real-time PPP
2.2 The variometric approach
In the variometric approach, the velocities can be estimated with a high accuracy on the order of mm s–1 using a high-rate stand-alone receiver. A discrete integration of estimated velocities is then employed to reconstruct the coseismic displacement. Well known is that this discrete integration is very sensitive to estimation biases due to a possible mismodelling of different intervening effects that accumulate over time and display their signature as a trend in coseismic displacements. The trend can be assumed to be linear if the integration interval was limited up to few minutes (Branzanti et al.2013). Furthermore, the variometric approach is effective even when using a simplified model with broadcast orbit and clock and single frequency receiver, where the effects due to the ionosphere, troposphere, phase centre variation, relativity and phase wind-up are neglected (Colosimo et al.2011).
In order to eliminate or significantly decrease the drift trend in the integrated displacements and also avoid the linear detrending process, we propose several refinements to the variometric approach: (1) Variations in satellite orbit error Δos(tn, tn + 1) and clock bias Δts(tn, tn + 1) are corrected by using real-time precise satellite orbit and clock products which are now available online via the IGS RTPP (Caissy et al.2012). (2) All of the other error components are carefully corrected following the PPP model. Ionospheric delay changes are compensated using dual frequency measurements. The changes in tropospheric delay is mostly mitigated by a priori tropospheric model (Saastamoinen 1972), the residual part is at centimetre level for few tens of minutes. The changes in the phase centre offsets and variations, tidal loading, phase wind-up and relativistic delays can be corrected according to the existing models. (3) Special attention is given to the geometry correction |$[{\bf u}_r^s (t_{n + 1} ) - {\bf u}_r^s (t_n )] \cdot x(t_n )$|, which accounts for changes in the relative satellite/receiver geometry.
After all of error sources are carefully considered, the integrated displacements from the refined variometric approach are reasonably presumed to be with a good accuracy at centimetre level without the need of detrending. The accuracy is mainly depend on the variation of residual tropospheric delay, which is at centimetre level for few tens of minutes.
2.3 The TPP approach
When the receiver position x(t0) is precisely known and all of error sources are carefully considered, the ambiguities B(t0) with a certain accuracy can be expected. The accuracy of the position estimates x(tn) will be mainly affected by the variation of residual tropospheric delay from the epoch t0 to tn. Generally, the variation of the tropospheric delay is at centimetre level for few tens of minutes. Therefore, the position estimates are reasonably presumed to be with a good accuracy at centimetre level without detrending process.
In TPP approach, an accurate initial position at epoch t0 (i.e. the receiver position before the earthquake) is important for achieving high-accuracy displacements. The influence of initial position accuracy on the TPP displacements can be found in Li et al. (2013b).
2.4 Comparison of analysis methods: single-receiver GNSS seismology
For real-time PPP processing, the phase ambiguities are estimated together with the receiver position, receiver clock, and residual tropospheric delays. The ambiguities need some time to converge (e.g. 30 min) to the correct values, until enough observables are used in the filter. There will be a big disturbance in the displacement sequence during the (re)convergence period. Once the ambiguities are successfully fixed to correct integer values or converged to accurate real values, displacement accuracy of few centimetres can be achieved.
In order to avoid the convergence problem, the TPP method makes full use of two critical features in seismological applications: the receiver position before the earthquake is generally well known and the ambiguity is constant on the assumption that the observation data is continuous. The TPP method is equivalent to PPP with the real phase ambiguities fixed at values determined from the known position at the epoch, preceding the earthquake and using an a priori tropospheric delay. This new TPP method can provide about the same, a cm level precision, as the converged PPP, which requires up to 30 min data prior the earthquake for a PPP solution convergence. It can be found that the TPP and the converged PPP have similar mathematical model, the difference between them is that TPP uses the known position at initial epoch to calculate accurate phase ambiguity, while PPP uses a period of observation data for phase ambiguity convergence.
In PPP approach, once ambiguities are fixed or converged to correct values, it also has the same observation model as TPP method for subsequent epochs and the same equation as (13) can also be derived from PPP model. The only difference is that PPP can use a better tropospheric delay estimated from convergence process, while TPP and variometric approaches use a priori tropospheric delay model. Fortunately, the variation of the tropospheric delay is slowly, at centimetre level for few tens of minutes, which is of greatest interest in seismological applications.
From the above analysis on the single-receiver approaches for real-time GNSS seismology, we can conclude that the TPP, converged PPP and refined variometric approaches have equivalent mathematical model and should provide about the same displacement precision.
3 ERROR ANALYSIS AND PRECISION VALIDATIONS
Numerous studies show that PPP is a powerful technique for seismological applications, and PPP-derived displacement accuracy is comparable to relative positioning method if UD ambiguities are successfully fixed (Geng et al.2013; Li et al.2013a). Compared with PPP approach, there is still little research on detailed error analysis and precision validation of variometric and TPP approaches for coseismic displacement retrieving. In this section, we carefully analyse the impact of error components on variometric and TPP-derived displacements. The precision of these single-receiver approaches is also evaluated and compared by using 1 Hz GEONET (the GNSS Earth Observation Network System) data collected during the 2011 Mw 9.0 Tohoku-Oki earthquake in Japan. This network is operated by the Geospatial Information Authority of Japan (GSI) and consists of more than 1200 continuously observing GNSS stations all over Japan (http://www.gsi.go.jp/).
3.1 Error analysis of variometric approach
The variometric approach firstly computes the delta position of one station between two adjacent epochs, and then the displacement waveform is reconstructed through the discrete integration method. Well known is that this (discrete) integration is very sensitive to estimation biases due to the possible mismodelling of different intervening effects (such as orbit and clock errors, atmospheric errors and geometry errors) that accumulate over time and display their signature as a trend in the coseismic displacements. We design four schemes as listed in Table 1 to evaluate the impacts of these errors on cumulative displacements. All of the other error components (e.g. phase centre offsets and variations, tidal loading, phase wind-up and relativistic delays) are carefully corrected according to the existing models as PPP (Kouba & Héroux 2001).
Four different schemes for the variometric approach.
| Satellite ephemeris | Ionospheric delay | Geometry error | |
|---|---|---|---|
| Scheme 1 (BOBC L1) | Broadcast ephemeris | L1 observation | An approximate position |
| Scheme 2 (BOBC LC) | Broadcast ephemeris | LC observationa | An approximate position |
| Scheme 3 (POPC) | Precise orbit and clock | LC observation | An approximate position |
| Scheme 4 (POPC geometry) | Precise orbit and clock | LC observation | An accurate position |
aLC, ionosphere-free combination.
3.1.1 Ionospheric effect
The cumulative displacements from 00:00 to 00:20 (UT, before the earthquake) on 2011 March 11 for station 0177 are exemplarily shown in Fig. 1. The results using broadcast orbit, broadcast clock and L1 carrier phase observation (BOBC L1, ionospheric delay is not compensated) are depicted by the blue lines, and the results in which ionospheric delay is eliminated by using ionosphere-free combination observation (BOBC LC) are shown by the red lines.
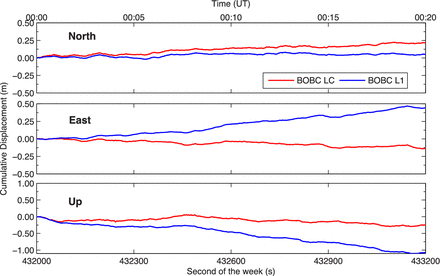
Cumulative displacements using the variometric approach: impact of ionospheric delay. Results of station 0177 (GEONET) for 20 min interval 00:00:00–00:20:00 (UT) on 2011 March 11.
To clearly display the impact of ionospheric delay on the cumulative displacements, the displacement differences between BOBC L1 and BOBC LC results are shown in the blue line in Fig. 2. A drift trend can be clearly seen in all three components. The linear fitting of displacement differences is also depicted in Fig. 2 in the red line. Besides linear trend, the displacement differences also contain some short-term fluctuations because of the ionospheric disturbance. For 20 min integration interval, the displacement differences of station 0177 due to ionospheric delay could reach about 17, 58 and 83 cm in the north, east, and up components, respectively.
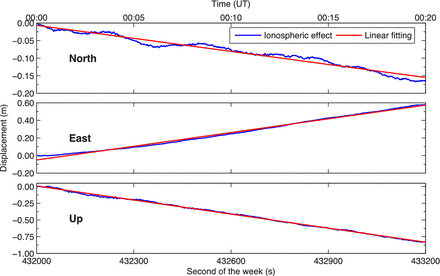
The displacement differences of station 0177 due to ionospheric delay for the 20 min interval 00:00:00–00:20:00 (UT) on 2011 March 11.
The displacement errors of BOBC L1 and BOBC LC solutions of about 20 stations for 20 min interval are shown in Fig. 3. The displacement errors of other stations are similar to the results of station 0177. The displacement errors of BOBC L1 solution are obviously larger than the BOBC LC solution, especially in up component. Figs S1 and S2 (in in auxiliary material) represent the displacement errors for 10 min interval and 5 min interval, respectively. It is obvious that the displacement errors are larger for longer integration interval. Taking the up component as example, the differences are about 0.8 m for 20 min interval, and 0.2 m for 5 min interval. It is concluded that ionospheric delay has very significant impact on accumulative displacements, it should be carefully considered to retrieve precise coseismic displacements without drift tread.
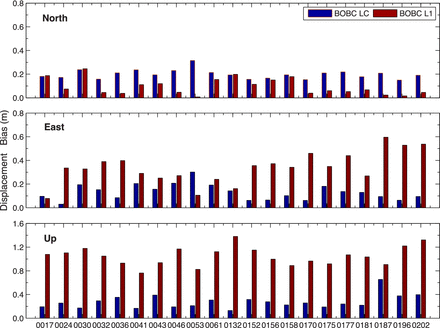
Comparison of the displacement errors of BOBC L1 and BOBC LC solutions of about 20 stations for the 20 min interval 00:00:00–00:20:00 (UT) on 2011 March 11. The displacement errors of north, east and up components are shown in the top, middle and bottom subfigures. The BOBC L1 solutions are in red and the BOBC LC ones in blue.
3.1.2 The effect of satellite ephemeris
Currently, two types of orbit and clock products are available in real time. One is broadcast orbit and clock, which is routinely available from the GNSS receiver itself with an accuracy of about decimetre to meter level. The other one is precise satellite orbit and clock products from the IGS RTPP with an accuracy of few centimetres (Dow et al.2009; Caissy et al.2012). Here the ultra-rapid orbit, updated every three hours and provided by GFZ, is applied. The clock corrections have to be estimated and updated much more frequently (Zhang et al.2011) due to their short-term fluctuation. We process 1 Hz data from 80 to 90 globally distributed real-time IGS stations using the GFZ's EPOS-RT software (Ge et al.2011) in simulated real-time mode (a strictly forward filter) for generating precise GNSS clock corrections at a 5 s sampling interval.
The cumulative displacements of station 0177 for 20 min interval are shown in Fig. 4. The results using broadcast orbit, broadcast clock and LC observation (BOBC) are depicted by blue line, and the results using precise orbit, precise clock and LC observation (POPC) are shown by red lines. Compared with POPC results, BOBC results show a complicated drift character with more fluctuations. Take the up component for instance, the BOBC cumulative displacements has a drift up to about 30 cm.
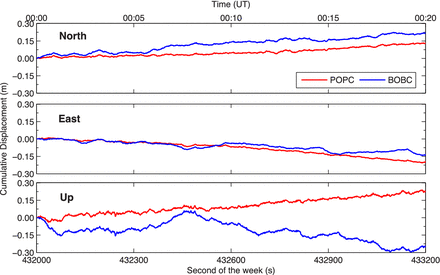
Cumulative displacements using the variometric approach: impact of satellite orbit and clock. The red line shows the result using precise satellite orbit and clock, while the blue line is the result using broadcast clock and orbit. Results of station 0177 (GEONET) for the 20 min interval 00:00:00–00:20:00 (UT) on 2011 March 11.
The displacement errors of POPC and BOBC solutions of about 20 stations for 20 min interval are shown in Fig. 5. The differences of the cumulative displacements between the two solutions denote the effect of satellite ephemeris on displacements, and displacement differences of the station 0177 could reach about 10 cm in horizontal components and about 50 cm in up component for 20 min integration interval. The displacement errors for 10 min and 5 min interval are shown in Figs S3 and S4 (in in auxiliary material), respectively. It can be found that the displacement errors of POPC solution are generally smaller than BOBC solution. In addition, the displacement differences are not linearly proportional to the integration interval. Taking the up component for instance, the differences between POPC and BOBC solutions on average are about 44.6 cm for 20 min interval, 14.9 cm for 10 min interval and 13.8 cm for 5 min interval. It is concluded that satellite ephemeris has important influence on accumulative displacements, and the displacement errors caused by broadcast orbit and clock is not a simple linear trend.
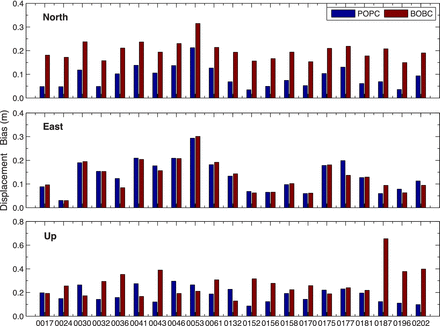
Comparison of the displacement errors of POPC and BOBC solutions of about 20 stations for 20 min interval 00:00:00–00:20:00 (UT) on 2011 March 11. The displacement errors in north, east and up components are shown in the top, middle and bottom subfigures. The BOBC solutions are in red and the POPC ones in blue.
3.1.3 The geometry error effect
The different cumulative displacement waveforms, devoted to the effect of geometry error for station 0177, are exemplarily shown in Fig. 6. The result without compensating the geometry error by using precise ephemeris and LC observation (POPC) is depicted by the blue line, and the result in which geometry error is carefully corrected (POPC geometry) is shown by the red line. The differences between the two accumulative displacements indicate the effect of geometry error on the displacement. After 20 min, the displacement differences between POPC geometry results and POPC (no geometry correction) results could reach 13.3, –20.3 and 18.2 cm in the north, east and up components, respectively. The POPC geometry solution, considered to be the most accurate estimation in four strategies, can achieve an accuracy of about few centimetres, which could be caused by the residual tropospheric delay.
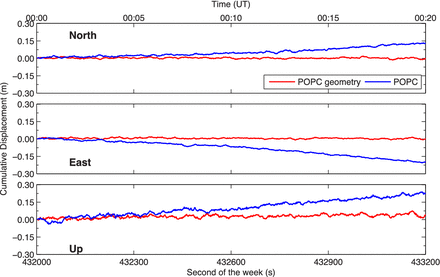
Cumulative displacement waveforms using the integrated velocities: impact of the geometry error with (red line) and without (blue line) consideration. Results of 0177 (GEONET) in the 20 min interval 00:00:00–00:20:00 (UT) on 2011 March 11.
The displacement errors of POPC geometry and POPC (no geometry correction) solutions of about 20 stations for 20 min interval are shown in Fig. 7. It is obvious that the geometry error has very significant impact on accumulative displacements, it should be carefully considered to retrieve precise coseismic displacements. The displacement error caused by geometry item can reach up few decimetres for 20 min interval. Fig. S5 represents the displacement errors of POPC geometry and POPC solutions for 10 min interval.
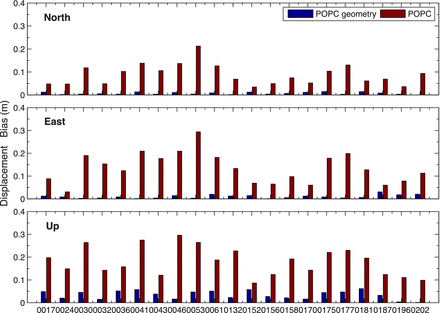
Comparison of the displacement errors from POPC geometry and POPC solutions of about 20 stations for 20 min interval 00:00:00–00:20:00 (UT) on 2011 March 11. The displacement errors in north, east and up components are shown in the top, middle and bottom subfigures. The POPC solutions are in red and the POPC geometry ones in blue.
To further reflect the spectral characteristics of different displacement waveforms, the power spectral densities (PSD) at station 0177 for each scheme are shown in Fig. 8. Four displacement results are respectively depicted by different colour lines: (1) POPC geometry result in red line; (2) POPC result in blue line; (3) BOBC result in black line and (4) BOBC L1 result in cyan line. On the whole, the POPC geometry PSD curve performs more or less flat, especially at high frequency bands between 0.05 and 0.5 Hz, but other three curves have many fluctuations mainly caused by their displacement waveforms with a nearly linear trend. At the low frequency bands less than 0.05 Hz, the POPC geometry PSD values are obviously the smallest in all three components, which indicates the POPC geometry displacements have few biases off the truth. Conversely, the BOBC L1 PSD values are the biggest, and the corresponding displacements contain large biases. The POPC and the BOBC PSD curves are between the above two results, and the BOBC PSD values are slightly larger than the POPC PSD values due to the low precision of broadcast ephemeris.
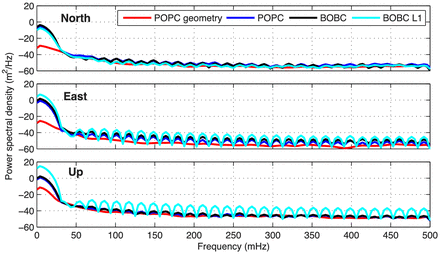
Power spectral density comparisons of the displacement waveforms at station 0177 for each scheme: upper panel for the north component; middle panel for the east component; and lower panel for the vertical component.
3.2 Error analysis of TPP method
As ionospheric delay can be compensated by using dual-frequency observations and TPP method does not suffer from geometry error, we mainly in this section concentrate on the impact of orbit and clock errors on the TPP displacements.
To investigate the effect of the satellite orbit and clock product on the TPP method, we process the 1 Hz GEONET data using different orbit and clock products. The TPP displacements of station 0177 for 20 min interval are shown in Fig. 9. The results using POPC is the closest to the zero line without a drift trend at an accuracy of few centimetres. The results using precise clock and broadcast orbit (PCBO) is the second closest to the zero line, but it gradually diverges from the zero value, especially in the up component. Compared with the POPC/PCBO results, the results using broadcast clock (both POBC and BOBC solutions) have an evident drift error up to few decimetres.
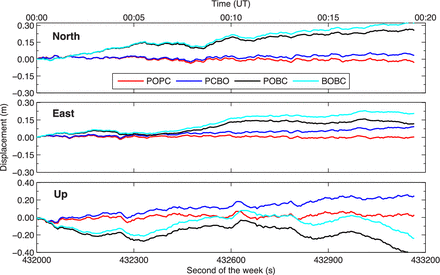
Displacements using the TPP method: impact of satellite orbit and clock. Results of 0177 (GEONET) for 20 min interval 00:00:00–00:20:00 (UT) on 2011 March 11.
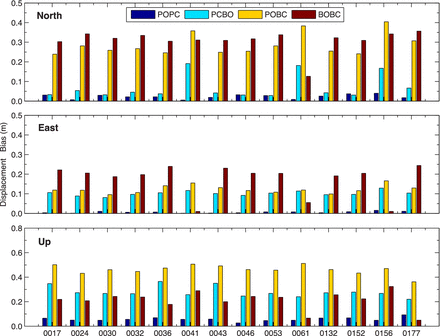
The TPP displacement errors of POPC, PCBO, POBC and BOBC solutions of about fifteen stations for 20 min interval are shown in Fig. 10 (see Figs S6 and S7 in auxiliary material for 10 and 5 min, respectively). It is clearly shown that the displacement errors for PCBO, POBC and BOBC solutions increases evidently up to few decimetres along with the extension of processing period, while the errors of POPC solution is only few centimetres in all three components. In addition, the displacements using precise satellite clock are much better than the ones using broadcast clock, both of the POBC and BOBC errors exceed one decimetre even when the integration interval is 5 min, while the POPC and PCBO errors are smaller than five centimetres. It can be concluded that the satellite clock error has more influence on the TPP results than satellite orbit error.
Comparison of displacement errors from POPC, PCBO, POBC and BOBC solutions of about fifteen stations for 20 min interval 00:00:00–00:20:00 (UT) on 2011 March 11. The displacement errors in north, east and up components are shown in the top, middle and bottom subfigures, respectively.
The precise satellite clock product is accurate enough as a reference value, thus the difference between the broadcast and the precise clock product can be considered as error of broadcast satellite clock product. Fig. 11 shows the broadcast clock error for satellite PRN 09 (see Fig. S8 in auxiliary material for satellite PRN 10). We can found that the variation of clock errors could reach few decimetres for 20 min. The corresponding residual errors after a linear trend removal are also shown in bottom subfigures.
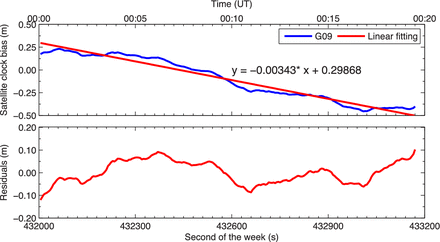
The broadcast satellite clock error of PRN 09 for 20 min interval. The linear fitting results for the clock errors and the residuals after a linear trend removal are also shown in red line.
4 APPLICATION TO THE 2011 TOHOKU-OKI EARTHQUAKE
We reprocessed the 1 Hz GPS data (dual frequency) collected by GEONET stations during the 2011 Mw 9.0 Tohoku-Oki earthquake (2011 March 11, 05:46:24 UTC; GPS time-UTC = 15 s) using single-receiver approaches (PPP, variometric and TPP) in real-time mode. For the PPP method, we processed these data using precise satellite orbit and clock product. For the variometric and TPP method, we processed these data using precise and broadcast orbit/clock products, respectively.
4.1 Displacement waveforms from PPP, variometric and TPP approaches
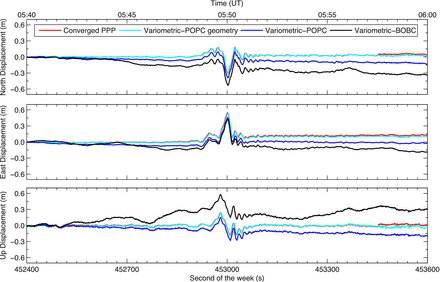
The coseismic displacement waveforms, for the 20-min period around the entire seismic shaking at two GNSS stations (0183, 0986), are shown as examples from Figs 12 –15. The earthquake signature can be clearly observed in the 3-D displacement waveforms. Fig. 12 shows a comparison of displacement series between PPP and variometric method for station 0183 (about 250 km away from the epicentre). The converged PPP (ambiguity fixed solution) waveforms, which have an accuracy of few centimetres (Li et al.2013a) and can be regarded as a reference, are shown by the red line. The variometric-based displacements using broadcast ephemeris (Variometric-BOBC) has a visible drift from the converged PPP results. Although precise orbits and clocks are applied, Variometric-POPC solution still drifts up to few decimetres in the cumulative displacements. After the geometry error correction, the variometric-based displacements (Variometric-POPC geometry) agree quite well with the converged PPP results.
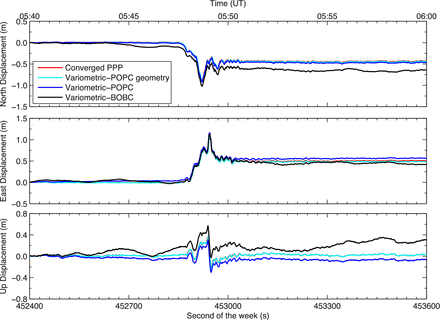
Comparisons of the displacement waveforms using variometric method and converged PPP solution for station 0183 in the 20 min interval from 05:40:00 to 06:00:00 (UT) on 2011 March 11.
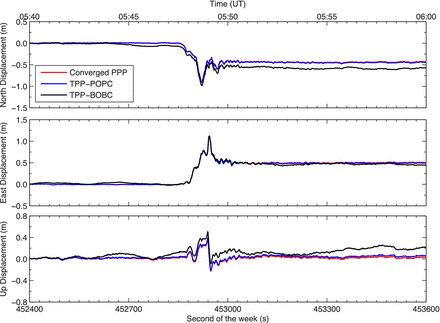
Comparisons of the displacement waveforms using TPP method and converged PPP solution for station 0183 in the 20 min interval from 05:40:00 to 06:00:00 (UT) on 2011 March 11.
Comparisons of the displacement waveforms using variometric method and converged PPP solution for station 0986 in the 20 min interval from 05:40:00 to 06:00:00 (UT) on 2011 March 11.
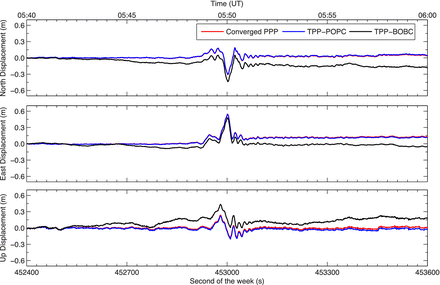
Comparisons of the displacement waveforms using TPP method and converged PPP solution for station 0986 in the 20 min interval from 05:40:00 to 06:00:00 (UT) on 2011 March 11.
Fig. 13 shows a comparison between displacement waveforms derived from PPP and TPP method. The comparisons between them show that the TPP waveforms are quite consistent with the PPP results at few centimetres accuracy during the entire shaking period. The differences between the PPP (the red line) and TPP-POPC solution (the blue line) is within 3.0 cm in horizontal components and within 5.0 cm in up component. When only broadcast orbit and clock are applied to the processing, the performance of the TPP method is degraded to about one decimetre in the horizontal components and about two decimetres in the vertical component, as indicated by the black line.
Figs 14 and 15 are the displacements waveforms of station 0986 (about 485 km away from the epicentre). In view of the results of station 0986, we come to a similar conclusion like station 0183. When real-time POPC corrections are available, TPP-POPC and Variometric-POPC geometry derive the displacement waveforms, which are both at a comparable level with the converged PPP waveforms at an accuracy of few centimetres during the entire shaking period, even for a period of 20 min.
4.2 Fault slip inversion
The permanent coseismic displacements of ninety evenly-distributed stations derived from the PPP, TPP and variometric approach are shown in Fig. 16. The PPP solution, which has been validated by numerous studies, is depicted as a reference here. In all the schemes, the TPP-POPC and variometric-POPC geometry solutions can achieve the most accurate coseismic displacements of about few centimetres (with a centralized direction to the earthquake source centroid), which agree quite well with the PPP results. The RMS of the differences between TPP-POPC and PPP solutions is about 3.0, 1.8 and 6.0 cm in north, east and up components, respectively. The corresponding RMS of the differences between variometric-POPC-geometry and PPP solutions is 3.1, 1.9 and 6.0 cm. The variometric-POPC results are the second consistent to the PPP results, the differences between them are about 1 decimetre in horizontal components and 2 decimetre in vertical component. The variometric-BOBC and TPP-BOBC solutions show a relatively large uncertainty, although the horizontal displacement values are mostly consistent within 25 per cent with PPP displacement values, the displacement vector directions do not agree very well with the PPP results accompanied by several degrees biases.
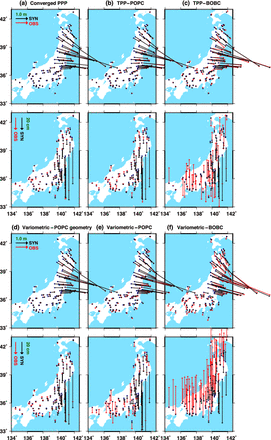
The comparisons of the observed and synthetic coseismic displacements on horizontal components, and on vertical components, respectively. (a) Inversion with permanent displacements obtained from converged PPP solution; (b) Inversion with TPP-POPC solution; (c) Inversion with TPP-BOBC solution; (d) Inversion with variometric-POPC geometry solution; (e) Inversion with variometric-POPC solution and (f) Inversion with variometric-BOBC solution.
We derived six fault slip distributions using the coseismic displacements obtained from the converged PPP solution, TPP-POPC solution, TPP-BOBC solution, variometric-POPC geometry solution, variometric-POPC solution and variometric-BOBC solution, respectively. The inversions are carried out using a FORTRAN code ‘SDM’ based on the constrained least-squares method (Wang et al.2011). A priori conditions and physical constraints are chosen as the same as Wang et al. (2013). The total rupture area is assumed to be 650 km along the strike direction and 300 km along the dip direction, which is then divided into 1950 subfaults with length and width of 10 and 10 km, respectively. The dip angle linearly increases from 10° on the top (ocean bottom) to 20° at about 80 km depth. The rake angle (slip direction relative to the strike) is allowed to vary ±20° around 90°. Green's functions are calculated based on the CRUST2.0 model (Bassin et al.2000) in the concerning area.
The comparisons of synthetic and observed displacements on horizontal and vertical components are shown in Fig. 16, and the inverted fault slip distributions are shown in Fig. 17. The best resolved slip model is assumed to be that derived from the converged PPP data set. This model indicates that the peak coseismic slip of the earthquake nearly reached 23 m which is in agreement with previous results obtained by Wang et al. (2013) with onshore GPS data. The moment magnitude of the earthquake is estimated to be Mw 8.97, which is similar to the moment solution of about Mw 9.0, estimated by the USGS. Both the inversion results derived from TPP-POPC and variometric-POPC geometry data sets are quite consistent with the PPP slip model not only in the slip distribution pattern and moment magnitude, (Mw 8.96 for both), but also in the displacement fittings. For other three inversions of TPP-BOBC, variometric-POPC and variometric-BOBC (about Mw 8.90), there are obvious differences not only for the slip distribution patterns, but also for the displacement fittings. The peak slip values for the TPP-BOBC and variometric-POPC models are less than 21 m. Overall, the comparison of the six inversion results shows that the TPP-POPC and the variometric-POPC geometry solutions can derive reliable fault slip distribution, having consistent performance with the results inverted from converged PPP solution.
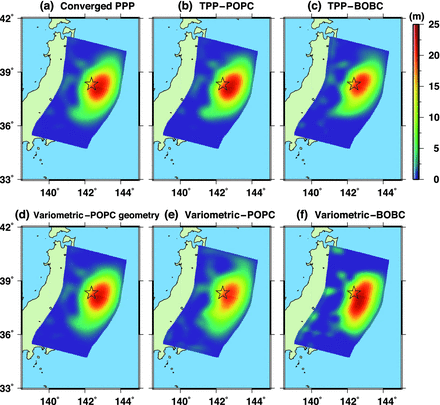
Fault slip distributions for the 2011 Tohoku earthquake inverted from different permanent coseismic displacements obtained by different strategies: (a) converged PPP; (b) TPP-POPC; (c) TPP-BOBC; (d) variometric-POPC geometry; (e) variometric-POPC and (f) variometric-BOBC.
5 CONCLUSIONS
In this study, we compared the technical details of current single-receiver GNSS seismology approaches. Furthermore, several refinements are proposed to the variometric approach in order to eliminate the drift trend in the integrated coseismic displacements. We discussed the mathematical relationship among the PPP, TPP and refined variometric approaches and verified their equivalence based on two conditions: one is that all the error components in the TPP and variometric approaches are carefully considered following the PPP model; the other is that both TPP and variometric approaches use accurate known coordinates at the initial epoch (before the earthquake) to eliminate the geometry error.
We carefully analysed the impact of error components such as satellite ephemeris, ionospheric delay, and geometry change on the displacements retrieved from the TPP and variometric approaches. The ionospheric delay has very significant impact on accumulative displacements and the drift values can reach up to several decimetres in horizontal components and about 1 meter in up components for 20 min integration interval. The satellite ephemeris, especially the satellite clock error, has critical influence on displacements which is depicted a complicated drift character with more fluctuations when broadcast orbit and clock is adopted. The geometry error also has a significant impact on accumulative displacements and the displacement error caused by geometry item can reach up few decimetres for 20 min interval.
We validated the performance of these single-receiver processing strategies (PPP, TPP and refined variometric approaches) using 1 Hz GPS data collected during the Tohoku-Oki earthquake (Mw 9.0, 2011 March 11) in Japan. After careful correction of all error components, the displacement waveforms derived from TPP and refined variometric approach are consistent with converged PPP at an accuracy of few centimetres. The results of the fault slip inversions also indicate that the TPP and the refined variometric approach can provide a reliable estimation of moment magnitudes and fault slip values as the converged PPP. From the above analysis and results on the single-receiver approaches for real-time GNSS seismology, we can conclude that the TPP, refined variometric approaches have equivalent mathematical model and can provide the same displacement precision with the converged PPP method. Moreover, these two approaches overcome the convergence problem of PPP, making them more suitable for seismological applications.
Thanks goes to the International GNSS Service (IGS) for providing GPS data of globally distributed reference stations. GEONET data with 1 Hz sampling was provided by the Geospatial Information Authority of Japan. This study was supported by Specialized Research Fund for the Doctoral Program of Higher Education of China (Grant No. 20130141110001), National 973 Project China (grant No. 2013CB733301), the Fundamental Research Funds for the Central Universities (No.: 2012214020207) and the Surveying and Mapping Foundation Research Fund Program, National Administration of Surveying, Mapping and Geoinformation (12–02–010).
REFERENCES
SUPPORTING INFORMATION
Additional Supporting Information may be found in the online version of this article:
Figure S1. Comparison of the displacement errors of BOBC L1 and BOBC LC solutions of about 20 stations for 10 min interval 00:00:00–00:10:00 (UT) on 2011 March 11. The displacement errors in north, east and up components are shown in the top, middle and bottom subfigures. The BOBC L1 solutions are in red and the BOBC LC ones in blue.
Figure S2. Comparison of the displacement errors of BOBC L1 and BOBC LC solutions of about 20 stations for 5 min interval 00:00:00–00:05:00 (UT) on 2011 March 11. The displacement errors in north, east and up components are shown in the top, middle and bottom subfigures. The BOBC L1 solutions are in red and the BOBC LC ones in blue.
Figure S3. Comparison of displacement errors of POPC and BOBC solutions of about 20 stations for 10 min interval 00:00:00–00:10:00 (UT) on 2011 March 11. The displacement errors in north, east and up components are shown in the top, middle and bottom subfigures. The BOBC solutions are in red and the POPC ones in blue.
Figure S4. Comparison of the displacement errors of POPC and BOBC solutions of about 20 stations for 5 min interval 00:00:00–00:05:00 (UT) on 2011 March 11. The displacement errors in north, east and up components are shown in the top, middle and bottom subfigures. The BOBC solutions are in red and the POPC ones in blue.
Figure S5. Comparison of the displacement errors from POPC geometry and POPC solutions of about 20 stations for 10 min interval 00:00:00–00:10:00 (UT) on 2011 March 11. The displacement errors in north, east and up components are shown in the top, middle and bottom subfigures. The POPC solutions are in red and the POPC geometry ones in blue.
Figure S6. Comparison of the displacement errors from POPC, PCBO, POBC and BOBC solutions of about fifteen stations for 10 min interval 00:00:00–00:10:00 (UT) on 2011 March 11. The displacement errors in north, east and up components are shown in the top, middle and bottom subfigures.
Figure S7. Comparison of displacement errors from POPC, PCBO, POBC and BOBC solutions of about fifteen stations for 5 min interval 00:00:00–00:05:00 (UT) on 2011 March 11. The displacement errors in north, east and up components are shown in the top, middle and bottom subfigures.
Figure S8. The broadcast satellite clock error of PRN 10 for 20 min interval. The linear fitting results for the clock errors and the residuals after a linear trend removal are also shown in red line (Supplementary Data).
Please note: Oxford University Press is not responsible for the content or functionality of any supporting materials supplied by the authors. Any queries (other than missing material) should be directed to the corresponding author for the article.
