1. Introduction
Households account for about two thirds of abstractions for urban public water (about 10% of the total). Urban water supply increased relatively strongly, mostly on account of publicly provided urban amenities, such as parks; while population growth has played a smaller role [
1]. Although this percentage is small, according to recent data from the European Water Association, domestic sector water use per capita was higher among the Mediterranean countries, Spain included.
To change this situation, the Spanish Public Administration has run several awareness campaigns to promote responsible consumption of water among its users, thanks to which the water consumption in the Spain has been reduced; for instance, the revised National Hydrological Plan (2005–2008): Plan Actions for the Management and Usage of Water (AGUA) [
2].
The objective of this program was to reorient water policies towards ensuring the sustainability of use, in terms of quantity and quality, raising the efficiency in water use and minimizing the cost of supplying, saving water resources amounting to 1100 hm3 annually by fostering demand management, recycling water and encouraging efficiency in water consumption.
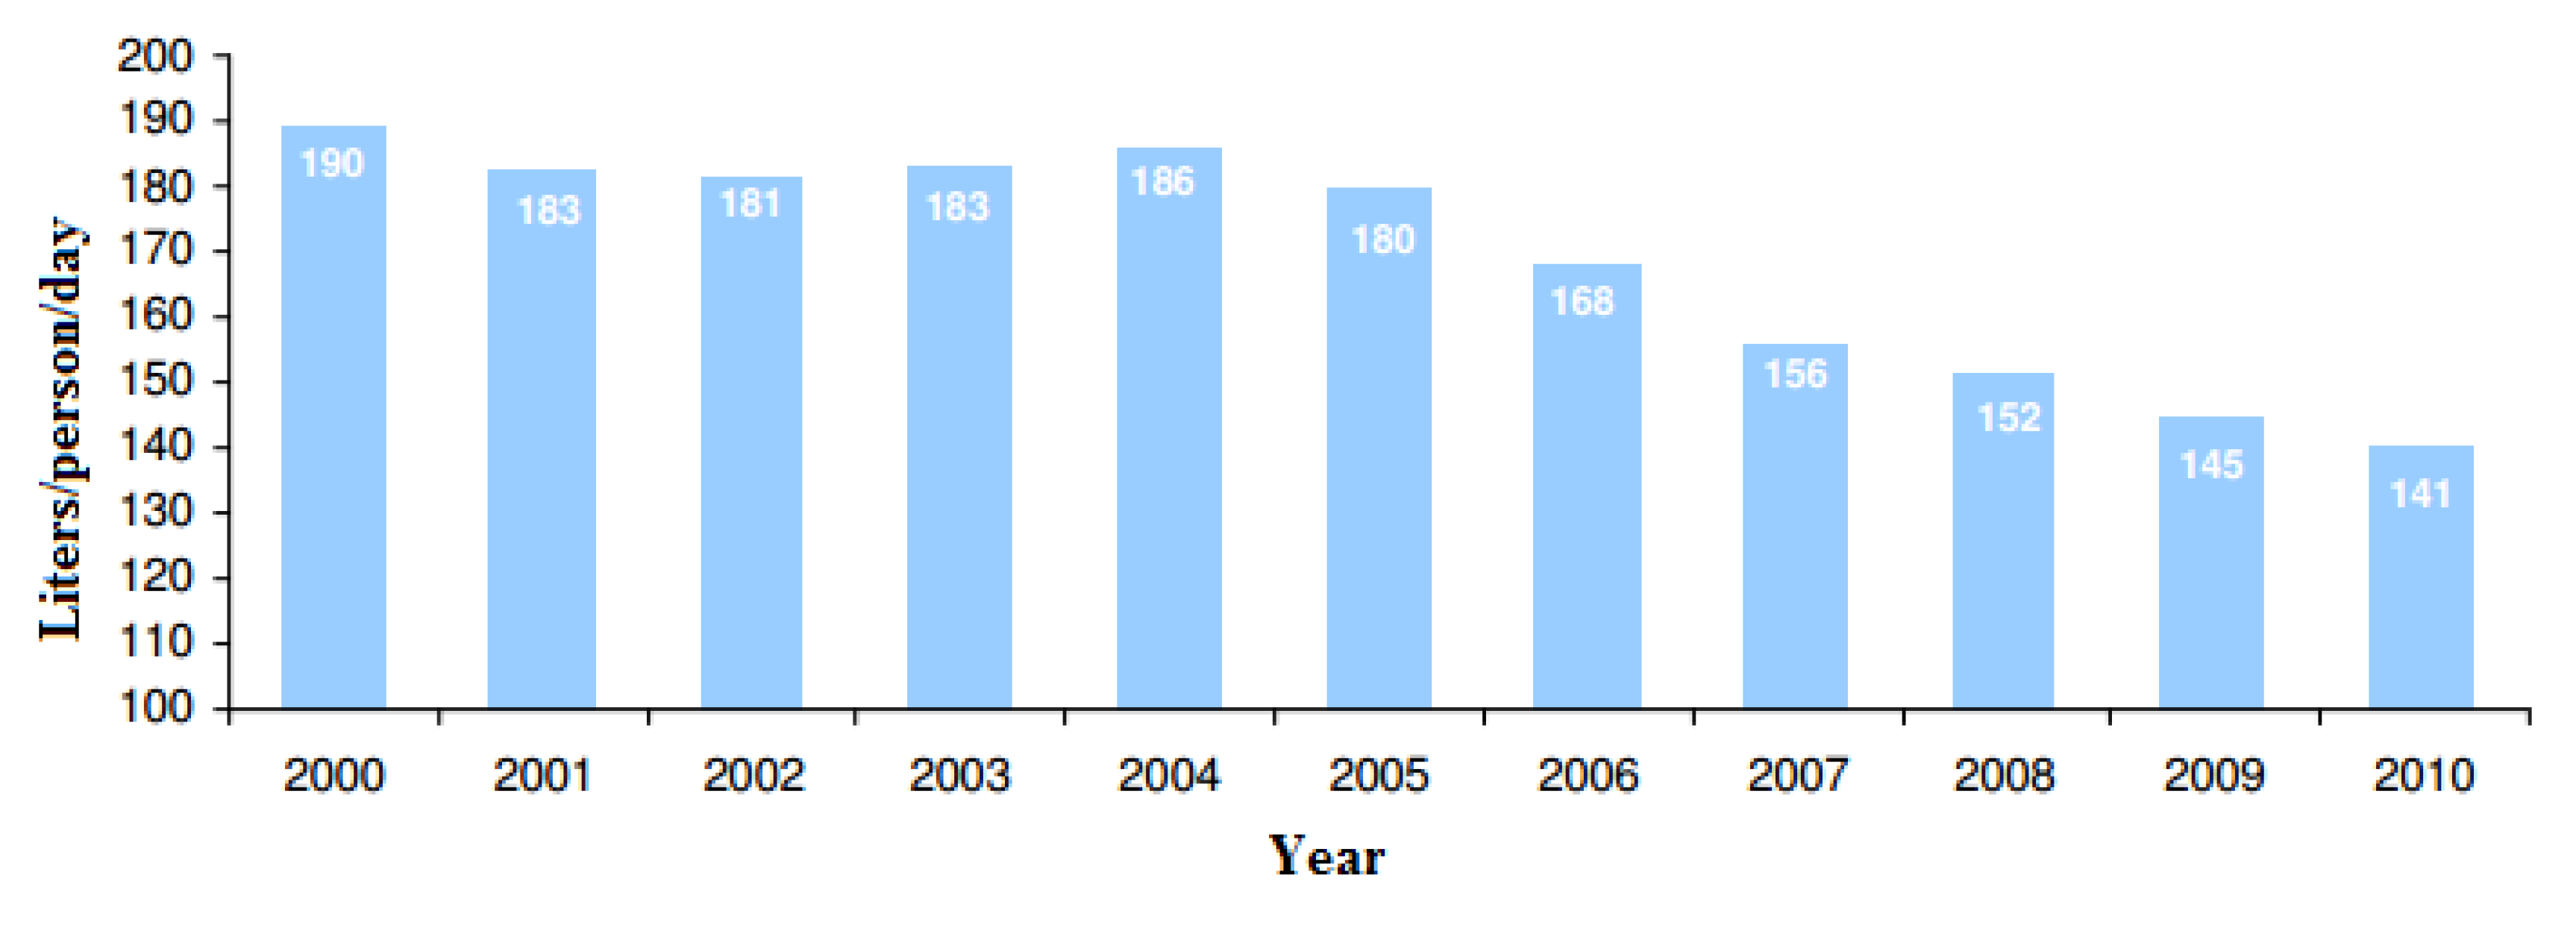
In
Figure 1, water consumption per person per day across different years can be appreciated.
Figure 1.
Water consumption liters per person per day reprinted with permission from [
3]. Copyright 2012.
Figure 1.
Water consumption liters per person per day reprinted with permission from [
3]. Copyright 2012.
As can be seen in
Figure 1, there was a decrease in the water consumption per housing unit by 24% between 2004 and 2010, where the campaigns were applied.
However, the main problem is that users do not know if they are making good use of this resource in full. Hence, before starting to develop an evaluation model, it is necessary to review the existing assessment models and applications regarding water consumption.
The National Australian Built Environment Rating Scheme (NABERS) Home Rating Calculator [
4] is an application that uses water and energy bills to evaluate household behavior. After that, the energy and water use is compared to the average home to find out if the household has an excellent or a poor performance with the starting indicators.
WaterSense [
5] is a site that provides a wide variety of information on water efficiency topics, publications and links to other very useful water efficiency websites. The site has six very interesting sections: test your WaterSense, calculate your water saving, spread the word with WaterSense, find rebates near you and WaterSense for kids.
WiseWater [
6] is a tool based on Microsoft Excel to preserve water by reducing consumption at the household level. It also incorporates a rainwater harvesting option to appreciate the potential of these installations.
The Decision Support System (DSS) Model [
7] is a Microsoft Excel-based application that provides a framework for the development of an end-use model, water demand and sewer flow forecasting and the benefit cost analysis of water conservation measures.
Furthermore, there is a model that was programmed in MATLAB, known as simulation of water demand and end-use model (SIMDEUM) [
8].
There is even a stochastic model to evaluate residential water demands made by Polytechnic University of Valencia [
9] in Spain. The model is based on a rectangular pulse point process of residential consumption, given duration and intensity, which intends to represent water demand at any time scale smaller than 24 h. The model does not rely on classical demand variation curves or peak coefficients, but rather, it is designed to generate long synthetic records of water consumption that can be useful for the analysis of hydraulic networks.
This paper is organized in several sections. Firstly, it starts with the objective. Next, it depicts the model together with the recommendations. After that, the results are eventually put forward, and finally, the paper shows the conclusions.
2. Objective
The objective of this paper is to illustrate a new model to evaluate water consumption and its application. The variable evaluated was the water consumption in residential buildings. Thanks to the input of the water bills by users, this tool allows them to obtain their water label. Moreover, the application incorporates a section of recommendations to try to get users to reduce their water consumption.
3. Method
The method used to create this application is described below. The first aim was to achieve values about water consumption in Spanish residential buildings through other research. Once the reference values were established, the variation along different months was analyzed. After studying the previous research, it was considered timely to make a survey in order to achieve real data and to confirm the previous studies. Next, the model depicts the classification to evaluate the water label. Finally, as the application tries to reduce the water consumption, it gives some tips to the users.
3.1. Real Data about Spanish Housing Water Consumption
It is necessary to clarify that the model does not make an estimation of the consumption. The real aim of the model is to evaluate the efficiency of the water consumption.
To make a realistic model, the first step was to obtain real data about Spanish housing water consumption. Before carrying out a survey, a search of the research to provide information to the model was conducted.
One of the works, conducted by the Institute of Geography [
10] of the University of Alicante, made a detailed study about the consumption of water in housing in some coastal neighborhoods.
The results obtained from invoicing indicated that housing holding up to 4 members reached values ranging from 140 to 180 L per capita per day.
Similar data has been obtained by the research of David Saurí [
11], who studied the water consumption of 40 neighborhoods of Barcelona. The average residential water consumption was more than 400 L per capita per day, and some were as little as 110 L per capita per day.
Nevertheless, another research study carried out in Barcelona [
12] reflected a huge variety of domestic water consumption, ranging from an average of 145 L per capita per day in the compact urban fabric, to an average of 245 L per capita per day in the suburban periphery; where some neighborhoods reached 500 L per capita per day or more.
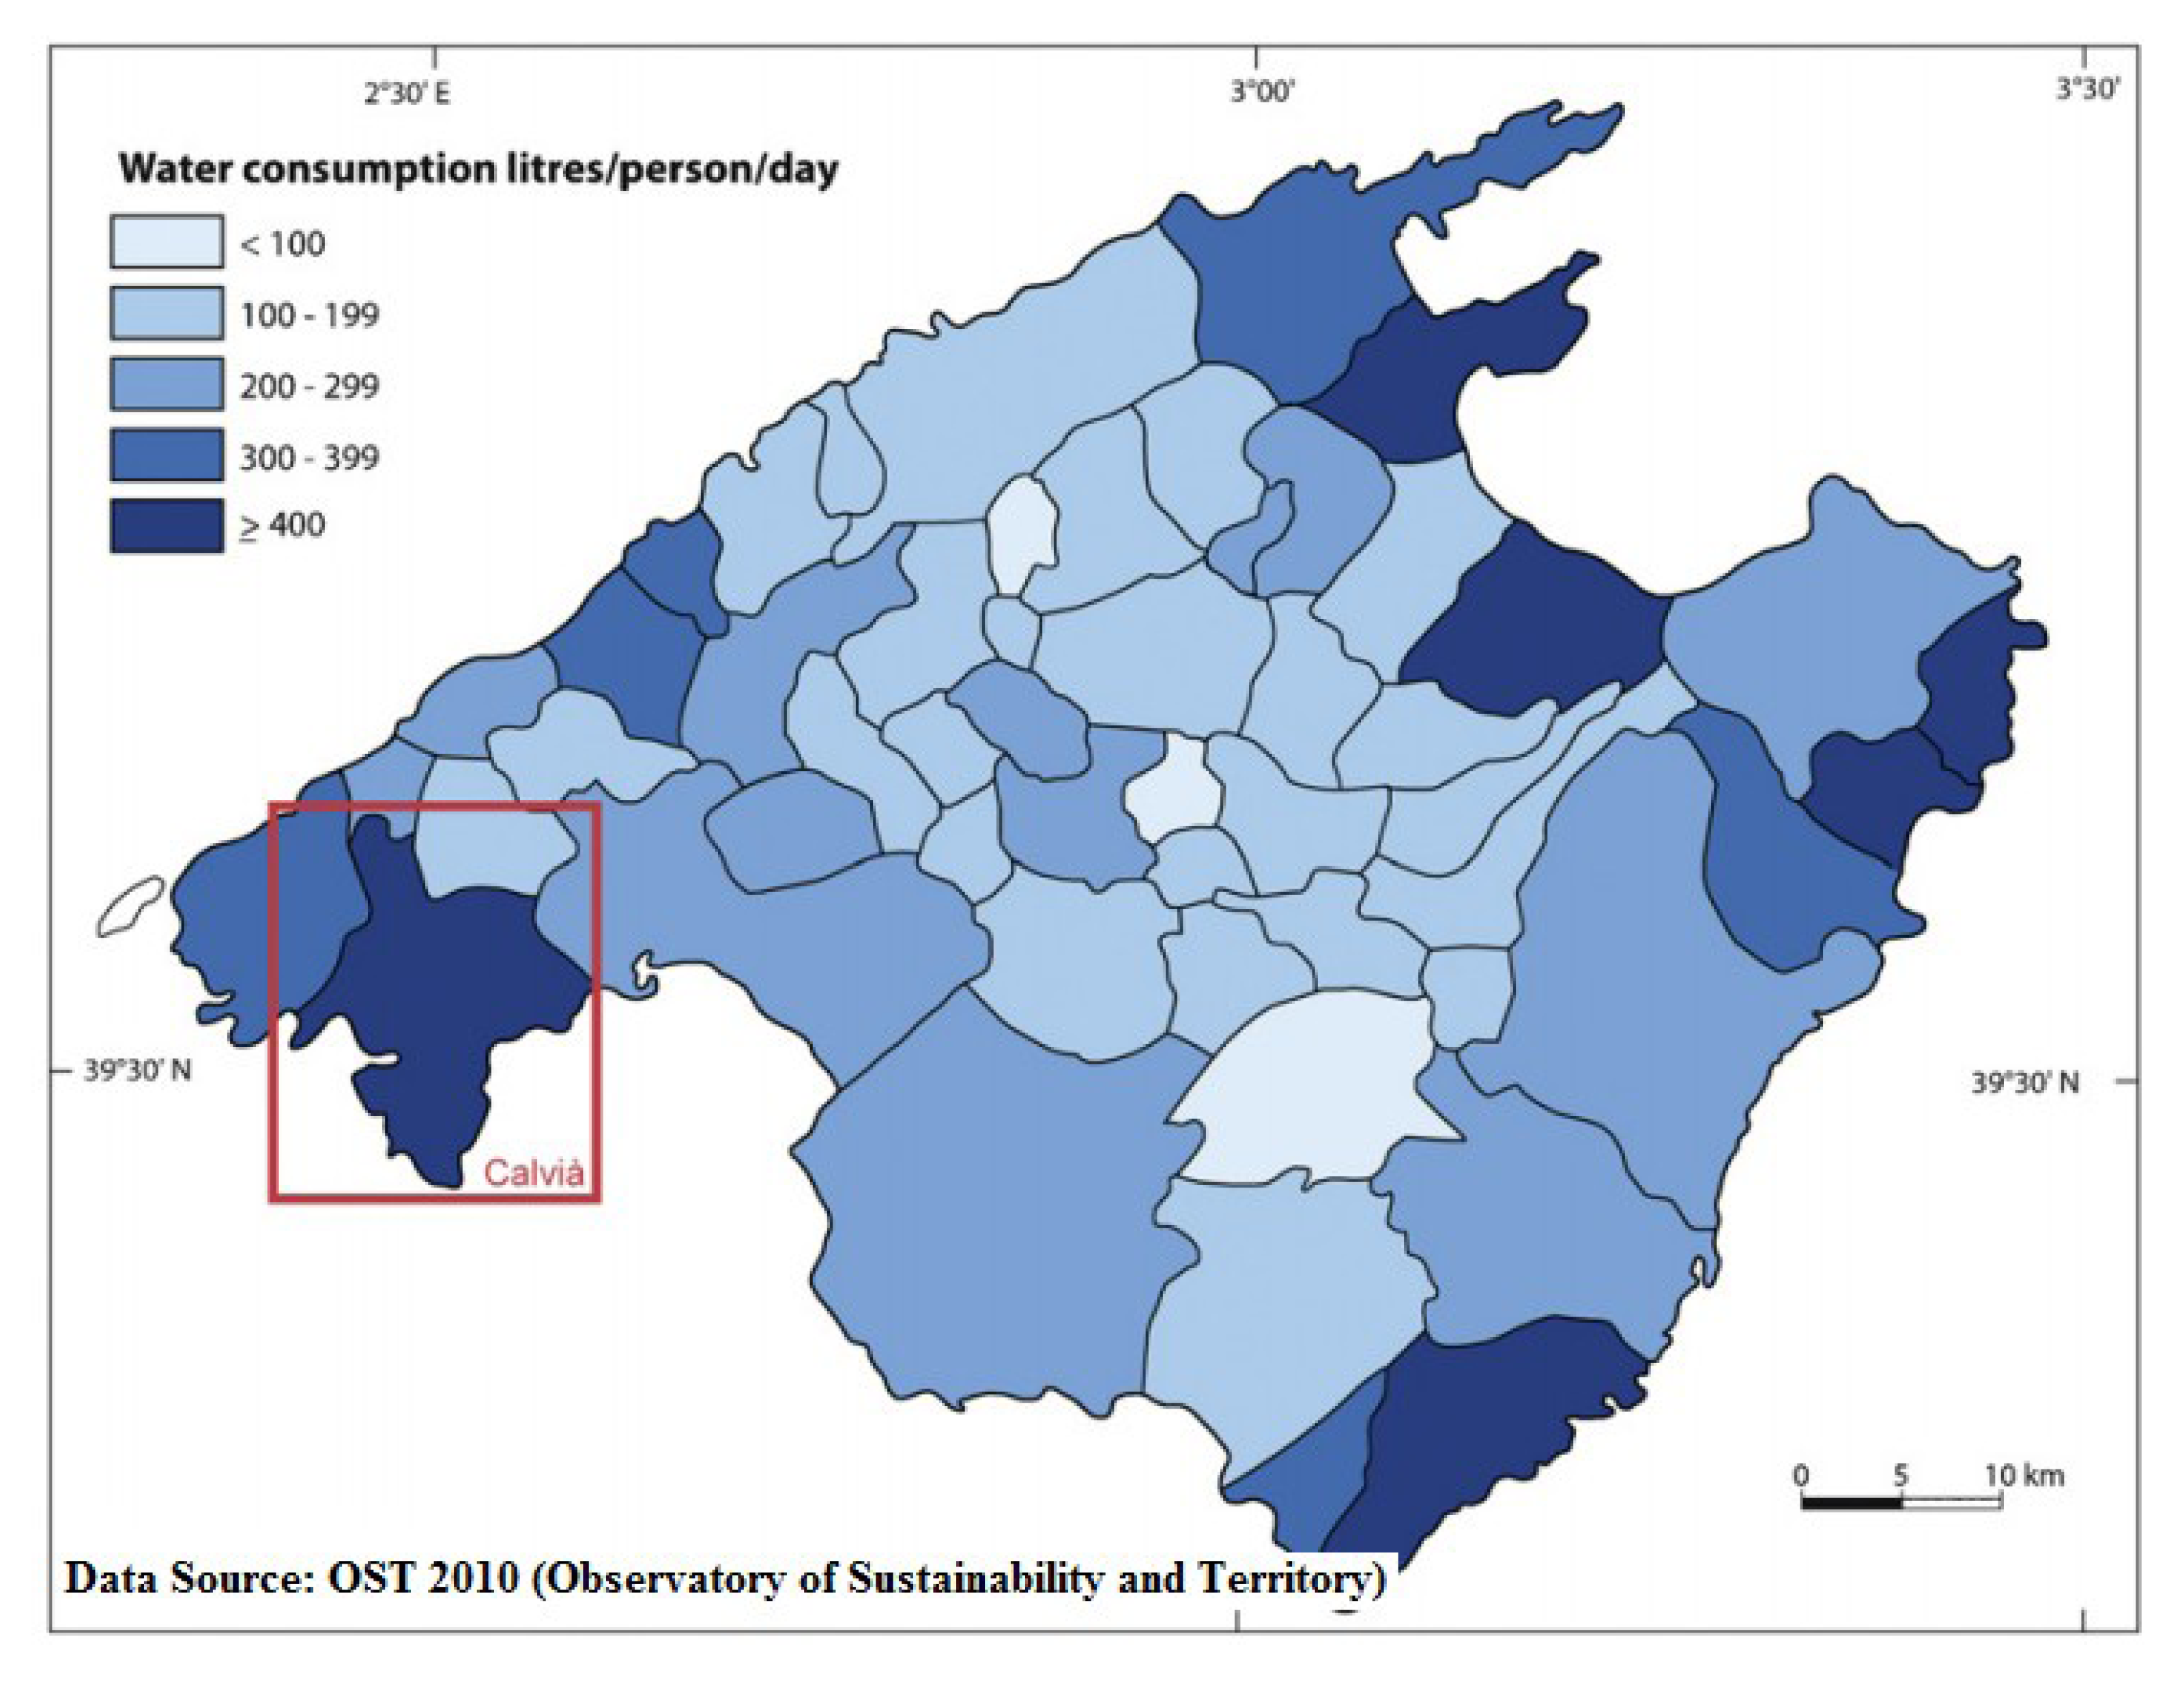
In Majorca [
13], a sharp contrast between water consumption in different neighborhoods in the same province was observed, as can be seen in
Figure 2.
Figure 2.
Water consumption per person per day (L/p/d) at the municipality level in Majorca, reprinted with permission from [
13]. Copyright 2010.
Figure 2.
Water consumption per person per day (L/p/d) at the municipality level in Majorca, reprinted with permission from [
13]. Copyright 2010.
In order to investigate the influencing factors of residential water consumption, research was conducted by the Autonomous University of Barcelona [
14], where a sample of 532 households located in 22 different neighborhoods of the region was selected. Each house was given a questionnaire of 42 questions by telephone, which took place between January and March, 2004. Three different types of housing were selected: high-density housing (apartments in multistory buildings); mid-density housing (apartment blocks with a shared garden and swimming pool); and low-density housing (condominiums and detached houses).
The distribution of indoor and outdoor uses showed a significant difference among the three different types of housing; although the behavior for high-density and mid-density was very similar.
Table 1 shows the distribution of water uses obtained by this research:
Table 1.
Distribution of water uses across housing types, reprinted with permission from [
14]. Copyright 2006.
Table 1.
Distribution of water uses across housing types, reprinted with permission from [14]. Copyright 2006.
| Room | High-density | Mid-density | Low-density |
|---|
| Shower | 33% | 33% | 21% |
| Toilet | 21% | 19% | 13% |
| Washbasin | 19% | 19% | 11% |
| Laundry | 12% | 12% | 7% |
| Kitchen | 8% | 7% | 6% |
| Garden | 0 | 4% | 36% |
| Others | 7% | 6% | 6% |
Table 1 seems striking in that 36% of water consumption in low-density housing was used for irrigating the garden.
Another interesting point of this previous research was that the tenants of the households exert an effect on the domestic water consumption per capita.
These previous studies show interesting information, although they only evaluate specific locations, like Barcelona, Majorca and Alicante. Thanks to a survey made by National Statistical Office (INE) [
15], information from all Spanish autonomous communities was obtained.
According to
Table 2, the average consumption in Spain was 144 L per capita per day. The highest average consumptions were in Cantabria, Castile and Leon and Extremadura, while the lowest average consumptions were in homes from Balearic Islands, La Rioja and Basque Country.
Table 2.
Water consumption by autonomous community, reprinted with permission from [
15]. Copyright 2010.
Table 2.
Water consumption by autonomous community, reprinted with permission from [15]. Copyright 2010.
| Autonomous Community | L/p/d | Surface (km2) | Population |
|---|
| Andalusia | 143 | 87,599 | 8,393,159 |
| Aragon | 144 | 47,720 | 1,338,308 |
| Asturias | 159 | 10,604 | 1,067,802 |
| Balearic Islands | 121 | 4,992 | 1,110,115 |
| Canary Islands | 149 | 7,447 | 2,105,232 |
| Cantabria | 173 | 5,321 | 590,037 |
| Castile and Leon | 167 | 94,224 | 2,518,528 |
| Castile la Mancha | 152 | 79,461 | 2,094,391 |
| Catalonia | 133 | 32,113 | 7,480,921 |
| Valencia | 157 | 23,255 | 4,987,017 |
| Estremadura | 160 | 41,634 | 1,100,968 |
| Galicia | 132 | 29,575 | 2,761,970 |
| Community of Madrid | 140 | 8,028 | 6,414,709 |
| Murcia | 158 | 11,391 | 1,461,987 |
| Navarre | 128 | 10,391 | 638,949 |
| Basque Country | 122 | 7,234 | 2,177,006 |
| Rioja | 122 | 5,045 | 318,639 |
The previous survey provides useful data about the reference level of the water consumption on the autonomous communities, even if it does not provide the details of the provinces.
3.2. Water Consumption per Month
Another research study carried out in the town of Benidorm, Spain [
16], has examined the variation of consumers throughout the year.
Table 3 shows the mean daily consumption for the month of maximum/minimum consumption, considering 3.5 persons per household.
Table 3.
Mean daily consumption for the month of maximum/minimum consumption for different types of housing, reprinted with permission from [
16]. Copyright 2009.
Table 3.
Mean daily consumption for the month of maximum/minimum consumption for different types of housing, reprinted with permission from [16]. Copyright 2009.
| Housing type | Mean daily consumption for the month of maximum consumption (L) | Mean daily consumption for the month of minimum consumption (L) |
|---|
| Apartment | 437 | 404 |
| Single House | 526 | 398 |
This information does not present considerable variation between the maximum and the minimum value in the case of apartment housing. Consequently, the model considers constant the value of water consumption in households without a garden or pool.
3.3. Water Use Distribution
To complete the model, it was considered appropriate to give information about the distribution of consumption. In this aspect, the research done by the Water Technology Institute of the Polytechnic University of Valencia [
17] gives the following information.
The selected sample was compounded by 64 no-garden building apartments, located in four different villages on the east coast of Spain, and the measurements were performed during 807 days.
The final water use distribution obtained in this study is the following: faucets (38.6%), toilets (22.2%), showers (19.9%), clothes washers (9.7%), leaks (8.9%) and, finally, dishwashers (0.6%). The average water consumption considered per property and day was 334.1 L.
The research of Barcelona and Valencia was analyzed to establish the distribution of water, but both research studies show different values in each device. Hence, the model cannot show this kind of the information; it would not be realistic, and it could confuse the users.
3.4. Survey
After analyzing previous studies, it was considered appropriate to check the previous values and to obtain more data from housing. To validate these data, it was decided to do this through an online survey of consumption by the University of Alcala.
The survey collected data provided by different users, to ensure the best performance of the model. The houses are mostly of the Community of Madrid (Alcalá de Henares, in particular).
Table 4 shows the estimated water consumption from INE data and real data obtained from the survey for houses located in the Community of Madrid.
As it may be appreciated in
Table 4, the average error produced by these data is only 4.64%. Consequently, the model estimates the daily consumption with the data of the survey from INE, because it matches with reality.
Table 4.
Checking the survey data.
Table 4.
Checking the survey data.
| INE-Madrid | Survey | Deviation |
|---|
| 140 | 115.07 | 17.8% |
| 140 | 169.35 | 20.9% |
| 140 | 170.83 | 22% |
| 140 | 132.33 | 5.4% |
| 140 | 188.89 | 34.9% |
| 140 | 98.63 | 29.5% |
| 140 | 105.21 | 24.8% |
| 140 | 87.67 | 37.3% |
| 140 | 133.49 | 4.6% |
3.5. Model
To assess whether water consumption is efficient or not, it is necessary to establish different levels. In order to set the margins of classification by the use of this resource, the Code for Sustainable Homes (CSH) has been referenced [
18].
On the other hand, the previous model needs to have two more levels, to avoid users introducing incorrect data.
The maximum value was established as 200 L per capita per day, because the maximum value received in the survey was 188.89, and the minimum value was established as 50 L per capita per day to ensure that the users live in the house; this value was obtained from the research by Gleick [
19].
Once the range was established, when the water usage is less than 90 L per capita per day, it was considered to be efficient consumption.
Table 5 shows two examples of water consumption.
Table 5.
Comparison of the water consumption per person for typical and efficient behavior.
Table 5.
Comparison of the water consumption per person for typical and efficient behavior.
| Appliance/fitting | Typical Consumption | Efficiency Consumption |
|---|
| Specification | Contribution to daily use | Specification | Contribution to daily use |
|---|
| Toilet | 8 L single flush | 26 | 5 L single flush | 17 |
| Washbasin taps | 6 L/min | 12 | 4 L/min | 8 |
| Shower | 15 L/min | 75 | 10 L/min | 50 |
| Sink taps | 8 L/min | 16 | 6 L/min | 12 |
| Washing Machine | 49 | 12 | 40 | 10 |
| Dishwasher | 13 | 3 | 10 | 2 |
| Water re-use system | – | 0 | reusing water in the toilet | −17 |
| TOTAL | – | 144 | – | 82 |
Table 6 shows the water label as a function of the water consumption (Liters per person per day).
Table 6.
Water label as a function of the water consumption per person per day.
Table 6.
Water label as a function of the water consumption per person per day.
| Water Label | Water Level | Consumption (Liters per person per day) |
|---|
![Water 06 00181 i001]() | Level 1 | Consumption ≤ 90 |
| Level 2 | 90 < Consumption ≤ 110 |
| Level 3 | 110 < Consumption ≤ 130 |
| Level 4 | 130 < Consumption ≤ 150 |
| Level 5 | 150 < Consumption ≤ 170 |
| Level 6 | Consumption > 170 |
3.6. Recommendations
Another aim of this application is that users reduce their water consumption by means of tips (little advice).
To achieve this, the next step in this research was to find the main elements that influence water consumption in order to give some recommendations.
According to Lilli Linkola [
20], there are three main levels of influence on the water consumption of a building.
The first level is situated in the core elements of the domestic water system, water related technologies and activities inside the building, like occupants’ behavior, appliances or technological infrastructure.
In the second level, the building type defines the frame, the building itself, as well as its equipment and its use. In this research, the kind of building is a residential building. This level has been analyzed previously when the model was built.
The third level includes the context of the use of the water, like water policies or legislation.
Although the previous research split up the structure of domestic water uses into three different levels, the recommendations are only focused on the first level (indoor), because it is impossible to act on the third level.
After users know their water label, System to Evaluate the Water Consumption at Home (SEWAT) will show some recommendations divided into four sections. In this way, the users will be capable of reducing their water consumption.
3.6.1. Bathroom
The advice in this section is related to the water consumption inside the bathroom. The
Table 7 shows the recommendations to reduce the consumption.
3.6.2. Kitchen
The advice in this section is related to the water utilization inside the kitchen. The
Table 8 shows the recommendations.
Table 7.
Recommendations to decrease the water consumption inside the bathroom.
Table 7.
Recommendations to decrease the water consumption inside the bathroom.
| Where can we act | Recommendations |
|---|
| Shower | It is always better to shower than bathe. If the shower takes 5 min, it requires 100 L with a normal showerhead, but if it has a retrofit device, the water consumption will be only 50 L. These values are always less than the water consumption of a bath (250 L).
The showerhead may be replaced to a retrofit device that reduces the initial consumption of 20 to 10 L/min. For instance, for a 5 min shower, the water savings could change from 100 to 50 L. |
| Tap | Turn off the tap while you are shaving or brushing teeth, and so on. You do not let the water run, and use it only when you really need it. For example, you can use a glass when you brush your teeth, and if you shave, you have enough water in the sink, and so on [21].This can save up to 6 L of water per minute [22]. |
| Toilet | Do not to use the toilet as a wastebasket. On each use, the toilet uses 9–10 L of water uselessly (the tank capacity of a toilet); you may use a bin.
The toilet can save water by incorporating a discharge interrupt system, enabling the user to choose between two different volumes of discharge water: 6–9 L when the button is pressed once or 3–4 L when the button is pressed again. Some new toilets have these devices. Its efficiency is linked to the knowledge and use of this measure by the users. |
| Vacuum Toilets | Vacuum toilets remove waste from the toilet bowl using a vacuum pump. The waste is macerated and either discharged to the sewer or transported to a holding tank or treatment system. The average amount of water used is between one and 1.5 L per flush [23]. |
Table 8.
Recommendations to decrease the water consumption inside the kitchen.
Table 8.
Recommendations to decrease the water consumption inside the kitchen.
| Where can we act | Recommendations |
|---|
| Fridge | Do no defrost food under running water when defrosting food. To avoid placing them under running water, you may take out the food the night before and put it into the fridge. |
| Dishwasher | Fill up the dishwasher before using, and use a middle-sized load only when it is an emergency.
If the dishes are washed by hand, do not do it with the water running. Use a stack to wash and another to rinse. If you have two sinks, use a bowl [21]. |
| Washing Machines | Front-loading washing machines are often viewed as being more water efficient, due to the fact they spin on a horizontal axis and, subsequently, require less water for a load of washing. These machines, however, generally take twice the amount of time for a single washing cycle than a top loader. New and more efficient top loaders on the market employ a variety of sensors and cycles that minimize water usage for the amount of washing loaded into the machine [24].
Use the washing machine at full load whenever possible [25]. |
| Sink Tap | A dripping tap can waste up to 15 L of water a day or almost 5500 L per year. Replace worn washers for a quick and cheap way to save water [22].
Wash vegetables and fruit in a bowl rather than under a running tap. The water collected might even be used for watering potted plants [22]. |
3.6.3. Purchase of a New Appliance
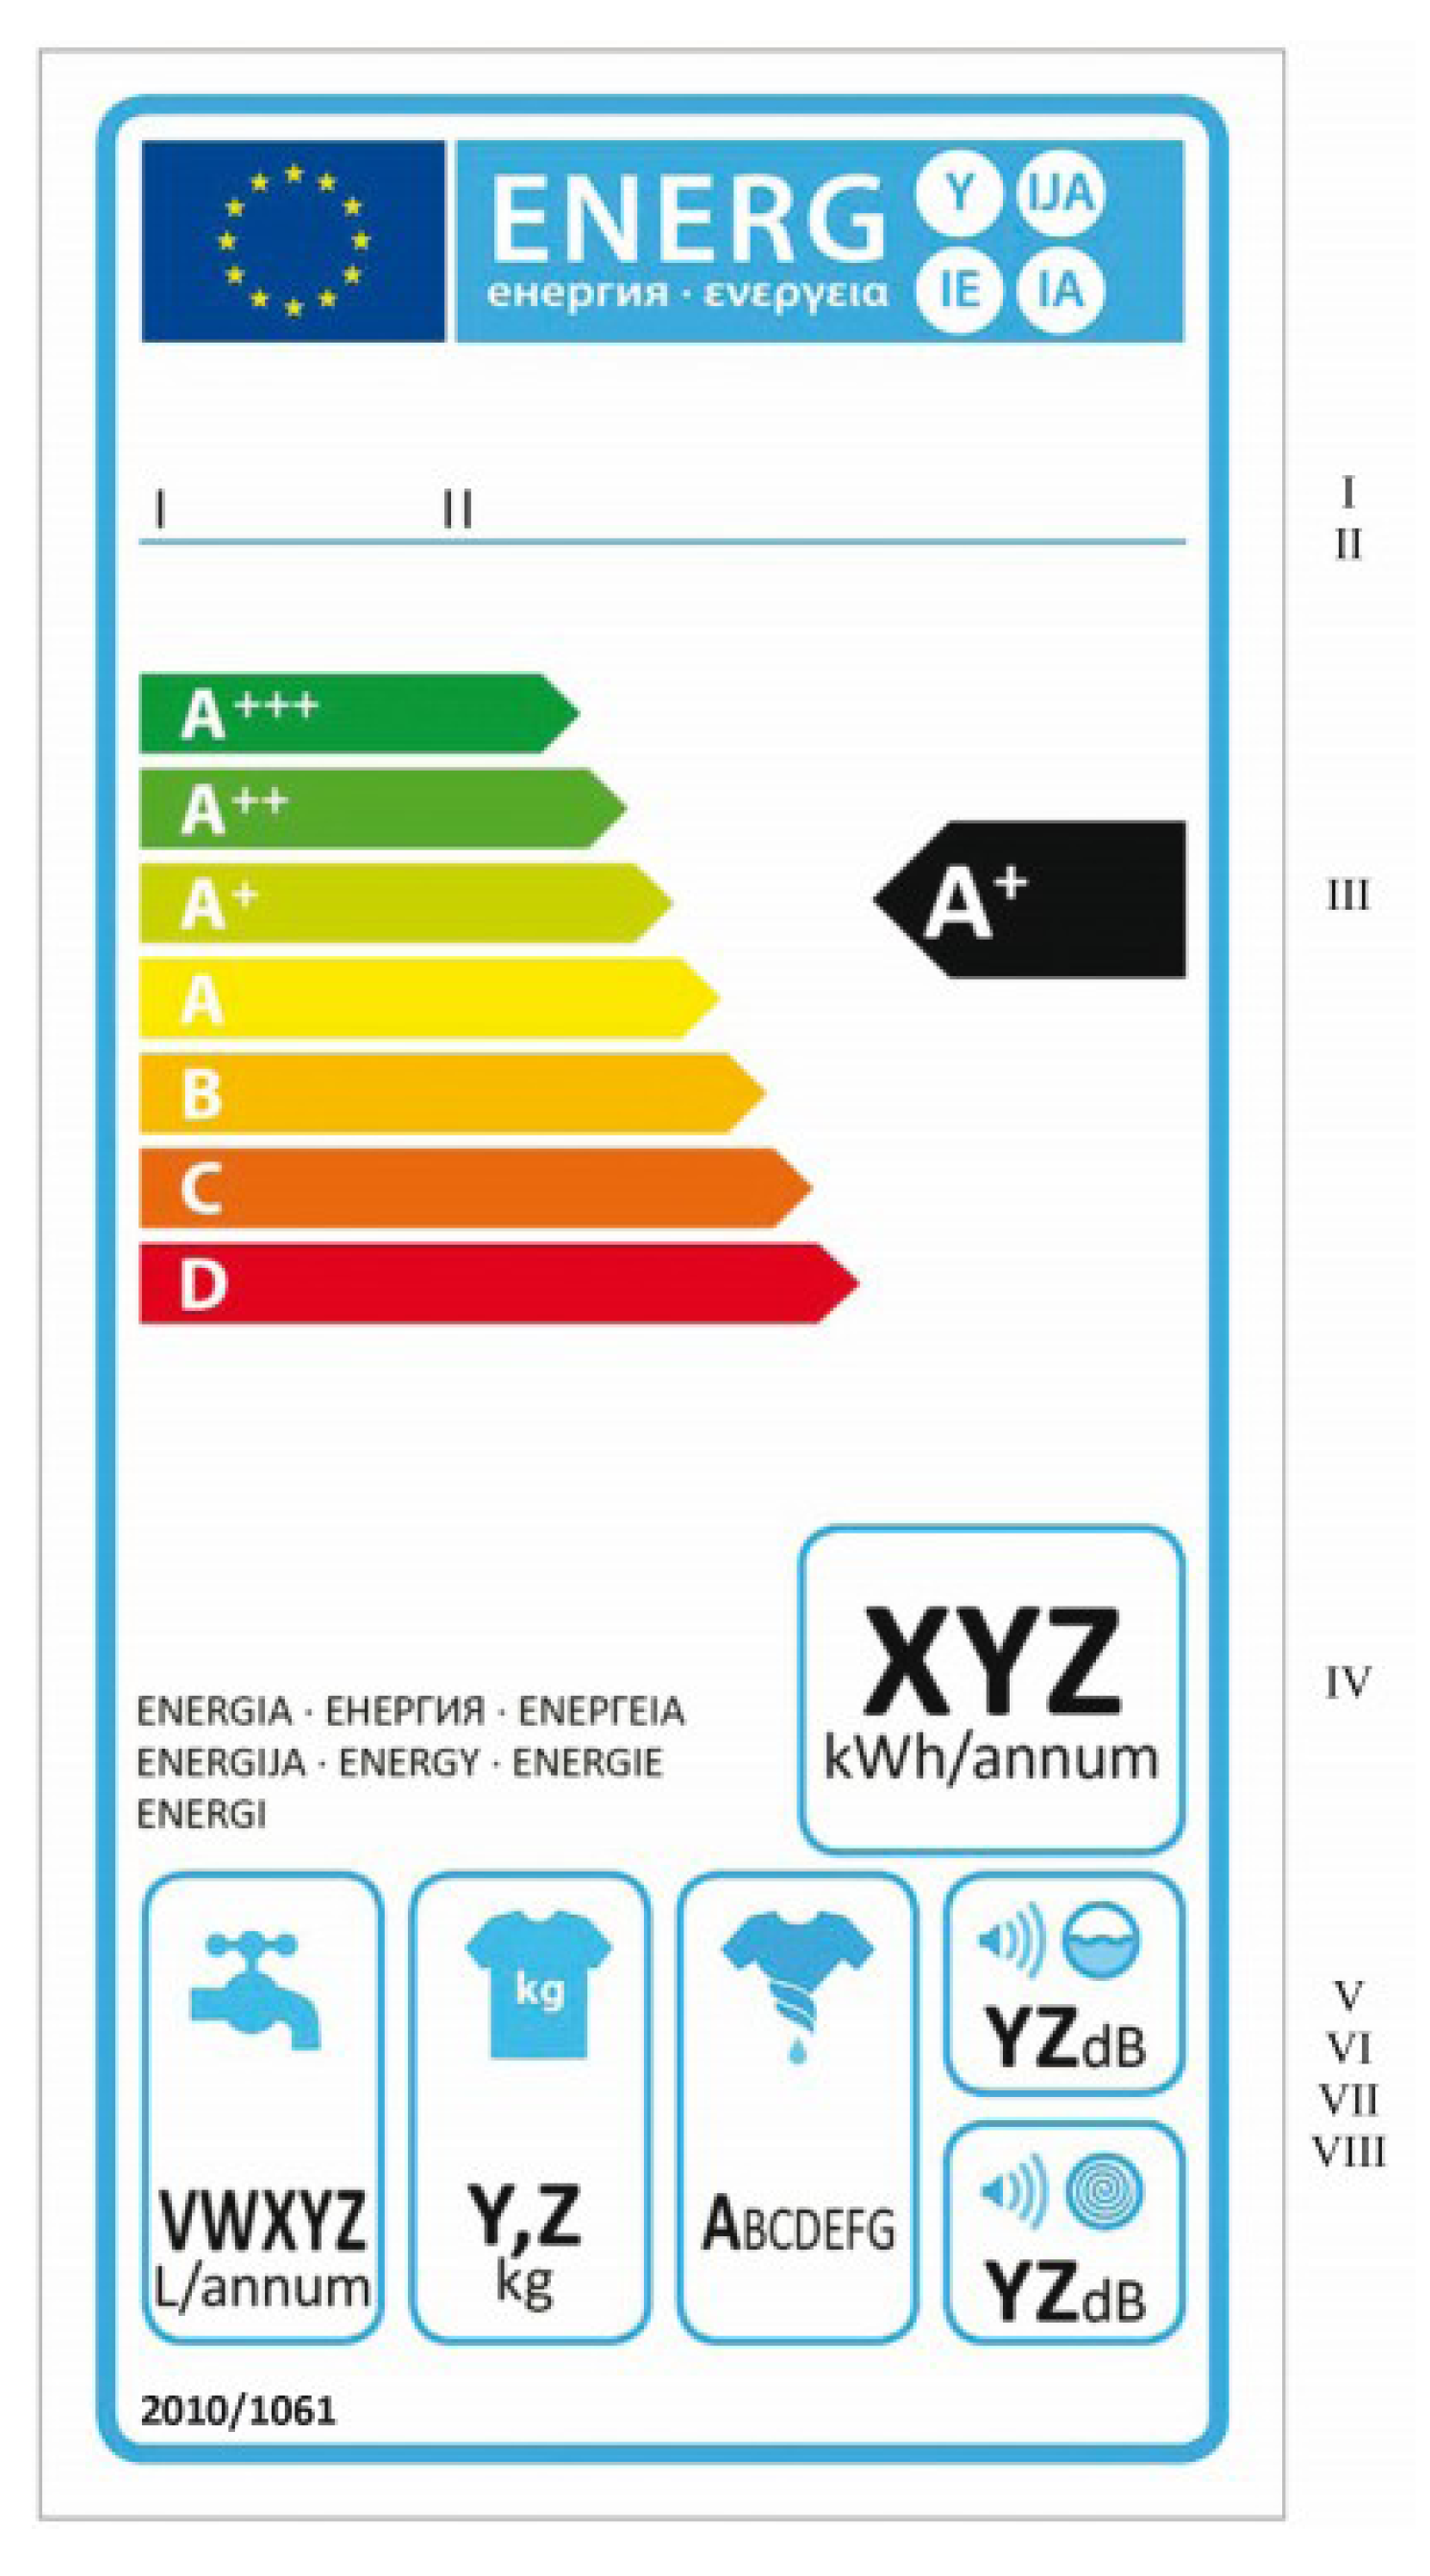
When the users buy a new appliance, they do not appreciate all the information about the energy label. They only want to know the qualification of the energy label. The more typical appliances in housing that affect water consumption are washing machines and dishwashers. Both appliances use the same format for the energy label.
The format of the energy label is split into eight sections, where section number five depicts the weight of annual water consumption in liters per year.
The energy label was obtained from the Commission Delegated Regulation 1061/2010 [
26]. The
Figure 3 shows the energy label for washing machines and dishwashers, where the eight sections can be seen:
Figure 3.
Energy label uses in washing machines and dishwashers, reprinted with permission from [
26]. Copyright 2010.
Figure 3.
Energy label uses in washing machines and dishwashers, reprinted with permission from [
26]. Copyright 2010.
For that reason, it is necessary for users to take into account all the information, not only the information about the electricity consumption.
3.6.4. Reusing Water
Although the recommendation is shown at this point, it will not reduce the water consumption in existing residential buildings immediately, because the consumer must modify the installation; but, it could help to increase the awareness of citizens about this new system. Therefore, this recommendation was considered appropriate for improving the knowledge of the users about this.
Royal Decree 1620/2007 [
27] allows the reuse of water only in the toilet or in the garden, because it is forbidden to use it for human consumption. However, the water savings are significant. The Royal Decree does not contain information about the installations; it only describes the requirements of the water quality.
If the users consider installing this kind of system, SEWAT shows that the water savings are estimated to be 50 L per person per day [
28].
4. Results
SEWAT consists a unique application in Spain, which evaluates, compares and gives some recommendations with the purpose of decreasing the water consumption in Spanish houses by the users.
4.1. Comparison with Other Applications
SEWAT is designed as an application in which users can evaluate their water consumption in order to know if they perform efficient use of water or if they need to improve their behavior. To be sure of the potential of this new tool, we have made a comparison of similar tools in order to know their strengths and weakness to improve our model.
The first facet evaluated is the accessibility of the tools. We focused on developing an application that can be used by most citizens. In fact, if we take into consideration the advances in technology, we must develop a tool that can be used on any device (computers, tablets or smartphones), adapting itself to the device needs. As can be seen in
Table 9, not all the tools provide an opportunity to run on different devices.
Table 9.
Accessibility of the different water tools. SIMDEUM, simulation of water demand and end-use model.
Table 9.
Accessibility of the different water tools. SIMDEUM, simulation of water demand and end-use model.
| Program | PC | Mobile |
|---|
| NABERS | X | X |
| WaterSense | X | X |
| WiseWater | X | – |
| DSS Model | X | – |
| SIMDEUM | X | – |
The last feature analyzed is the purpose of the tool. Each tool is divided into three different aspects: the evaluation of the consumption, the advice for improving behavior and the comparison with the average of the data received from other users of the same province.
As may be seen in
Table 10, some of the previous tools make an evaluation and give to the user some pieces of advice in order to reduce their consumption, but none of them show a real comparison between the users. For that reason, we think that SEWAT must provide that information to give the user the chance to have a reference level of water consumption in his province. That kind of comparison between users makes them increase their efforts on reducing the consumption by around 5%–15% [
29].
To make sure that the application runs on most devices, this has been developed as a website that any device with an Internet connection may access. Thanks to the specifications of CSS3, the appearance of the application shall conform to the requirements of each device’s screen.
Table 10.
The focus of the different water tools.
Table 10.
The focus of the different water tools.
| Program | Evaluation | Advice | Comparison |
|---|
| NABERS | X | X | – |
| WaterSense | X | X | – |
| WiseWater | – | X | – |
| DSS Model | X | – | – |
| SIMDEUM | X | X | – |
4.2. SEWAT
To provide an easy way to evaluate our water consumption, the developed application will ask the user about the number of tenants, the province and the water bills of the different months in order to know the real consumption of the house. With this information, the program will give us the rank of our consumption and a real comparison with the average consumption of the persons in the same province. To be sure that the value of the comparison is certain, it must be updated, thanks to the consumption value given by the users. The
Figure 4 shows a example running on SEWAT.
Figure 4.
SEWAT (System to Evaluate the Water Consumption at Home) interface.
Figure 4.
SEWAT (System to Evaluate the Water Consumption at Home) interface.
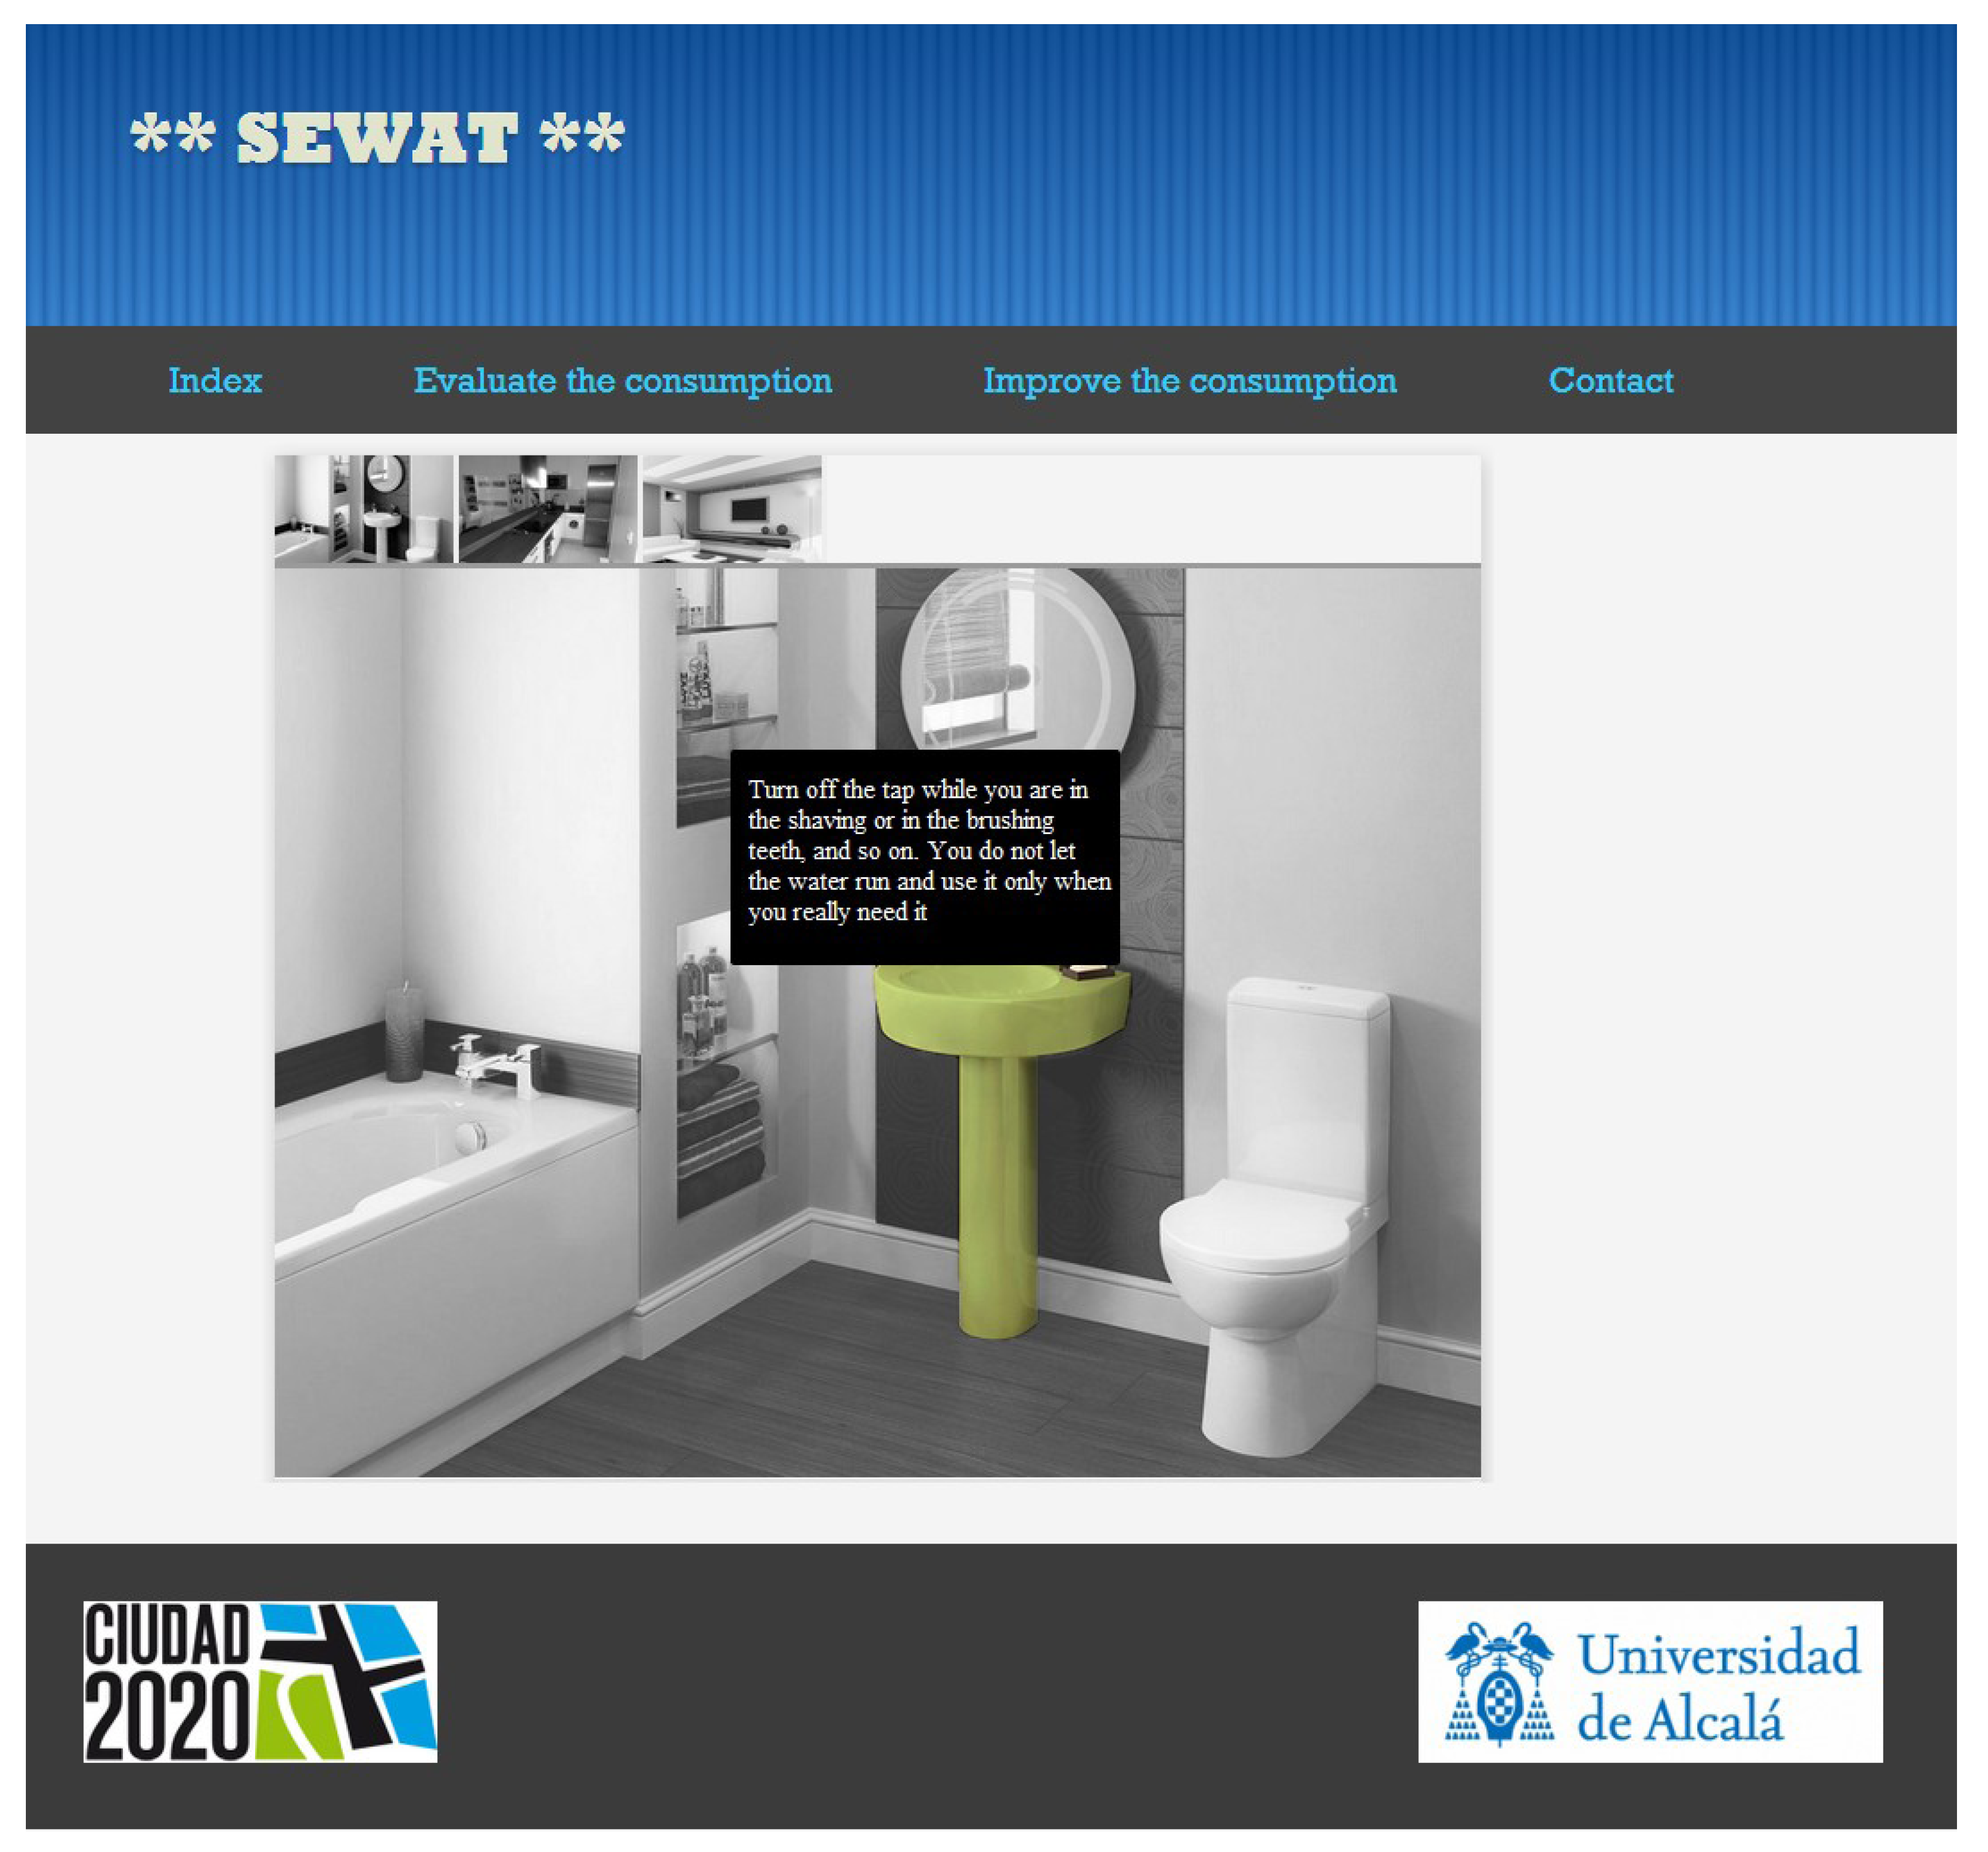
Once the users know their water label and if they are more or less efficient than their neighbors, SEWAT is going to offer some tips to enhance their consumption.
The interface of recommendations shows different rooms, like the bathroom or kitchen, where one can select the appliance or device to reduce the water consumption and find tips.
Figure 5 shows the interface for giving the advice.
Figure 5.
Recommendation interface.
Figure 5.
Recommendation interface.
5. Conclusions
Nowadays, most countries are taking initiatives to increase energy efficiency in buildings. A good example is the great number of tools able to evaluate energy efficiency. However, this is overlooking the consumption of a resource as precious as water. For this reason, SEWAT has the purpose of improving the use of this resource.
The main benefit is the contribution of an efficient water consumption evaluation model that provides a water label and gives some recommendations to reduce water consumption.
As proof for that is the research carried out in the Balearic Islands [
30], where a house was analyzed in August, 2004. Before the study was applied, the water consumption was 110 L per capita per day, and after of this study, when some solutions were adopted, the consumption decreased to 80 L per capita per day.
In other words, if the user had used the application in the first place, the water label would have been one drop instead of two drops before using the recommendations.
This was achieved by the installation of flow-reducers on faucets, double-discharge devices on lavatories, the installation of water use-efficient household appliances and the design and installation of a grey water reuse system.

 ,
, 


