Complexity in Animal Communication: Estimating the Size of N-Gram Structures

Abstract
: In this paper, new techniques that allow conditional entropy to estimate the combinatorics of symbols are applied to animal communication studies to estimate the communication’s repertoire size. By using the conditional entropy estimates at multiple orders, the paper estimates the total repertoire sizes for animal communication across bottlenose dolphins, humpback whales and several species of birds for an N-gram length of one to three. In addition to discussing the impact of this method on studies of animal communication complexity, the reliability of these estimates is compared to other methods through simulation. While entropy does undercount the total repertoire size due to rare N-grams, it gives a more accurate picture of the most frequently used repertoire than just repertoire size alone.1. Introduction
The complexity of animal communication is a topic frequently discussed, but difficult to resolve. While it is beyond dispute that many species communicate, even the basic purposes of these communications, whether to communicate information or to just influence the behavior of others to increase their own fitness, is hotly debated [1–5]. Even if we conclude that information is being communicated, does the faculty for language, the human ability to communicate complex information through spoken language, have wide and directly comparable analogs across the animal kingdom [6], or is the faculty for language and expressing abstract ideas uniquely human [7]?
The complexity of animal language has been studied using many methods, including various techniques to estimate repertoire size, such as curve-fitting [8,9] and capture-recapture [9–12]. Other methods use information theory either by measurements of conditional entropy [13,14] or using other methods, such as entropy rate and Lempel-Ziv complexity [15]. In this paper, we will focus on the methods using conditional entropy. Measuring animal communication in terms of the entropy in bits, these studies have attempted to look at the animal communication structure at various lengths (N-grams) in order to determine the structure of the communications, whether the tools of information theory can lend themselves to a better understanding of animal behavior and, possibly, what types of information can be communicated.
2. Information Theory and Animal Communication
After formulating information theory in 1948, Shannon was not long in turning its powers to shedding light on human language [16]. Shannon investigated the entropy of the English language using both frequency counts of letters from texts, as well as human volunteers, who played a guessing game of missing letters to establish the bounds of the estimated entropy. This analysis of language mainly focused on the measure of what is now widely known as the conditional entropy. The conditional entropy of order N is defined with the probability of a given letter (j) coming after an N-gram sequence (bi).
Amongst the simplest methods for computing conditional entropies is from joint entropies. The joint entropy, H(N), for a sequence of symbols (xi) of length N is defined as:
The conditional entropy of order N can be alternatively defined as HN = H(N) − H(N − 1), where H(N) and H(N − 1) are the joint entropies of order N and N − 1, respectively.
For the English alphabet of 27 letters (26 letters plus the space character), Shannon calculated the first-order entropy at 4.14 bits, the second-order conditional entropy at 3.56 bits and the third-order conditional entropy at 3.30 bits. The zero-th order entropy of 4.75 bits was based on log2 M, where M = 27. Many other languages have been analyzed in this way across many language families. Data and analysis for a large group of these are given in [17,18].
Soon after human languages, animal communication of varying types were studied using entropy. One of the first citations explicitly analyzing animal communication by means of information theory was that of J.B.S. Haldane and H. Spurway [19], who did a short calculation to estimate the information entropy of bee (Apis Mellifera) dances at 2.54 bits. Many modern treatments of animal communication by information theory can be traced to the work of Chatfield and Lemon on cardinals (Cardinalis cardinalis) [20,21] and Lemon and Dobson on thrushes [13]. In particular, their work on analyzing different orders of entropy to investigate the fundamental order of communication established a baseline on using information theory to estimate the complexity of animal communication.
Further studies along this line include the analysis of the chickadee (Parus atricapillus and P. carolinensis) [22,23], European starlings (Sturnus vulgaris) [24], Rufous-bellied thrushes (Turdus rufiventris) [25], European skylarks (Alauda arvensis L.) [26], wood thrushes (Hylocichla mustelina) and robins (Turdus migratorius) [13], bottlenose dolphins (Tursiops truncatus) [14,27–29], humpback whales (Megaptera novaeangliae)[30–33] and male rock hyraxes (Procavia capensis)[34].
These studies are primarily focused on measuring information through entropy in bits in the first order, and sometimes higher orders, as well. For multiple orders, information graphs, plots of the bits of the conditional entropy by order, are sometimes used [13] to analyze the structure of the communication and estimate the Markov order of the signal. While this provides a quantitative overall measure of complexity, they have a limitation in that they do not provide resolution into how many, or what type, of calls or songs that we should expect in two, three or more combined units. Using the values of entropy, few conclusions can be deduced besides the order at which a signal becomes most repetitive: where its value drops most sharply from one order to the next. To remedy this, we can use information theory with combinatorics, so that the size of the repertoire, at lengths longer than one, can be estimated with only information about the conditional entropy for each order.
2.1. Information Graphs and Order Complexity
An information graph is the plot of the higher order conditional entropies by order. Some of the first uses and analyses of information graphs in the context of Markov sequences are given in [35,36]. Information graphs were first used to analyze the order dependence of Markov sequences, the theory being that when there is a large, negative slope between two orders to a relatively low value of conditional entropy, the prior order is most likely the order of dependence of the Markov sequence to describe the communication. However, [36] showed through simulation that a large decrease between two orders of entropy in an information graph cannot be determined to be the fundamental order if the number of symbols is high or the sample size is low. Since likelihood tests become unreliable at smaller sample sizes with large symbol alphabets, the decrease in the information graph could be indicative of the inadequacy of sample sizes at larger orders rather than the fundamental order of the underlying Markov process.
With these caveats, the information graphs will still be shown as an illustration of the results of the studies on each animal communication and should be used with caution to establish the complexity of sequences.
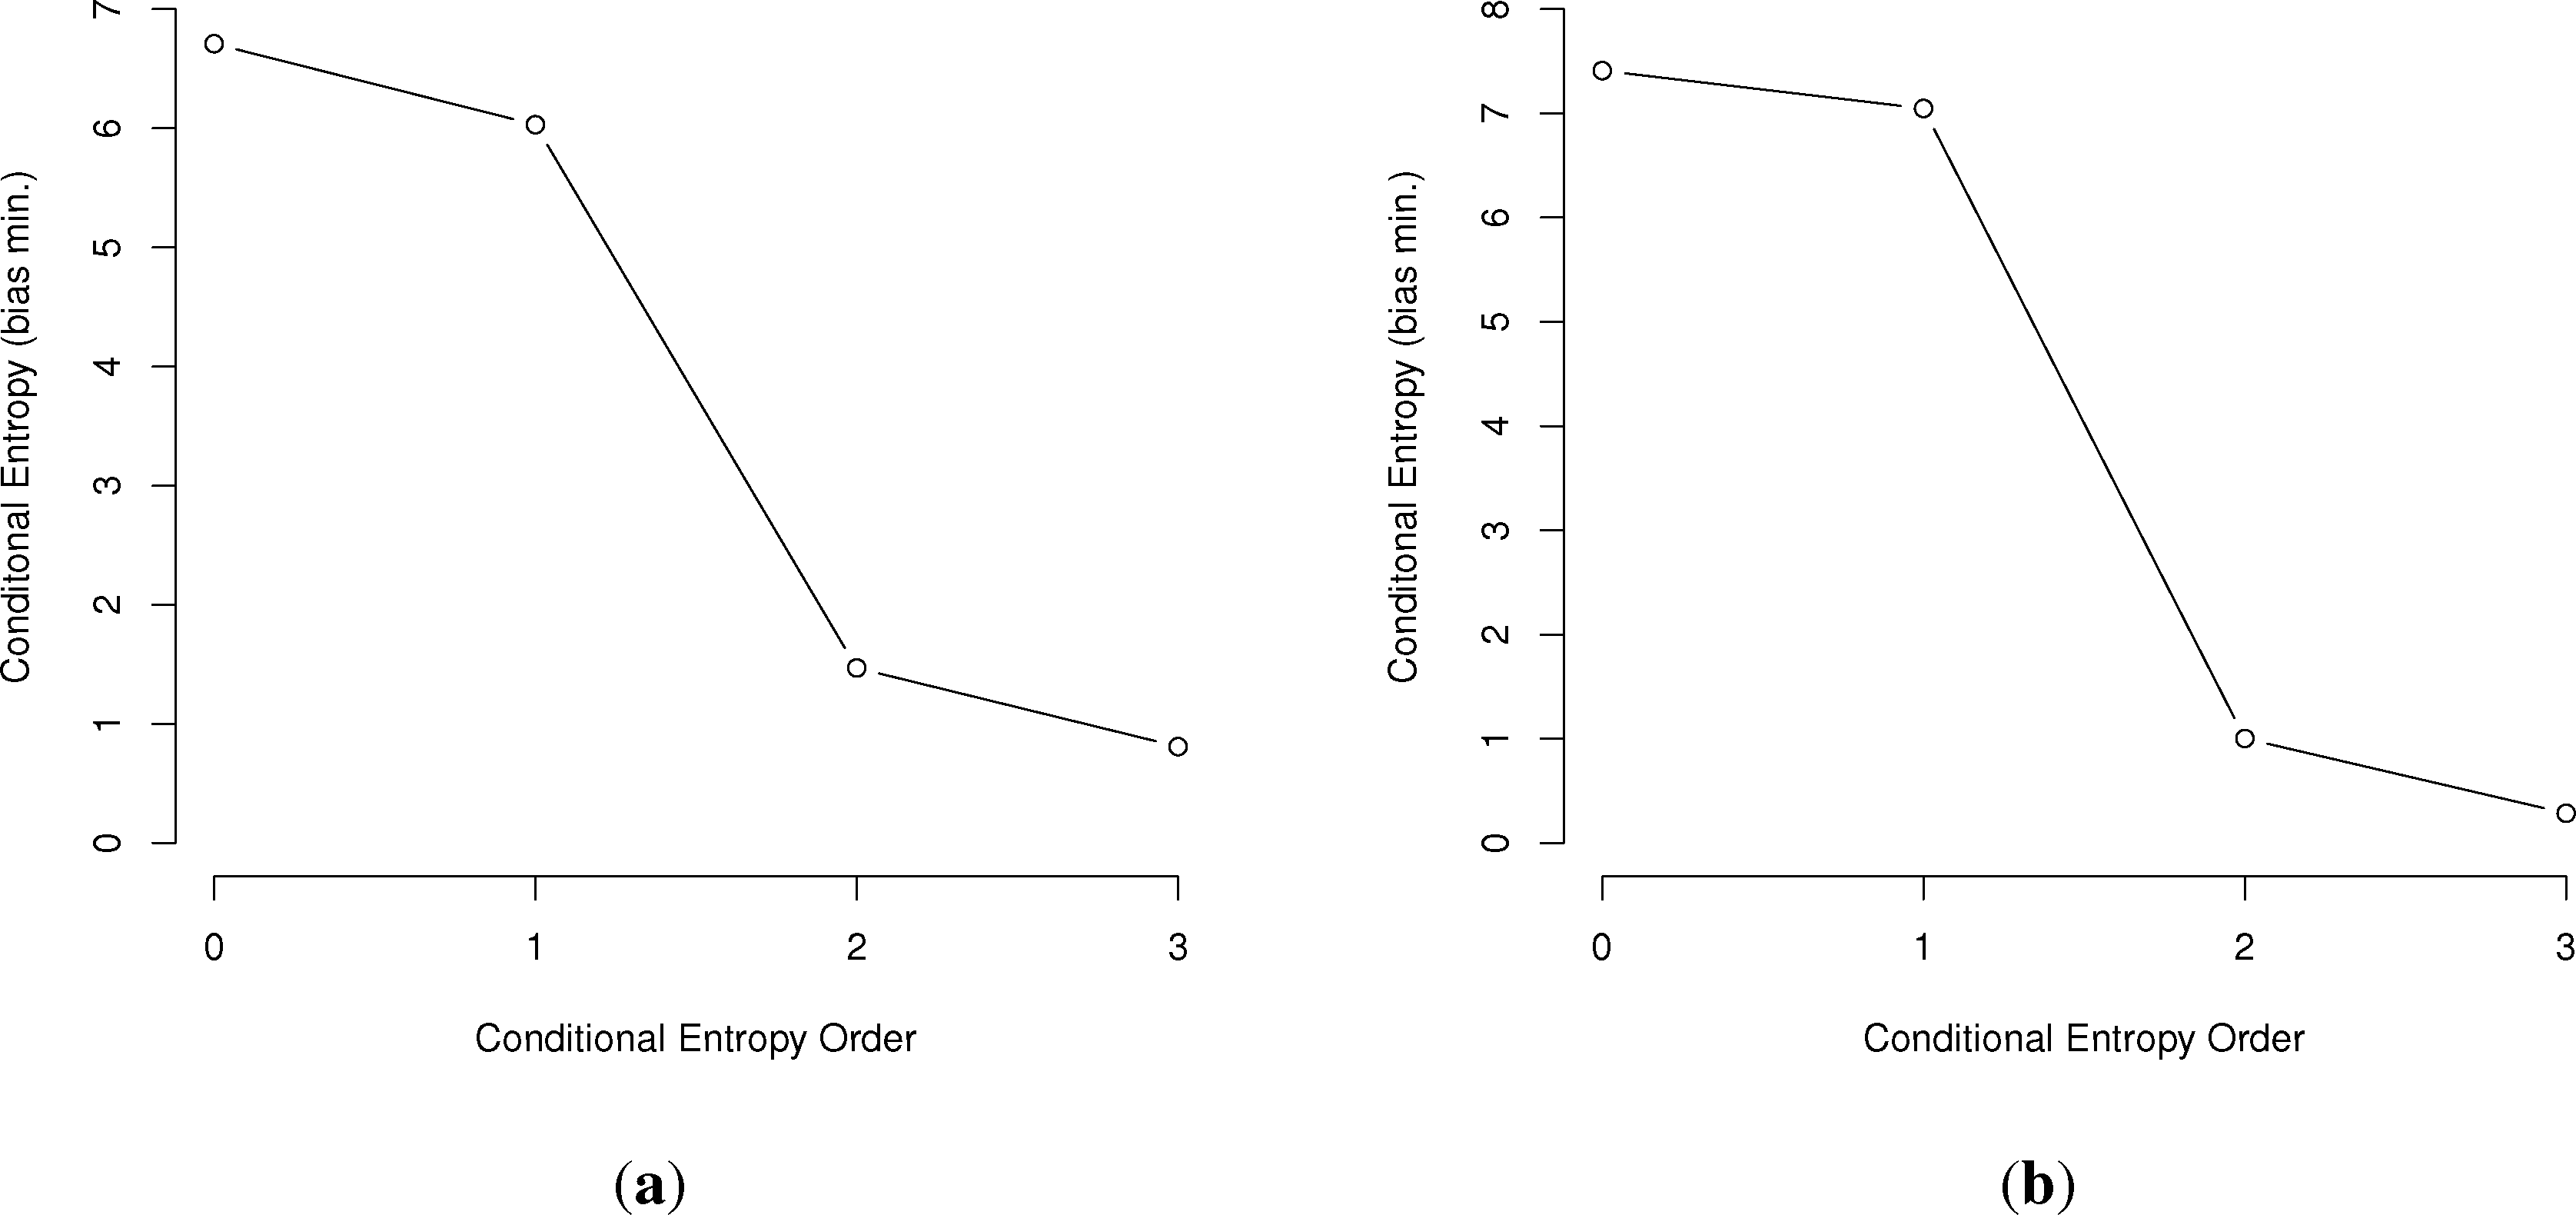
In general, the larger the order of dependence, the more “complex” the communication is deemed. For example, many bird call sequences seem to show first-order dependence, though this is unsure, since a sample size of multiples of the number of symbols squared is needed to confirm this (Figure 1). This is much different than human written language. In a point first made in [22], English written letters show a drop of less than one bit from the first to third-order conditional entropies [16,27], much slower than the drop in the chickadee information graphs and those of other birds.
While information graphs are relatively easy to construct given the right data, there is a large issue of estimating entropy. Namely, entropy estimators can have large biases that depend on the sample size, which typically underestimate the true value of the entropy [37,38].
2.2. Bias Measures in Entropy Estimates
Because of the often large numbers of possible variables, entropy estimators can be very sensitive to sample size and introduce bias into measurements. This was first investigated in [37], where the following expression is the first-order additive term to entropy estimates to correct for bias:
When dealing with actual data, it can be relatively straightforward to estimate M, though with smaller sample sizes, it is questionable if you have captured all non-zero categories. However, when only sample sizes and values for entropies are available, calculating M accurately can be much more difficult. With little information available, we can estimate upper and lower bounds for the entropy bias. This will be described following the section on combinatorics.
3. Combinatorics of Information Theory and Repertoire Size
One of the lesser known, but extremely useful, facets of information theory is the way entropy can be used for combinatorics. In particular, the number of combinations of a symbol set can be more accurately estimated using the first-order entropy than can be done with an assumption of random likelihood. For example, if an alphabet has M symbols, the exact number of possible combinations of length N is the common result:
Equations (7) and (8) improve on the assumptions of Equation (6) by incorporating the fact that every symbol is not equally likely, but appears at a rate consummate with the Shannon entropy of the overall signal. These derivations show that knowledge of the entropy of the signal allows us to reduce the number of combinations and more accurately estimate the number of combinations of length N. However, there is an additional element of error in this analysis.
Since H is the first-order entropy, this Shannon-Weaver model assumes that each symbol has an independent and identically distributed (i.i.d.) probability of appearing in each space in the N-gram. If there is any correlation between symbols, the larger N becomes, the more likely WN is inaccurate. However, in this model, there is no co-dependence between symbols on which symbol is more likely to follow another, and the base assumption is that in any N-length string, the symbols for each position are chosen independent of all other symbols before them.
In order to improve on the estimate of WN for N> 1, we must use the conditional entropy. In a result first demonstrated by Kolmogorov [40], WN can be more accurately estimated by using conditional entropy to account for all possible pairs, without the overlap instances that are found in the Cartesian product (represented by joint entropy) of the alphabet spaces. Note that in his paper, Kolmogorov stated that W2 = 2H(X|Y). However, a factor of two is necessary for the equation to reduce to the base case of Shannon and Weaver if H(X|Y) = H(X).
In the above H(X|Y), also expressed as H2, is the conditional entropy in bits for the digram sequence, XY. Given the inequality H(X) ≥ H(X|Y), Equation (9) reduces to Equation (8) at maximum conditional entropy where co-dependence disappears. Equation (9) was originally used to calculate the number of digrams, but can be extended for N > 2 using higher-order conditional entropies. If we designate conditional entropies of order N as HN, the upper bound estimate of the number of combinations of length L, WL, where N ≤ L is:
Since conditional entropy must monotonically decrease with each higher order, WL is at a minimum where N = L, since HL is smaller than all preceding conditional entropies. This can apply to language in some obvious ways. For example, an estimate of the number of distinct two-letter words in a language can be given by W2 = 22H2. For distinct three-letter words, we can use W3 = 23H3, etc. This approach, along with a new statistical distributional approach, was demonstrated in [18]. Using these parameters, then, it is an intriguing question if we can estimate the size of the repertoire of multiple symbols or sounds in non-human systems of communication.
3.1. Combinatorics and Entropy Bias Estimates
In addition to estimating the size of the repertoire, combinatorics can be used to estimate upper bounds for the entropy bias when details about the dataset are unavailable. This is primarily through estimating M, the number of non-zero categories in Equations (4) and (5). The upper bound for M, given a specific order of entropy, H, can be estimated using the assumptions of Equation (8). The largest possible value for M for an order, N, of entropy H can be given by M = 2NH. Therefore, if the bias of H using the number of symbols is acceptably low, M = 2NH can be used in calculations to find the largest possible bias expected for a given sample size.
In addition, one can estimate a lower bound for M using the combinatorics of conditional entropies. The lower bound for M should be M = 2NHN. With these two values of M, we can determine an appropriate band for the repertoire for any order. The largest problem can occur if H is relatively large with a low order of dependence. This can make the upper bound estimation of bias huge, with the lower bound relatively small. As will be seen later, this can be an issue with birds with a large repertoire of individual calls, but with a relatively low (second-order) dependence in their communication. As a final note, the bias corrections apply only to the first-, second- and third-order joint entropies. These are then subtracted from one another to find the bias-corrected conditional entropies.
In the next section, we will investigate the complexity of several species, including bottlenose dolphins, humpback whales and several species of birds and investigate the size of their N-gram repertoires.
4. Animal Communication: Complexity and Repertoire Size
In this paper, we will use entropy combinatorial techniques to estimate the N-gram repertoires of six species: bottlenose dolphins Tursiops truncatus [14,27–29], humpback whales Megaptera novaeangliae [30–33], European starlings Sturnus vulgaris [24], European skylarks Alauda arvensis L. [26], wood thrushes Hylocichla mustelina and robins Turdus migratorius [25]. A brief summary of the research for each is given below, followed by data from the papers, information graphs and estimated N-gram repertoire sizing.
4.1. Bottlenose Dolphins
In [41–43], McCowan and Reiss introduced a new method to categorize the whistles of bottlenose dolphins, Tursiops truncatus, and organize these into sequences. This research was followed up in a collaboration with Doyle [27], which analyzed these sequences in terms of information theory and Zipf’s Law calculating the conditional entropy up to order three, comparing this with human written language, and calculating a Zipf exponent of nearly −1 for the rank-frequency distribution of dolphin whistle types. This paper will use the data from [27] to investigate the dolphin whistles for N-grams for N in range one to three.
4.2. Humpback Whales
One of the defining features of humpback whales, Megaptera novaeangliae, is their social organization into groups called pods, where they emit various cries, both alone and in sequence, to communicate with other whales. These cries were investigated through the lens of information theory in several papers [30–33]. Suzuki [30] and Miksis-Olds and collaborators [31,32] analyzed the structure of humpback whale mating songs and found both that the sequences of whale cries were not stationary and could not be represented well by a first-order Markov chain model. Doyle and collaborators in [33] investigated the entropy and conditional entropy of humpback whale cries under the conditions of man-made noise and relative quiescence in order to establish how anthropomorphic noise may affect whale cry patterns. They found a significant effect, where whale cries seemed to have a steeper entropic slope, and are, thus, more repetitive, under high noise conditions, possibly to compensate for the more noisy channel. For our analysis, we will use the results from the low noise dataset.
4.3. Wood Thrushes and Robins
Dobson and Lemon [13] investigated the information structure of long call sequences amongst a variety of American thrushes, including wood thrushes Hylocichla mustelina and robins Turdus migratorius. For each bird, they measured multiple sequences and calculated the entropies of the call sequences to create information graphs. Being one of the earliest papers to use this technique on animal communication, it established many methods, such as the use of information graphs. In this paper, we will look at the entropies based on the subjects of the paper, wood thrush 3 and robin 2.
4.4. European Skylarks
In [26], Briefer and collaborators measured the information entropy of European skylarks in both France and Poland to test the hypothesis that habitat change, marked in France, but not Poland, is having a significant effect on the call patterns of Alauda arvensis L.. While songs were more shared amongst different birds in the restricted habitat near Paris, song complexity was almost identical in both locations. For this paper, we use the continuous habitat data from the Poland habitat.
4.5. European Starlings
In [24], Getner and Hulse investigated the ability of European starlings, Sturnus vulgaris, to recognize individuals based on songs. As part of their analysis, they used a success-failure reward to access a food hopper based on correctly distinguishing one starling call amongst a group of five. When they used synthetic call sequences to test recognition, they found that recognition was improved when sequences with second- or third-order Markov dependence (more complex) were used versus first-order dependencies, which randomly emitted sounds with a frequency to match first-order entropy. For this paper, we will use the data from the entropy of song types in starling song bouts represented in an information graph in the paper’s Figure 2. Since the sample size was not explicitly mentioned in the paper, it was estimated by using data from the paper. Namely, assuming a song type (syllable) average length of one second, an average of about 39 s per song bout and 120 song bouts. This gives S = 4680. In addition, since each bout had a standard error of 6 s, we used the 2 * SE 95% confidence interval to add an additional 2 * SE * seconds for a total sample time (and sample size) of 4811.
5. Animal Communication Entropy Data and Repertoire Estimates
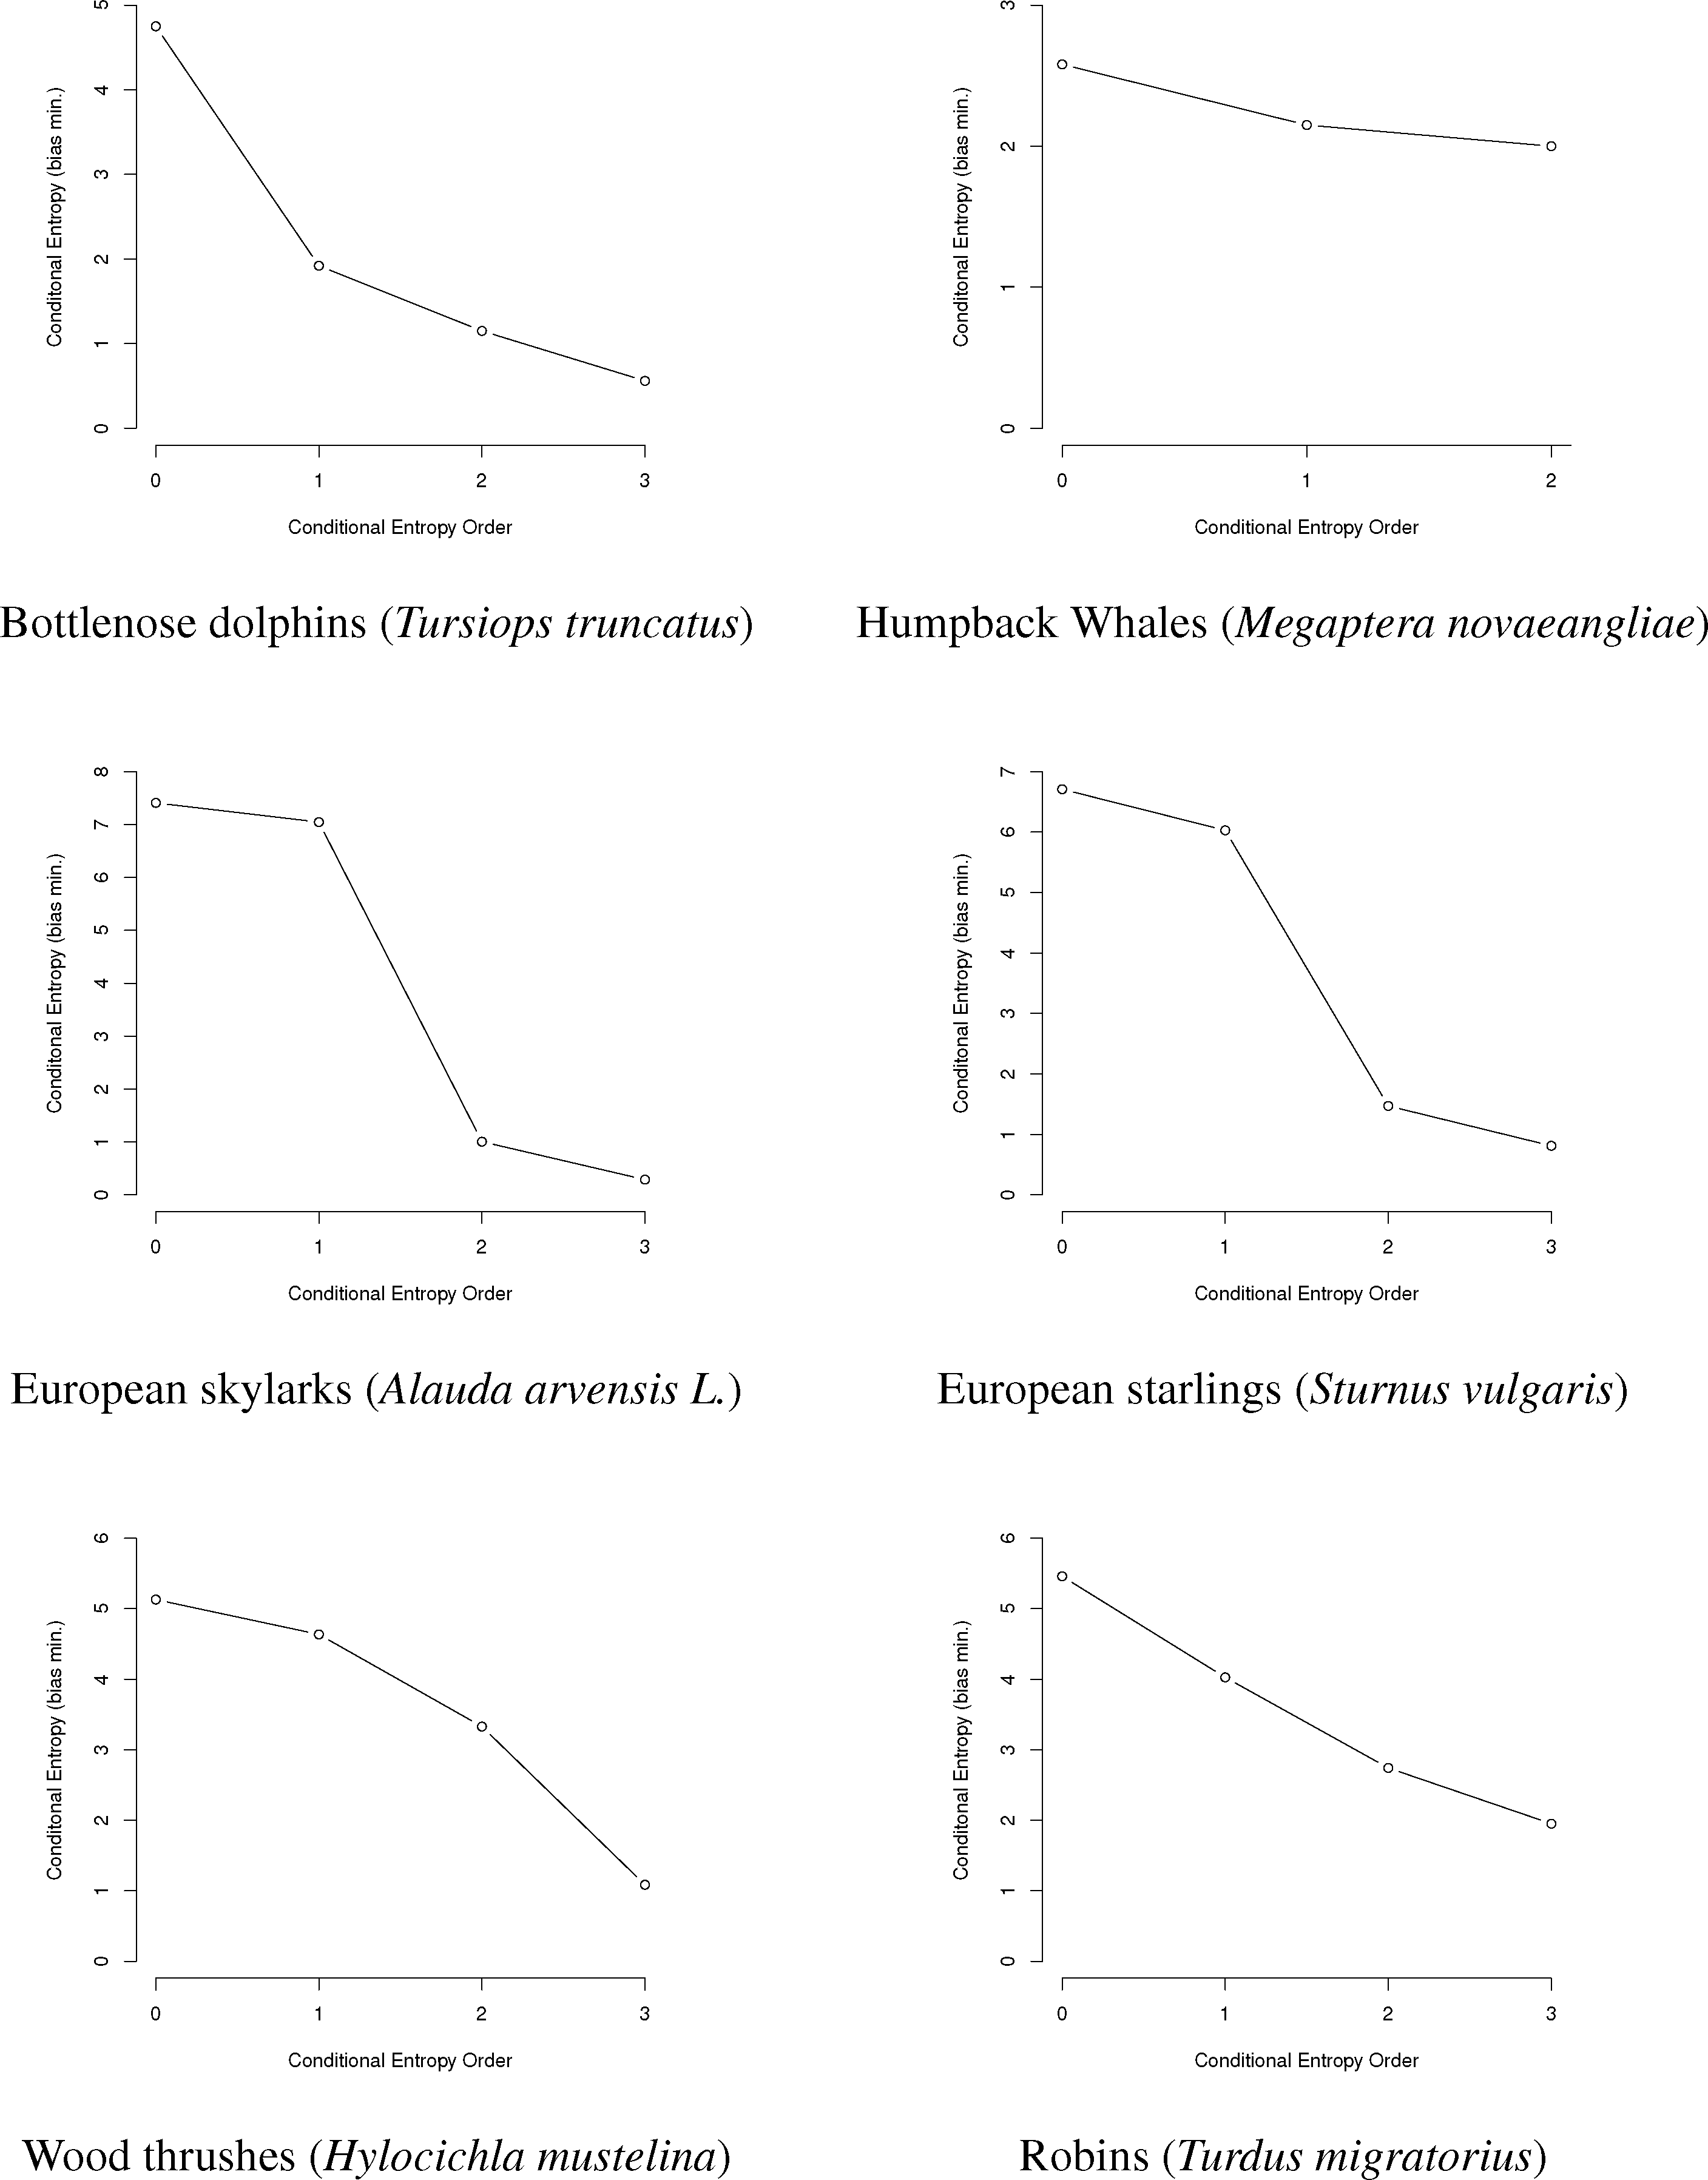
Here, we use the data from these papers to reproduce graphically the information graphs for the communications of each species (Figure 3), as well as to show the conditional entropy for the first three orders, correct the conditional entropy for bias and estimate the minimum and maximum size of the animal N-gram repertoires given the bias-corrected entropy values.
First, we will represent the minimum bias-corrected conditional entropies as information graphs from order 0, log M for the number of individual symbols, to the third order. Only the humpback whale data stops at the second order, due to a lack of data on the third-order entropy.
As can be seen in Figure 3, several species show a dramatic drop after the first or second order of entropy. For a basic comparison, the information graph for written English letters [16,27] shows a much more gradual decline and, thus, less repetition. Once again, it is difficult to make a definite interpretation of the order of the process with sample sizes that are not as large as or are barely larger than M2, especially with the large song type repertoire of birds.
In analyzing the data from the species and estimating repertoires, it is essential to define sample sizes and correct for bias. In Table 1, the basic data from the papers is shown. One key issue to resolve is which sample size to use at each order. Sample sizes for higher order N-grams can be reduced if there are multiple discrete sequences. For example, if there are 500 individual symbols in a dataset, yet these are broken into 25 discrete sequences, the first-order sample size is 500, while the second-order one must be 475, since there is no overlap with the end of one sequence and the beginning of another. This information was not always available, but for dolphins, humpback whales and starlings, this methodology was used to calculate S2 and S3.
In Table 2, the minimum bias and maximum bias for each species are given. For the maximum bias, there were exceptions where the symbol size dictated by H was so large that the bias correction would cause the conditional entropy to exceed the value of the previous order. In this case, the bias was limited to the maximum possible value, that which would make the conditional entropy at this order (usually the third order) equal to that of the second order.
In Tables 3 and 4, the final estimates for the bias-corrected conditional entropies and the derived repertoire sizes are given.
From these tables, especially Table 4, several things seem clear. First, for almost all of the species given, the bulk of their N-gram repertoire lies within the 1-gram individual symbols. The largest exceptions, for both the maximized and minimized bias, seem to be the wood thrush and robins. There could be exceptions, however. For example, in [27], the authors used only those dolphin whistles that occurred at least twice for entropy calculations, giving an M = 27. There were a total of 102 distinct whistles detected, 75 only once, so adding these would give a total repertoire for the dolphins of 112 for the maximum bias and 111 for the minimum bias.
Clearly, we have a more accurate idea of total repertoire with those animals for which the repertoire size differs very little from the maximum or minimum bias assumptions. These are dolphins, humpback whales and European starlings. The other bird species have a large number of song types. This huge symbol size causes a large swing between the estimates for minimum and maximum bias. In these cases, the minimum bias estimate is more representative, since the number of possible N-grams that first-order entropy would imply is enormous with such a large symbol set. In the end, the best way to accurately measure the repertoire sizes, particularly for dolphins and humpback whales, is to make a much larger measurement of sequences with S in the thousands.
6. Other Repertoire Counting Methods and Simulation
As stated in the introduction, apart from the information theory perspective, repertoire size has often been investigated using sampling methods, such as curve-fitting and capture-recapture. These methods can be used if song bout data is available to predict repertoire size, their accuracy increasing with the number of samples. In order to compare the method developed in this paper with actual data and these two methods, a program was created that synthesized an arbitrary signal with a predefined entropy of the first, second and third order.
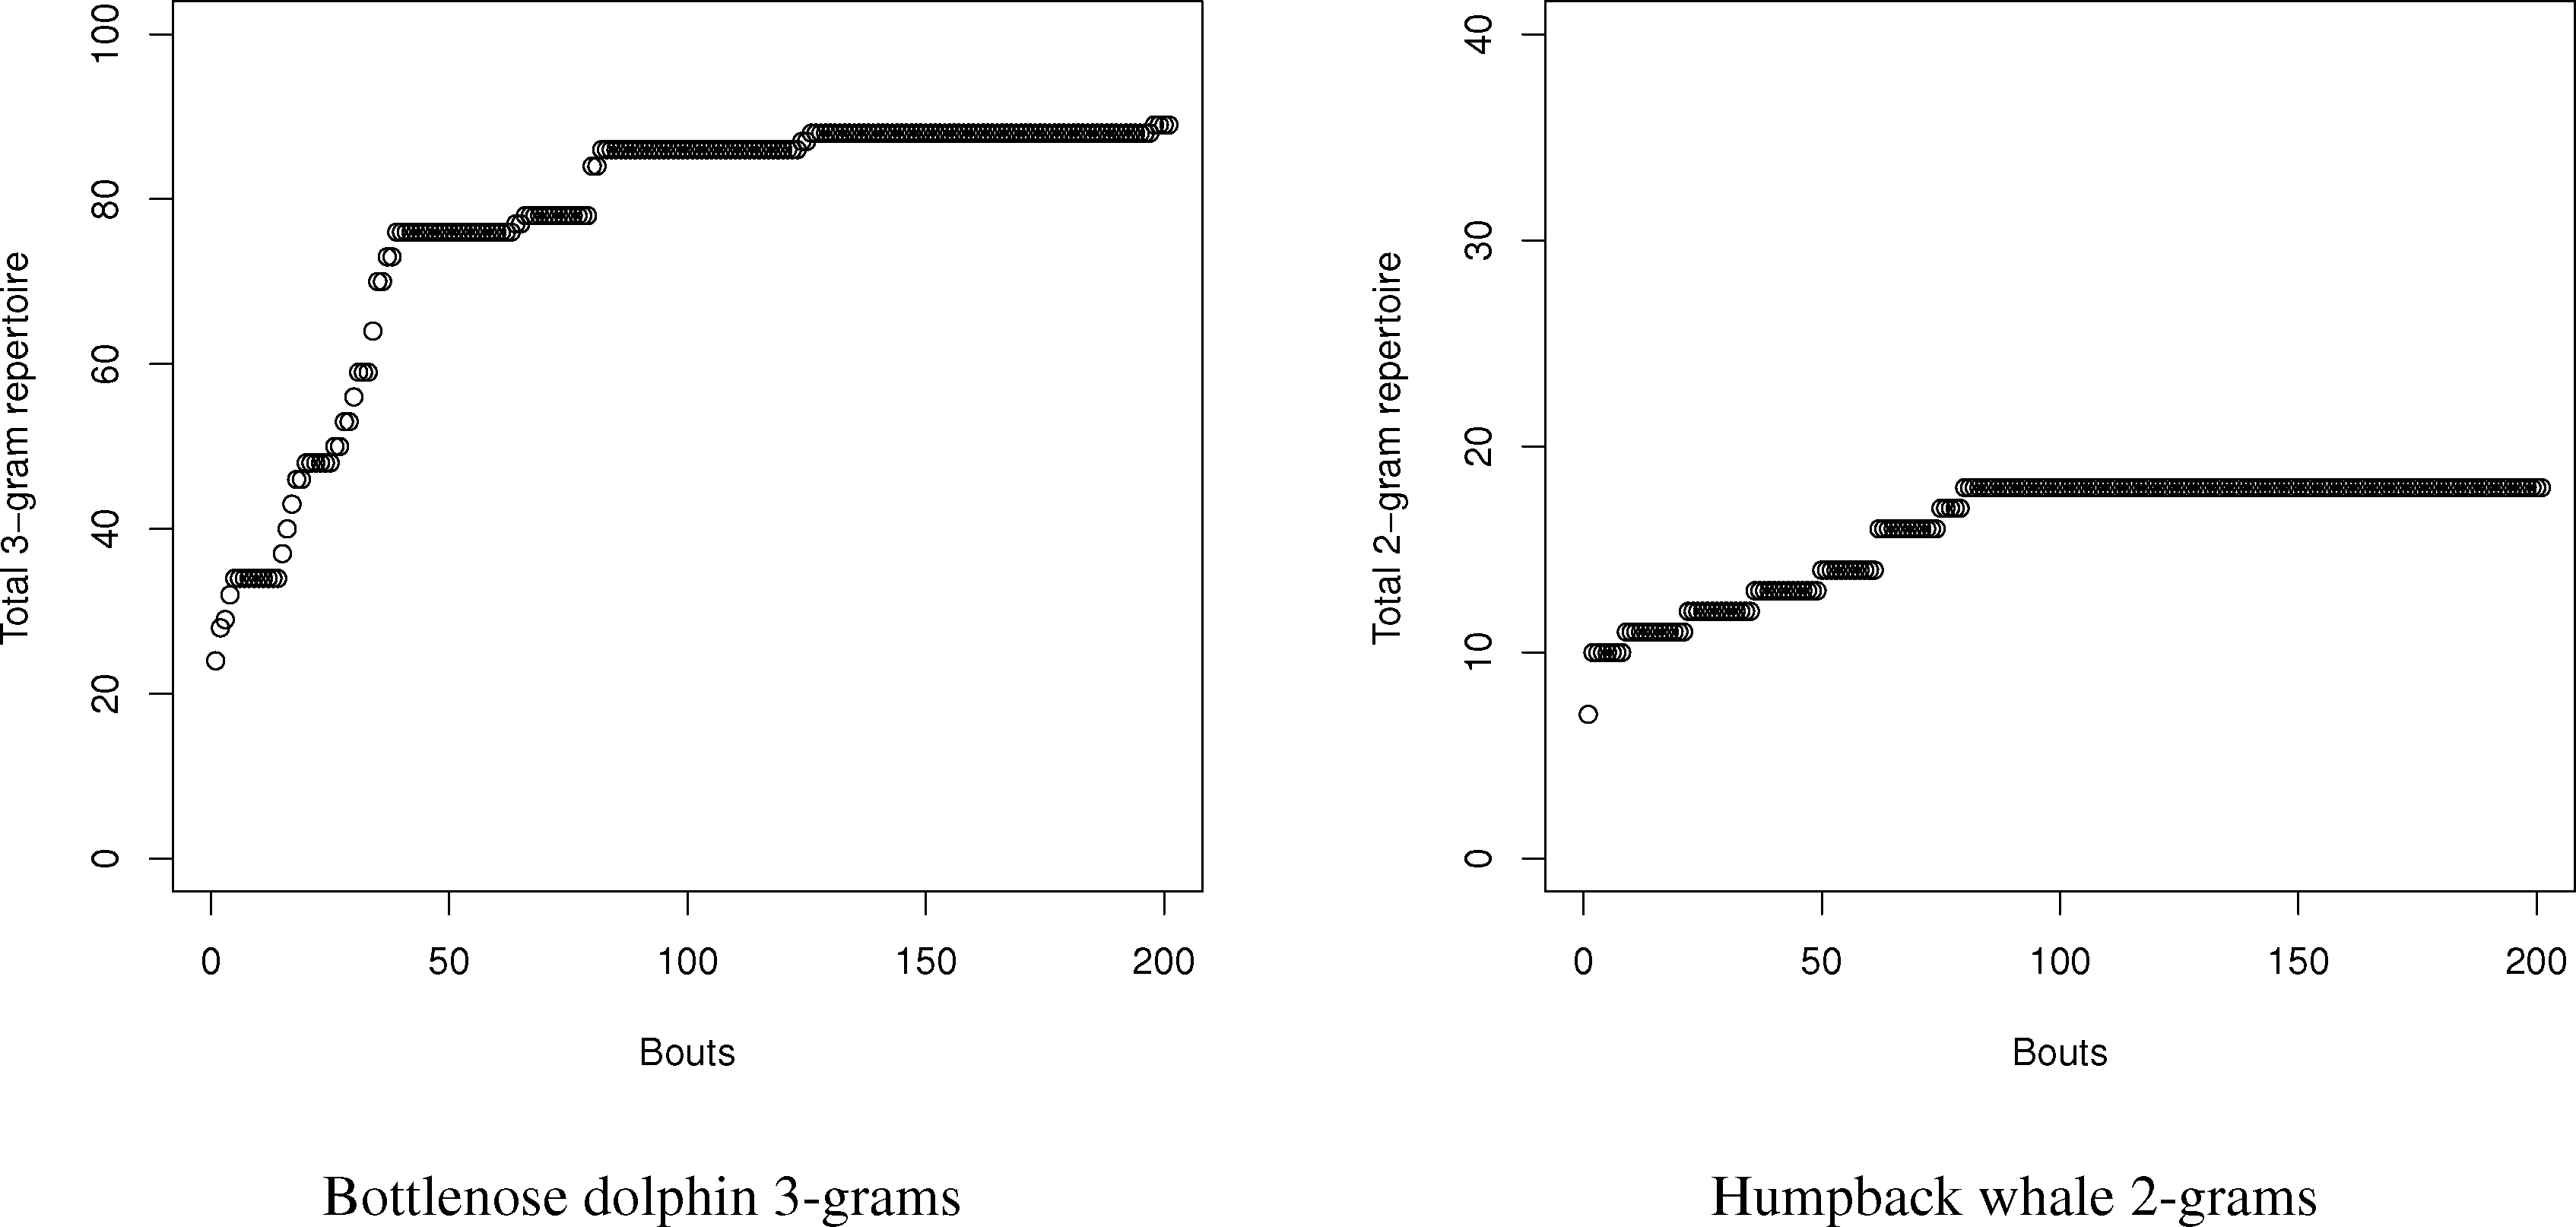
Using this program, the number of N-grams was compared with the estimates using the entropy method for dolphins and humpback whales. For dolphins and whales, respectively, 20,000 symbol and 2000 symbol sequences with matching conditional entropies were created, and the number of N-grams from one to three were counted. Since the samples were so large, neither curve-fitting nor capture-recapture had an issue finding the total repertoire size, since the exponential distribution of the total number of symbols (see Figure 4) reaches an asymptote. Part of the reason for the rapid symbol acquisition may be that the sequences, despite having the requisite entropy properties, were relatively stationary, which is not always the case for real languages. For dolphins and whales, the charts in the tables were created by sampling new symbols in song “bouts” of 100 and 10 symbols, respectively.
For the humpback whales, the total number of simulated 2-grams exactly matched the prediction of a repertoire size of 18. This would seem to confirm the validity of the method. The dolphin story was more complex. With dolphins, the total number of simulated N-grams exceeded the values estimated by the entropy estimations in all cases; however, the details tell a more complex story. While the repertoire is large in terms of N-grams, the frequency is very concentrated amongst the top N-grams. The top 5 2-grams and 3-grams are 78% and 63% of all 2-grams (total: 46) and 3-grams (total: 89), respectively. Many of the 2-grams and 3-grams occurred only once in the 20,000 symbol sequence. While the bias in the dolphins is greater due to the relatively small sample size compared to the number of symbols, the repertoire exceeded even the maximum bias estimates for both 2-grams and 3-grams.
Therefore, we can conclude one major strength, but limitation, of the use of conditional entropy to measure the N-gram repertoire. For small repertoires, like the whales, it seems they can accurately estimate repertoires for small combinations, such as 2-grams. For more complex repertoires, they seem to accurately measure the size of the most frequently used N-grams in the repertoire to give a reasonable estimate of the most functionally used N-grams. As a limit, however, conditional entropies can seriously undercount rare N-grams, since their relatively small probabilities contribute to the calculations of entropy only weakly.
If collecting the entire size of the repertoire, ignoring the weighted heterogeneity of the symbols, is desired and samples are available, both curve-fitting and capture-recapture create a more detailed picture, since they can pick up rare occurrences; however, they do not give the same information about the relatively skewed nature of the distribution of symbols the entropy method can provide.
7. Conclusions
Animal communication analyses through information theory have been useful, and while they cannot answer all questions regarding the intent or possible meaning of such communications, they have shown beyond a doubt that animal communication can have a complex structure that goes beyond random sounds or even the structure of a first-order Markov process.
However, entropy-based analyses alone hold only descriptive power. A logical next step from observing and measuring communications complexity should be determining how to use that complexity to search for communications structures that can help understand animal behavior. The methods outlined in this paper assist in this effort by giving researchers a baseline to investigate further regarding 2-gram or 3-gram call sequences. In particular, the size of the most frequent, and possibly functional, repertoire is clearly enumerated using information theory methods. Similar to work by Getner on starlings [24], these analyses can reveal that single songs or cries are poor substitutes for communication outside the complete pattern. Assumptions of uniform probabilities for the repertoire are almost always wrong, and plain measures of repertoire size cannot reflect this as well as entropy values.
While the information theory methods are weaker in finding the exact repertoire size compared to count-based methods, such as curve-fitting and capture-recapture, these methods offer an improved understanding of the relationships that develop the syntax of the communication. The basic order of communication, the clustering of “vocabulary” and other detailed features cannot been understood just by comparing repertoire sizes over time and across species. The importance of understanding syntax in this matter has been frequently raised, such as in [44], where it is recommended that more experiments be carried out to ascertain if other species have phonological recognition similar to phonemes in human speech.
It has long been known that auditory recognition abilities exist in a wide group of species from 2-gram alarm calls in putty monkeys (Cercopithecus nictitans)[45,46] to pitch differentiation by moths [47,48]. How and why these abilities could possibly exist in disparate species, such as birds and cetaceans, while possibly absent in some more closely-related primates is a key question. Is this a frequent evolutionary adaptation that can appear in almost any species or do the most elaborate and complex communications, such as with dolphins, require high intelligence [49]?
Just like word length analyses in human language use syllables as the base unit [50], we may possibly look at the average, or most frequent, length of N-grams of communication in animals to gauge the depth and complexity of their communications. In this way, it is the author’s hope that information theory analyses can help peel back the layers of complexity to show how closely such animal communication matches, or is distinct from, human language.
Acknowledgments
I would like to thank Laurance Doyle for help in gathering and understanding data from past papers. I would also like to thank the anonymous referees for much helpful feedback.
Conflicts of Interest
The author has no conflicts of interest.
References
- Dawkins, R.; Krebs, J.R. Animal Signals: Information or Manipulation. In Behavioural Ecology: An Evolutionary Approach; Krebs, J.R., Davies, N.B., Eds.; Sinauer: Sunderland, MA, USA, 1978; pp. 282–309. [Google Scholar]
- Krebs, J.R.; Dawkins, R. Animal Signals: Mind-Reading and Manipulation. In Behavioural Ecology: An Evolutionary Approach; Krebs, J.R., Davies, N.B., Eds.; Sinauer: Sunderland, MA, USA, 1984; pp. 380–402. [Google Scholar]
- Burghardt, G.M. Defining Communication. In Communication By Chemical Signals; Advances in Chemoreception, Volume 1; Johnston, J.W., Moulton, D.G., Turk, A., Eds.; Appleton Century Crofts: New York, NY, USA, 1970; pp. 5–18. [Google Scholar]
- Owings, D.H.; Morton, E.S. Animal Vocal Communication: A New Approach; Cambridge University Press: Cambridge, UK, 1998. [Google Scholar]
- Carazo, P.; Font, E. Putting information back into biological communication. J. Evol. Bio 2010, 23, 661–669. [Google Scholar]
- Pinker, S.; Jackendoff, R. The faculty of language: What’s special about it? Cognition 2005, 95, 201–236. [Google Scholar]
- Hauser, M.; Chomsky, N.; Tecumseh Fitch, W. The faculty of language: What is it, who has it, and how did it evolve? Science 2002, 298, 1569–1579. [Google Scholar]
- Wildenthal, J.L. Structure in primary song of the mockingbird (Mimus polyglottos). Auk 1965, 82, 161–189. [Google Scholar]
- Catchpole, C.K.; Slater, P.J.B. Bird Song: Biological Themes and Variations; Cambridge University Press: Cambridge, UK, 1995; pp. 45–56. [Google Scholar]
- Garamszegi, L.Zs.; Boulinier, T.; Møller, A.P.; Török, J.; Michl, G.; Nichols, J.D. The estimation of size and change in composition of avian song repertoires. Anim. Behav 2002, 63, 623–630. [Google Scholar]
- Garamszegi, L.Z.; Balsby, T.T.S.; Bell, B.D.; Borowiec, M.; Byers, B.E.; Draganoiu, T.; Eens, M.; Forstmeier, W.; Galeotti, P.; Gil, D. Estimating the complexity of bird song by using capture-recapture approaches from community ecology. Behav. Ecol. Sociobiol 2005, 57, 305–317. [Google Scholar]
- Botero, C.A.; Mudge, A.E.; Koltz, A.M.; Hochachka, W.M.; Vehrencamp, S.L. How reliable are the methods for estimating repertoire size. Ethology 2008, 114, 1227–1238. [Google Scholar]
- Dobson, C.W.; Lemon, R.E. Markov sequences in songs of American thrushes. Behaviour 1979, 68, 86–105. [Google Scholar]
- McCowan, B.; Doyle, L.R.; Hanser, S.F. Using information theory to assess the diversity, complexity, and development of communicative repertoires. J. Comp. Psych 2002, 116, 166–172. [Google Scholar]
- Kershenbaum, A. Entropy rate as a measure of animal vocal complexity. Bioacoustics 2013. [Google Scholar] [CrossRef]
- Shannon, C.E. Prediction and entropy of printed English. Bell Sys. Tech. J 1951, 30, 50–64. [Google Scholar]
- Yaglom, A.M.; Yaglom, I.M. Probability and Information; Jain, V.K., Translator; D. Reidel: Dordrecht, The Netherlands, 1983. [Google Scholar]
- Smith, R.D. Distinct word length frequencies: Distributions and symbol entropies. Glottometrics 2012, 23, 7–22. [Google Scholar]
- Haldane, J.B.; Spurway, H. A statistical analysis of communication in “Apis mellifera” and a comparison with communication in other animals. Insectes Soc 1954, 1, 247–283. [Google Scholar]
- Chatfield, C.; Lemon, R.E. Analysing sequences of behavioural events. J. Theor. Biol 1970, 29, 427–445. [Google Scholar]
- Chatfield, C.; Lemon, R.E. Organization of song in cardinals. Anim. Behav 1971, 19, 1–17. [Google Scholar]
- Hailman, J.P.; Ficken, M.S.; Ficken, R.W. The “chick-a-dee” calls of Parus atricapillus: A recombinant system of animal communication compared with written English. Semiotica 1985, 56, 191–224. [Google Scholar]
- Freeberg, T.M.; Lucas, J.R. Information theoretical approaches to chick-a-dee calls of Carolina chickadees (Poecile carolinensis). J. Comp. Psych 2012, 126, 68–81. [Google Scholar]
- Gentner, T.Q.; Hulse, S.H. Perceptual mechanisms for individual vocal recognition in European starlings, Sturnus vulgaris. Anim. Behav 1998, 56, 579–594. [Google Scholar]
- Da Silva, M.L.; Piqueira, J.R.C.; Vielliard, J.M. Using Shannon entropy on measuring the individual variability in the Rufous-bellied Thrush Turdus rufiventris vocal communication. J. Theor. Biol 2000, 207, 57–64. [Google Scholar]
- Briefer, E.; Osiejuk, T.S.; Rybak, F.; Aubin, T. Are bird song complexity and song sharing shaped by habitat structure? An information theory and statistical approach. J. Theor. Biol 2010, 262, 151–164. [Google Scholar]
- McCowan, B.; Hanser, S.F.; Doyle, L.R. Quantitative tools for comparing animal communication systems: Information theory applied to bottlenose dolphin whistle repertoires. Anim. Behav 1999, 57, 409–419. [Google Scholar]
- Ferrer-i-Cancho, R.; McCowan, B. A law of word meaning in dolphin whistle types. Entropy 2009, 11, 688–701. [Google Scholar]
- Ferrer-i-Cancho, R.; McCowan, B. The span of correlations in dolphin whistle sequences. J. Stat. Mech 2012, P06002. [Google Scholar]
- Suzuki, R.; Buck, J.R.; Tyack, P.L. Information entropy of humpback whale songs. J. Acoust. Soc. Am 2006, 119, 1849–1866. [Google Scholar]
- Miksis-Olds, J.L.; Buck, J.R.; Noad, M.J.; Cato, D.H.; Stokes, M.D. Analysis of Australian humpback whale song using information theory. J. Acoust. Soc. Am 2006, 120, 3228–3229. [Google Scholar]
- Miksis-Olds, J.L.; Buck, J.R.; Noad, M.J.; Cato, D.H.; Stokes, M.D. Information theory analysis of Australian humpback whale song. J. Acoust. Soc. Am 2008, 124, 2385–2393. [Google Scholar]
- Doyle, L.R.; McCowan, B.; Hanser, S.F.; Chyba, C.; Bucci, T.; Blue, J.E. Applicability of information theory to the quantification of responses to anthropogenic noise by southeast Alaskan humpback whales. Entropy 2008, 10, 33–46. [Google Scholar]
- Kershenbaum, A.; Ilany, A.; Blaustein, L.; Geffen, E. Syntactic structure and geographical dialects in the songs of male rock hyraxes. Proc. R. Soc. B: Biol. Sci 2012, 279, 2974–2981. [Google Scholar]
- Chatfield, C. Statistical inference regarding Markov chain models. J. R. Stat. Soc. Ser. C 1973, 22, 7–20. [Google Scholar]
- Morgan, B.J.T. Markov properties of sequences of behaviours. J. R. Stat. Soc. Ser. C 1976, 25, 31–36. [Google Scholar]
- Miller, G.A. Note on the Bias of Information Estimates. In Information Theory in Psychology: Problems and Methods; Quastler, H., Ed.; Free Press: Glencoe, IL, USA, 1955; pp. 95–100. [Google Scholar]
- Panzeri, S.; Treves, A. Analytical estimates of limited sampling biases in different information measures. Netw. Comput. Neural Syst 1996, 7, 87–107. [Google Scholar]
- Weaver, W.; Shannon, C.E. The Mathematical Theory of Communication; University of Illinois Press: Urbana-Champaign, IL, USA, 1963. [Google Scholar]
- Kolmogorov, A.N. Three approaches to the quantitative definition of information. Prob. Inf. Transm 1965, 1, 4–7. [Google Scholar]
- McCowan, B. A new quantitative technique for categorizing whistles using simulated signals and whistles from captive bottlenose dolphins (Delphinidae, Tursiops truncatus). Ethology 1995, 100, 177–193. [Google Scholar]
- McCowan, B.; Reiss, D. Quantitative comparison of whistle repertoires from captive adult bottlenose dolphins (Delphinidae, Tursiops truncatus): A re-evaluation of the signature whistle hypothesis. Ethology 1995, 100, 194–209. [Google Scholar]
- McCowan, B.; Reiss, D. Whistle contour development in captive-born infant bottlenose dolphins (Tursiops truncatus): Role of learning. J. Comp. Psych 1995, 109, 242–260. [Google Scholar]
- Yip, M.J. The search for phonology in other species. Trends Cogn. Sci 2006, 10, 442–446. [Google Scholar]
- Arnold, K.; Zuberbühler, K. Language evolution: Semantic combinations in primate calls. Nature 2006, 441. [Google Scholar] [CrossRef]
- Arnold, K.; Zuberbühler, K. The alarm-calling system of adult male putty-nosed monkeys, Cercopithecus nictitans martini. Anim. Behav 2006, 72, 643–653. [Google Scholar]
- Turner, C.H.; Schwarz, E. Auditory powers of the Catocala moths; an experimental field study. Biol. Bull 1914, 27, 275–293. [Google Scholar]
- Turner, C.H. An experimental study of the auditory powers of the giant silkworm moths (Saturniidae). Biol. Bull 1914, 27, 325–332. [Google Scholar]
- Lilly, J.C. The Mind of the Dolphin: A Nonhuman Intelligence; Avon: New York, NY, USA, 1969. [Google Scholar]
- Grotjahn, R.; Altmann, G. Modeling the Distribution of Word Length: Some Methodological Problems. In Contributions to Quantitative Linguistics, Proceedings of the First International Conference on Quantitative Linguistics, QUALICO, Trier, Germany, 23–27 September 1991; Köhler, R., Rieger, B.B., Eds.; Kluwer Academic: Dordrecht, The Netherlands, 1993; pp. 141–153. [Google Scholar]


| Species Name | Reference | M | S | S2 | S3 | H | H2 | H3 |
|---|---|---|---|---|---|---|---|---|
| Tursiops truncatus | [27] | 27 | 493 | 346 | 346 | 1.92 | 1.15 | 0.56 |
| Megaptera novaeangliae | [33] | 6 | 202 | 195 | N/A | 2.15 | 2 | N/A |
| Alauda arvensis L. | [26] | 170 | 10,000 | 10,000 | 10,000 | 7.05 | 1 | 0.29 |
| Sturnus vulgaris | [24] | 105 | 4,811 | 4,691 | 4,691 | 6.03 | 1.47 | 0.81 |
| Hylocichla mustelina | [13] | 35 | 777 | 777 | 777 | 4.64 | 3.33 | 1.09 |
| Turdus migratorius | [13] | 44 | 2,700 | 2,700 | 2,700 | 4.03 | 2.74 | 1.95 |
| Bias Minimum | Bias Maximum | |||||
|---|---|---|---|---|---|---|
| Species Name | H | H(X, Y) | H(X, Y, Z) | H | H(X, Y) | H(X, Y, Z) |
| Tursiops truncatus | 0.04 | 0.01 | 0.01 | 0.04 | 0.03 | 0.2 |
| Megaptera novaeangliae | 0.02 | 0.06 | N/A | 0.02 | 0.07 | N/A |
| Alauda arvensis L. | 0.01 | 0 | 0 | 0.01 | 1.26 | 1.96* |
| Sturnus vulgaris | 0.02 | 0.0 | 0.0 | 0.02 | 0.66 | 1.3 |
| Hylocichla mustelina | 0.03 | 0.09 | 0.01 | 0.03 | 0.57 | 2.78* |
| Turdus migratorius | 0.01 | 0.01 | 0.02 | 0.01 | 0.07 | 0.85* |
| Bias Minimum | Bias Maximum | |||||
|---|---|---|---|---|---|---|
| Species Name | H | H2 | H3 | H | H2 | H3 |
| Tursiops truncatus | 1.96 | 1.12 | 0.56 | 1.96 | 1.14 | 0.73 |
| Megaptera novaeangliae | 2.17 | 2.04 | N/A | 2.17 | 2.05 | N/A |
| Alauda arvensis L. | 7.06 | 0.99 | 0.29 | 7.06 | 2.25 | 2.25* |
| Sturnus vulgaris | 6.05 | 1.46 | 0.81 | 6.05 | 2.11 | 2.09 |
| Hylocichla mustelina | 4.67 | 3.39 | 1.00 | 4.67 | 3.87 | 3.87* |
| Turdus migratorius | 4.04 | 2.74 | 1.96 | 4.04 | 2.8 | 2.8* |
| Bias Minimum | Bias Maximum | |||||||
|---|---|---|---|---|---|---|---|---|
| Species Name | 1-gram | 2-gram | 3-gram | Total | 1-gram | 2-gram | 3-gram | Total |
| Tursiops truncatus | 27 | 5 | 4 | 36 | 27 | 5 | 5 | 37 |
| Megaptera novaeangliae | 6 | 17 | N/A | 23 | 6 | 18 | N/A | 24 |
| Alauda arvensis L. | 170 | 4 | 2 | 176 | 170 | 23 | 108* | 301 |
| Sturnus vulgaris | 105 | 8 | 6 | 119 | 105 | 19 | 78 | 202 |
| Hylocichla mustelina | 35 | 110 | 8 | 153 | 35 | 214 | 3,126* | 3,375 |
| Turdus migratorius | 44 | 45 | 59 | 148 | 44 | 49 | 338* | 431 |
© 2014 by the authors; licensee MDPI, Basel, Switzerland This article is an open access article distributed under the terms and conditions of the Creative Commons Attribution license (http://creativecommons.org/licenses/by/3.0/).
Share and Cite
Smith, R. Complexity in Animal Communication: Estimating the Size of N-Gram Structures. Entropy 2014, 16, 526-542. https://doi.org/10.3390/e16010526
Smith R. Complexity in Animal Communication: Estimating the Size of N-Gram Structures. Entropy. 2014; 16(1):526-542. https://doi.org/10.3390/e16010526
Chicago/Turabian StyleSmith, Reginald. 2014. "Complexity in Animal Communication: Estimating the Size of N-Gram Structures" Entropy 16, no. 1: 526-542. https://doi.org/10.3390/e16010526