Article

Greening Implication Inferred from Vegetation Dynamics Interacted with Climate Change and Human Activities over the Southeast Qinghai–Tibet Plateau

1
College of Water Resources and Civil Engineering, China Agricultural University, Beijing 100083, China
2
Center for Agricultural Water Research in China, China Agricultural University, Beijing 100083, China
3
Institute of Geographic Sciences and Natural Resources Research, Chinese Academy of China, Beijing 100101, China
4
Institute of Tibetan Plateau Research, Chinese Academy of China, Beijing 100101, China
5
College of Water Sciences, Beijing Normal University, Beijing 100875, China
6
Beijing Key Laboratory of Urban Hydrological Cycle and Sponge City Technology, Beijing 100875, China
*
Author to whom correspondence should be addressed.
Remote Sens. 2019, 11(20), 2421; https://doi.org/10.3390/rs11202421
Submission received: 11 September 2019 / Revised: 10 October 2019 / Accepted: 16 October 2019 / Published: 18 October 2019

Abstract

:
Vegetation dynamics are sensitive to climate change and human activities, as vegetation interacts with the hydrosphere, atmosphere, and biosphere. The Yarlung Zangbo River (YZR) basin, with the vulnerable ecological environment, has experienced a series of natural disasters since the new millennium. Therefore, in this study, the vegetation dynamic variations and their associated responses to environmental changes in the YZR basin were investigated based on Normalized Difference Vegetation Index (NDVI) and Global Land Data Assimilation System (GLDAS) data from 2000 to 2016. Results showed that (1) the YZR basin showed an obvious vegetation greening process with a significant increase of the growing season NDVI (Zc = 2.31, p < 0.05), which was mainly attributed to the wide greening tendency of the downstream region that accounted for over 50% area of the YZR basin. (2) Regions with significant greening accounted for 25.4% of the basin and were mainly concentrated in the Nyang River and Parlung Tsangpo River sub-basins. On the contrary, the browning regions accounted for <25% of the basin and were mostly distributed in the urbanized cities of the midstream, implying a significant influence of human activities on vegetation greening. (3) The elevation dependency of the vegetation in the YZR basin was significant, showing that the vegetation of the low-altitude regions was better than that of the high-altitude regions. The greening rate exhibited a significantly more complicated relationship with the elevation, which increased with elevated altitude (above 3500 m) and decreased with elevated altitude (below 3500 m). (4) Significantly positive correlations between the growing season NDVI and surface air temperature were detected, which were mainly distributed in the snow-dominated sub-basins, indicating that glaciers and snow melting processes induced by global warming play an important role in vegetation growth. Although basin-wide non-significant negative correlations were found between precipitation and growing season NDVI, positive influences of precipitation on vegetation greening occurred in the arid and semi-arid upstream region. These findings could provide important information for ecological environment protection in the YZR basin and other high mountain regions.

Graphical Abstract

1. Introduction

Vegetation is an important component in terrestrial ecosystems that not only reflects the land surface condition but also interacts with the hydrosphere, atmosphere and biosphere [1]. Therefore, vegetation is often regarded as a good indicator of environmental changes [2] and can be used to describe interactive impacts between environmental changes and terrestrial ecosystems [3]. In recent years, spatial and temporal variations of vegetation have attracted considerable attention and persistent interest globally. Zhu et al. used the Leaf Area Index (LAI) to study vegetation dynamics and found that the globe experienced an obviously greening process, with CO2 fertilization effects playing an important role in this greening trend [4]. Greening trends mainly occurred in Europe [5], eastern North America [6], northern Africa [7,8], and China [9]. Chen et al. further indicated that China was more responsible for “Greening Earth” due to the implementation of environmental protection projects since the new millennium [10]. Lu et al. also considered that human activities in China were the most significant factors for vegetation dynamics, and the implementation of large-scale natural conservation measurements was more effective for vegetation recovery [11]. Hua et al. pointed out that land-use and land-cover change determined the vegetation greening process in China, and North China was clearly becoming green because of the expansion in agricultural land, forest, and grasslands [12]. Many studies have also concluded that many regions in China exhibited a greening process, such as the Loess Plateau [13], Northwest inland [14], and Southwest China [15]. However, the increasing sensitivity of vegetation to climate change and human activities along an elevational gradient in high-altitude regions raises a great challenge to the understanding of the interaction between vegetation dynamics and environmental changes.
Global climate change, mainly characterized by global warming, has altered the water and energy balance of terrestrial ecosystems by redistributing climate factors in space and time, which will significantly affect vegetation spatiotemporal variations [16,17,18]. As the two main climate factors, precipitation and surface air temperature directly drive the water and energy cycle and further affect the spatiotemporal distributions of vegetation [19,20,21]. However, the vegetation response to precipitation is of great spatial heterogeneity. There generally exists a positive relationship between vegetation growth and precipitation. For example, more precipitation will promote vegetation recovery, which is particularly apparent in arid and semi-arid regions where available moisture is the key material [22,23], whereas precipitation exerts negative influences on vegetation growth in some regions. Wu et al. focused on the Guangdong Province of South China, located in a tropical and subtropical region, and concluded that vegetation greening had a negative relationship with precipitation amount because of extreme precipitation events, such as freezing rain and ice storms [24]. A negative correlation between precipitation and vegetation cover was also found in Nepal [25] and the Three-River Headwaters region of the Qinghai–Tibet Plateau, which is the source of the Yangtze River, the Yellow River, and the Lantsang River [26]. Similarly, the relationship between vegetation growth and surface air temperature exhibits great geographical complexity and uncertainty. Increased surface air temperature has lengthened the growing season in northern high latitudes, which further strengthens vegetation activity and promotes vegetation growth [27,28]. However, due to continuous global warming, the surface air temperature may no longer promote vegetation growth and conversely may be detrimental to vegetation greening owing to warming-induced drought. Some studies have indicated that drought has resulted in the decrease of net primary production (NPP) in Northeast China [29], reduction of water use efficiency (WUE) in central and southern China [30], and decline of gross primary production (GPP) in northern China [31]. Soil moisture exerts an important and direct influence on vegetation growth in that it constrains evapotranspiration and photosynthesis and also maintains extra water from precipitation and snowfall. Soil moisture is also affected by climate change and simultaneously involved in a number of feedback loops at the local, regional, and global scales [32,33], and the effects of soil moisture on vegetation growth have also been analyzed. Unequivocally, great spatial heterogeneity exists in vegetation responses to precipitation and surface air temperature, which is especially apparent in the high-altitude regions with significant sensitivity and vulnerability to environmental changes [34,35,36].
The Yarlung Zangbo River (YZR) basin, whose average elevation is more than 4000 m, located in the southeast of the Qinghai–Tibet Plateau (QTP), is a typical high-altitude region. It contains many moisture transportation paths and thus is important for precipitation generation over the QTP [37]. The YZR basin is of overwhelming importance to agricultural development, sustainable environment, and economic prosperity of the QTP because 62.98% of the agricultural land and 51.30% of the population of the Tibet Autonomous Region are predominantly concentrated in the river valley of the midstream YZR. On the other hand, the effects of global warming are more evident in the YZR basin, resulting in a series of environmental changes, such as permafrost collapse [38], grassland degradation [39], and desertification [40]. In particular, drought has been a severe natural disaster in this region. You et al. pointed out that surface air temperature showed a significant upward trend with rates of 0.28 °C/decade from 1961 to 2005 over the YZR Basin [41]. Li et al. demonstrated that drought duration and magnitude in the YZR basin were becoming more severe [42]. An obvious climate transition from wet to dry in the year of 2000 was also detected by Liu et al. [43], indicating that the YZR basin has faced a more challenging environment since the new millennium. The precipitation and surface air temperature from Global Land Data Assimilation System (GLDAS) Noah model showed that the YZR basin had experienced a drying and warming process since 2000 (Supplementary Section 1). More frequent and severe droughts will pose a threat to regional water resources safety. Lu et al. pointed out that the alpine grassland cover on the QTP increased significantly from 1982 to 2013 [44]. Wang et al. considered that surface air temperature contributed significantly to vegetation cover in the QTP region [45]. Regarding the YZR basin, Han et al. also found that there was an obvious greening trend in the southeastern part of the QTP region [46]. Most previous studies used limited observed data from sparse meteorological stations to investigate the relationship between climate change and dynamic variations of vegetation [47,48,49]. There are few comprehensive studies on the spatial interaction of vegetation dynamic variations and climate change in the YZR basin due to the scarcity of in situ measurements and inadequate and irregular observation networks. Furthermore, the influence of human activities in the YZR basin cannot be ignored since there are important population centers and grain-producing areas in the middle region, where agricultural land and population is concentrated along the river valley of the midstream. Therefore, investigating the spatial responses of vegetation in the high-altitude regions to climate change and human activities is of great necessity.
The Normalized Difference Vegetation Index (NDVI), defined as the difference of red and near-infrared spectrum reflectance, reflects vegetation dynamic variations in the aspect of ecological monitoring and climate change [50]. MODIS NDVI products have been widely applied to study spatial and temporal variations of vegetation cover and their responses to global climate change in different regions, such as North America [51], South Asia [52], South America [53], Africa [54], and Europe [55]. Hence, the MOD13A3 NDVI product was used to indicate vegetation dynamics in this study. In addition, the area of the YZR basin is over 2.4 × 10⁵ km2, while national meteorological stations are extremely scarce and climate observation networks are inadequate and irregular [56]. Thus, there are great challenges in investigating spatial and temporal variations at the basin scale. Liu et al. has validated the applicability of GLDAS NOAH data for the YZR basin using 20 hydrometeorological stations covering the upstream, midstream, and downstream regions and concluded that the spatiotemporal patterns of the GLDAS NOAH precipitation and surface air temperature data fit well with those of the observed data in this region [43]. Therefore, GLDAS NOAH data were applied to describe the spatiotemporal patterns of precipitation and surface air temperature in this study.
As mentioned above, drought in the YZR basin has become more frequent and severe since the new millennium, threatening regional water resources safety. Thus, it is imperative to identify the vegetation variations at both spatial and temporal scales and their associated responses to climate change from 2000 to 2016 in the YZR basin. Therefore, the primary objectives of this study are (1) to identify whether the vegetation in the YZR basin is greening or browning since 2000, (2) to investigate the elevation dependency of vegetation in the YZR basin with complex climate and terrain, and (3) to quantify the vegetation dynamic responses to climate change and human activities. The results will promote our understanding of vegetation dynamic variations in high-altitude regions and be useful for regional sustainable development.

2. Material and methods
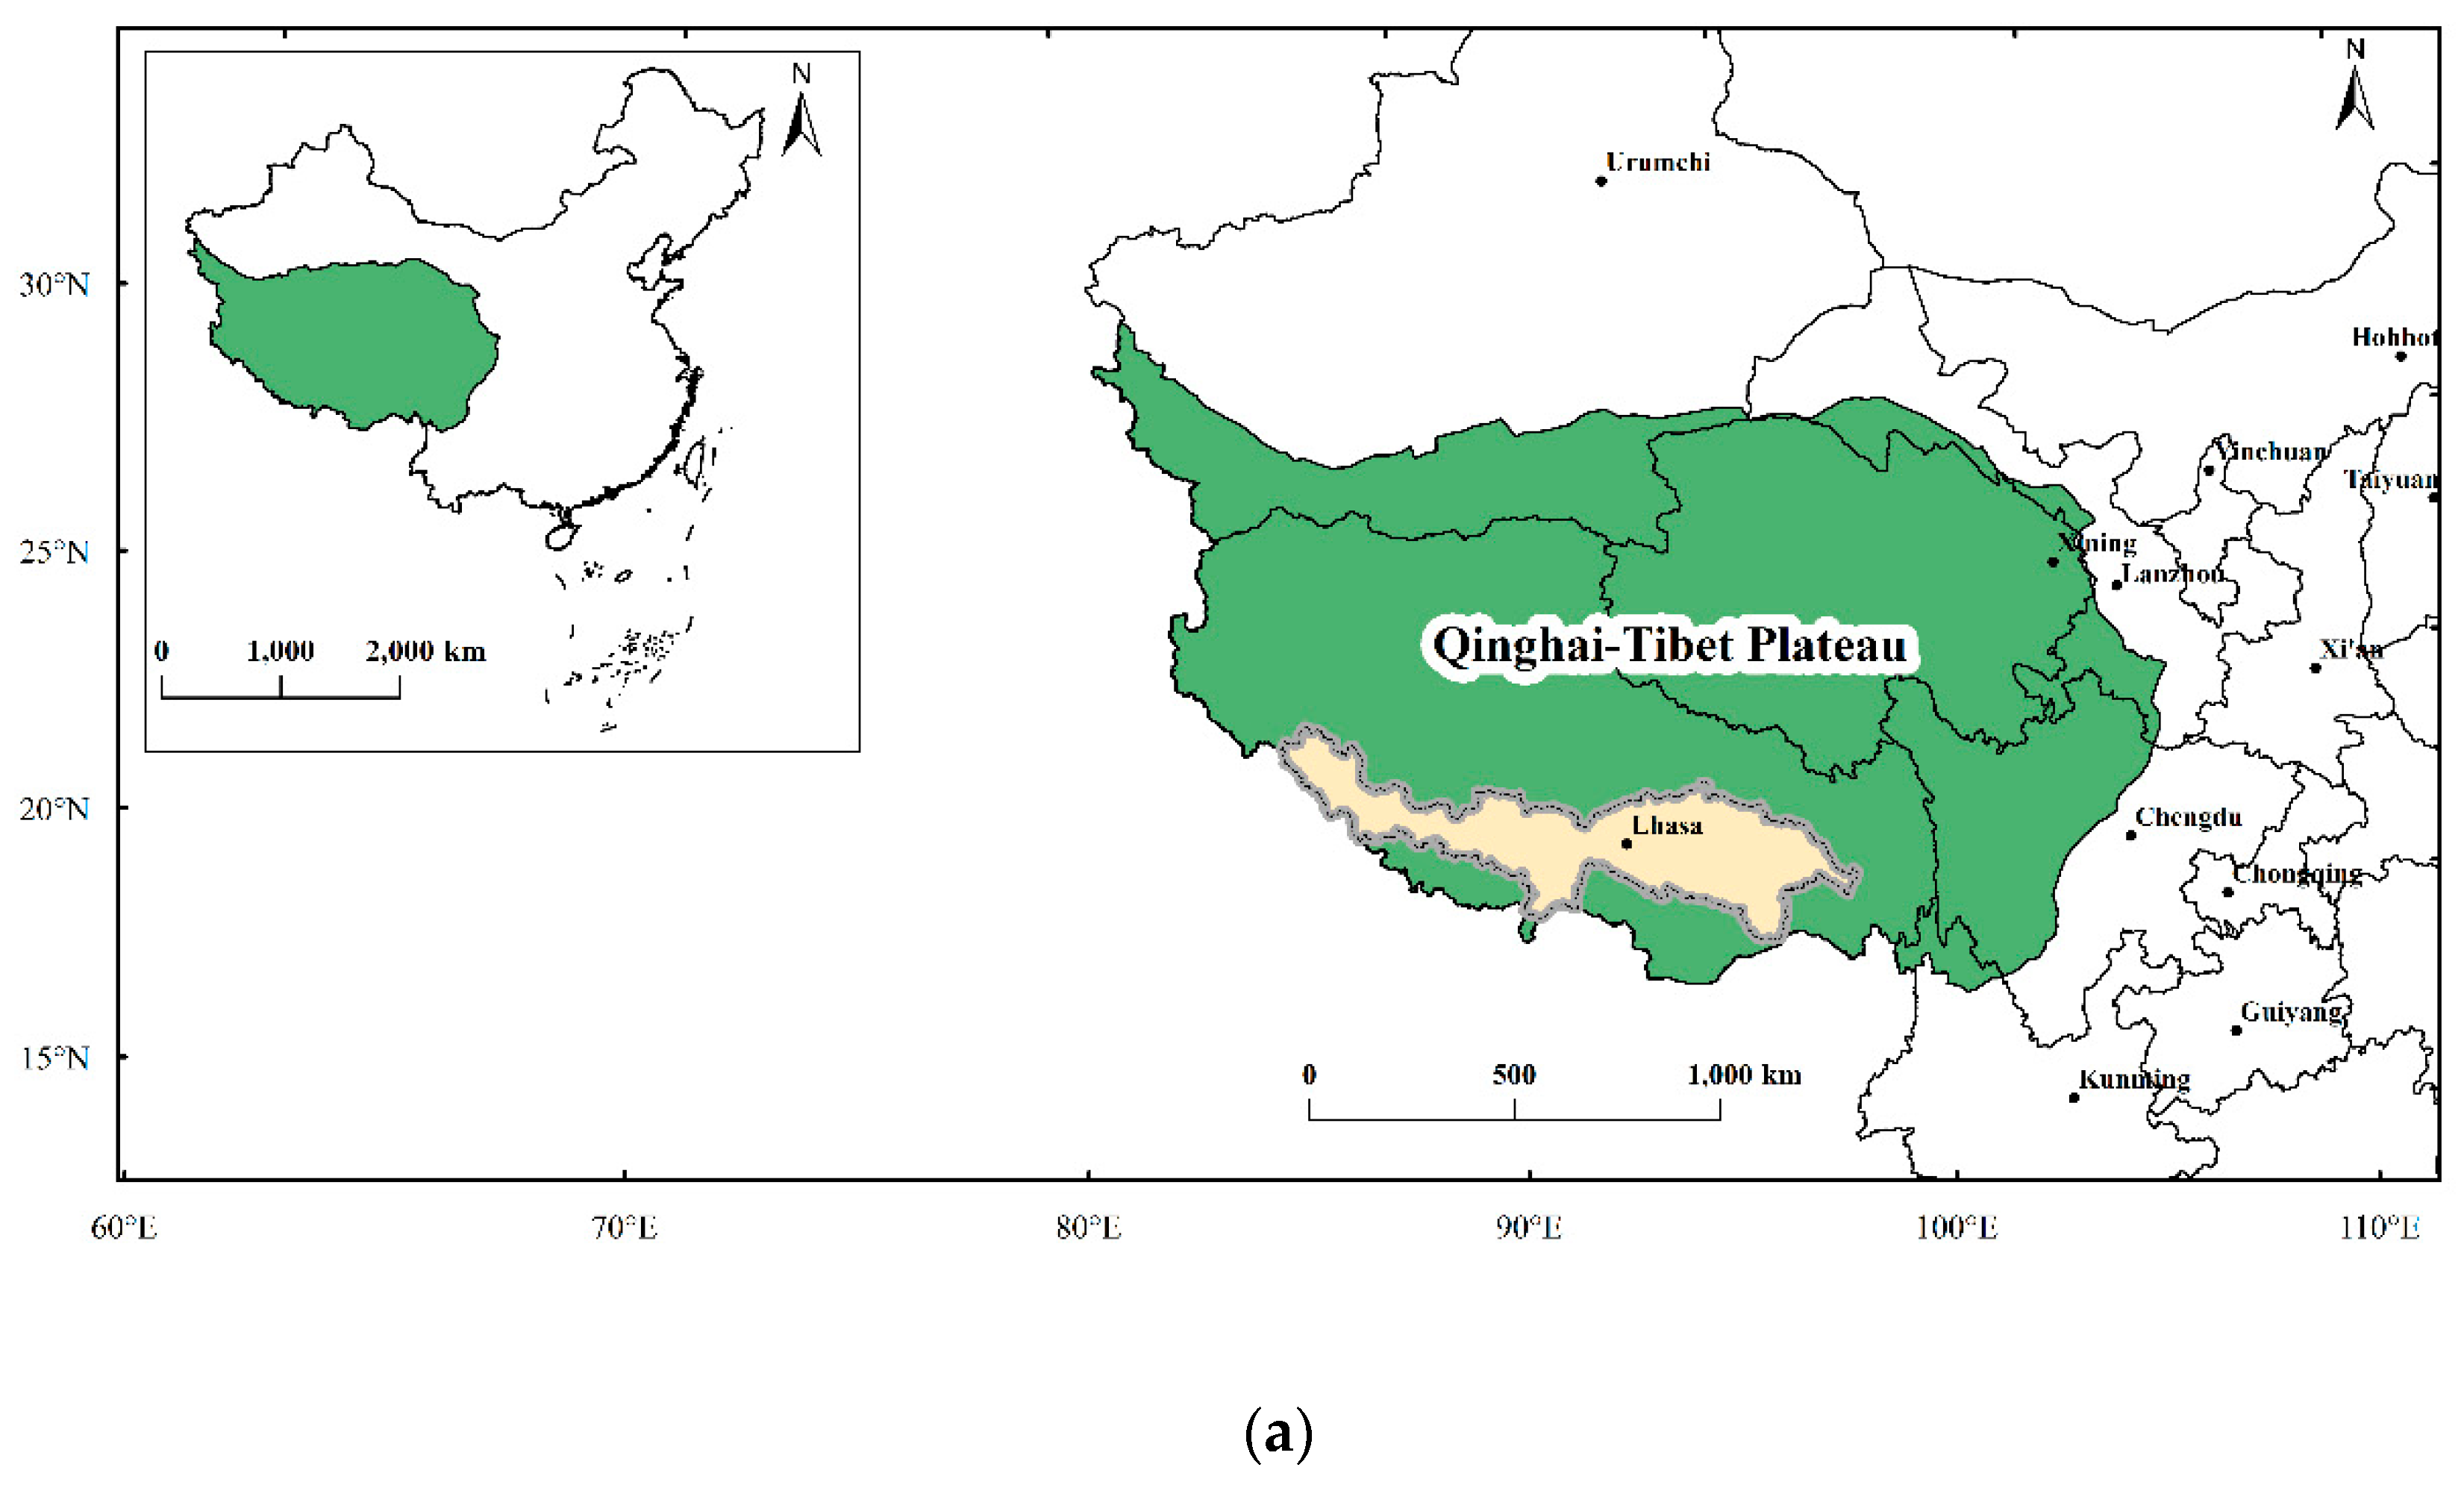
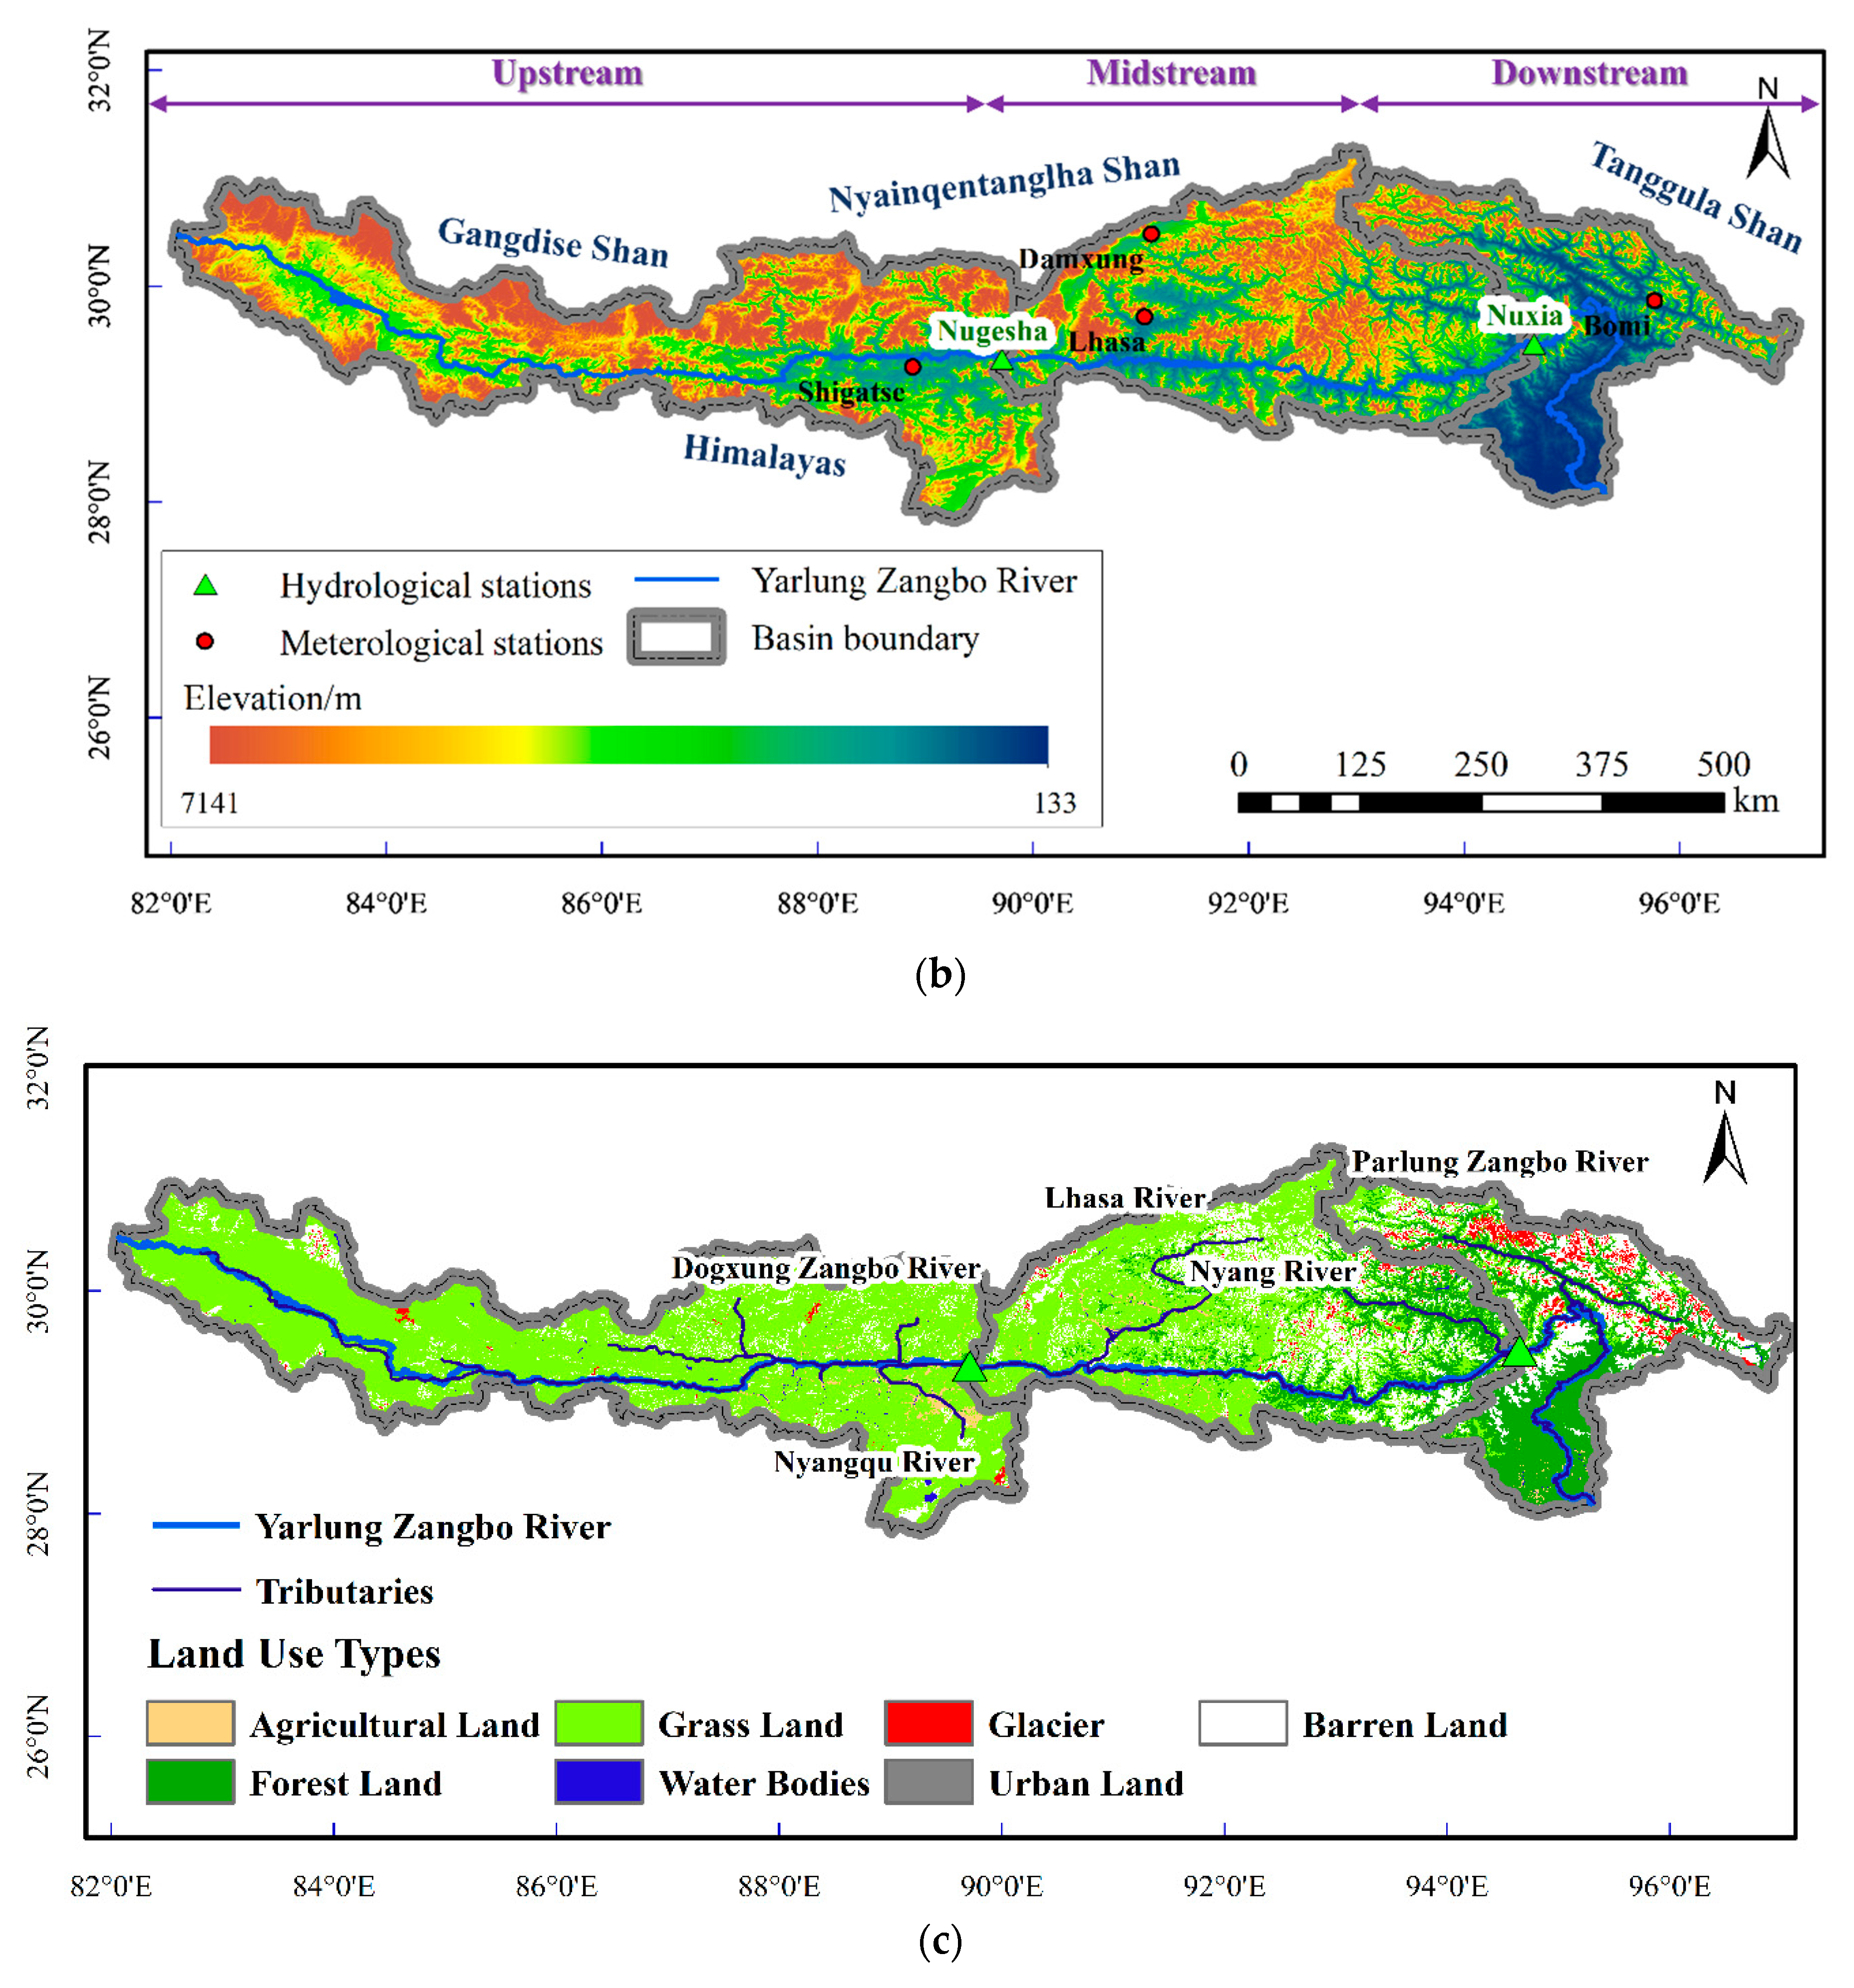
2.1. Study Area

The YZR stretches from west to east through the southern edge of the QTP, with a length of about 2057 km (Figure 1a). It springs from the northwestern part of the YZR basin and is surrounded by lots of mountains, such as Tanggula Shan, Nyainqentanglha Shan, Gangdise Shan, and the Himalayas (Figure 1b). Moreover, there is a significant elevation range, from 133 m to over 7000 m, in the YZR basin. In this study, Nugesha and Nuxia hydrological stations were taken as the outlets of the upstream and midstream, respectively, which divided the YZR basin into three sub-catchments. The region between the Chemayungdung Glacier and Nugesha hydrological station is defined as the upstream and is an arid and semi-arid region with annual mean precipitation of less than 300 mm. The region between the Nugesha and Nuxia hydrological stations is defined as the midstream, which has a temperate climate. The region below the Nuxia hydrological station, with an annual mean precipitation of more than 2000 mm, is defined as the downstream characterized by a warm and wet climate. The elevation increases from the southeastern part (the downstream) to northwestern part (the upstream). In addition, there are five tributaries—Dogxung Zangbo River and Nyang Qu River (upstream), Lhasa River and Nyang River (the east of the midstream), and Parlung Tsangpo River (the north of the downstream). Extensive glaciers and snow are distributed in the source of the Nyang River and Parlung Zangbo River (Figure 1c).

2.2. Data

2.2.1. GLDAS NOAH Data

Global Land Data Assimilation System (GLDAS) is jointly developed by the Goddard Space Flight Center (GSFC) of the National Aeronautics and Space Administration (NASA) and the National Environmental Prediction Center (NCEP) of the National Oceanic and Atmospheric Administration (NOAA), which combines advanced land surface models and data assimilation techniques to generate global fields of land surface fluxes. In this study, monthly precipitation and surface air temperature data generated by the NOAH land surface model in GLDAS with the spatial resolution of 0.25° [58] were used to supplement the sparse observational network in YZR basin. In addition, we also validated the applicability of GLDAS NOAH data since 2000 in the YZR basin and concluded that GLDAS NOAH data after 2000 can satisfy requirements of analyzing the relationship between vegetation dynamics and climate change. Related results were shown in Supplementary Section 2.

2.2.2. Vegetation Index Data

The MOD13A3 NDVI product with 1-km spatial resolution and one-month temporal resolution was obtained from the United States Geological Survey (USGS) [59]. This product has been enhanced by reducing external influence factors and inherent non-vegetation influence factors. The remote sensing image processing software ENVI was utilized to transform the HDF-format of this product, extract NDVI values, mosaic the remote sensing images, complete projection conversion and for cutting work. In addition, the NDVI product was further integrated into a 0.25° spatial resolution in order to be consistent with that of the GLDAS NOAH data in this study. There are different vegetation types in the YZR basin, such as sparse alpine grassland in the upstream region, shrub-grassland in the midstream, and forest in the downstream region [37], and the growing season is defined from April to October, which can efficiently reflect the seasonal cycle of different vegetation types [60]. In this study, the growing season NDVI was applied to indicate the vegetation dynamics in the YZR basin. For the whole basin, the NDVI value of each year was calculated by averaging growing season NDVI values over all pixels.

2.3. Methods

2.3.1. Linear Regression Model

A linear regression model was applied to detect temporal variation trends of the growing season NDVI [61]. A positive slope (b > 0) means that vegetation is greening while a negative slope (b < 0) means that vegetation is browning. The regression model was as follows:
y = a + b x
where y is the growing season NDVI; x is the year; b is the regression slope, showing the direction and magnitude of the temporal variation; and a is the regression interception.

2.3.2. Pearson Correlation Analysis

The Pearson correlation coefficient was used to determine the effects of precipitation and surface air temperature on the vegetation cover from 2000 to 2016 in this paper. The method has been widely applied to analyze the correlation between climate factors and NDVI [62,63]. The correlation coefficient (rxy) is calculated as
r x y = i = 1 n ( x i x ¯ ) ( y i y ¯ ) i = 1 n ( x i x ¯ ) 2 i = 1 n ( y i y ¯ ) 2
where n is the number of data pairs; xi and yi are two series of paired data; x ¯ and y ¯ are the average values of each set of data, respectively; and rxy reflects the consistency between the two variables, ranging from −1 to 1. The absolute value approaching 1 indicates higher consistency.

2.3.3. Partial Correlation Analysis

The partial correlation coefficient can effectively eliminate the quantitative contribution of different climate variables to the variation of growing season NDVI because of the strong correlation between precipitation and surface air temperature [64]. The partial correlation coefficient (rxy,z) was calculated as follows:
r x y , z = r x y r x z r y z ( 1 r x z 2 ) ( 1 r y z 2 )
where rxy,z is the partial correlation coefficient of the variables of x and y, which eliminates the impacts of the variable z. rxy, rxz and ryz are the Pearson correlation coefficients between the variables of x and y, x and z, and y and z, respectively.

2.3.4. Mann–Kendall Nonparametric Test

Sen’s slope coupled with the Mann–Kendall significance test has been regarded as an efficient trend analysis method [65], and has been successfully applied in vegetation dynamics [66]. For a data time series of x i = ( x 1 , x 2 , , x n ) , β, denoting Sen’s slope, was calculated as follows:
β = M e d i a n ( x j x i j i )
in which 1 < j < i < n . A positive value of β indicates an “upward trend,” while a negative value of β indicates a “downward trend.”
In the Mann–Kendall method, the null hypothesis H0 states that the data are a sample of independent and identically distributed random variables. The alternative hypothesis H1 of a two-sided test is that the distribution of xi and xj are not identical for all i , j n with j i . The test statistic is given as follows:
S = i = 1 n 1 j = i + 1 n sgn ( x j x i )
where xi and xj are the sequential data values, n is the length of the time series, and
sgn ( θ ) = { 1 0 1 θ > 0 θ = 0 θ < 0
For sample sizes larger than 10, the statistic S is nearly normally distributed, i.e., the statistic
Z c = { s 1 V a r ( s ) s > 0 0 s = 0 s + 1 V a r ( s ) s < 0
is a standard normal variable.
Where
V a r ( S ) = [ n ( n 1 ) ( 2 n + 5 ) t t ( t 1 ) ( 2 t + 5 ) ] 18
in which t is the extent of any given tie and ∑ denotes the summation over all ties; Var(S) represents the variance of S. When | Z c | > Z ( 1 α / 2 ) is satisfied where α is the significance level, the null hypothesis H0 will be rejected, indicating a statistically significant trend.

2.3.5. Contribution Analysis of Human Activities

Residual trend analysis (RESTREND) can differentiate vegetation dynamic variations (denoted by NDVI) caused by human activities from those resulting from climate change [67,68,69]. It is clear that there are two reasonable assumptions involved in RESTREND [62,70,71]. First, vegetation dynamic variations are controlled by human activities and climate change. Second, several climate factors, such as precipitation and surface air temperature, can reflect adequately the influence of climate change in vegetation dynamics. Based on the above assumptions, RESTREND is calculated as follows:
Δ = N D V I o b N D V I c l
where NDVIob is the observed NDVI values from the MOD13A3 images, reflecting the dual effects of human activities and climate change, and NDVIcl is the predicted NDVI values derived by establishing a linear regression model based on precipitation and surface air temperature. Δ is the residual value, which can reflect the contribution of human activities on vegetation dynamic variations. Taking an example, if NDVIob exceeds NDVIcl, residual values are positive, indicating that human activities are beneficial for vegetative growth. On the contrary, negative residual values indicate that human activities are bad for vegetative growth and inhibit the greening trend.

3. Results

3.1. Vegetation Dynamic Variations

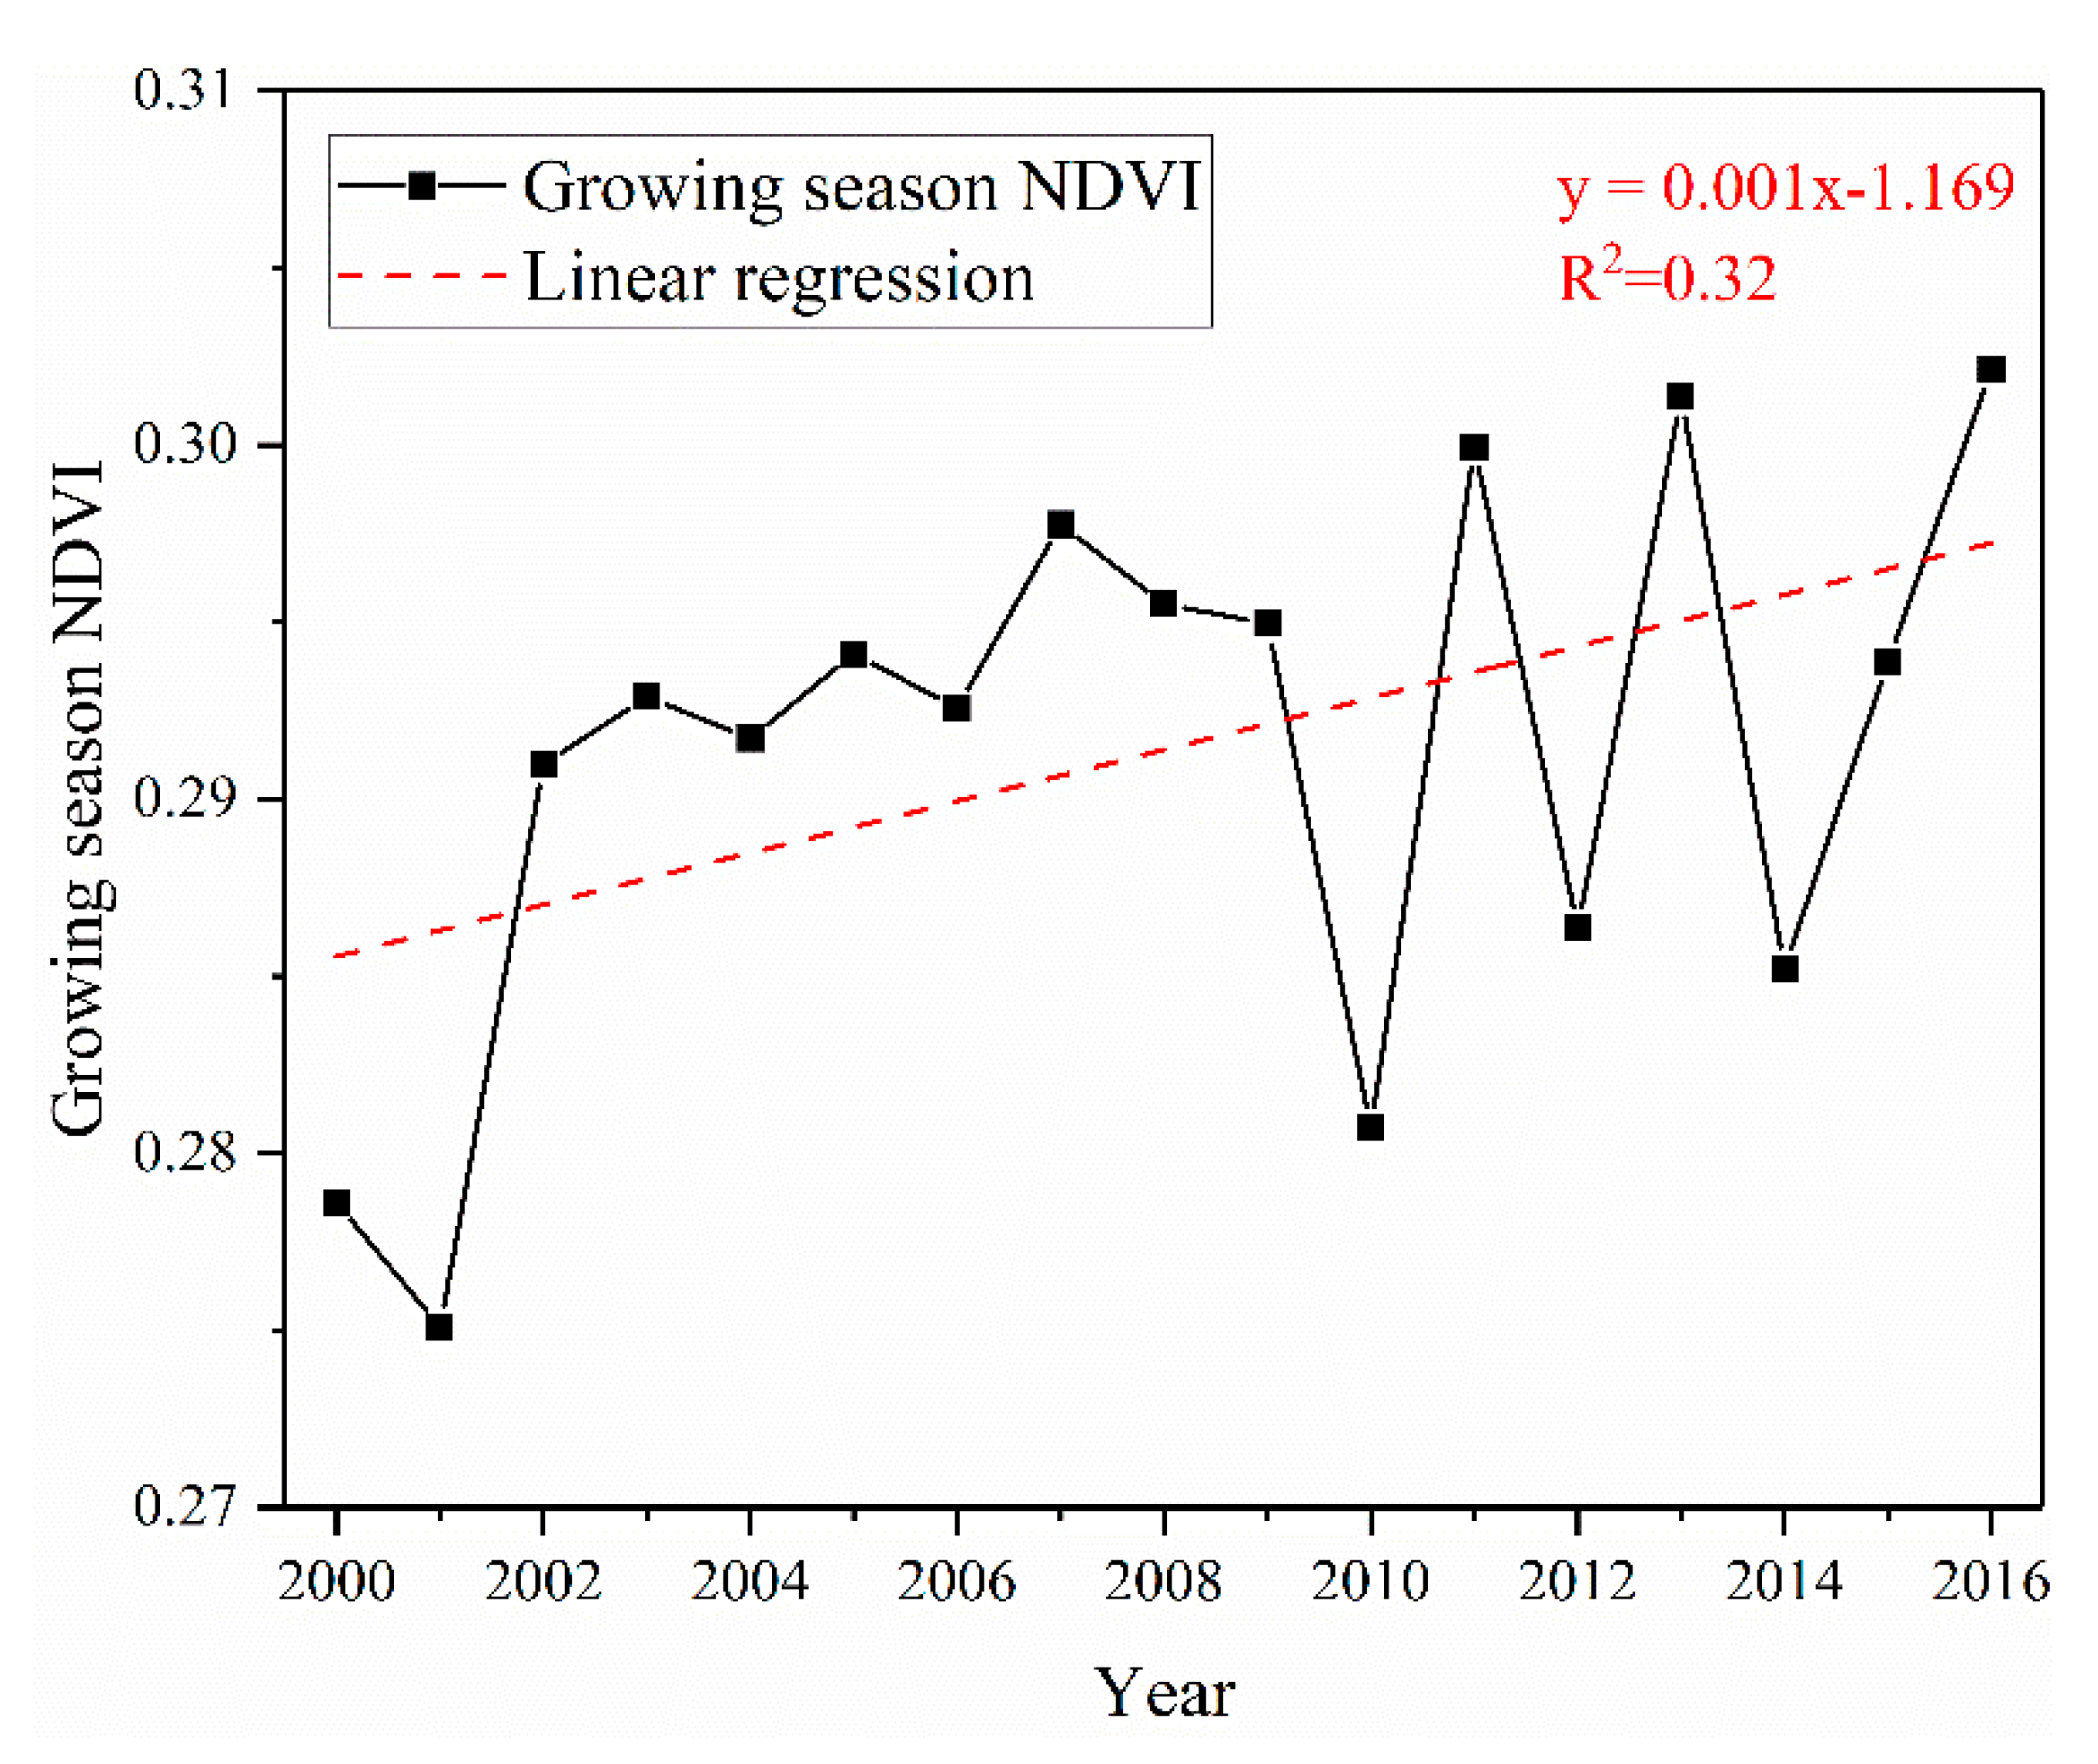
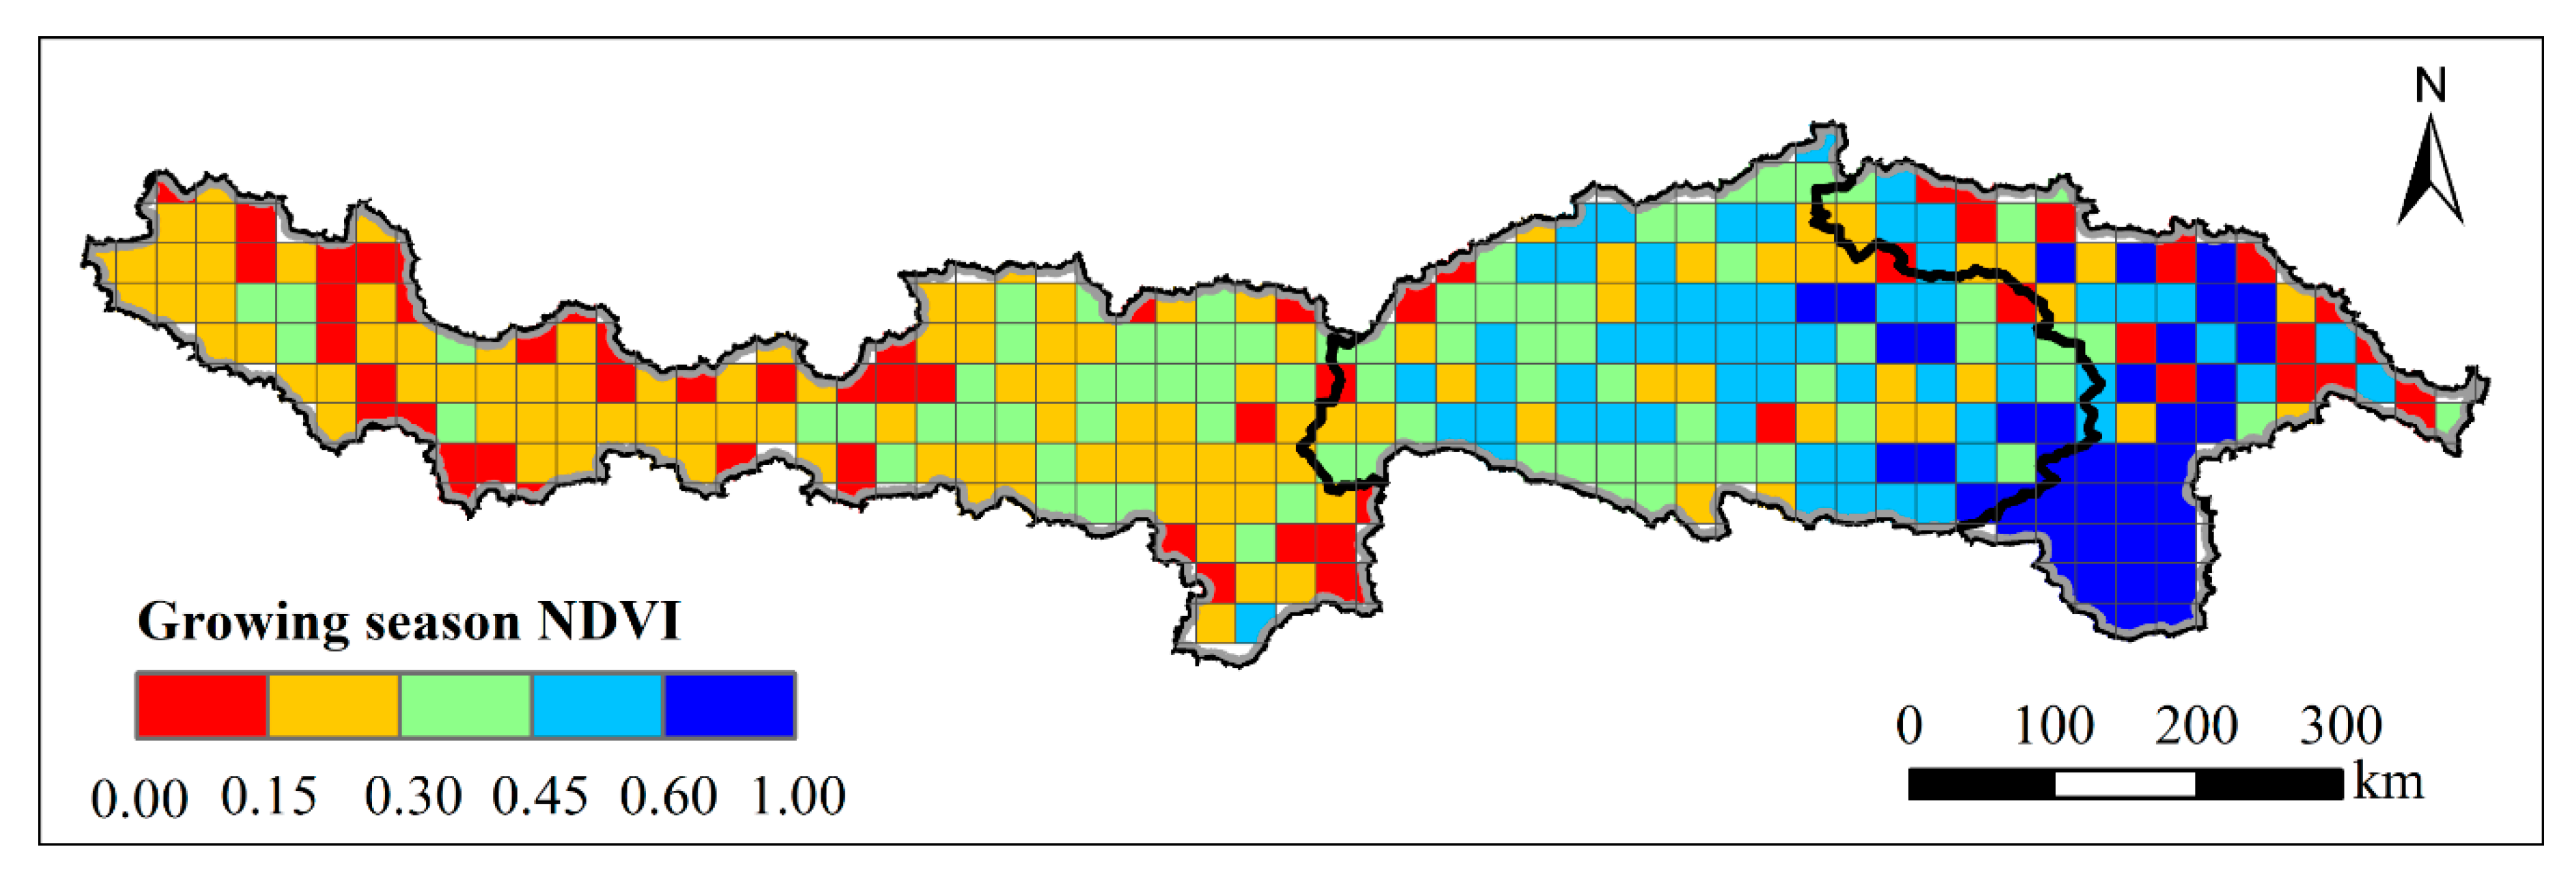
3.1.1. Temporal and Spatial Variations

By averaging growing season NDVI values over all pixels, the linear regression model was used to identify the vegetation temporal variation since 2000. As shown in Figure 2, the growing season NDVI showed a significantly greening trend (Zc = 2.31, p < 0.05) with an increasing rate of 0.001/year, implying that the YZR basin experienced an obvious vegetation greening and ecological improvement process since the new millennium. This result was in accordance with previous studies in other regions of the QTP. Xu et al. used the MODIS NDVI, concluding that the vegetation cover was improving from 2003 to 2014 in the Three-River Source Region [72]. Qu et al. pointed out that vegetation in the source region of the Yangtze River basin was increasing with the rate of 0.09%/year [73]. Zhang et al. applied the GIMMS NDVI and SPOT NDVI to investigate vegetation spatiotemporal variations in the middle Himalayas and demonstrated that the growing season vegetation showed a significantly increasing trend after 2000 [74]. Although vegetation greening was significant with an increasing rate of 0.001/year from 2000 to 2016, the inter-annual fluctuation is relatively greater, especially from 2009 to 2016. The highest value of the growing season NDVI was 0.302, occurring in 2016, which was 0.011 higher than the multi-year average NDVI (0.291), followed by 0.301 in 2013 and 0.300 in 2011. The lowest value of the growing season NDVI appeared in 2001 with a value of 0.275 (0.018 less than the multi-year average value), which can be attributed to the severe drought event in the early spring of 2001 in the Nyingchi and Shigatse county according to Tibet natural disaster statistics from the Third Pole Environment Database [75].
Considering the spatial distribution of vegetation, the growing season NDVI values increased gradually from the upstream (northwest) to the downstream (southeast) (Figure 3). Statistical results indicated that the growing season NDVI values of >0.45 accounted for 18.29% area of the YZR basin, most of which appeared in the downstream region, while NDVI values of <0.15 accounted for 25.14% area of the whole basin, most of which appeared in the upstream region. Obviously, there are great geographical differences of growing season NDVI in the YZR basin, which is closely associated with the diverse climate conditions [76,77]. The Indian monsoon is weakened by barrier effect of the mountains, resulting in precipitation and surface air temperature decreasing from the southeast to the northwest of the YZR basin [78], which is consistent with the vegetation spatial distribution pattern (Figure 3), implying that the water and heat characteristics have a considerably important role in vegetation cover. In addition, the vegetation spatial distribution is also determined by vegetation types [79], which was illustrated by the combination of Figure 1c and Figure 3 in the YZR basin. The upstream region is mainly characterized by sparse alpine grassland and the midstream mainly consists of shrub-grassland, while the downstream region is composed of forest indicating the best vegetation cover condition.

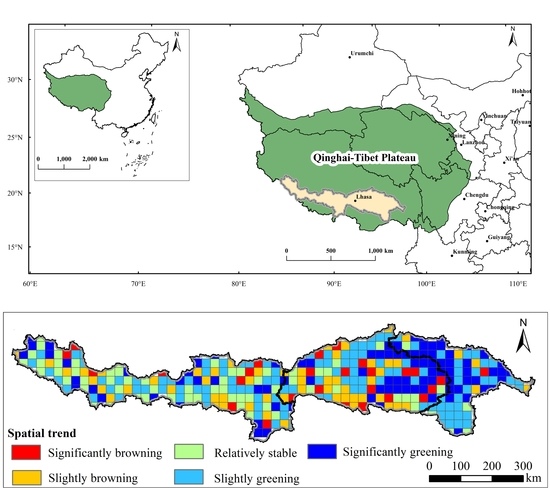
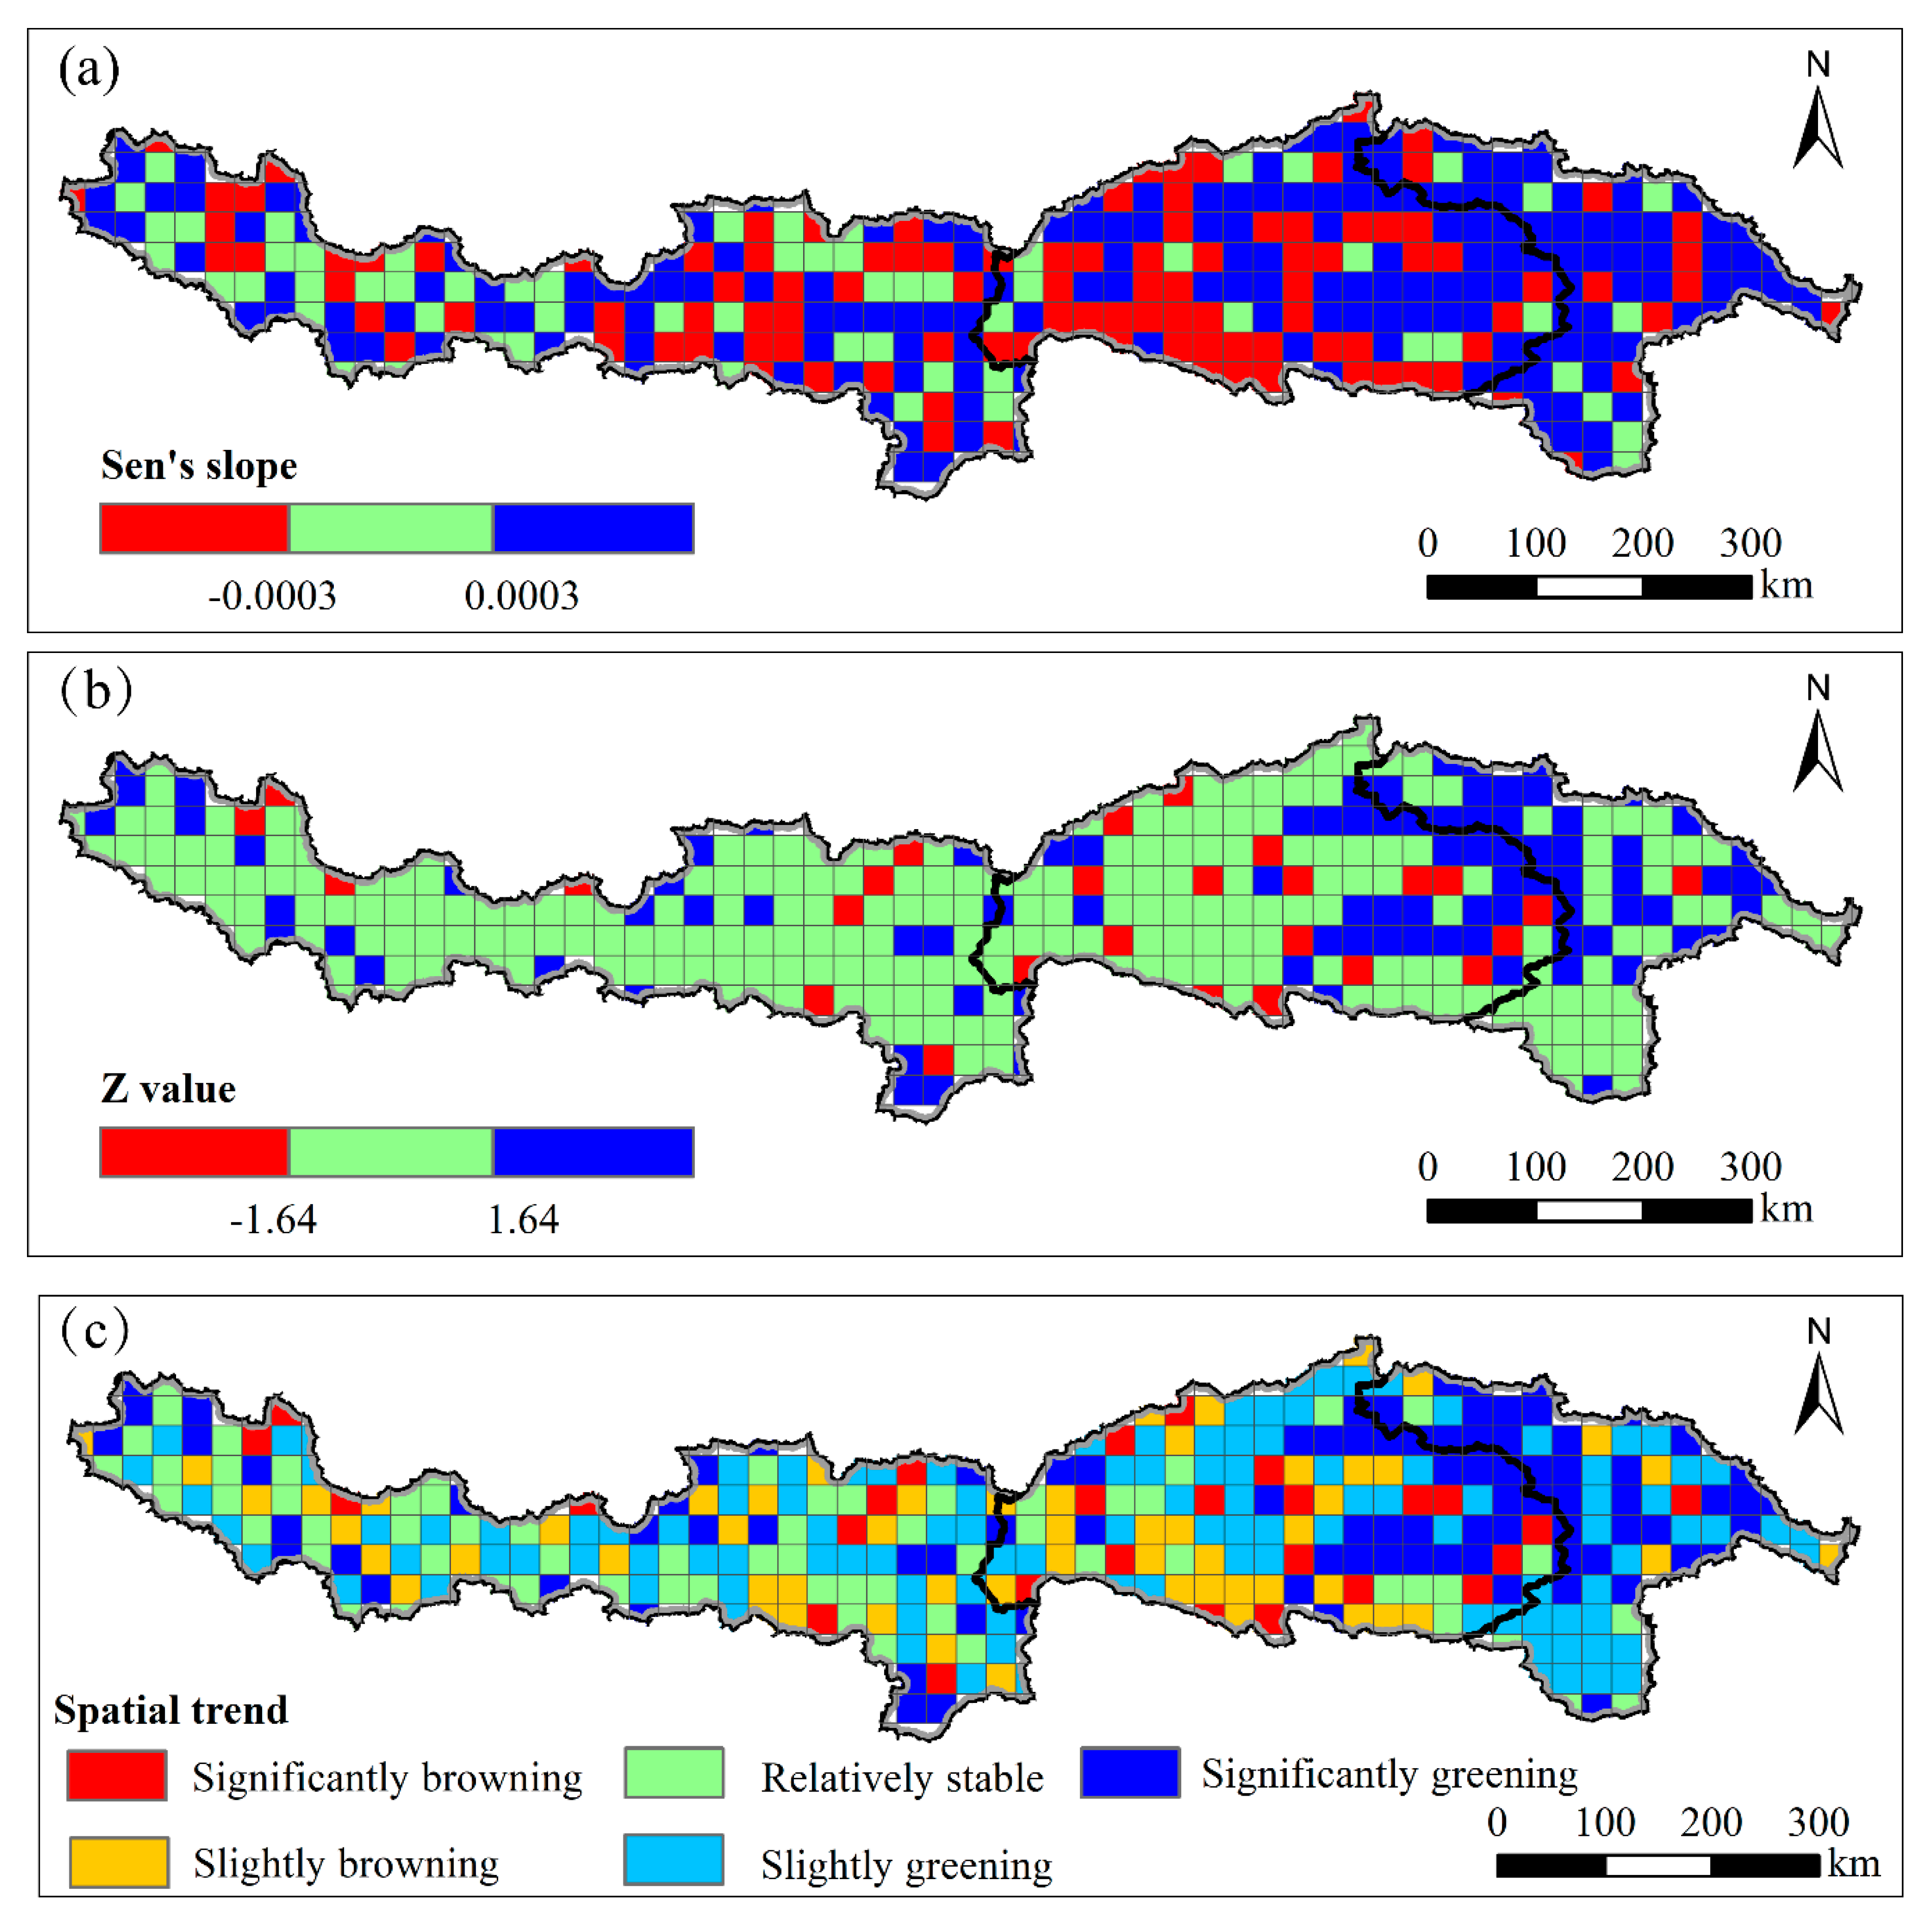
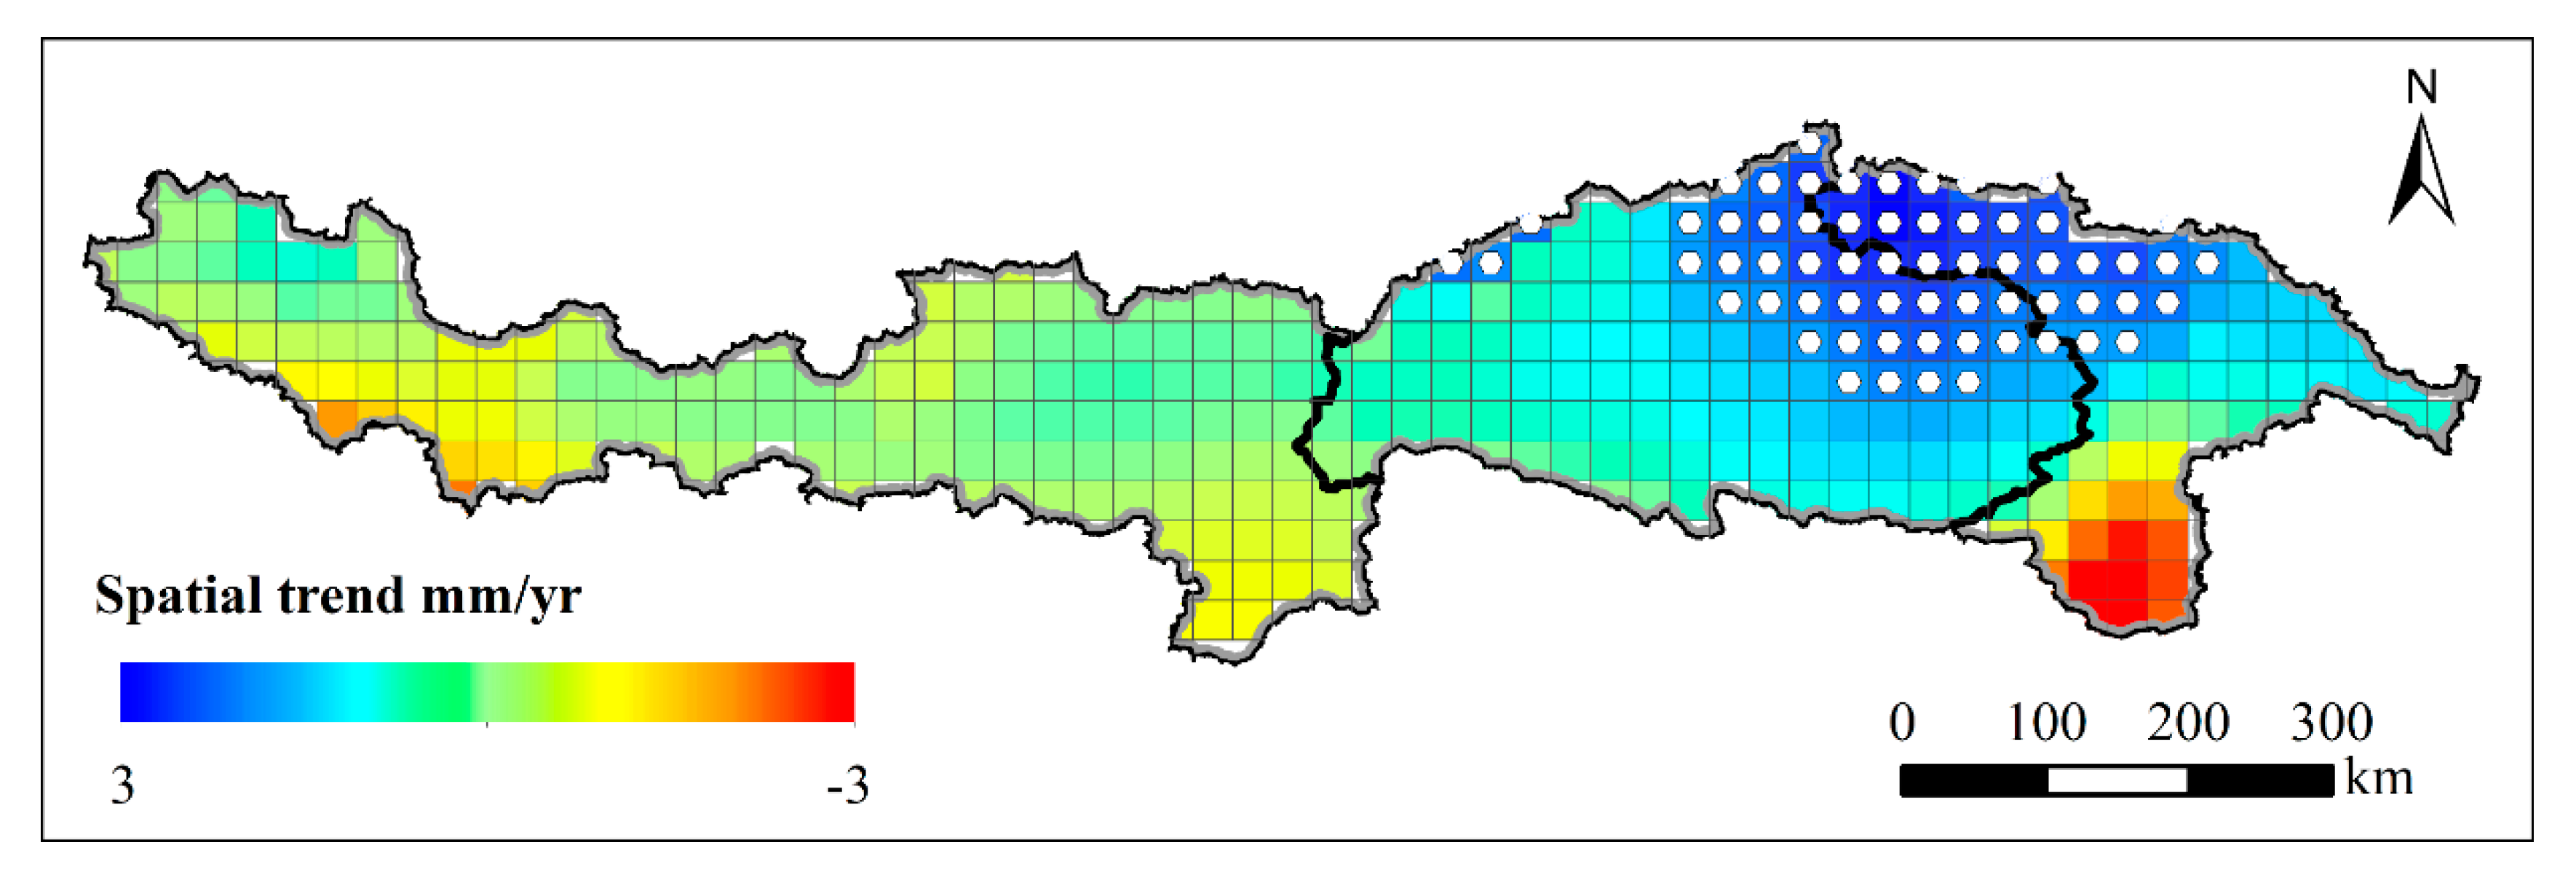
3.1.2. Spatial Trend Variations

By combining Sen’s slope (Figure 4a) and the Mann–Kendall significance test (Figure 4b), the growing season NDVI variation trend was classified into five categories: significantly browning, slightly browning, relatively stable, slightly greening and significantly greening (details in Table 1) and its spatial variation trend is shown in Figure 4c. The proportion of greening regions (including slightly and significantly greening) was over 50% of the YZR basin, which was consistent with the significantly greening tendency at the river basin scale estimated by the linear regression model in Section 3.1.1. It is worth emphasizing that regions with a significantly greening trend accounted for 25.4% area of the basin, mainly concentrated in the Nyang River sub-basin (midstream) and Parlung Tsangpo River sub-basin (downstream). Although Sun et al. used the GIMMS NDVI from 1982 to 2010 to study the vegetation dynamics in the YZR basin and concluded that only the Nyang River sub-basin (midstream) exhibited a significantly greening trend [80], another significantly greening region, the Parlung Tsangpo River sub-basin located in the downstream, was identified in this study. In contrast, the browning regions (including significantly browning and slightly browning) accounted for <25% area of the YZR basin, which were primarily distributed in the urbanized cities of the midstream, implying that human activities played an important role in the vegetation greening process. Regions with a relatively stable NDVI occupied 18.3% area of the basin, which mostly appeared as small and fragment patches in the upstream.

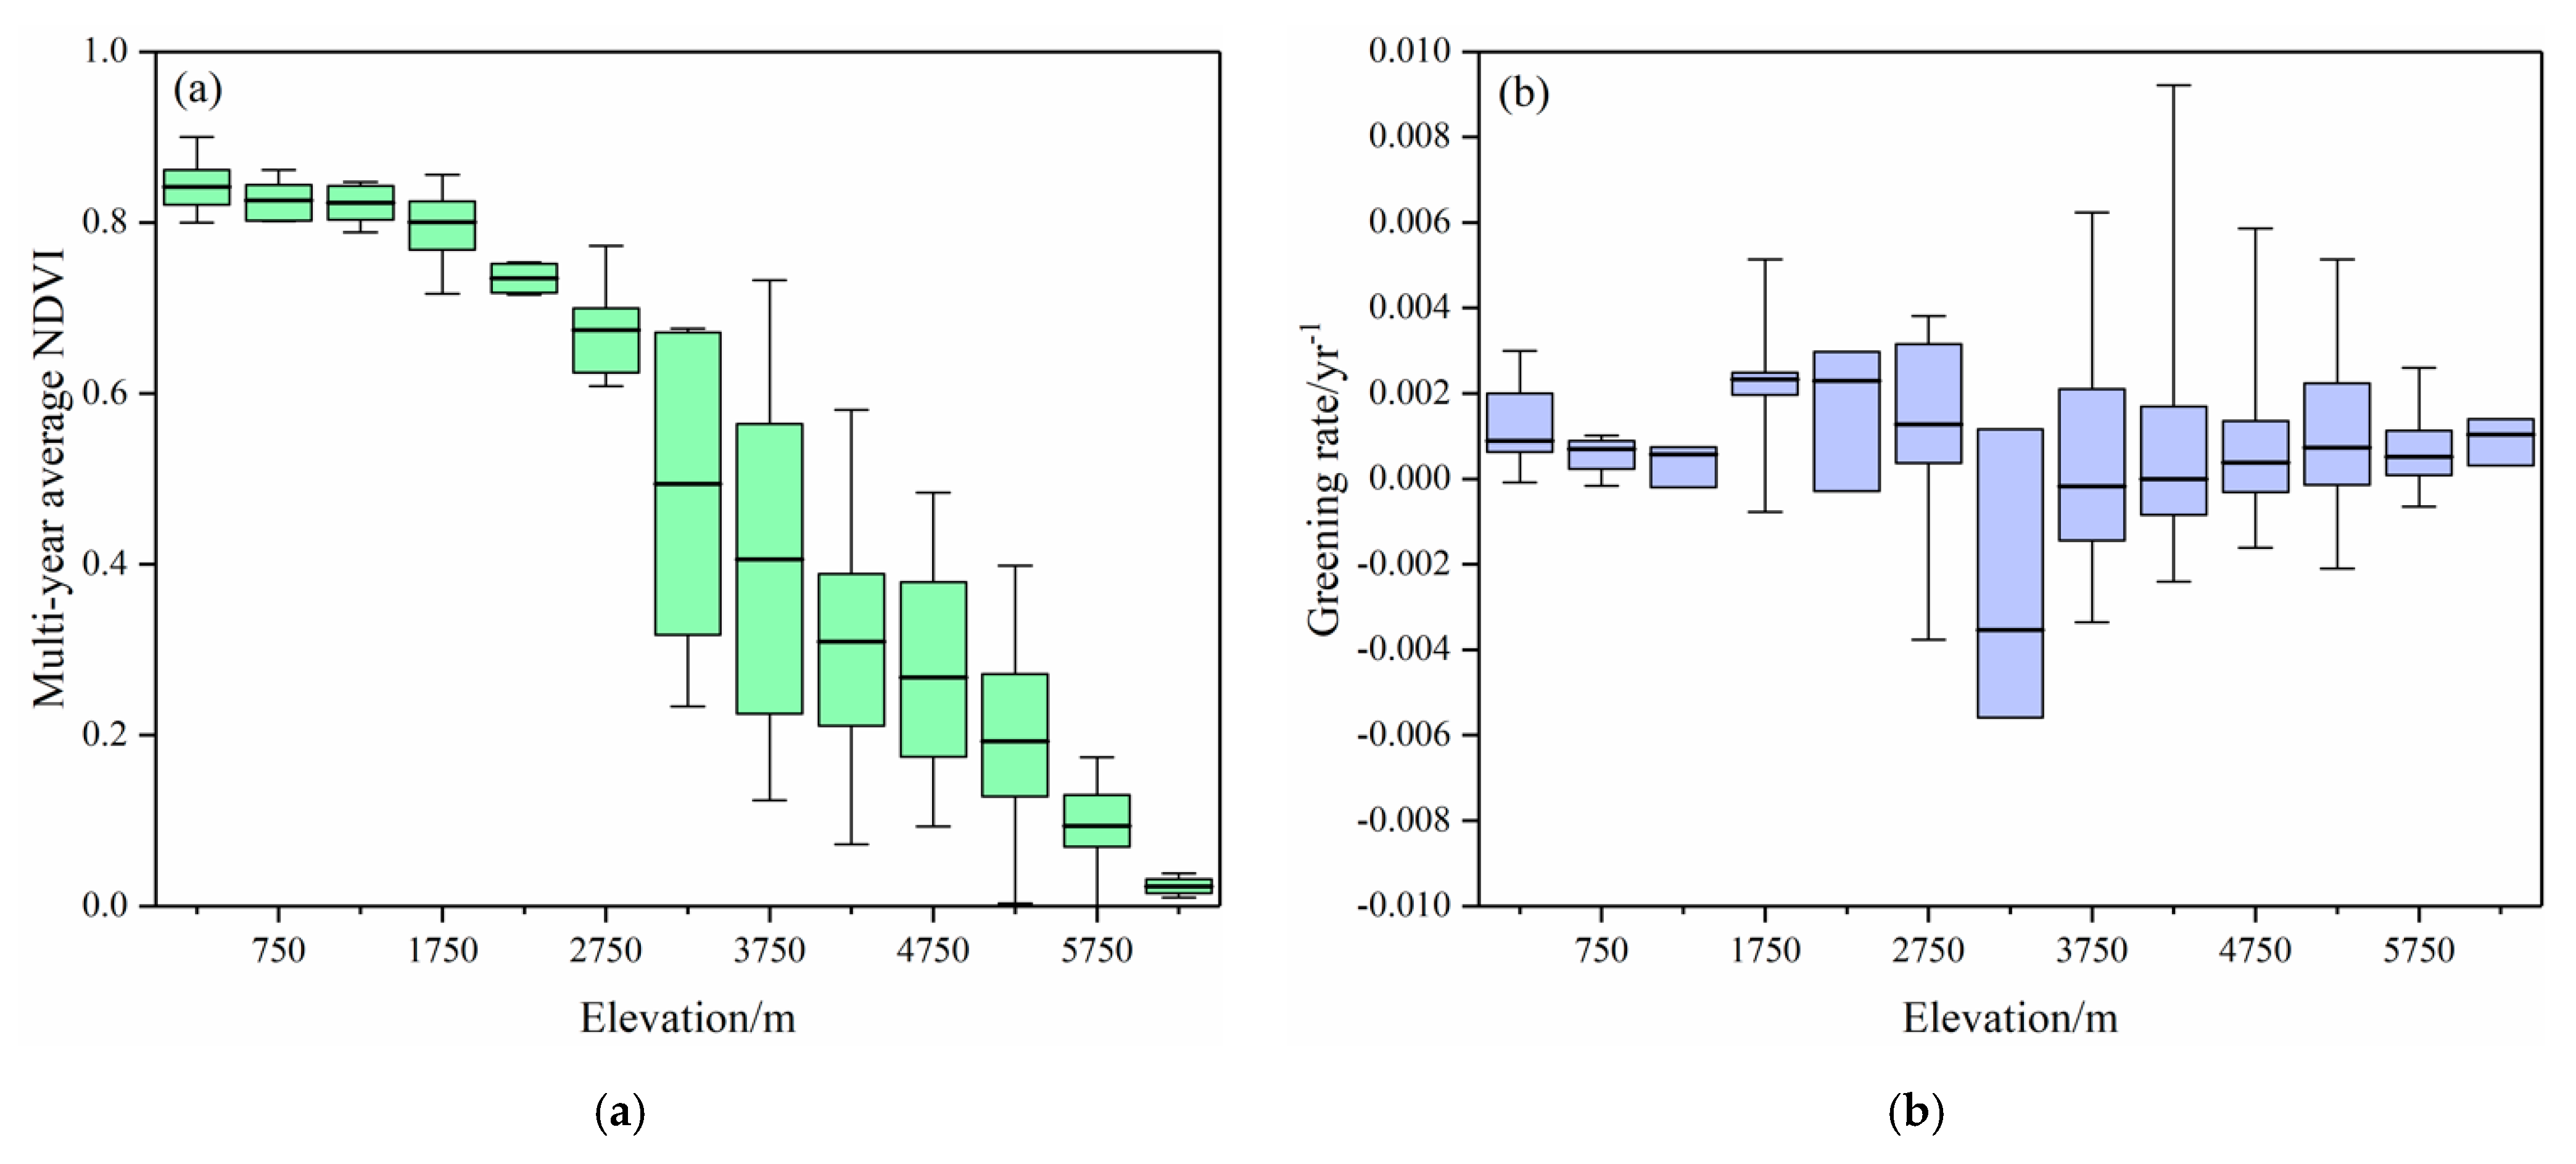
3.1.3. Elevation-Dependent Vegetation Dynamics

The pattern of Elevation Dependent Warming (EDW) is more evident in high-mountain regions, which indicated that these regions experienced more rapid warming [81]. The EDW pattern has great impacts on vegetation variations along the elevation gradient. Therefore, it is of great importance for ecological restoration and conservation of the YZR basin with a complex topography (173–7141 m, Figure 1b) to have a deep knowledge of vegetation variation patterns according to elevation. Elevation in this study was divided into intervals of 500 m, and the interval medians were used to represent corresponding intervals. For example, 250 on the x-axis represented the elevation belt of (0, 500), 750 in x-axis represented the elevation belt of (500, 1000), and so on. The elevation dependency of vegetation cover is shown in Figure 5a. The highest growing season NDVI (>0.800) occurred at the elevation belts of <1250 m, corresponding to the downstream region, which also indicated the better vegetation condition in the downstream region, whereas the growing season NDVI decreased with the elevation rising in these belts. Regarding the elevation belts of >1250 m, the growing season NDVI decreased dramatically as the elevation increased, implying an important role of elevation in the spatial distribution of vegetation. Consistent with the decreasing pattern of the growing season NDVI along with the elevated altitude, the vegetation types change from thick forest to sparse vegetation [82]. The largest decrease of the growing season NDVI between adjacent elevation belts occurred from 2750 m to 3250 m, which was attributed to an important transition of vegetation types from the forest in low-altitude regions to alpine grassland in high-altitude regions [83]. The above analyses further emphasize the importance of investigating spatial variation characteristics of the vegetation in the YZR basin.
However, the greening rate of the vegetation exhibited a much more complicated relationship with elevation, which is shown in Figure 5b. The greening rates slightly decreased from elevation belts of 250 m to 1250 m, which was consistent with the NDVI variation within the same elevation belts. Nevertheless, the greening rate exhibited a lifting breakpoint with the highest greening rate of 0.0023/year at the elevation belt of 1750 m and continued to decrease from elevation belts of 2250 m to 3250 m. Similarly, a distinct variation characteristic occurred at the elevation belt from 3000 m to 3500 m, exhibiting the largest declining magnitude between adjacent elevation belts and the only negative greening rate of −0.0037/year, which is consistent with the largest decrease of growing season NDVI at this elevation belt as demonstrated above (Figure 5a). This may be attributed to the urban expansion and agricultural activities owing to the main population centers and crop production region in the elevation belt [84]. Climbing to the transition elevation belt of 3250 m, the greening rate showed a contrary elevation dependency, which increased with the rise of elevation. A more rapid warming tendency is evident in high-altitude regions [85], and the YZR basin has also experienced an evident warming process with a rate of 0.03/year (Supplementary Section 1). The water and energy cycle in this region have become more active and intensive, resulting in glaciers melting and snow cover thawing [86], snow line rising [87], and atmosphere water content enhancement [88], which can provide materials and living space for vegetation recovery and region greening. This may, to some extent, explain the greening rate increasing with elevation lifting above 3500 m. Moreover, although the greening rate decreased with elevation increasing at the lower elevation belts (from 250 m to 3250 m) and increased with elevation increasing at the higher elevation region (above 3500 m), the mean greening rate of the lower elevation belts was still higher than that at the higher elevation belts, which corroborated the greening tendency in the downstream region.

3.2. Responses of Vegetation Dynamics to Climate Change

The YZR basin has become warmer and drier according to the data shown in Supplementary Section 1, while precipitation and surface air temperature directly drive the water and energy cycle and further affect the vegetation dynamics. Therefore, it is necessary for the YZR basin, given its complex geographical environment to investigate vegetation responses to these main climate factors.

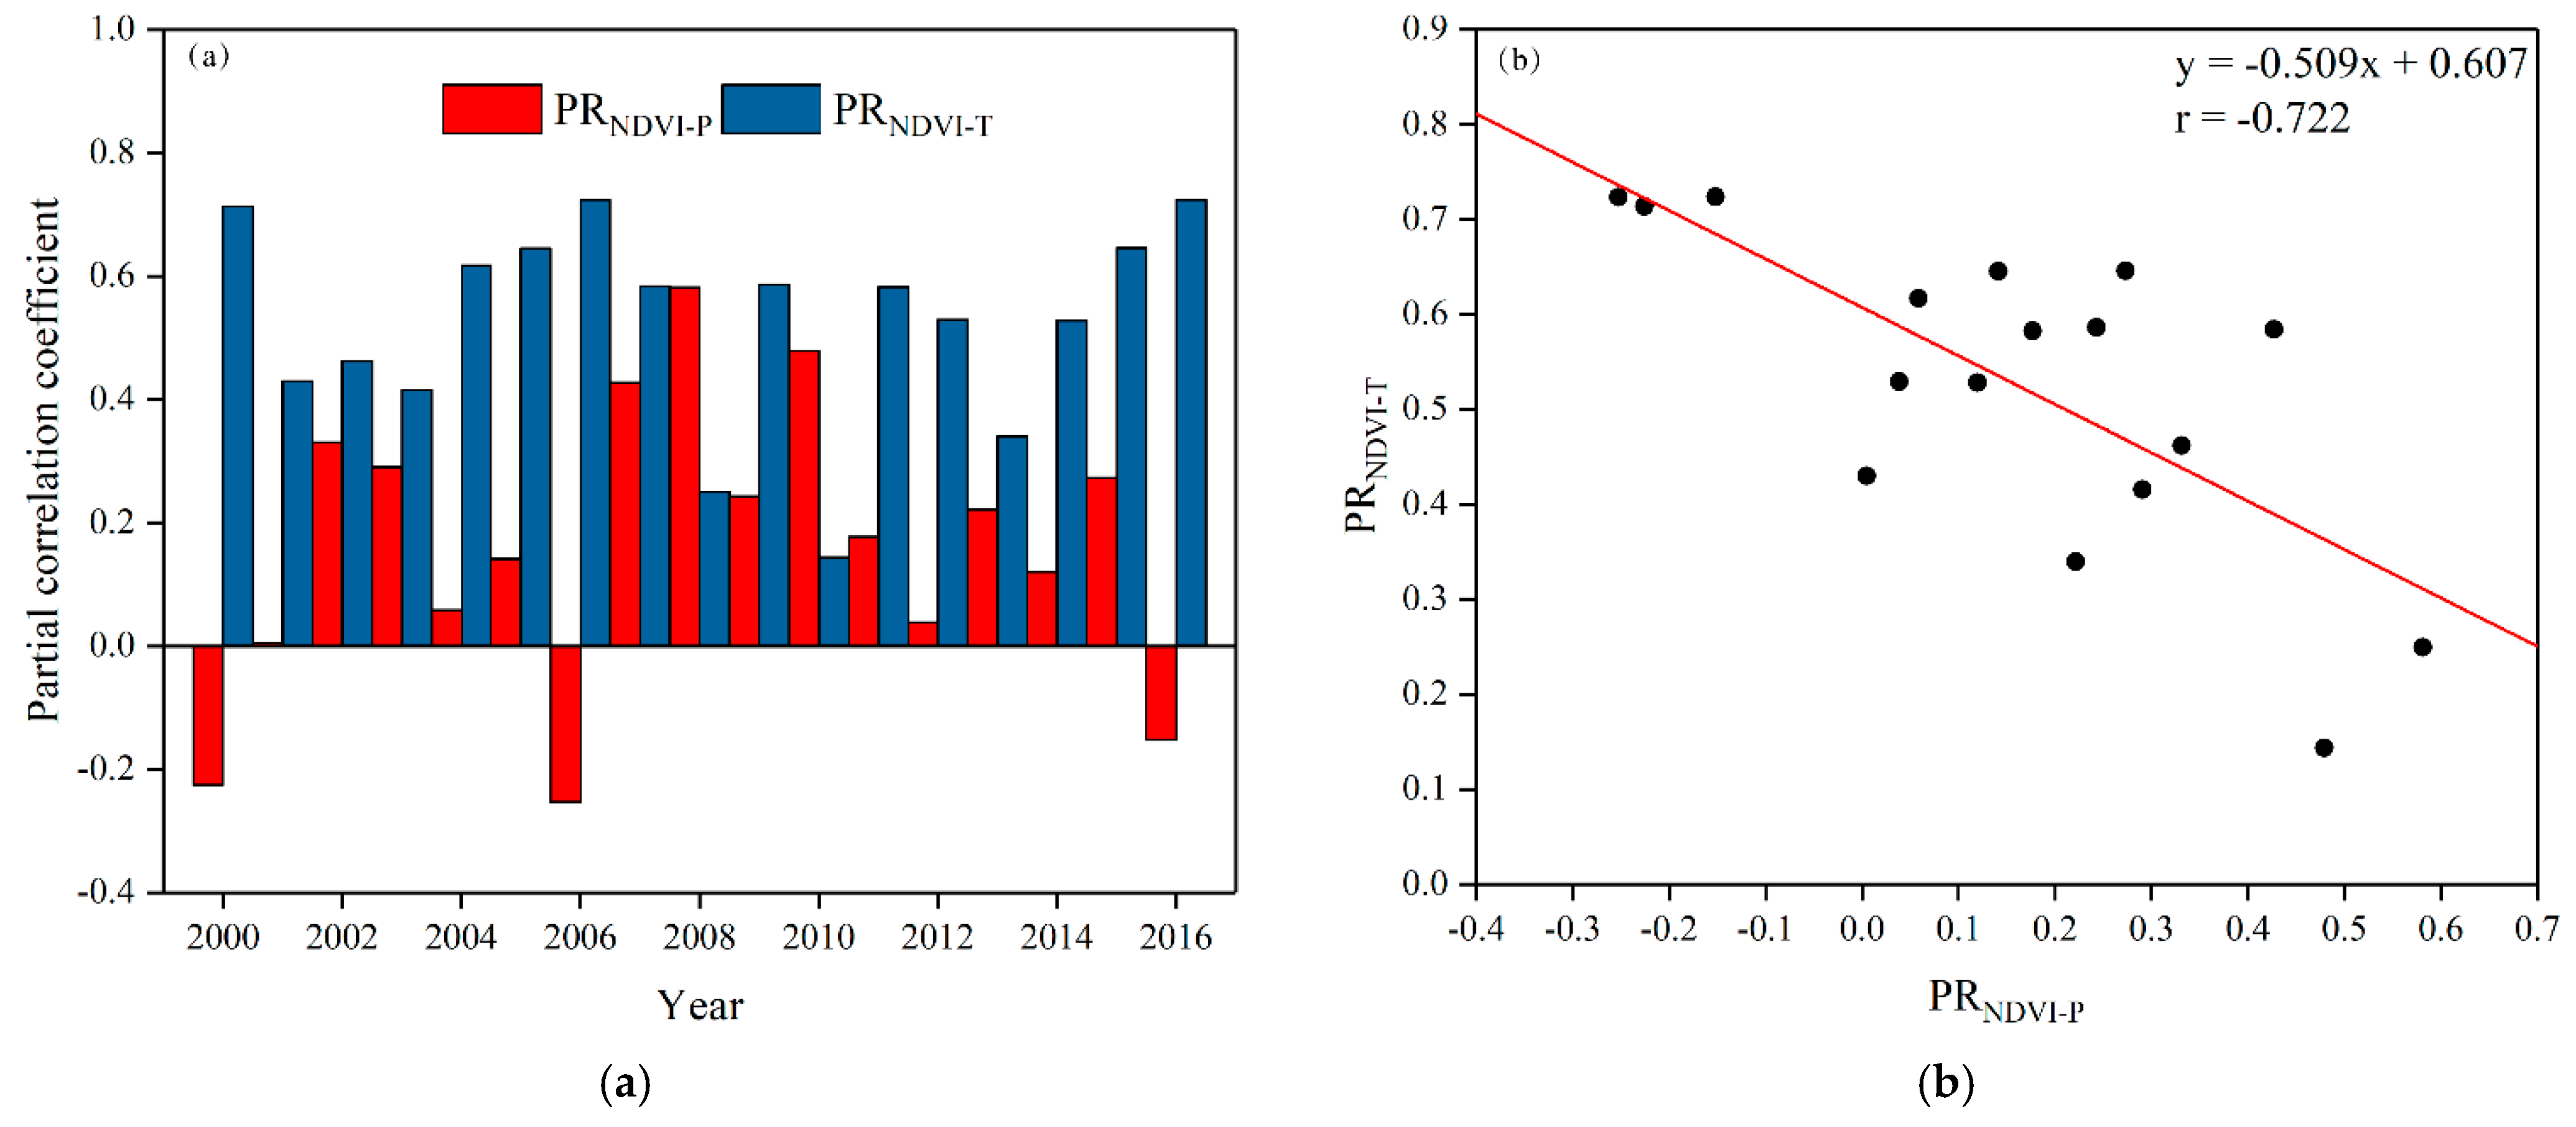
3.2.1. Temporal Response

Pearson correlation coefficient was applied to quantitatively analyze vegetation responses to annual precipitation and surface air temperature during the period 2000–2016 in the YZR basin, and results are shown in Table 2. The growing season NDVI was significantly positively correlated with surface air temperature (RNDVI-T = 0.472, p < 0.05) but negatively correlated with precipitation (RNDVI-P = −0.339, p > 0.05), which indicated that the surface air temperature was more responsible for the vegetation greening since 2000. Similarly, Zhu et al. indicated that the vegetation greening represented by leaf vegetation index (LAI) in the high-altitude regions, such as the QTP, was more attributed to global warming [4]. Under the background of global warming, the energy balance has been altered greatly, which is more evident in the YZR basin distributed with extensive glaciers and snow cover [89]. Moreover, the snow melting process in this region will produce more shallow moisture and further promote vegetation greening [90,91,92]. In addition, the rising temperature has extended the length of the growing season, promoting vegetation photosynthesis [93], which is also an important reason for the vegetation greening in the YZR. However, the precipitation amount deduction may delay the vegetation phenology [94], which could partly explain the negative correlation between the growing season NDVI and precipitation. In addition, the negative effect of precipitation on the vegetation in this study could also be partly ascribed to the significantly increasing extreme precipitation events in the YZR basin [95,96].
As shown in Table 2, precipitation and surface air temperature in the growing season showed a strong relationship, with RP-T = −0.523, so it is necessary to eliminate the autocorrelation effect between precipitation and surface air temperature to examine the quantitative contribution of these two climate factors to the variation of vegetation. The partial correlation coefficient (PR) was used in this study and PRNDVI-P and PRNDVI-T were calculated yearly according to Equation (3). As shown in Figure 6a, PRNDVI-P was between −0.253 and 0.582 with an average value of 0.162, while the partial correlation coefficient between NDVI and surface air temperature (PRNDVI-T) was 0.143–0.724, with an average value of 0.525. The proportion of PRNDVI-T > 0.600 accounted for 52.9%, while partial correlation coefficients between NDVI and precipitation were rather lower and negative values occurred in the year of 2000, 2006, and 2016. This reemphasized the more attributable role of the surface air temperature for improving and enhancing the vegetation coverage in the YZR basin.
Additionally, there was a strongly negative correlation between PRNDVI-P and PRNDVI-T (Figure 6b) with the correlation coefficient of −0.722, indicating the synergy interaction of vegetation dynamic variations and climate factors. As shown in Figure 6a, PRNDVI-T began to decrease initially, and then increased from 2003 to 2006, after which PRNDVI-T showed a fluctuating trend from 2007 to 2013, during which it reached the minimum value of 0.143 in 2010. From 2014 to 2016, the PRNDVI-T rebounded quickly and reached the maximum value of 0.724 in 2016. The PRNDVI-P exhibited an opposite changing pattern corresponding to the respective variation period of the surface air temperature and reached the peak value of 0.582 in 2008.

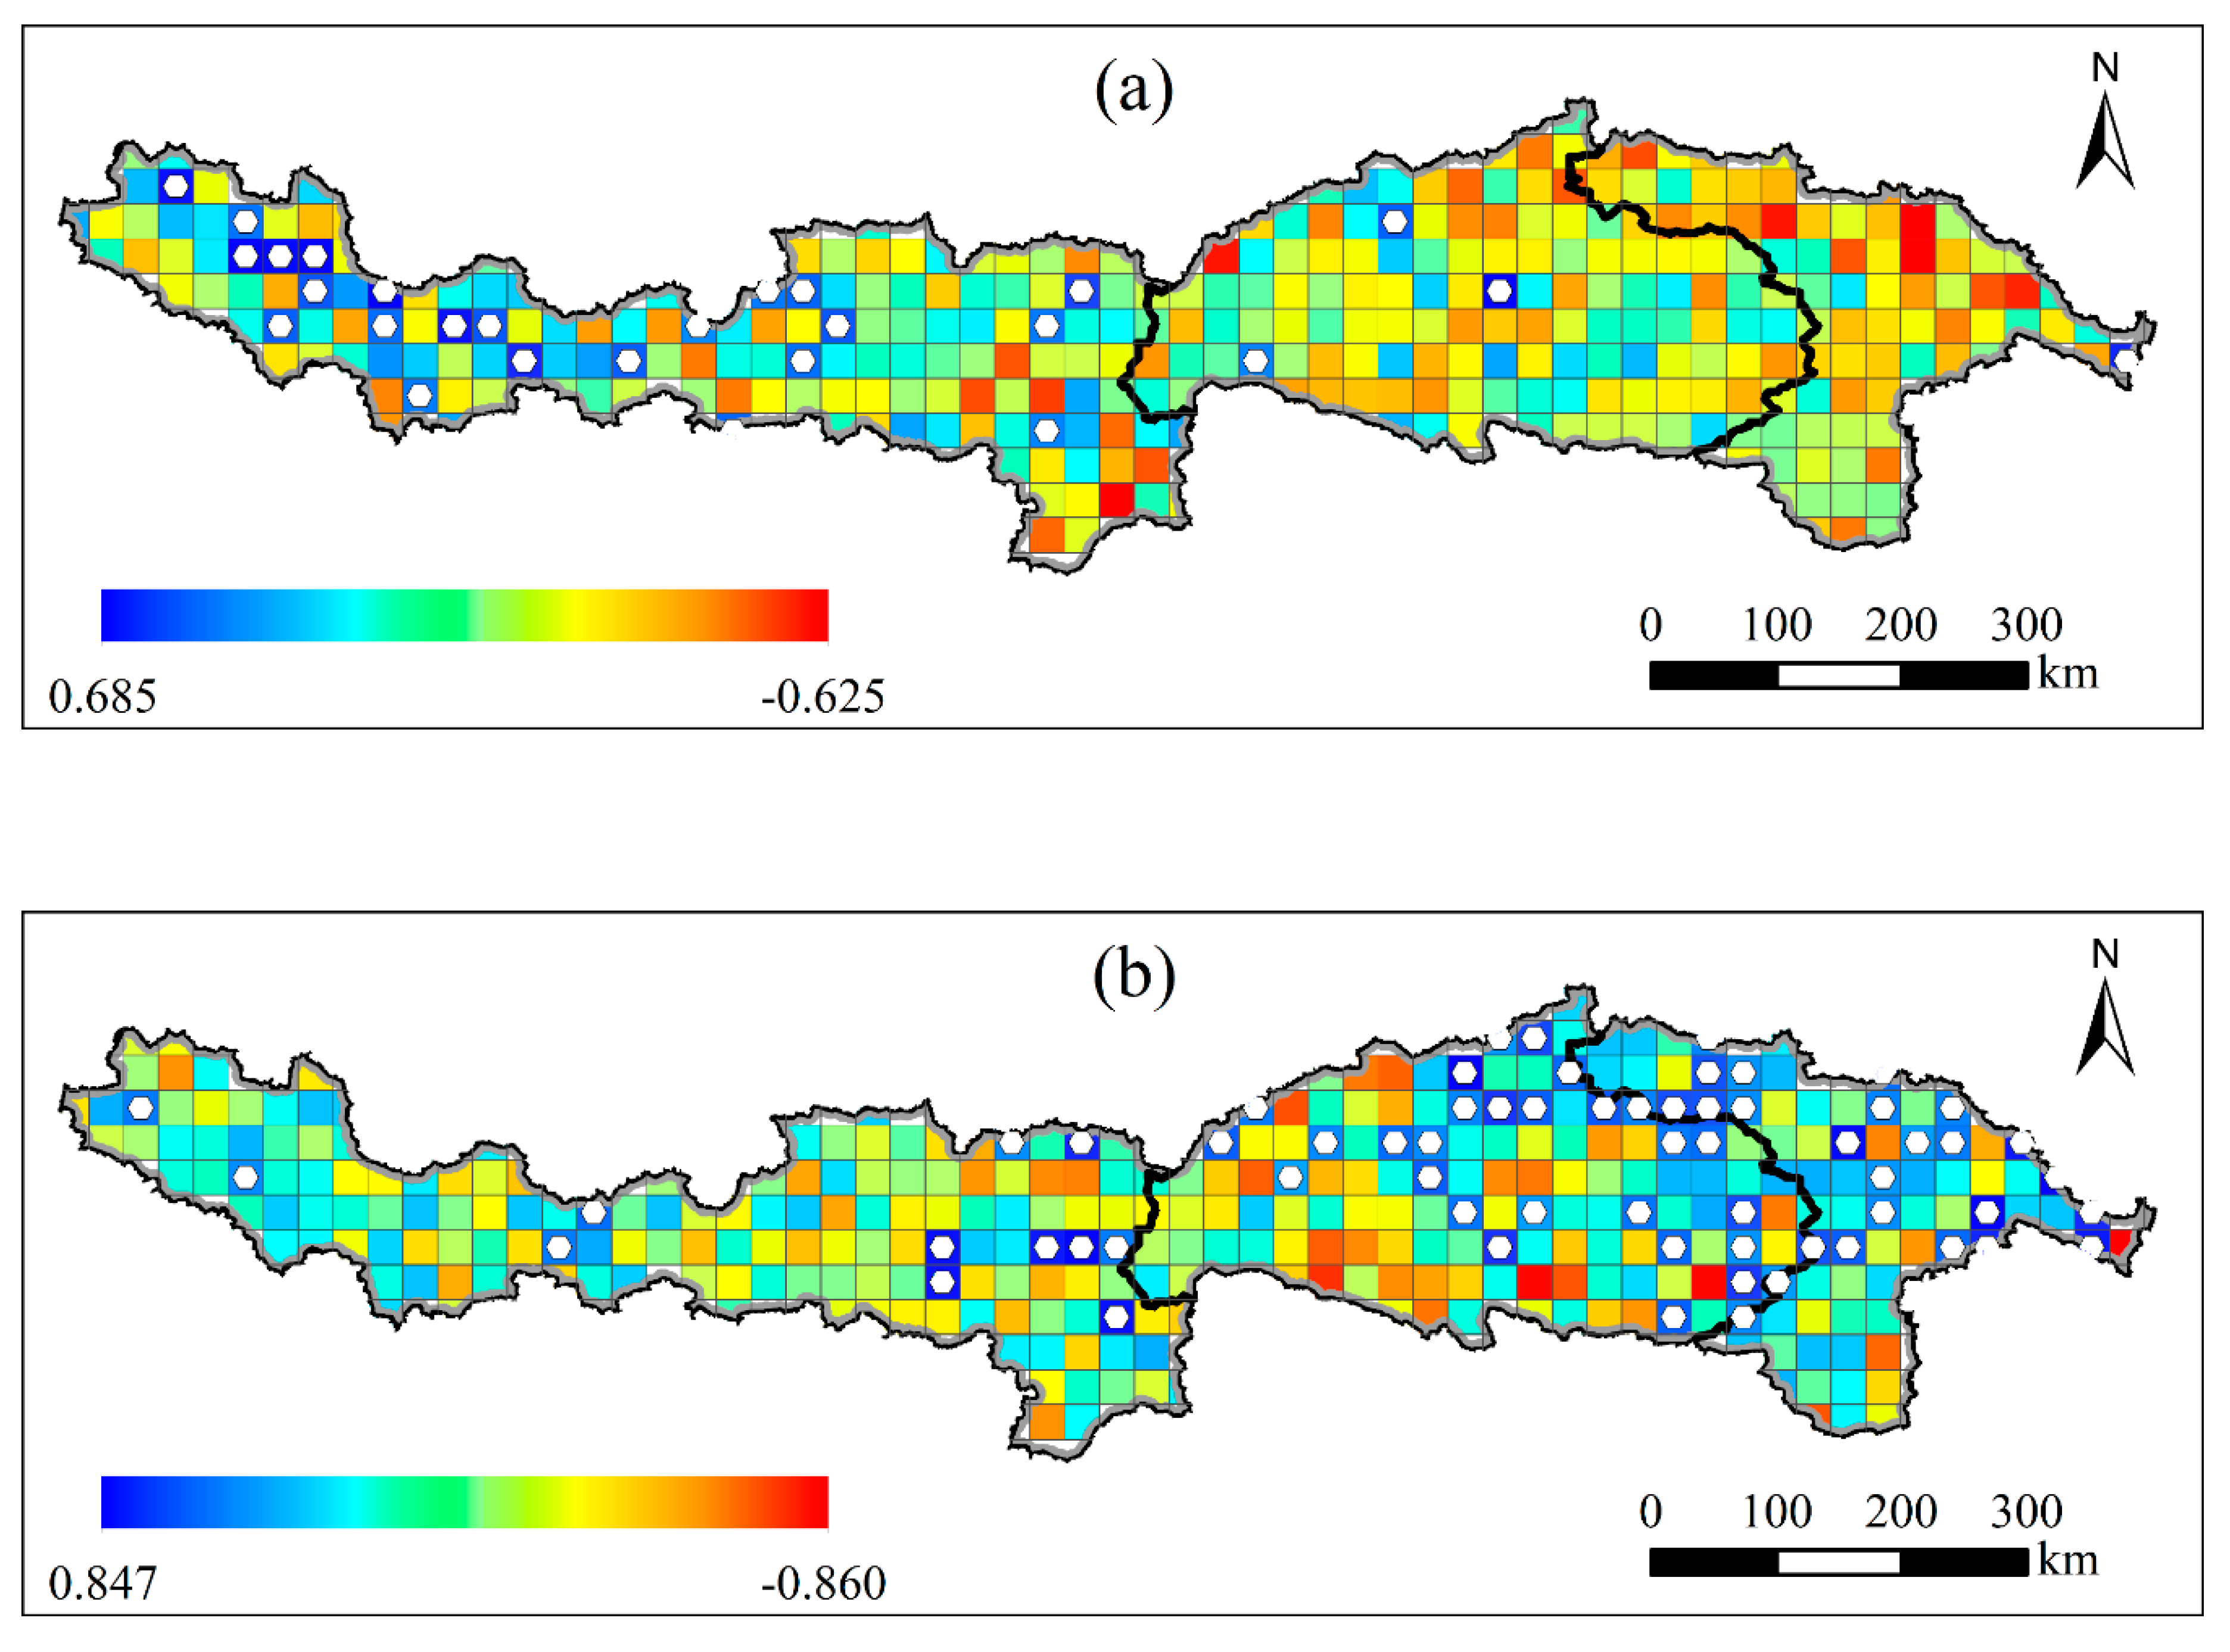
3.2.2. Spatial Response

Regarding spatial correlation, great heterogeneity of the correlation between the growing season NDVI and precipitation (Figure 7a) and surface air temperature (Figure 7b) were illustrated. Regions with a positive correlation coefficient between the growing season NDVI and surface air temperature were located in the Nyang River sub-basin (midstream) and Parlung Tsangpo River sub-basin (downstream), where the vegetation experienced a significantly greening tendency (Figure 4c). As mentioned above, the sources of these sub-basins are distributed with extensive glaciers and snow cover, and more shallow soil moisture from warming-induced glacier and snow melting are beneficial for vegetation growth. Li et al. also concluded that soil moisture at the depth of 0−10 cm from the GLDAS NOAH showed an increasing trend in the YZR basin since the 1970s [97]. Regions with a negative correlation coefficient between the growing season NDVI and surface air temperature were relatively sporadically distributed in the upstream.
Similar to the contrary temporal variation patterns of PRNDVI-P and PRNDVI-T (Figure 6), the spatial distribution patterns of correlation coefficients between the growing season NDVI and precipitation were also opposite to those between the growing season NDVI and surface air temperature. That is, regions with a positive correlation coefficient between the growing season NDVI and precipitation were mainly concentrated in the arid and semi-arid upstream. Annual precipitation of less than 300 mm in the upstream limits vegetation growth because moisture masses from the Indian Ocean are blocked by many mountains [37]. Therefore, precipitation from atmospheric moisture is necessary to support regional ecosystem stability in the arid and semi-arid upstream region [98], which is responsible for the positive correlation in the upstream region.

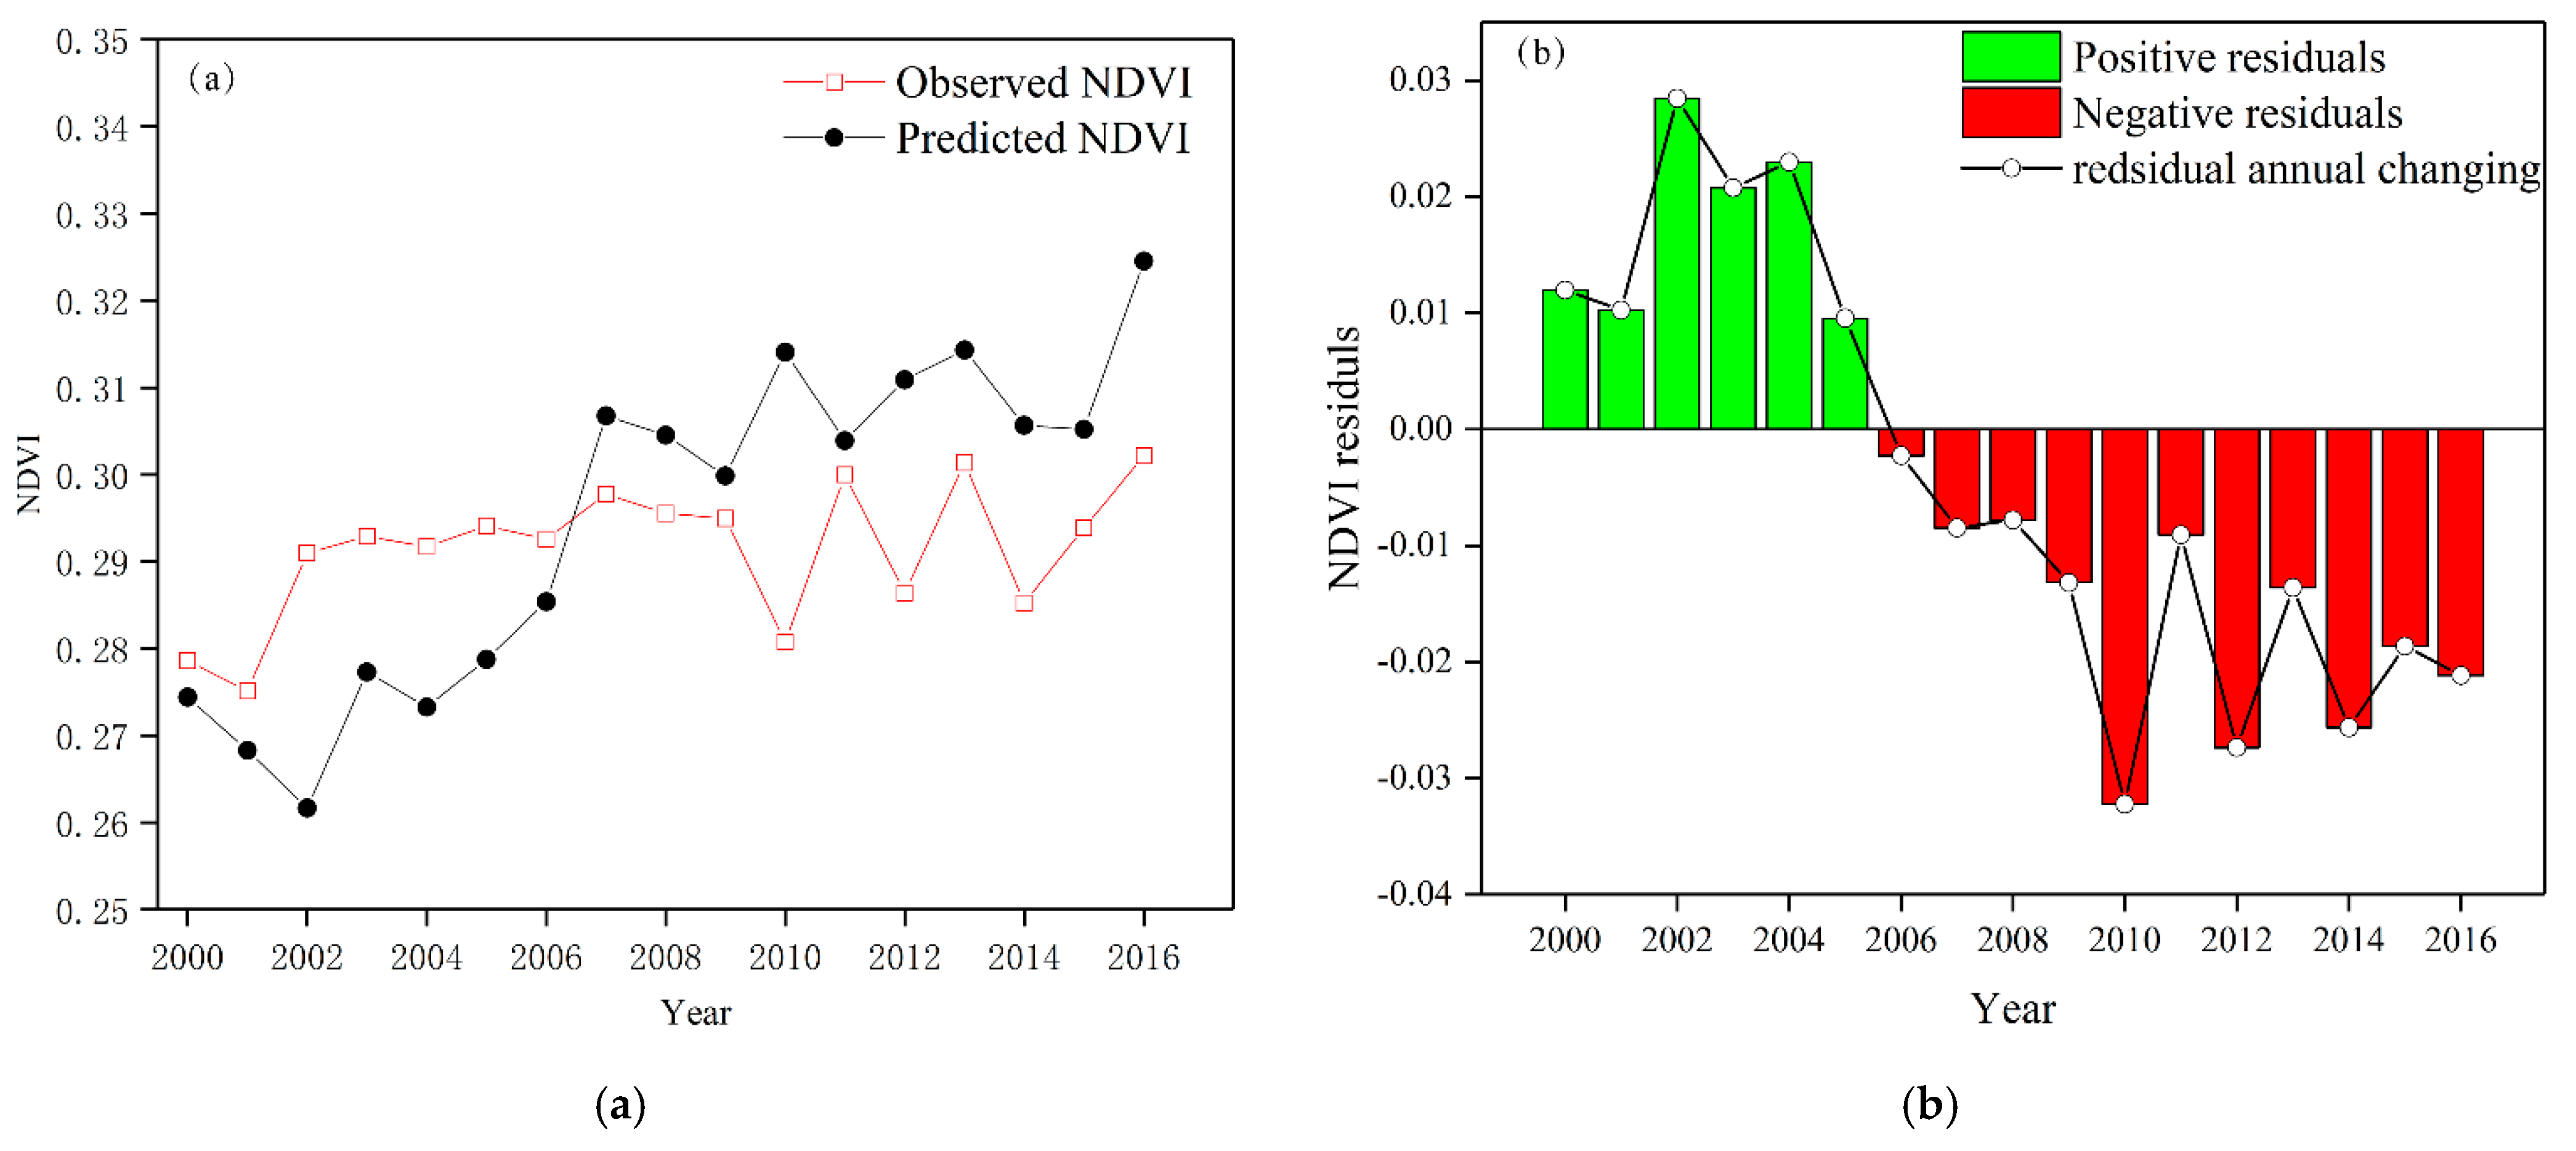
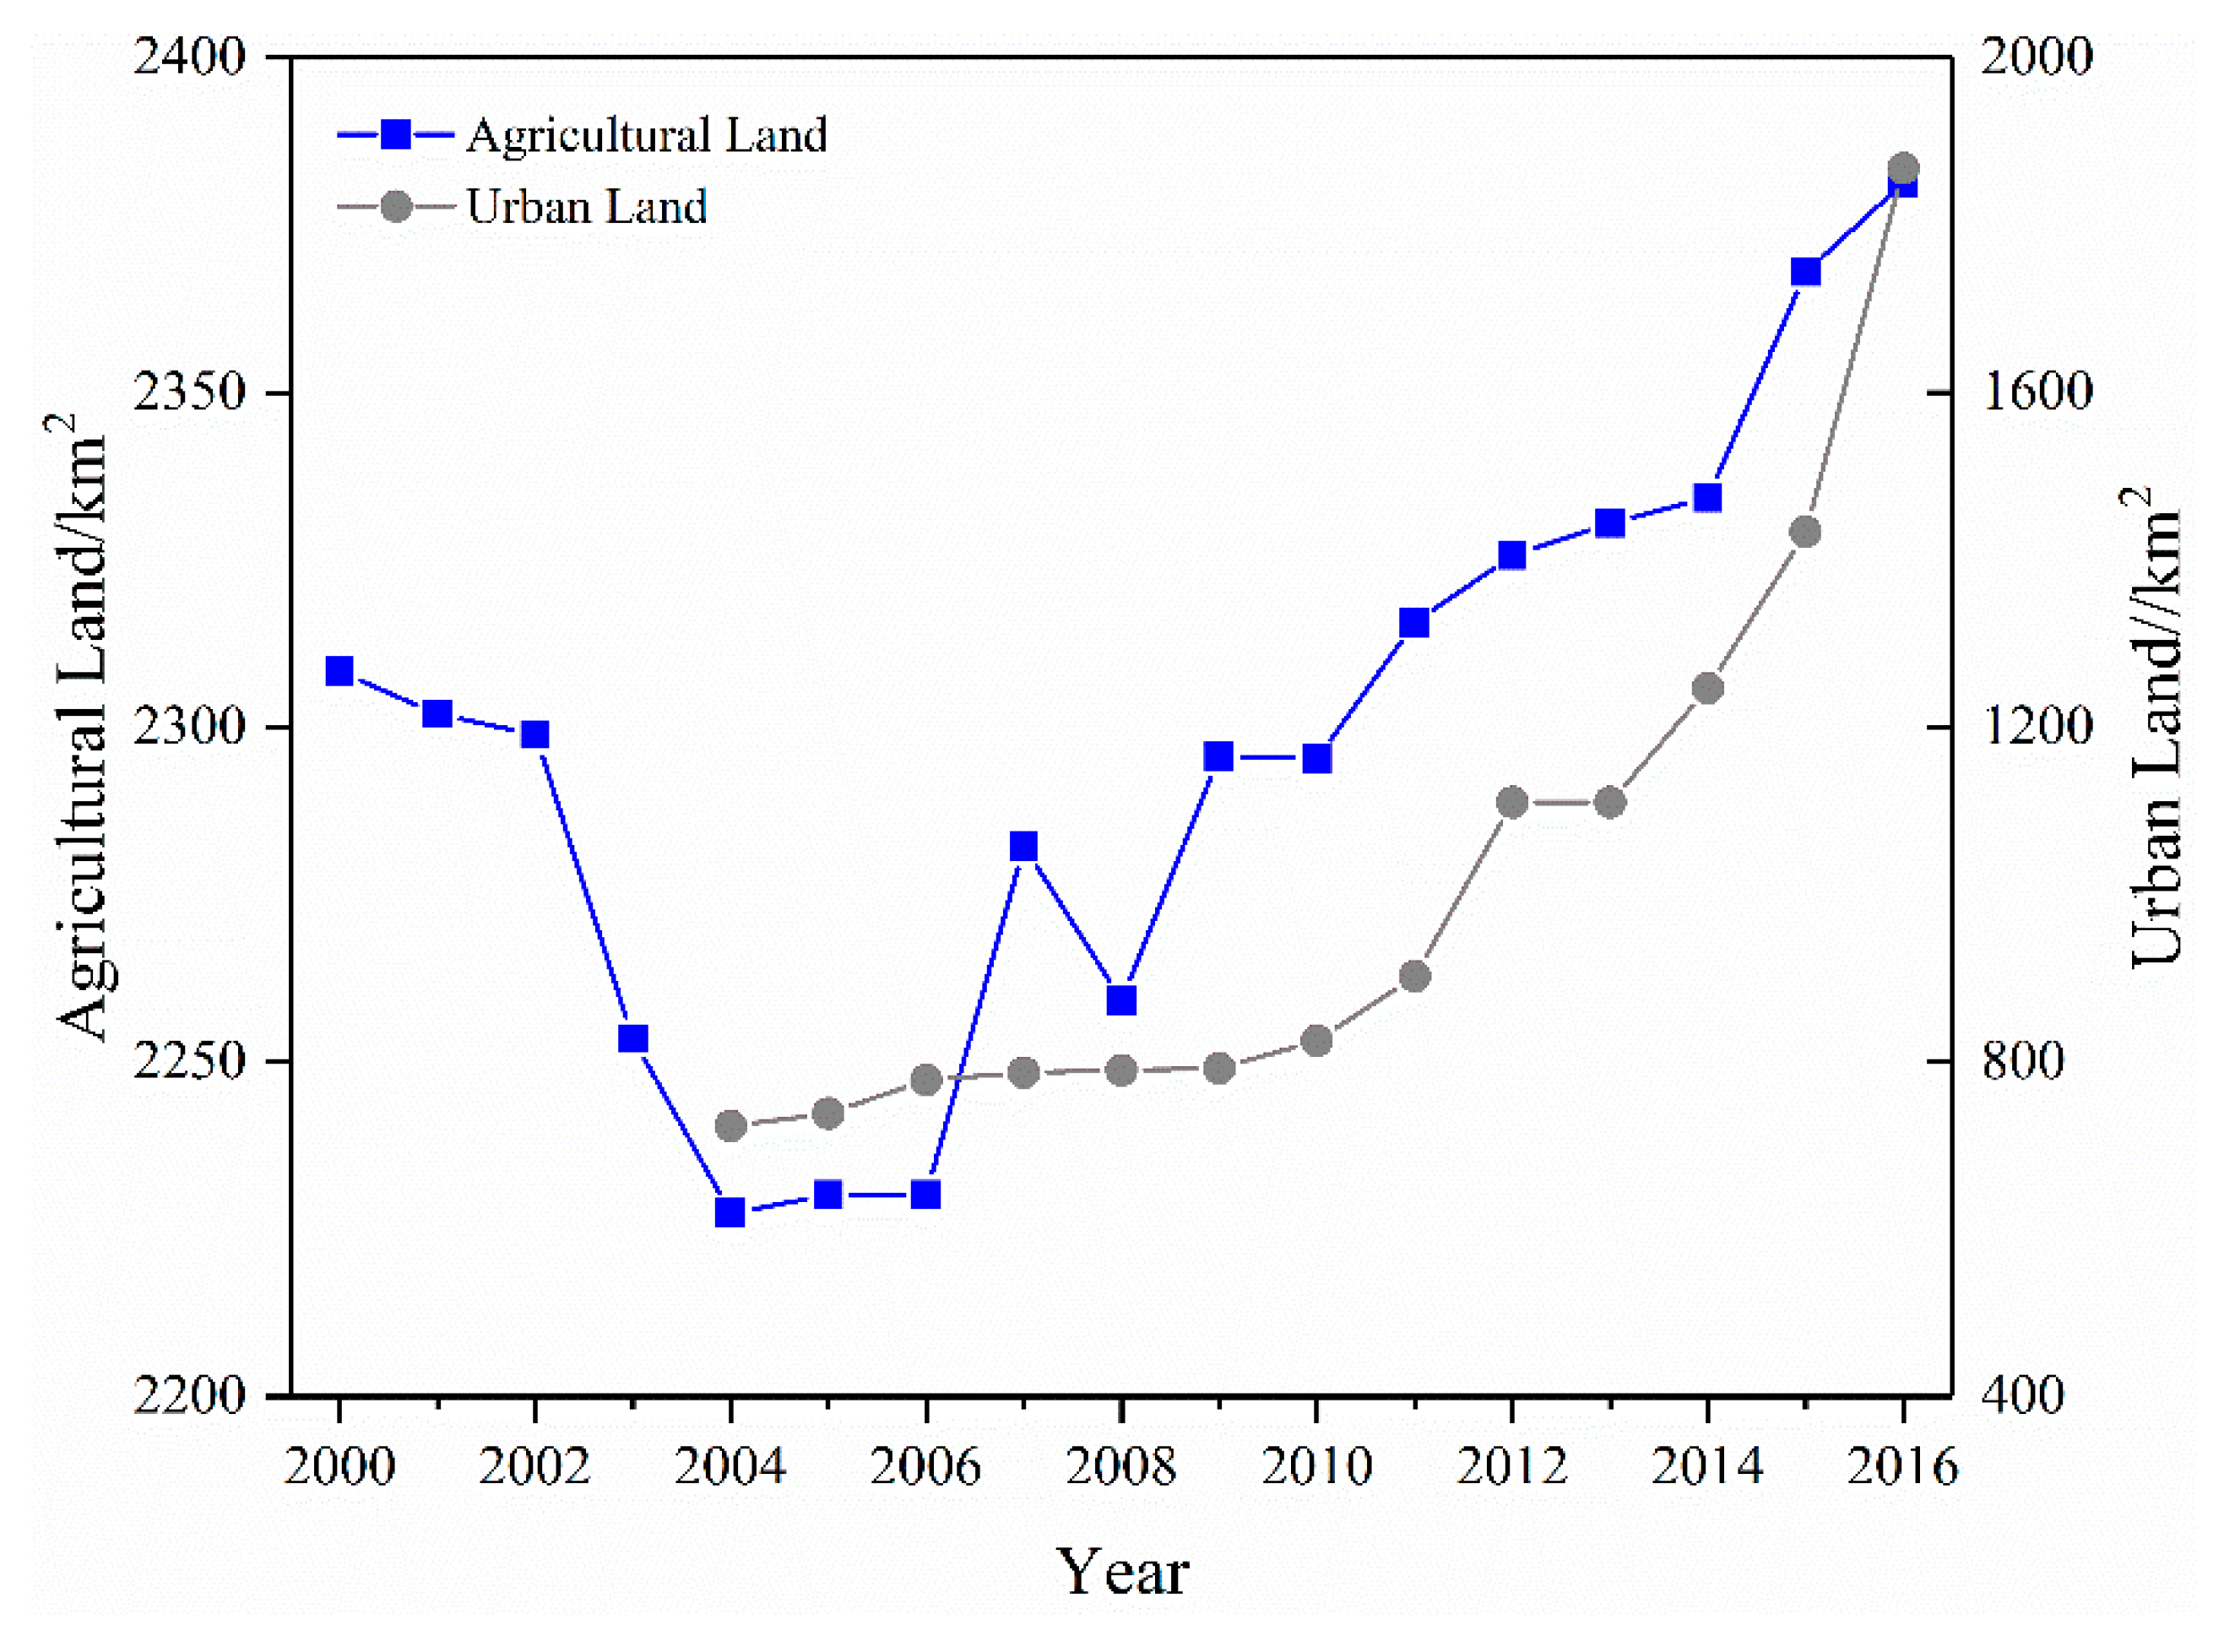
3.3. Responses of Vegetation Dynamics to Human Activities

In addition to climate change, human activities, mainly characterized by urbanization and agriculture activities in the YZR basin, also exert significant impacts on vegetation spatiotemporal variations. Therefore, investigating the spatial responses of vegetation in the high-altitude regions to human activities is of great importance.
According to Equation (9), residual values reflecting the role of human activities in vegetation dynamic variations are shown in Figure 8. The residual values were positive from 2000 to 2006, indicating human activities were beneficial for vegetation greening during this period, while human activities exerted negative influences on vegetation greening as inferred by the negative residual values from 2007 to 2016. This finding is consistent with the human activities of the Tibet Autonomous Region (Figure 9), mainly including the agricultural land and urban area data from statistical yearbooks of the Tibet Autonomous Region. The agricultural land area decreased during the period of the positive residual values (2000–2006) and increased during the period of the negative residual values (2007–2016). Similarly, the urban land area showed a consistent upward trend since the new millennium and increased dramatically from 2010, indicating urban expansion was accelerating. In addition, some studies reached similar conclusions about this region. Zhang et al. showed the built-up area first decreased before 2005 and then increased after 2006 in the YZR basin [99]. Bai et al. concluded that the agricultural land area of the YZR basin increased significantly since 2006 at a rate of 0.86%/year [100]. These findings both indicated that human activities represented by agricultural and urban developments played an important role in vegetation dynamic variations.
For the whole YZR basin, the annual growing season NDVI residuals showed a significantly decreasing trend with a rate of −0.003/year at the 95% confidence level (Figure 8b), mainly ascribed to the transition from positive residual values to negative residual values. This indicates an overall negative impact of human activities on vegetation, which should be considered seriously in future agricultural production and socioeconomic development.

4. Discussion

In addition to precipitation and surface air temperature, the spatial variation trend of the soil moisture in the YZR basin was also analyzed, because soil moisture constrains vegetation’s evapotranspiration and photosynthesis processes and plays an important role in vegetation dynamic variations. The results showed that the areas with a significantly positive trend were mainly distributed in the Nyang River and Parlung Zangbo River basins, denoted as white points in Figure 10, which was consistent with the areas exhibiting the positive relationship between surface air temperature and vegetation (Figure 7b). Significant glacier shrinkage has been found in these sub-basins, which brings abundant soil moisture and promotes vegetation growth [101]. Therefore, it can be deduced that glacier and snow melting resulted in more soil moisture from 2000 to 2016, and this process further promoted vegetation growth.
Precipitation, as the main and direct input of soil moisture, may exert a hysteresis effect on vegetation dynamic variations, and GLDAS precipitation and soil moisture (0–100 cm) were therefore used to explore the effect of soil moisture on vegetation at different time lags (Figure 11). The highest correlation between NDVI and precipitation was observed when time lag = 1 (R = 0.898), indicating that precipitation at a one-month leading time exhibited the most important influence on vegetation growth. However, the highest correlation between NDVI and soil moisture was observed when time lag = 0 (R = 0.866). Compared with soil moisture, precipitation required a one-month time lag to reach the best status to improve vegetation growth at the river basin scale. It can be inferred that precipitation might be contained underground and transformed into soil moisture after one month to be beneficial for vegetation growth in the YZR basin.
In this study, we investigated vegetation dynamic variations and their associated responses to environmental changes in the YZR basin from 2000 to 2016, based on the MODIS NDVI and GLDAS data. Results showed that the vegetation had a significantly increasing trend since 2000, and significantly, the greening trend mainly concentrated in the Parlung Zangbo River basin and Nyang River basin, indicating the importance of glacier and snow melting processes in the YZR basin. However, there are some limitations and uncertainties in the current study. First, although precipitation and surface air temperature are the dominant climate factors of vegetation variations in the YZR basin, other relevant factors should be taken into consideration for explicit investigation on the interaction mechanism between climate change and vegetation dynamics. Zhao et al. [102] showed that ENSO controlled vegetation dynamic variations at the global scale, while geographical differences existed, i.e., vegetation growth was mainly determined by the temperature at northern high-latitudes, by water in arid and semi-arid regions, and by radiation in the Amazon region. Nemina et al. [103] considered that radiation explained 27% of the vegetation greenness. Second, the response to climate change of the vegetation cover in high-altitude regions is more sensitive, which may be related to the elevation-dependent gradients of ecosystem properties, such as vegetation types, species components and soil structures [88], further showing the importance of the elevation. Yao et al. indicated that the precipitation wetting trend was amplified with elevation, which was attributed to the accelerating warming-driven water circulation [104]. Piao et al. pointed out that the elevation played an important role in controlling the spatial patterns of the vegetation green-up date [105]. Moreover, one significant problem associated with investigating elevation-dependent gradients is that more intensive human activities in high-altitude areas will cause some troubles in understanding the interactive responses between vegetation dynamics and climate change. Hence, the effects of elevation-dependent gradients on distributing vegetation greening and environmental factors should be a great focus. Third, climate change often involves nonlinear, nonstationary complex processes with periodic oscillations [106], while vegetation dynamic variations are often controlled by climate change, showing similar nonlinear, nonstationary processes [107]. However, the non-linear responses between vegetation cover and climate change in the YZR basin are still unclear. Finally, the residual analysis method based on multiple linear regression may also undervalue the contribution of climate change on vegetation dynamic variations [108], and it is necessary to use other advanced methods to explicitly separate the contributions of climate change and human activities.

5. Conclusions

In this study, it was revealed that the YZR basin had experienced a significant vegetation greening process with an increasing rate of 0.001/year (Zc = 2.31, p < 0.05) since 2000, and regions with significant greening were mainly concentrated in the Nyang River sub-basin (midstream) and Parlung Tsangpo River sub-basin (downstream). Analysis on the elevation-dependent vegetation showed that the vegetation cover of the low-altitude regions was better than that of the high-altitude regions, while the greening rate exhibited a much more complicated relationship with the elevation.
The surface air temperature was shown to play a more important role in vegetation greening, and significantly positive correlations between the growing season NDVI and surface air temperature were found in the Nyang River and Parlung Zangbo sub-basins. There are extensive glaciers and snow cover in these regions that have experienced significantly increasing trends of soil moisture since 2000. It can be deduced that soil moisture from glaciers and snow melting played an important role in vegetation growth. Although basin-wide non-significant negative correlations were found between precipitation and growing season NDVI, positive influences of precipitation on vegetation greening occurred in the arid and semi-arid upstream region. Additionally, the one-month time lag of precipitation to reach the optimal status to improve vegetation growth at the basin scale indicated that precipitation may be contained underground and transformed into soil moisture, thereby playing a role in vegetation growth.
In addition to precipitation and surface air temperature, the associated responses of other climate factors, such as radiation and snow water equivalent and the cooling effect caused by increased vegetation cover, should be paid more attention in the future.

Supplementary Materials

The following are available online at www.mdpi.com/xxx, Figure S1: Temporal variations of the annual precipitation and surface air temperature during the growing season in the YZR basin since 2000, Figure S2: GLDAS NOAH and observed precipitation (a) and air temperature (b) variations, Figure S3: The correlation coefficient between GLDAS NOAH and in situ precipitation (a) and surface air temperature (b), Table S1: Statistical indicators of precipitation (Pre) and surface air temperature (Tem) between GLDAS NOAH and in situ data.

Author Contributions

Conceptualization, H.L. and L.L.; methodology, H.L. and L.L.; software, H.L.; validation, H.L. and L.L.; formal analysis, H.L. and L.L.; investigation, H.L.; resources, L.L. and Z.X.; data curation, H.L. and L.L.; writing—original draft preparation, H.L. and L.L.; writing—review and editing, L.L., X.L. (Xiuping Li), and X.L. (Xingcai Liu); visualization, H.L.; supervision, L.L.; project administration, L.L. and Z.X.; funding acquisition, L.L. and Z.X.

Funding

This work was financially supported by the National Natural Science Foundation of China (Grant No. 91647202, 41890822 and 51509247).

Acknowledgments

We thank the National Meteorological Information Center of China Meteorological Administration for archiving the observed climate data (http://data.cma.cn/) and the MODIS team and the Global Land Data Assimilation System team for making the data freely available.

Conflicts of Interest

The authors declare no conflict of interest.

References

  1. Xu, H.J.; Wang, X.P.; Zhao, C.Y.; Yang, X.M. Diverse responses of vegetation growth to meteorological drought across climate zones and land biomes in northern China from 1981 to 2014. Agric. For. Meteorol. 2018, 262, 1–13. [Google Scholar] [CrossRef]
  2. Peng, J.; Li, Y.; Tian, L.; Liu, Y.; Wang, Y. Vegetation Dynamics and Associated Driving Forces in Eastern China during 1999–2008. Remote Sens. 2015, 7, 13641–13663. [Google Scholar] [CrossRef]
  3. Liu, M.; Adam, J.C.; Richey, A.S.; Zhu, Z.; Myneni, R.B. Factors controlling changes in evapotranspiration, runoff, and soil moisture over the conterminous U.S.: Accounting for vegetation dynamics. J. Hydrol. 2018, 565, 123–137. [Google Scholar] [CrossRef]
  4. Zhu, Z.C.; Piao, S.L.; Myneni, R.B.; Huang, M.T.; Zeng, Z.Z.; Canadell, J.G.; Ciais, P.; Sitch, S.; Friedlingstein, P.; Arneth, A.; et al. Greening of the Earth and its drivers. Nat. Clim. Chang. 2016, 6, 791–795. [Google Scholar] [CrossRef]
  5. Julien, Y.; Sobrino, J.A.; Verhoef, W. Changes in land surface temperatures and NDVI values over Europe between 1982 and 1999. Remote Sens. Environ. 2006, 103, 43–55. [Google Scholar] [CrossRef]
  6. Xiao, J.; Moody, A. Geographical distribution of global greening trends and their climatic correlates: 1982–1998. Int. J. Remote Sens. 2005, 26, 2371–2390. [Google Scholar] [CrossRef]
  7. Vintrou, E.; Claden, M.; Begue, A.; Ruelland, D. Analysis of 1982–2006 Sudano-Sahelian Vegetation Dynamics Using Noaa-Avhrr Ndvi Data and Normalized Rain-Use Efficiency. In Proceedings of the 2009 IEEE International Geoscience and Remote Sensing Symposium, Cape Town, South Africa, 12–17 July 2009. [Google Scholar] [CrossRef]
  8. Anyamba, A.; Tucker, C.J. Analysis of Sahelian vegetation dynamics using NOAA-AVHRR NDVI data from 1981-2003. J. Arid. Environ. 2005, 63, 596–614. [Google Scholar] [CrossRef]
  9. Piao, S.; Yin, G.; Tan, J.; Cheng, L.; Huang, M.; Li, Y.; Liu, R.; Mao, J.; Myneni, R.B.; Peng, S.; et al. Detection and attribution of vegetation greening trend in China over the last 30 years. Glob. Chang. Biol. 2015, 21, 1601–1609. [Google Scholar] [CrossRef]
  10. Chen, C.; Park, T.; Wang, X.; Piao, S.; Xu, B.; Chaturvedi, R.K.; Fuchs, R.; Brovkin, V.; Ciais, P.; Fensholt, R.; et al. China and India lead in greening of the world through land-use management. Nat. Sustain. 2019, 2, 122–129. [Google Scholar] [CrossRef] [PubMed]
  11. Lu, Y.H.; Zhang, L.W.; Feng, X.M.; Zeng, Y.; Fu, B.J.; Yao, X.L.; Li, J.R.; Wu, B.F. Recent ecological transitions in China: Greening, browning, and influential factors. Sci. Rep. 2015, 5, 8732. [Google Scholar] [CrossRef] [PubMed]
  12. Hua, W.; Chen, H.; Zhou, L.; Xie, Z.; Qin, M.; Li, X.; Ma, H.; Huang, Q.; Sun, S. Observational Quantification of Climatic and Human Influences on Vegetation Greening in China. Remote Sens. 2017, 9, 425. [Google Scholar] [CrossRef]
  13. Feng, X.; Fu, B.; Piao, S.; Wang, S.; Ciais, P.; Zeng, Z.; Lü, Y.; Zeng, Y.; Li, Y.; Jiang, X.; et al. Revegetation in China’s Loess Plateau is approaching sustainable water resource limits. Nat. Clim. Chang. 2016, 6, 1019–1022. [Google Scholar] [CrossRef]
  14. Zhang, R.; Ouyang, Z.T.; Xie, X.; Guo, H.Q.; Tan, D.Y.; Xiao, X.M.; Qi, J.G.; Zhao, B. Impact of Climate Change on Vegetation Growth in Arid Northwest of China from 1982 to 2011. Remote Sens. 2016, 8, 364. [Google Scholar] [CrossRef]
  15. Gu, Z.J.; Duan, X.W.; Shi, Y.D.; Li, Y.; Pan, X. Spatiotemporal variation in vegetation coverage and its response to climatic factors in the Red River Basin, China. Ecol. Indic. 2018, 93, 54–64. [Google Scholar] [CrossRef]
  16. Lenters, J.D.; Cutrell, G.J.; Istanbulluoglu, E.; Scott, D.T.; Herrman, K.S.; Irmak, A.; Eisenhauer, D.E. Seasonal energy and water balance of a Phragmites australis-dominated wetland in the Republican River basin of south-central Nebraska (USA). J. Hydrol. 2011, 408, 19–34. [Google Scholar] [CrossRef] [Green Version]
  17. Wu, M.S.; Ran, Y.H.; Jansson, P.E.; Chen, P.; Tan, X.; Zhang, W.X. Global parameters sensitivity analysis of modeling water, energy and carbon exchange of an arid agricultural ecosystem. Agric. For. Meteorol. 2019, 271, 295–306. [Google Scholar] [CrossRef]
  18. Deng, C.; Zhang, B.; Cheng, L.; Hu, L.; Chen, F. Vegetation dynamics and their effects on surface water-energy balance over the Three-North Region of China. Agric. For. Meteorol. 2019, 275, 79–90. [Google Scholar] [CrossRef]
  19. Bagnoud, N.; Pitman, A.J.; McAvaney, B.J.; Holbrook, N.J. The contribution of the land surface energy balance complexity to differences in means, variances and extremes using the AMIP-II methodology. Clim. Dyn. 2005, 25, 171–188. [Google Scholar] [CrossRef]
  20. Blanken, P.D.; Black, T.A.; Neumann, H.H.; den Hartog, G.; Yang, P.C.; Nesic, Z.; Lee, X. The seasonal water and energy exchange above and within a boreal aspen forest. J. Hydrol. 2001, 245, 118–136. [Google Scholar] [CrossRef]
  21. Ding, B.H.; Yang, K.; Qin, J.; Wang, L.; Chen, Y.Y.; He, X.B. The dependence of precipitation types on surface elevation and meteorological conditions and its parameterization. J. Hydrol. 2014, 513, 154–163. [Google Scholar] [CrossRef]
  22. Xue, T.; Tang, G.; Sun, L.; Wu, Y.; Liu, Y.; Dou, Y. Long-term trends in precipitation and precipitation extremes and underlying mechanisms in the U.S. Great Basin during 1951–2013. J. Geophys. Res. Atmos. 2017, 122, 6152–6169. [Google Scholar] [CrossRef]
  23. Zhou, J.; Cai, W.; Qin, Y.; Lai, L.; Guan, T.; Zhang, X.; Jiang, L.; Du, H.; Yang, D.; Cong, Z.; et al. Alpine vegetation phenology dynamic over 16 years and its covariation with climate in a semi-arid region of China. Sci. Total Environ. 2016, 572, 119–128. [Google Scholar] [CrossRef] [PubMed]
  24. Wu, Y.; Tang, G.; Gu, H.; Liu, Y.; Yang, M.; Sun, L. The variation of vegetation greenness and underlying mechanisms in Guangdong province of China during 2001-2013 based on MODIS data. Sci. Total Environ. 2019, 653, 536–546. [Google Scholar] [CrossRef] [PubMed]
  25. Baniya, B.; Tang, Q.H.; Huang, Z.W.; Sun, S.A.; Techato, K.A. Spatial and Temporal Variation of NDVI in Response to Climate Change and the Implication for Carbon Dynamics in Nepal. Forests 2018, 9, 329. [Google Scholar] [CrossRef]
  26. Chen, Q.; Zhou, Q.; Zhang, H.; Liu, F. Spatial disparity of NDVI response in vegetation growing season to climate change in the Three-River Headwaters Region. Ecol. Environ. Sci. 2010, 19, 1284–1289. [Google Scholar] [CrossRef]
  27. Piao, S.L.; Fang, J.Y.; Zhou, L.M.; Ciais, P.; Zhu, B. Variations in satellite-derived phenology in China’s temperate vegetation. Glob. Chang. Biol. 2006, 12, 672–685. [Google Scholar] [CrossRef]
  28. Zhou, L.M.; Tucker, C.J.; Kaufmann, R.K.; Slayback, D.; Shabanov, N.V.; Myneni, R.B. Variations in northern vegetation activity inferred from satellite data of vegetation index during 1981 to 1999. J. Geophys. Res. Atmos. 2001, 106, 20069–20083. [Google Scholar] [CrossRef]
  29. Sun, B.F.; Zhao, H.; Wang, X.K. Effects of drought on net primary productivity: Roles of temperature, drought intensity, and duration. Chin. Geogr. Sci. 2016, 26, 270–282. [Google Scholar] [CrossRef] [Green Version]
  30. Liu, Y.; Xiao, J.; Ju, W.; Zhou, Y.; Wang, S.; Wu, X. Water use efficiency of China’s terrestrial ecosystems and responses to drought. Sci. Rep. 2015, 5, 13799. [Google Scholar] [CrossRef]
  31. Yuan, W.P.; Liu, D.; Dong, W.J.; Liu, S.G.; Zhou, G.S.; Yu, G.R.; Zhao, T.B.; Feng, J.M.; Ma, Z.G.; Chen, J.Q.; et al. Multiyear precipitation reduction strongly decrease carbon uptake over North China. Biogeosci. Discuss. 2013, 10, 1605–1634. [Google Scholar] [CrossRef]
  32. Wei, W.; Feng, X.; Yang, L.; Chen, L.; Feng, T.; Chen, D. The effects of terracing and vegetation on soil moisture retention in a dry hilly catchment in China. Sci. Total Environ. 2019, 647, 1323–1332. [Google Scholar] [CrossRef] [PubMed]
  33. Pangaluru, K.; Velicogna, I.; Mohajerani, Y.; Ciracì, E.; Cpepa, S.; Basha, G.; Rao, S.V.B. Soil Moisture Variability in India: Relationship of Land Surface–Atmosphere Fields Using Maximum Covariance Analysis. Remote Sens. 2019, 11, 335. [Google Scholar] [CrossRef]
  34. Asam, S.; Callegari, M.; Matiu, M.; Fiore, G.; De Gregorio, L.; Jacob, A.; Menzel, A.; Zebisch, M.; Notarnicola, C. Relationship between Spatiotemporal Variations of Climate, Snow Cover and Plant Phenology over the Alps—An Earth Observation-Based Analysis. Remote Sens. 2018, 10, 1757. [Google Scholar] [CrossRef]
  35. Laternser, M.; Schneebeli, M. Long-term snow climate trends of the Swiss Alps (1931–99). Int. J. Climatol. 2003, 23, 733–750. [Google Scholar] [CrossRef]
  36. Gao, L.; Bernhardt, M.; Schulz, K.; Chen, X.W. Elevation correction of ERA-Interim temperature data in the Tibetan Plateau. Int. J. Climatol. 2017, 37, 3540–3552. [Google Scholar] [CrossRef]
  37. Liu, Z.; Yao, Z.; Huang, H.; Wu, S.; Liu, G. Land Use and Climate Changes and Their Impacts on Runoff in the Yarlung Zangbo River Basin, China. Land Degrad. Dev. 2014, 25, 203–215. [Google Scholar] [CrossRef]
  38. Cui, X.; Graf, H.-F. Recent land cover changes on the Tibetan Plateau: A review. Clim. Chang. 2009, 94, 47–61. [Google Scholar] [CrossRef]
  39. Li, Y.; Dong, S.; Wen, L.; Wang, X.; Wu, Y. The effects of fencing on carbon stocks in the degraded alpine grasslands of the Qinghai-Tibetan Plateau. J. Environ. Manag. 2013, 128, 393–399. [Google Scholar] [CrossRef]
  40. Gao, Y.H.; Li, X.; Leung, L.R.; Chen, D.L.; Xu, J.W. Aridity changes in the Tibetan Plateau in a warming climate. Environ. Res. Lett. 2015, 10, 034013. [Google Scholar] [CrossRef]
  41. You, Q.; Kang, S.; Wu, Y.; Yan, Y. Climate change over the Yarlung Zangbo River Basin during 1961–2005. J. Geogr. Sci. 2007, 17, 409–420. [Google Scholar] [CrossRef]
  42. Li, B.Q.; Zhou, W.; Zhao, Y.Y.; Ju, Q.; Yu, Z.B.; Liang, Z.M.; Acharya, K. Using the SPEI to Assess Recent Climate Change in the Yarlung Zangbo River Basin, South Tibet. Water 2015, 7, 5474–5486. [Google Scholar] [CrossRef] [Green Version]
  43. Liu, L.; Niu, Q.; Heng, J.; Li, H.; Xu, Z. Transition Characteristics of the Dry-Wet Regime and Vegetation Dynamic Responses over the Yarlung Zangbo River Basin, Southeast Qinghai-Tibet Plateau. Remote Sens. 2019, 11, 1254. [Google Scholar] [CrossRef]
  44. Lu, Q.; Wu, S.; Zhao, D. Variations in Alpine Grassland Cover and Its Correlation with Climate Variables on the Qinghai-Tibet Plateau in 1982–2013. Sci. Geogr. Sin. 2017, 37, 292–300. [Google Scholar] [CrossRef]
  45. Wang, Q.; Lv, S.; Bao, Y.; Ma, D.; Li, R. Characteristics of Vegetation Change and Its Relationship with Climate Factors in Different Time-Scales on Qinghai-Xizang Plateau. Plateau Meteorol. 2014, 33, 301–312. [Google Scholar]
  46. Han, X.; Zuo, D.; Xu, Z.; Cai, S.; Gao, X. Analysis of vegetation condition and its relationship with meteorological variables in the Yarlung Zangbo River Basin of China. Proc. Int. Assoc. Hydrol. Sci. 2018, 379, 105–112. [Google Scholar] [CrossRef] [Green Version]
  47. Zhang, J.; Ren, Z. Responses of Vegetation Changes in Growing Season to Precipitation in Yarlung Zangbo River Basin. Res. Soil Water Conserv. 2015, 22, 209–212. [Google Scholar] [CrossRef]
  48. Fu, X.; Yang, S.; Liu, C. Changes of NDVI and their relations with principal climatic factors in the Yarlung Zangbo River Basin. Geogr. Res. 2007, 26, 60–66. [Google Scholar]
  49. Li, H.; Li, Y.; Shen, W.; Li, Y.; Lin, J.; Lu, X.; Xu, X.; Jiang, J. Elevation-Dependent Vegetation Greening of the Yarlung Zangbo River Basin in the Southern Tibetan Plateau, 1999–2013. Remote Sens. 2015, 7, 16672–16687. [Google Scholar] [CrossRef]
  50. De Jong, R.; de Bruin, S.; de Wit, A.; Schaepman, M.E.; Dent, D.L. Analysis of monotonic greening and browning trends from global NDVI time-series. Remote Sens. Environ. 2011, 115, 692–702. [Google Scholar] [CrossRef] [Green Version]
  51. Fang, X.; Zhu, Q.; Chen, H.; Ma, Z.; Wang, W.; Song, X.; Zhao, P.; Peng, C. Analysis of vegetation dynamics and climatic variability impacts on greenness across Canada using remotely sensed data from 2000 to 2009. J. Appl. Remote Sens. 2014, 8, 083666. [Google Scholar] [CrossRef]
  52. Sarmah, S.; Jia, G.S.; Zhang, A.Z.; Singha, M. Assessing seasonal trends and variability of vegetation growth from NDVI3g, MODIS NDVI and EVI over South Asia. Remote Sens. Lett. 2018, 9, 1195–1204. [Google Scholar] [CrossRef]
  53. Ferreira, L.G.; Huete, A.R. Assessing the seasonal dynamics of the Brazilian Cerrado vegetation through the use of spectral vegetation indices. Int. J. Remote Sens. 2004, 25, 1837–1860. [Google Scholar] [CrossRef]
  54. Alemu, H.; Senay, G.B.; Kaptue, A.T.; Kovalskyy, V. Evapotranspiration Variability and Its Association with Vegetation Dynamics in the Nile Basin, 2002–2011. Remote Sens. 2014, 6, 5885–5908. [Google Scholar] [CrossRef]
  55. Gemitzi, A.; Banti, M.A.; Lakshmi, V. Vegetation greening trends in different land use types: Natural variability versus human-induced impacts in Greece. Environ. Earth Sci. 2019, 78, 172. [Google Scholar] [CrossRef]
  56. Li, F.P.; Zhang, Y.Q.; Xu, Z.X.; Liu, C.M.; Zhou, Y.C.; Liu, W.F. Runoff predictions in ungauged catchments in southeast Tibetan Plateau. J. Hydrol. 2014, 511, 28–38. [Google Scholar] [CrossRef]
  57. Resource and Environment Data Cloud Platform. Available online: http://www.resdc.cn/ (accessed on 21 October 2018).
  58. GLDAS Noah Land Surface Model L4 Monthly 0.25 × 0.25 Degree V2.1. Available online: https://disc.gsfc.nasa.gov/datasets/GLDAS_NOAH025_M_2.1/summary?keywords=GLDAS (accessed on 17 December 2018).
  59. Website of the United States Geological Survey. Available online: https://www.usgs.gov/ (accessed on 10 December 2018).
  60. Tong, X.W.; Wang, K.L.; Brandt, M.; Yue, Y.M.; Liao, C.J.; Fensholt, R. Assessing Future Vegetation Trends and Restoration Prospects in the Karst Regions of Southwest China. Remote Sens. 2016, 8, 357. [Google Scholar] [CrossRef]
  61. Pang, G.; Wang, X.; Yang, M. Using the NDVI to identify variations in, and responses of, vegetation to climate change on the Tibetan Plateau from 1982 to 2012. Quat. Int. 2017, 444, 87–96. [Google Scholar] [CrossRef]
  62. Kang, C.; Zhang, Y.; Wang, Z.; Liu, L.; Zhang, H.; Jo, Y. The Driving Force Analysis of NDVI Dynamics in the Trans-Boundary Tumen River Basin between 2000 and 2015. Sustainability 2017, 9, 2350. [Google Scholar] [CrossRef]
  63. Mo, K.; Chen, Q.; Chen, C.; Zhang, J.; Wang, L.; Bao, Z. Spatiotemporal variation of correlation between vegetation cover and precipitation in an arid mountain-oasis river basin in northwest China. J. Hydrol. 2019, 574, 138–147. [Google Scholar] [CrossRef]
  64. Zhang, Y.; Song, C.; Band, L.E.; Sun, G.; Li, J. Reanalysis of global terrestrial vegetation trends from MODIS products: Browning or greening? Remote Sens. Environ. 2017, 191, 145–155. [Google Scholar] [CrossRef] [Green Version]
  65. Yang, W.T.; Long, D.; Bai, P. Impacts of future land cover and climate changes on runoff in the mostly afforested river basin in North China. J. Hydrol. 2019, 570, 201–219. [Google Scholar] [CrossRef]
  66. Liu, Y.; Li, Y.; Li, S.C.; Motesharrei, S. Spatial and Temporal Patterns of Global NDVI Trends: Correlations with Climate and Human Factors. Remote Sens. 2015, 7, 13233–13250. [Google Scholar] [CrossRef] [Green Version]
  67. Wessels, K.J.; Prince, S.D.; Malherbe, J.; Small, J.; Frost, P.E.; VanZyl, D. Can human-induced land degradation be distinguished from the effects of rainfall variability? A case study in South Africa. J. Arid Environ. 2007, 68, 271–297. [Google Scholar] [CrossRef]
  68. Evans, J.; Geerken, R. Discrimination between climate and human-induced dryland degradation. J. Arid Environ. 2004, 57, 535–554. [Google Scholar] [CrossRef]
  69. Burrell, A.L.; Evans, J.P.; Liu, Y. Detecting dryland degradation using Time Series Segmentation and Residual Trend analysis (TSS-RESTREND). Remote Sens. Environ. 2017, 197, 43–57. [Google Scholar] [CrossRef]
  70. Li, A.; Wu, J.G.; Huang, J.H. Distinguishing between human-induced and climate-driven vegetation changes: A critical application of RESTREND in inner Mongolia. Landsc. Ecol. 2012, 27, 969–982. [Google Scholar] [CrossRef]
  71. Zhou, X.; Yamaguchi, Y.; Arjasakusuma, S. Distinguishing the vegetation dynamics induced by anthropogenic factors using vegetation optical depth and AVHRR NDVI: A cross-border study on the Mongolian Plateau. Sci. Total Environ. 2018, 616–617, 730–743. [Google Scholar] [CrossRef]
  72. Xu, M.; Kang, S.; Chen, X.; Wu, H.; Wang, X.; Su, Z. Detection of hydrological variations and their impacts on vegetation from multiple satellite observations in the Three-River Source Region of the Tibetan Plateau. Sci. Total Environ. 2018, 639, 1220–1232. [Google Scholar] [CrossRef]
  73. Qu, S.; Wang, L.C.; Lin, A.W.; Zhu, H.J.; Yuan, M.X. What drives the vegetation restoration in Yangtze River basin, China: Climate change or anthropogenic factors? Ecol. Indic. 2018, 90, 438–450. [Google Scholar] [CrossRef]
  74. Zhang, Y.; Gao, J.; Liu, L.; Wang, Z.; Ding, M.; Yang, X. NDVI-based vegetation changes and their responses to climate change from 1982 to 2011: A case study in the Koshi River Basin in the middle Himalayas. Glob. Planet. Chang. 2013, 108, 139–148. [Google Scholar] [CrossRef]
  75. Third Pole Environment Database. Available online: http://en.tpedatabase.cn/ (accessed on 19 April 2019).
  76. Liu, Y.; Li, L.; Chen, X.; Zhang, R.; Yang, J. Temporal-spatial variations and influencing factors of vegetation cover in Xinjiang from 1982 to 2013 based on GIMMS-NDVI3g. Glob. Planet. Chang. 2018, 169, 145–155. [Google Scholar] [CrossRef]
  77. Zhang, H.; Chang, J.; Zhang, L.; Wang, Y.; Li, Y.; Wang, X. NDVI dynamic changes and their relationship with meteorological factors and soil moisture. Environ. Earth Sci. 2018, 77, 582. [Google Scholar] [CrossRef]
  78. Sang, Y.F.; Singh, V.P.; Gong, T.L.; Xu, K.; Sun, F.B.; Liu, C.M.; Liu, W.B.; Chen, R.Z. Precipitation variability and response to changing climatic condition in the Yarlung Tsangpo River basin, China. J. Geophys. Res. Atmos. 2016, 121, 8820–8831. [Google Scholar] [CrossRef] [Green Version]
  79. Li, C.L.; Leal, W.; Yin, J.; Hu, R.C.; Wang, J.; Yang, C.S.; Yin, S.; Bao, Y.H.; Ayal, D.Y. Assessing vegetation response to multi-time-scale drought across inner Mongolia plateau. J. Clean. Prod. 2018, 179, 210–216. [Google Scholar] [CrossRef]
  80. Sun, W.; Wang, Y.; Fu, Y.H.; Xue, B.; Wang, G.; Yu, J.; Zuo, D.; Xu, Z. Spatial heterogeneity of changes in vegetation growth and their driving forces based on satellite observations of the Yarlung Zangbo River Basin in the Tibetan Plateau. J. Hydrol. 2019, 574, 324–332. [Google Scholar] [CrossRef]
  81. Pepin, N.; Bradley, R.S.; Diaz, H.F.; Baraer, M.; Caceres, E.B.; Forsythe, N.; Fowler, H.; Greenwood, G.; Hashmi, M.Z.; Liu, X.D.; et al. Elevation-dependent warming in mountain regions of the world. Nat. Clim. Chang. 2015, 5, 424–430. [Google Scholar] [CrossRef] [Green Version]
  82. Zhang, W.; Zhang, Y.; Wang, Z.; Ding, M.; Yang, X.; Lin, X.; Liu, L. Vegetation change in the Mt. Qomolangma Nature Reserve from 1981 to 2001. J. Geogr. Sci. 2007, 17, 152–164. [Google Scholar] [CrossRef]
  83. Chen, B.; Li, H.; Cao, X.; Shen, W.; Jin, X. Vegetation Pattern and Spatial Distribution of NDVI in the Yarlung Zangbo River Basin of China. J. Desert Res. 2015, 35, 120–128. [Google Scholar]
  84. Duo, C.; Yili, Z.; Du, Z. Land use change scenario in Lhasa district using Markov chain model. Geogr. Res. 2005, 24, 869–877. [Google Scholar]
  85. Qin, J.; Yang, K.; Liang, S.L.; Guo, X.F. The altitudinal dependence of recent rapid warming over the Tibetan Plateau. Clim. Chang. 2009, 97, 321–327. [Google Scholar] [CrossRef]
  86. Song, C.; Ke, L.; Huang, B.; Richards, K.S. Can mountain glacier melting explains the GRACE-observed mass loss in the southeast Tibetan Plateau: From a climate perspective? Glob. Planet. Chang. 2015, 124, 1–9. [Google Scholar] [CrossRef]
  87. Fang, H.; Baiping, Z.; Yonghui, Y.; Yunhai, Z.; Yu, P. Mass Elevation Effect and Its Contribution to the Altitude of Snowline in the Tibetan Plateau and Surrounding Areas. Arct. Antarct. Alp. Res. 2018, 43, 207–212. [Google Scholar] [CrossRef]
  88. Tao, J.; Zhang, Y.; Dong, J.; Fu, Y.; Zhu, J.; Zhang, G.; Jiang, Y.; Tian, L.; Zhang, X.; Zhang, T.; et al. Elevation-dependent relationships between climate change and grassland vegetation variation across the Qinghai-Xizang Plateau. Int. J. Climatol. 2015, 35, 1638–1647. [Google Scholar] [CrossRef]
  89. Kang, S.; Xu, Y.; You, Q.; Fluegel, W.-A.; Pepin, N.; Yao, T. Review of climate and cryospheric change in the Tibetan Plateau. Environ. Res. Lett. 2010, 5, 015101. [Google Scholar] [CrossRef]
  90. Hoylman, Z.H.; Jencso, K.G.; Hu, J.; Holden, Z.A.; Martin, J.T.; Gardner, W.P. The climatic water balance and topography control spatial patterns of atmospheric demand, soil moisture and shallow subsurface flow. Water Resour. Res. 2019, 55, 2370–2389. [Google Scholar] [CrossRef]
  91. Abiy, A.Z.; Melesse, A.M. Evaluation of watershed scale changes in groundwater and soil moisture storage with the application of GRACE satellite imagery data. Catena 2017, 153, 50–60. [Google Scholar] [CrossRef] [Green Version]
  92. Fu, G.; Shen, Z.X. Environmental Humidity Regulates Effects of Experimental Warming on Vegetation Index and Biomass Production in an Alpine Meadow of the Northern Tibet. PLoS ONE 2016, 11, e0165643. [Google Scholar] [CrossRef]
  93. Piao, S.; Tan, K.; Nan, H.; Ciais, P.; Fang, J.; Wang, T.; Vuichard, N.; Zhu, B. Impacts of climate and CO2 changes on the vegetation growth and carbon balance of Qinghai-Tibetan grasslands over the past five decades. Glob. Planet. Chang. 2012, 98–99, 73–80. [Google Scholar] [CrossRef]
  94. Shen, M.; Zhang, G.; Cong, N.; Wang, S.; Kong, W.; Piao, S. Increasing altitudinal gradient of spring vegetation phenology during the last decade on the Qinghai–Tibetan Plateau. Agric. For. Meteorol. 2014, 189–190, 71–80. [Google Scholar] [CrossRef]
  95. Fan, J.A.; Sun, W.C.; Zhao, Y.; Xue, B.L.; Zuo, D.P.; Xu, Z.X. Trend Analyses of Extreme Precipitation Events in the Yarlung Zangbo River Basin, China Using a High-Resolution Precipitation Product. Sustainability 2018, 10, 1396. [Google Scholar] [CrossRef]
  96. Ji, Q.; Yang, J.; Chen, H. Comprehensive analysis of the precipitation changes over the Tibetan Plateau during 1961–2015. J. Glaciol. Geocryol. 2018, 40, 1090–1099. [Google Scholar]
  97. Li, X.; Liu, L.; Li, H.; Wang, S.; Heng, J. Spatiotemporal soil moisture variations associated with hydro-meteorological factors over the Yarlung Zangbo River basin in Southeast Tibetan Plateau. Int. J. Climatol. 2019, 1–19. [Google Scholar] [CrossRef]
  98. Guo, B.; Tao, H.; Jiang, L.; Kong, B.; Liu, B.; Shi, Z.; Song, C. Research on dynamic monitoring of drought and the impact on vegetation in the Brahmaputra River Basin on MODIS. Resour. Environ. Yangtze Basin 2013, 22, 817–824. [Google Scholar]
  99. Zhang, R.; Xu, Z.; Liu, X.; Liu, J.; Bai, J. Spatiotemporal Characteristics of Land Use /Cover Change for the Yarlung Tsangpo River Basin from 1980 to 2015. China Rural Water Hydropower 2019, 3, 106–111. [Google Scholar]
  100. Bai, W.; Yao, L.; Zhang, Y.; Wang, C. Spatial-temporal Dynamics of Cultivated Land in Recent 35 Years in the Lhasa River Basin of Tibet. J. Nat. Resour. 2014, 29, 623–632. [Google Scholar]
  101. Yao, T.; Thompson, L.; Yang, W.; Yu, W.; Gao, Y.; Guo, X.; Yang, X.; Duan, K.; Zhao, H.; Xu, B.; et al. Different glacier status with atmospheric circulations in Tibetan Plateau and surroundings. Nat. Clim. Chang. 2012, 2, 663–667. [Google Scholar] [CrossRef]
  102. Zhao, L.; Dai, A.; Dong, B. Changes in global vegetation activity and its driving factors during 1982–2013. Agric. For. Meteorol. 2018, 249, 198–209. [Google Scholar] [CrossRef]
  103. Nemani, R.R.; Keeling, C.D.; Hashimoto, H.; Jolly, W.M.; Piper, S.C.; Tucker, C.J.; Myneni, R.B.; Running, S.W. Climate-driven increases in global terrestrial net primary production from 1982 to 1999. Science 2003, 300, 1560–1563. [Google Scholar] [CrossRef]
  104. Yao, J.Q.; Yang, Q.; Mao, W.Y.; Zhao, Y.; Xu, X.B. Precipitation trend-Elevation relationship in arid regions of the China. Glob. Planet. Chang. 2016, 143, 1–9. [Google Scholar] [CrossRef]
  105. Piao, S.; Cui, M.; Chen, A.; Wang, X.; Ciais, P.; Liu, J.; Tang, Y. Altitude and temperature dependence of change in the spring vegetation green-up date from 1982 to 2006 in the Qinghai-Xizang Plateau. Agric. For. Meteorol. 2011, 151, 1599–1608. [Google Scholar] [CrossRef]
  106. Li, Y.; Liu, C.; Yu, W.; Tian, D.; Bai, P. Response of streamflow to environmental changes: A Budyko-type analysis based on 144 river basins over China. Sci. Total Environ. 2019, 664, 824–833. [Google Scholar] [CrossRef] [PubMed]
  107. Liu, H.; Zhang, M.; Lin, Z.; Xu, X. Spatial heterogeneity of the relationship between vegetation dynamics and climate change and their driving forces at multiple time scales in Southwest China. Agric. For. Meteorol. 2018, 256–257, 10–21. [Google Scholar] [CrossRef]
  108. De Jong, R.; Schaepman, M.E.; Furrer, R.; de Bruin, S.; Verburg, P.H. Spatial relationship between climatologies and changes in global vegetation activity. Glob. Chang. Biol. 2013, 19, 1953–1964. [Google Scholar] [CrossRef] [PubMed]
Figure 1. The geographical location (a), hydrometeorological stations (b) and land use types in 2005 (c) of the Yarlung Zangbo River (YZR) basin. The elevation and land use data were downloaded from the Resource and Environment Data Cloud Platform [57].
Remotesensing 11 02421 g001aRemotesensing 11 02421 g001b
Figure 2. The inter-annual variation of growing season Normalized Difference Vegetation Index (NDVI) since 2000 in the YZR basin.
Remotesensing 11 02421 g002
Figure 3. The spatial distribution of the multi-year average value of the growing season NDVI since 2000 in the YZR basin.
Remotesensing 11 02421 g003
Figure 4. The spatial pattern of Sen’s slope (a), Zc value (b), and variation trend (c) of the growing season NDVI in the YZR basin.
Remotesensing 11 02421 g004
Figure 5. Multi-year average growing season NDVI (a) and greening rate (b) variations at different elevation belts.
Remotesensing 11 02421 g005
Figure 6. Inter-annual variations of the PRNDVI-P and PRNDVI-T (a) and scatter diagram (b).
Remotesensing 11 02421 g006
Figure 7. The spatial distribution of the correlation coefficient between NDVI and precipitation (a) and NDVI and temperature (b). The white point represents a significantly positive correlation at the 0.05 significance level.
Remotesensing 11 02421 g007
Figure 8. Residual analysis of the annual observed and predicted NDVI (a) and the temporal changing of NDVI residuals (b).
Remotesensing 11 02421 g008
Figure 9. The inter-annual variation of the agricultural land area from 2000 to 2016 in the Tibet Autonomous Region.
Remotesensing 11 02421 g009
Figure 10. The spatial variation trend of the soil moisture in the YZR basin. The white point represents a significantly increasing trend at the 0.05 significance level.
Remotesensing 11 02421 g010
Figure 11. Time lag effects between NDVI and precipitation and soil moisture.
Remotesensing 11 02421 g011
Table 1. Statistics of the growing season NDVI variation trend.
Sen’s SlopeZc ValueTrend of NDVIPercentage/%
≤−0.0003≤−1.64Significantly browning7.7
≤−0.0003−1.64–1.64Slightly browning16.3
−0.0003–0.0003−1.64–1.64Relatively stable18.3
≥0.0003−1.64–1.64Slightly greening32.3
≥0.0003≥1.64Significantly greening25.4
Notes: The standard deviation of Sen’s slope calculated by all pixels (−0.0003) and the significance level of 0.10 (Zc = 1.64) are regarded as the categorized criteria.
Table 2. The Pearson coefficient between NDVI and climate factors in the growing season.
Pearson CoefficientNDVIPrecipitationTemperature
NDVI1
Precipitation−0.3391
Temperature0.472 *−0.523 *1
Note: * represents the significance level of 0.05.

