Article

Structure Disentanglement and Effect Analysis of the Arid Riverscape Social-Ecological System Using a Network Approach

1
State Key Laboratory of Urban and Regional Ecology, Research Center for Eco-Environmental Sciences, Chinese Academy of Sciences, Beijing 100085, China
2
University of Chinese Academy of Sciences, Beijing 100085, China
3
State Key Laboratory of Earth Surface Processes and Resource Ecology, Faculty of Geographical Science, Beijing Normal University, Beijing 100875, China
4
Department of Earth, Environmental and Geographic Sciences, University of British Columbia (Okanagan campus), 1177 Research Road, Kelowna, BC V1V 1V7, Canada
*
Author to whom correspondence should be addressed.
Sustainability 2019, 11(19), 5159; https://doi.org/10.3390/su11195159
Submission received: 8 July 2019 / Revised: 3 September 2019 / Accepted: 10 September 2019 / Published: 20 September 2019
(This article belongs to the Section Social Ecology and Sustainability)

Abstract

:
Riverscapes are coupled social-ecological systems (SESs), in which the differences between the scales and functioning of interacting social and ecological components ( “mismatch”) impose challenges for global arid basin sustainability. Here, we defined riverscape SESs as networks of connected ecological and social components (nodes) to disentangle the structure and effects of SESs in Heihe River Basin (HRB) in arid regions of northwest China. Results showed the ecological network in HRB has low network density and high vertex strength. Heihe River Basin Bureau, as an emerging bridging organization, changed the SES structure and increased the matching degree of SES from 0.33 to 0.53, which has caused an obvious improvement in the downstream ecology. However, the characteristics of the ecological network demonstrated that cross-boundary management actions restricted to only the river would exacerbate local environmental pressures, such as the continued decline of groundwater in midstream regions and the potential appropriation of water for ecology by the expanding farmland in the downstream region. Our study demonstrated that network analysis could be one promising direction to untangle the complex SES and understand the relationship between SES structure and outcomes. We suggest comanaging the cross-boundary river and lands to further match the SES for basin sustainability.

1. Introduction

Riverscapes are complex, landscape-scale mosaics of connected river and stream habitats embedded in diverse ecological and socioeconomic settings [1]. Social-ecological interactions between stakeholders and ecological processes often complicate riverscape management and basin governance [2]. Particularly, most of the world’s rivers are transboundary across multiple administrative jurisdictions and usually cause collective action problems [3], which is a key sustainability challenge in basin governance. The increasing water supply uncertainties induced by climate change and the escalating water demand pressures driven by economic development and population growth increase the social-ecological interdependencies and amplify this challenge, especially in arid river basins.
The numerous ways in which social and ecological components in riverscapes interact will create complex patterns of such interdependencies. Similar to the landscape patterns affecting the ecological process [4,5,6] and vegetation patterns impacting water and soil processes [7,8,9], the structure of the social and ecological system affects the overall function of the riverscape. With the demarcation of administrative boundaries on natural watersheds and the tremendous changes in the structure of natural landscapes caused by technological progress and human land use, adverse effects of the socio-political boundaries on ecosystem have been widely recognized [10]. There is an urgent need to seek social-ecological structure that would achieve sustainable development of river basins.
Social-ecological matching, including scale matching and function matching, is regarded as an effective way to reduce such adverse impact. There are a number of case studies showing that governance that incorporates collaboration across multiple scales and jurisdictions are needed to address common resource dilemmas, which align the social and ecological system to some extent [11,12]. For example, Bodin et al., 2014 [13] used data from case studies of fishery (a rural, coastal fishing village, approximately 50 km south of Mombasa, Kenya [14]) and forest (a rural agricultural landscape in Androy, southern Madagascar [15]) conservation to empirically test presumed relationships between conservation outcomes and certain patterns of alignment of social-ecological interdependences, and found that when actors who shared resources were also socially linked, conservation at the level of the whole social-ecological system was positively affected. Barnes et al., 2019 conducted research on the five coral reef fishing communities in Kenya, and found that when fishers facing common dilemmas form cooperative communication ties with direct resource competitors, they may achieve positive gains in reef fish biomass and functional richness. However, these studies largely focus on the comanagement of single resources (fish, forest, lake) [16,17,18], which fail to represent the reality of natural resources in basins that involve interconnected ecosystems. In China, governance institution and policy have a strong and broad impact on the ecology and resources of the whole basin. It is therefore necessary to find a new method to disentangle the riverscape social-ecological structure and its outcomes under China’s top-down dominated governance regime.
The social-ecological network analysis (SENA) method is relatively new and multidisciplinary [11,19,20] with potential in studying SES. This method assumes that social-ecological systems can be modeled as social-ecological networks which simultaneously incorporate a range of social and ecological/biophysical entities (nodes) and their interdependencies. In this paper, we used this method and empirical data from previous studies of the Heihe River Basin (HRB) [21,22,23] to study such social-ecological interdependencies. The HRB, which is located in northwest China, is a high-profile case study, is an arid river basin whose governance has undergone a remarkable transition. In order to control the severe ecological degradation in the downstream region in the 1980s, the water management regime has been adapted. Some progress of the new regime has been achieved [24], but how interconnected and nested riverscapes can be managed to achieve sustainability remains a fundamental question that has prompted an ongoing search for elusive governance systems that will unite nature and society.
In this study, we construed the riverscape in HRB as a social-ecological system (SES) and then described the SES as a network and applied a SENA approach to analyze the characteristics and evolution of the network structure and its outcomes. We attempted to answer this specific scientific question: how has the structure of the SE network changed and what are its outcomes for sustainable river basin management? We have also proposed some policy suggestions for sustainable riverscape management.

2. Materials and Methods
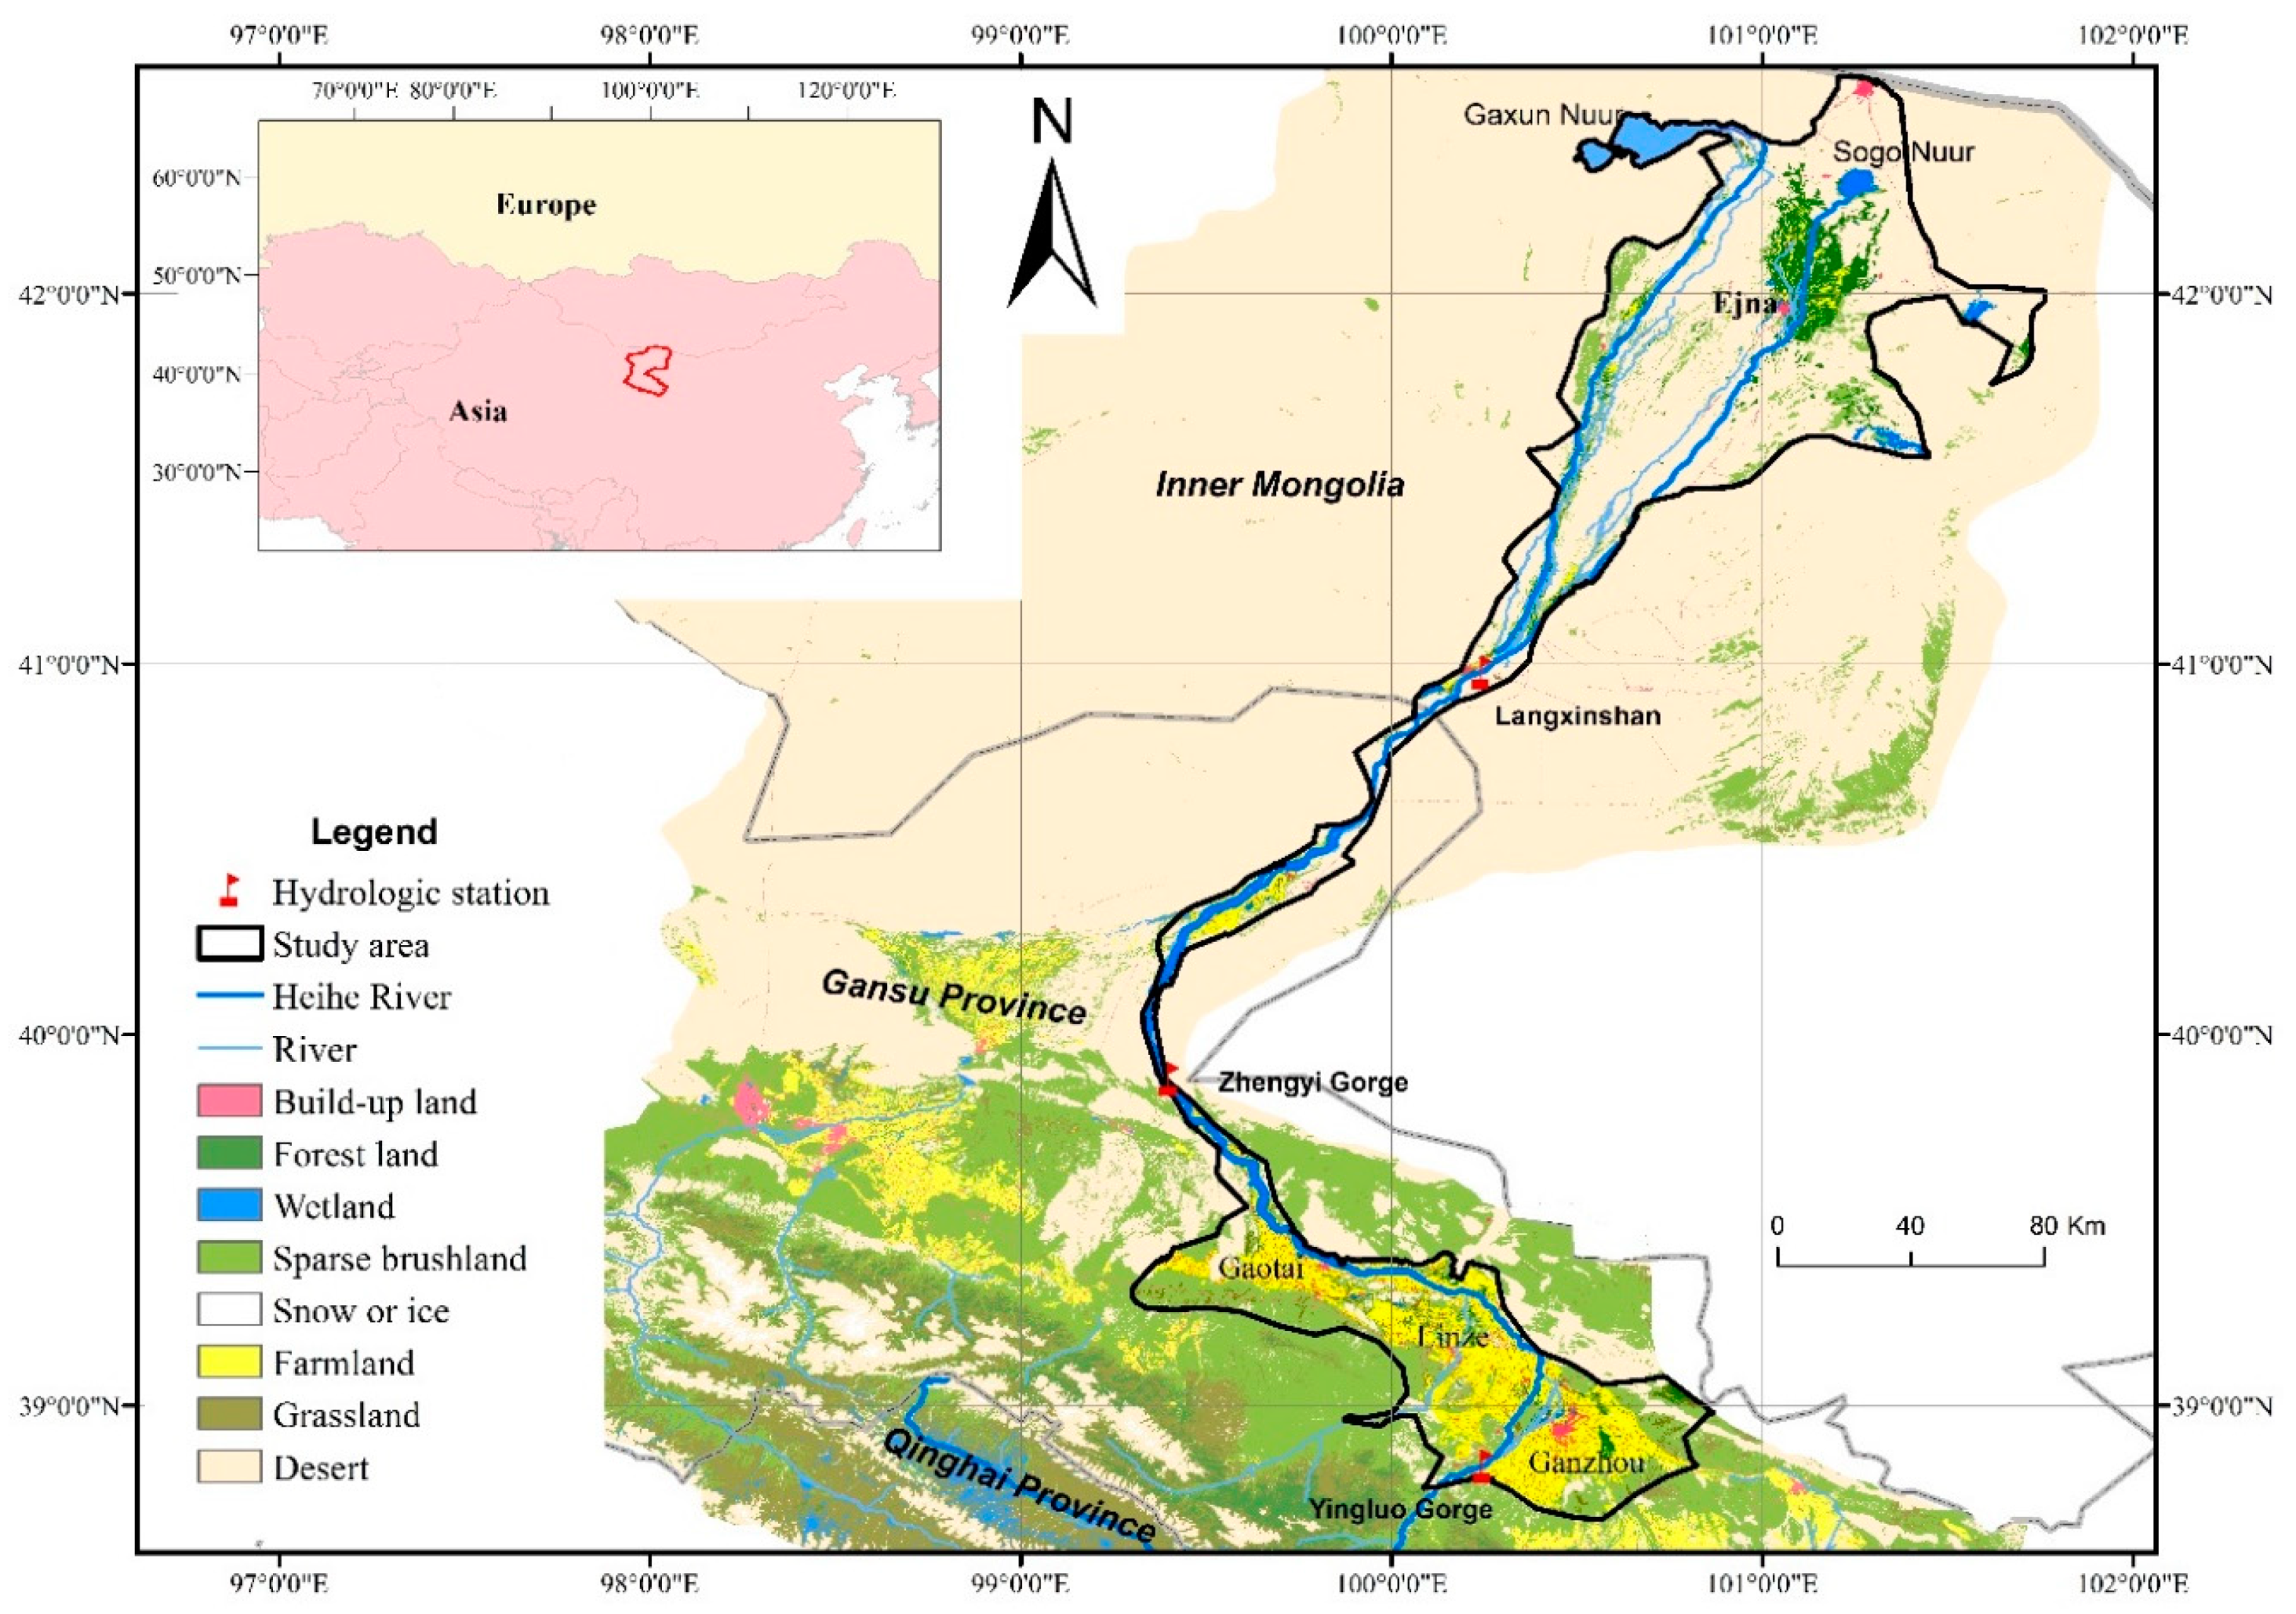
2.1. Study Area

The HRB is the second largest inland river basin in the arid zone of northwestern China (Figure 1). The river originates in the snow-covered Qilian Mountains and flows across Gansu Province and the Inner Mongolia Autonomous Region. It then flows northward to terminal lakes in the Gobi Desert [25]. The midstream region is controlled by a continental climate and annual precipitation ranges from 69 to 216 mm (from the local chronicles of Gansu Province). The development of irrigated agriculture in this region consumes large amounts of water via a relatively complete irrigation system that consists of more than 893 main and branch canals (collected from the regional statistical yearbook in Gansu Province). The downstream region is generally considered to be the main eco-barrier in northern China and is highly dependent on the Heihe River because of the low rainfall (35 mm) and high evaporation (2300 mm) [26].
The HRB stretches across two provinces that have been in conflict over water resources for several decades. There are three counties (Ganzhou, Gaotai, and Linze) in the middle region affiliated to Gansu Province and one county (Ejna) in the downstream region affiliated to Inner Mongolia. All of the counties have settlements alongside the river reaches and are main users of river water. Our study area covers the main riverscapes in the basin, which are shown in Figure 1.
The basin has experienced two different water allocation regimes. The early water allocation regime focused on “water in the middle reaches of the river basin” and was implemented in the counties in the midstream region. This regime worked well in the historical period when the density of farms in midstream regions was low, and the demands on the surface flow were well below capacity, with little impact on downstream animal husbandry [27]. With the large-scale agricultural developments in the midstream region, the amount of water discharged downstream was continually reduced, leading to ecological degradation and desertification in the downstream area in the 1980s. Conflicts between midstream and downstream water allocations began to appear. The downstream ecological crisis led to a number of changes, including the establishment of the Heihe River Bureau (HRBR) in 2000, which is a dispatch agency of the Yellow River Commission. The HRBR functions as the water administrative department of the HRB and comprehensively manages the water resources in the whole basin. After the year 2000, it entered into a period of water allocation for the whole basin.
This study focused on the period of 1990–2010, during which the governance structure and biophysical environment underwent significant change. The period of 1990–2000 was controlled by the early water-allocation regime and we call this period the local water allocation period (LWAP), while we call the period of 2000–2010 the regional water allocation period (RWAP), during which water was allocated for the whole basin.

2.2. Data Sources

The land use/cover datasets in 1990, 2000, and 2010 used in our study were obtained from (http://www.dsac.cn/DataProduct/Detail/200804). Data for the terminal lake (Sogo Nuur in Figure 1) area was collected from published papers [28]. Runoff observations in the middle and lower regions were obtained from the Bureau of Heihe River Water Resources Bulletin. Groundwater data were collected at long term groundwater monitoring wells in the study area. Farm area and socio-economic data for the middle and lower regions were collected from the regional statistical yearbook and annual reports in Ganzhou, Gaotai, Linze, and Ejna.

2.3. Methods

In this study, social-ecological network analysis (SENA) was used to analyze the social-ecological interdependencies of the riverscape [15,19]. This technique not only considers how social units interact, but simultaneously considers the structure of interactions between and among social and ecological units, and the ways in which this structure affects the performance of the system. Based on a previously developed framework [15], we construed the riverscape SES as nodes and links and analyzed the ecological- and social-level networks, respectively. We then appraised the matching of SE interdependencies to empirically investigate the SE interactions through a multilevel social-ecological perspective (Figure 2, which was modified from Barnes et al., 2017 [29]).
In this study, a SE network adjacency matrix (Figure 3) was used to depict which social nodes are connected (SS edges), what ecological nodes they work in (SE edges), and what ecological nodes are linked though hydrological processes (EE edges). If there was a link (edge) between nodes, the value “1” is used. Otherwise, “0” is used. The visualizations and analyses of the EE and SS networks were performed in R igraph package based on these adjacency matrixes, which are shown in Figures S1 and S2. Next, the construction process of the matrix will be described in detail.

2.3.1. Ecological Network Construction

To construct the ecological-level networks, landscape groups in the basin and their supporting systems (groundwater systems) were defined as ecological nodes. We use the term ‘‘group’’ in a very broad sense: any ensemble of units that, according to some criteria, distinguish themselves from other entities. Landscape group was defined as a collection of the same type of landscape patches (area >1000 m2) which have a relatively close spatial distance (<10 km). For example, farmland patches which are spatially separated but close to each other were uniformly divided into the farmland group. Landscape groups in midstream and downstream regions were split to better represent the local geography. Land use/cover datasets in 1990, 2000, and 2010 were used to detect the landscape groups and the area was calculated in ArcGIS (the periodical average area was used to represent the ecological nodes’ area in two periods). In this way, we determined 12 ecological nodes, which are shown in Table S1 in Supplementary Materials.
The ecological-to-ecological edges (EE edges) were established based on whether there were water flows between the ecological nodes, which are essential to enable landscapes to sustain the survival of species in arid regions. EE edges in this study only represent water flow and exchange between landscape groups because we concern mainly with landscape management related to water. The basin hydrographic net, floodplain, and the irrigation canal system datasets were used to identify the link between EE nodes. EE edges were assigned if water flows or shifts from one landscape group (groundwater system) to another. This means that if water flows from any subunit in the landscape group to another group, an EE edge will be created between the two landscape groups. For example, grassland near river is affected by river flooding, creating a link (edge) between the grassland group and river (water flows from river to grassland), although grassland which is away from the river only extracts water from the groundwater system. The direction of the EE edges represents the direction of the water flow.
All the EE edges are weighted by the average amount of water flow between ecological nodes. The surface water and groundwater irrigations measured by the water department were used to determine the weights of edges between the farmland group and the river and groundwater systems. The weight of edges between the midstream and downstream sections was determined by runoff observations at the two hydrological stations (Yingluo Gorge and Zhengyi Gorge). The weight of the edges between river and the groundwater system was determined based on the model simulation value of surface–groundwater exchange volume [30,31].
Since there is no observed data to determine the weights of the edges between forest, grass, wetland (not including wetland, Sogo Nuur shown in Figure 1, in downstream region, the weight of whose link with river can be determined by the runoff observations), and river (groundwater system), in this study, we assume that the surface evaporation of landscapes unaffected by flooding is all from groundwater, and the surface evaporation of landscapes affected by flooding comes from surface water and groundwater. Hence, these weights were estimated by the evaporation of the forest, grass, and wetland. The detailed calculations of evaporation were provided in the Supplementary Materials. Besides, because of the scarce precipitation in our study area, we assumed that there was no water flow among forest, grassland, and wetland.

2.3.2. Social Network Construction
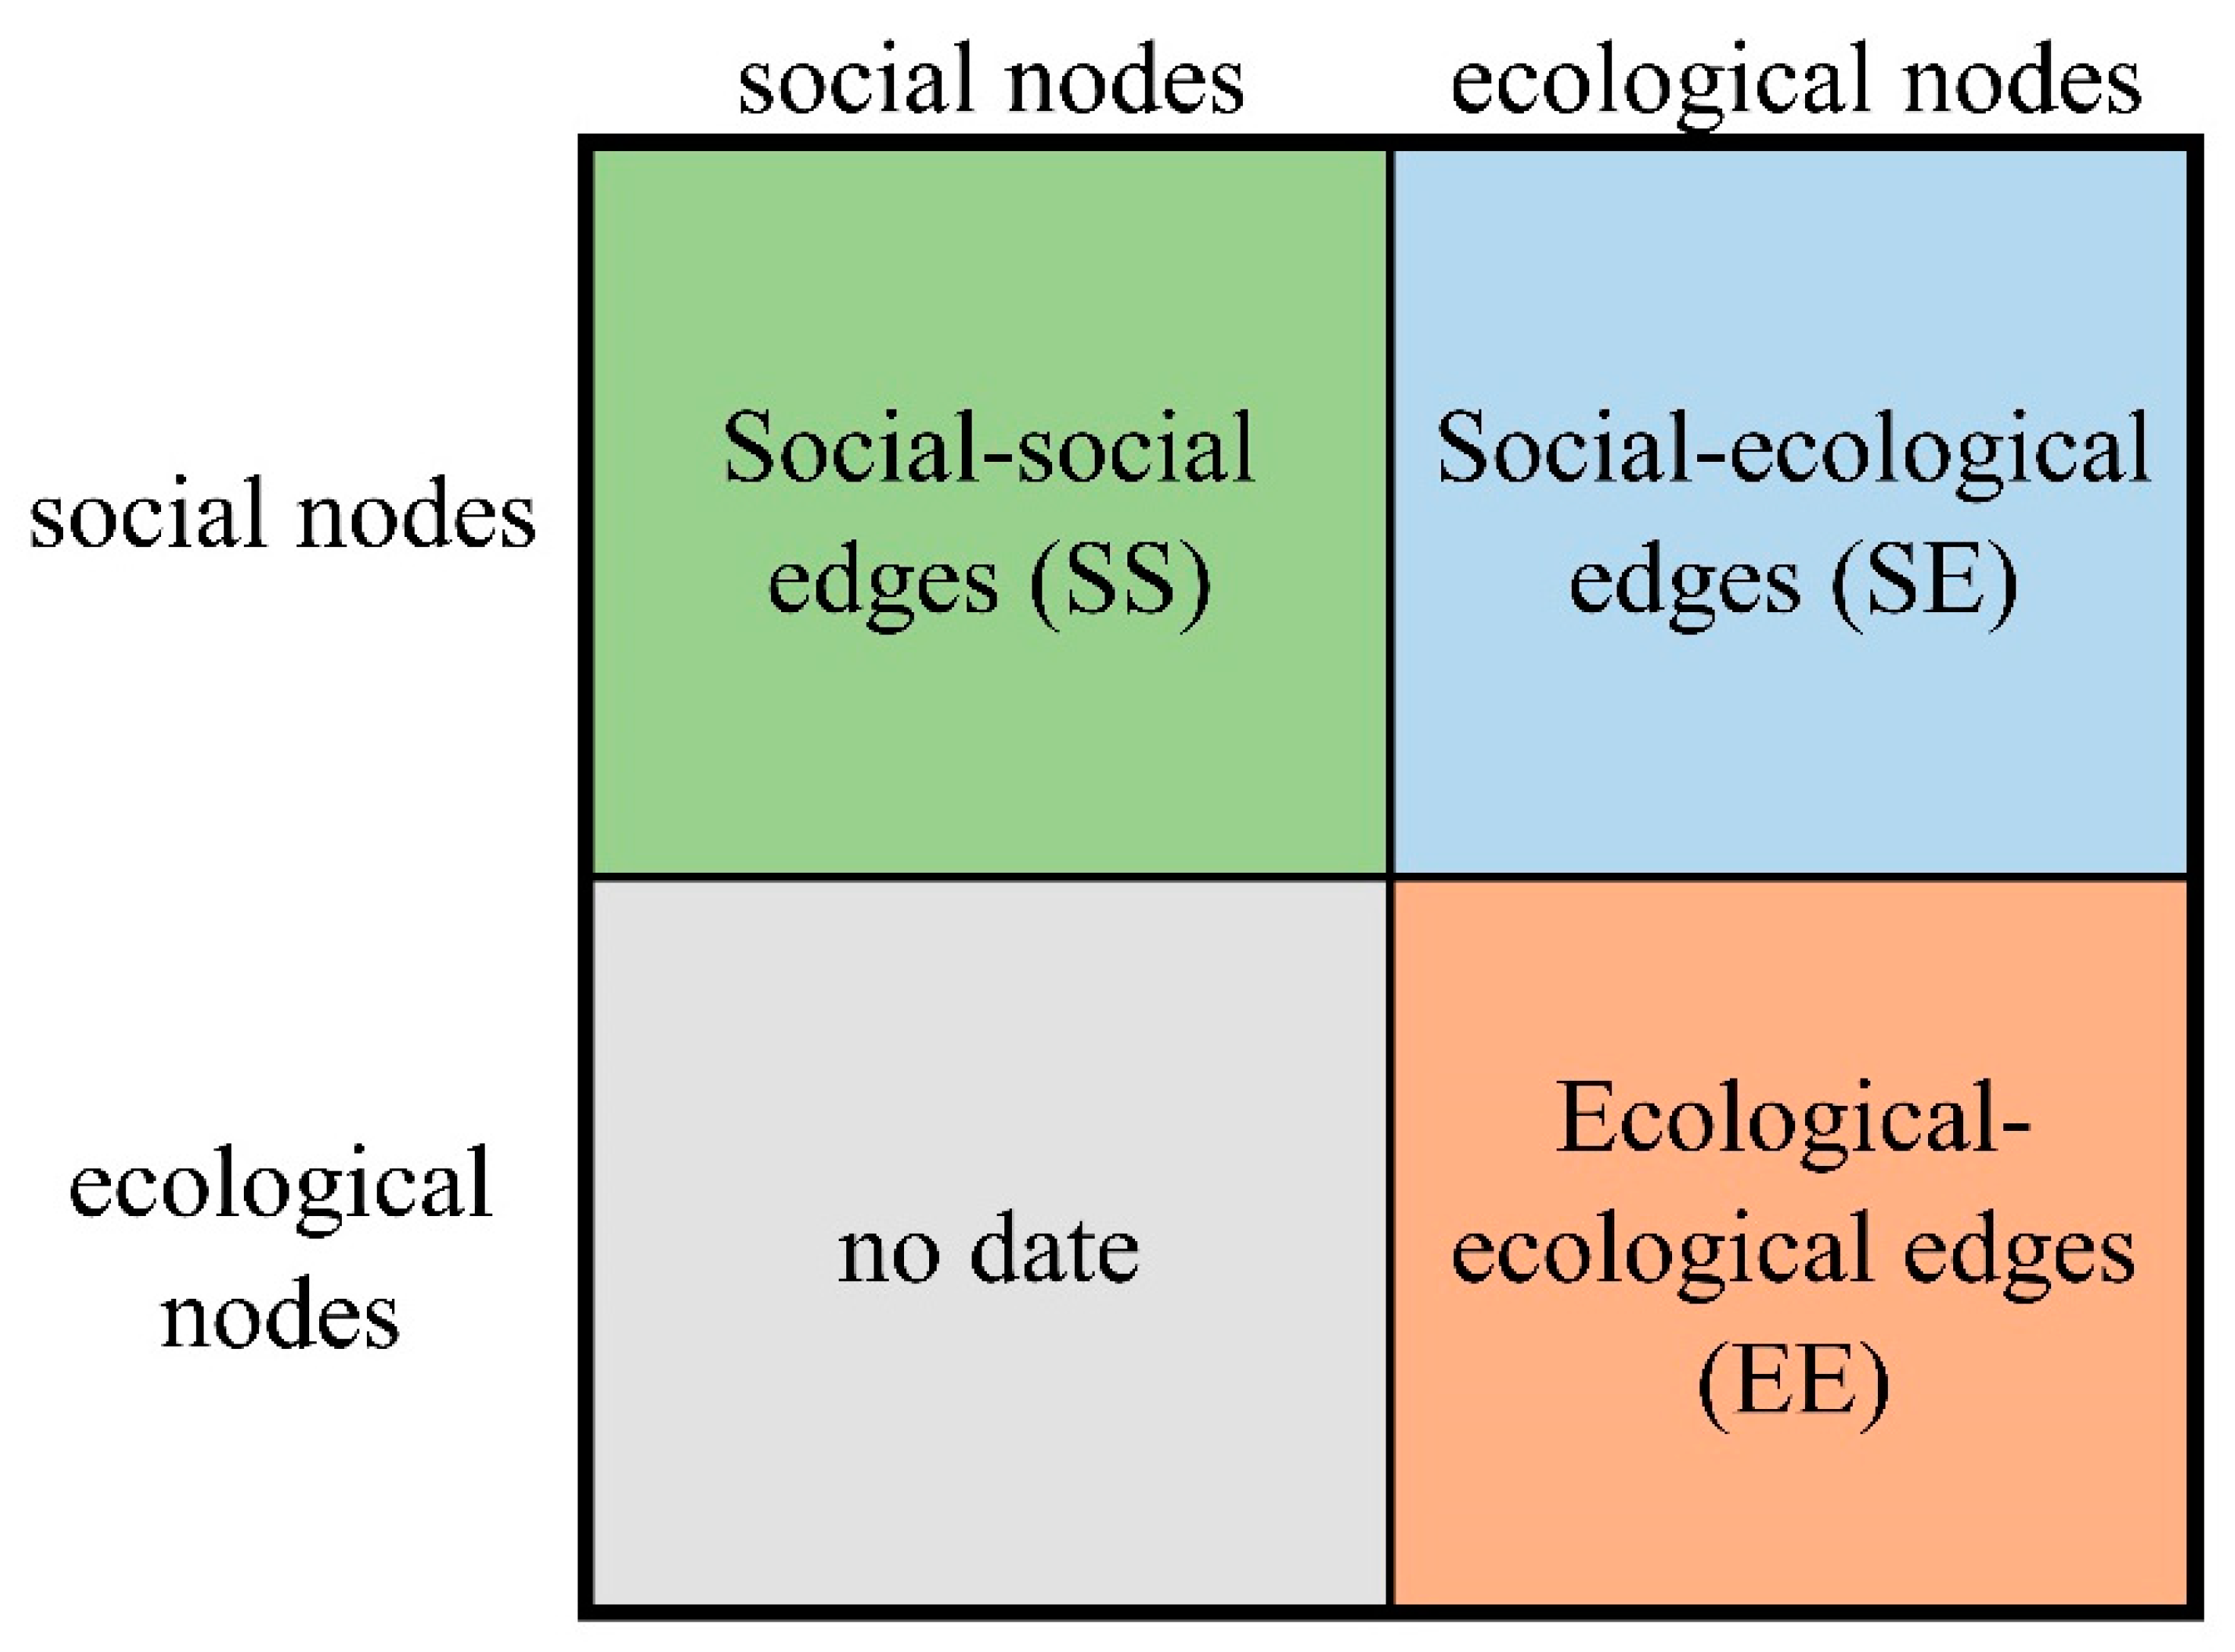
To construct the social-level networks, we conducted a comprehensive survey of the HRB in 2016 to determine the governance structure of the river basin through symposiums with management agencies and semistructured interviews with stakeholders. Through the survey and interviews, we obtained information for LWAP and RWAP as follows:
(1)
What agencies and organizations related to water management work in our study area and what are their responsibilities and functions?
In the symposiums which was organized by HRBR (S1), representatives of agencies and organizations undertaking work in the basin stated their management objectives and functions. All the agencies and organizations were defined as social nodes. The list of the management agencies and their functions can be found in Table S1.
(2)
What’s the jurisdiction of agencies and organizations and which landscape they work in?
Representatives provided this information during symposiums and interviews, based on which, edges between social and ecological nodes (SE edges) were established. For example, representatives of Zhangye Land Bureau (ZhLB) answered this question and said that they worked in the farmland in midstream (E1), the link between ZhLB and E1 was then established and “1” was set to the corresponding position in the adjacency matrix. For organizations who do not work in resource and landscapes, such as Governments (S8, S9), we suppose that there is no linked ecological node.
(3)
Are they affiliated or in collaboration with other agencies and how productive do they perceive the management and collaboration to be?
We conducted interviews with representatives of agencies (organizations) to ask them this question. If there is an affiliation or interorganizational collaboration between any two agencies, a link (edge) will be established between them (SS edges) and “1” will be set to the corresponding position in the adjacency matrix. Otherwise, no link will be established between them and “0” will be set.

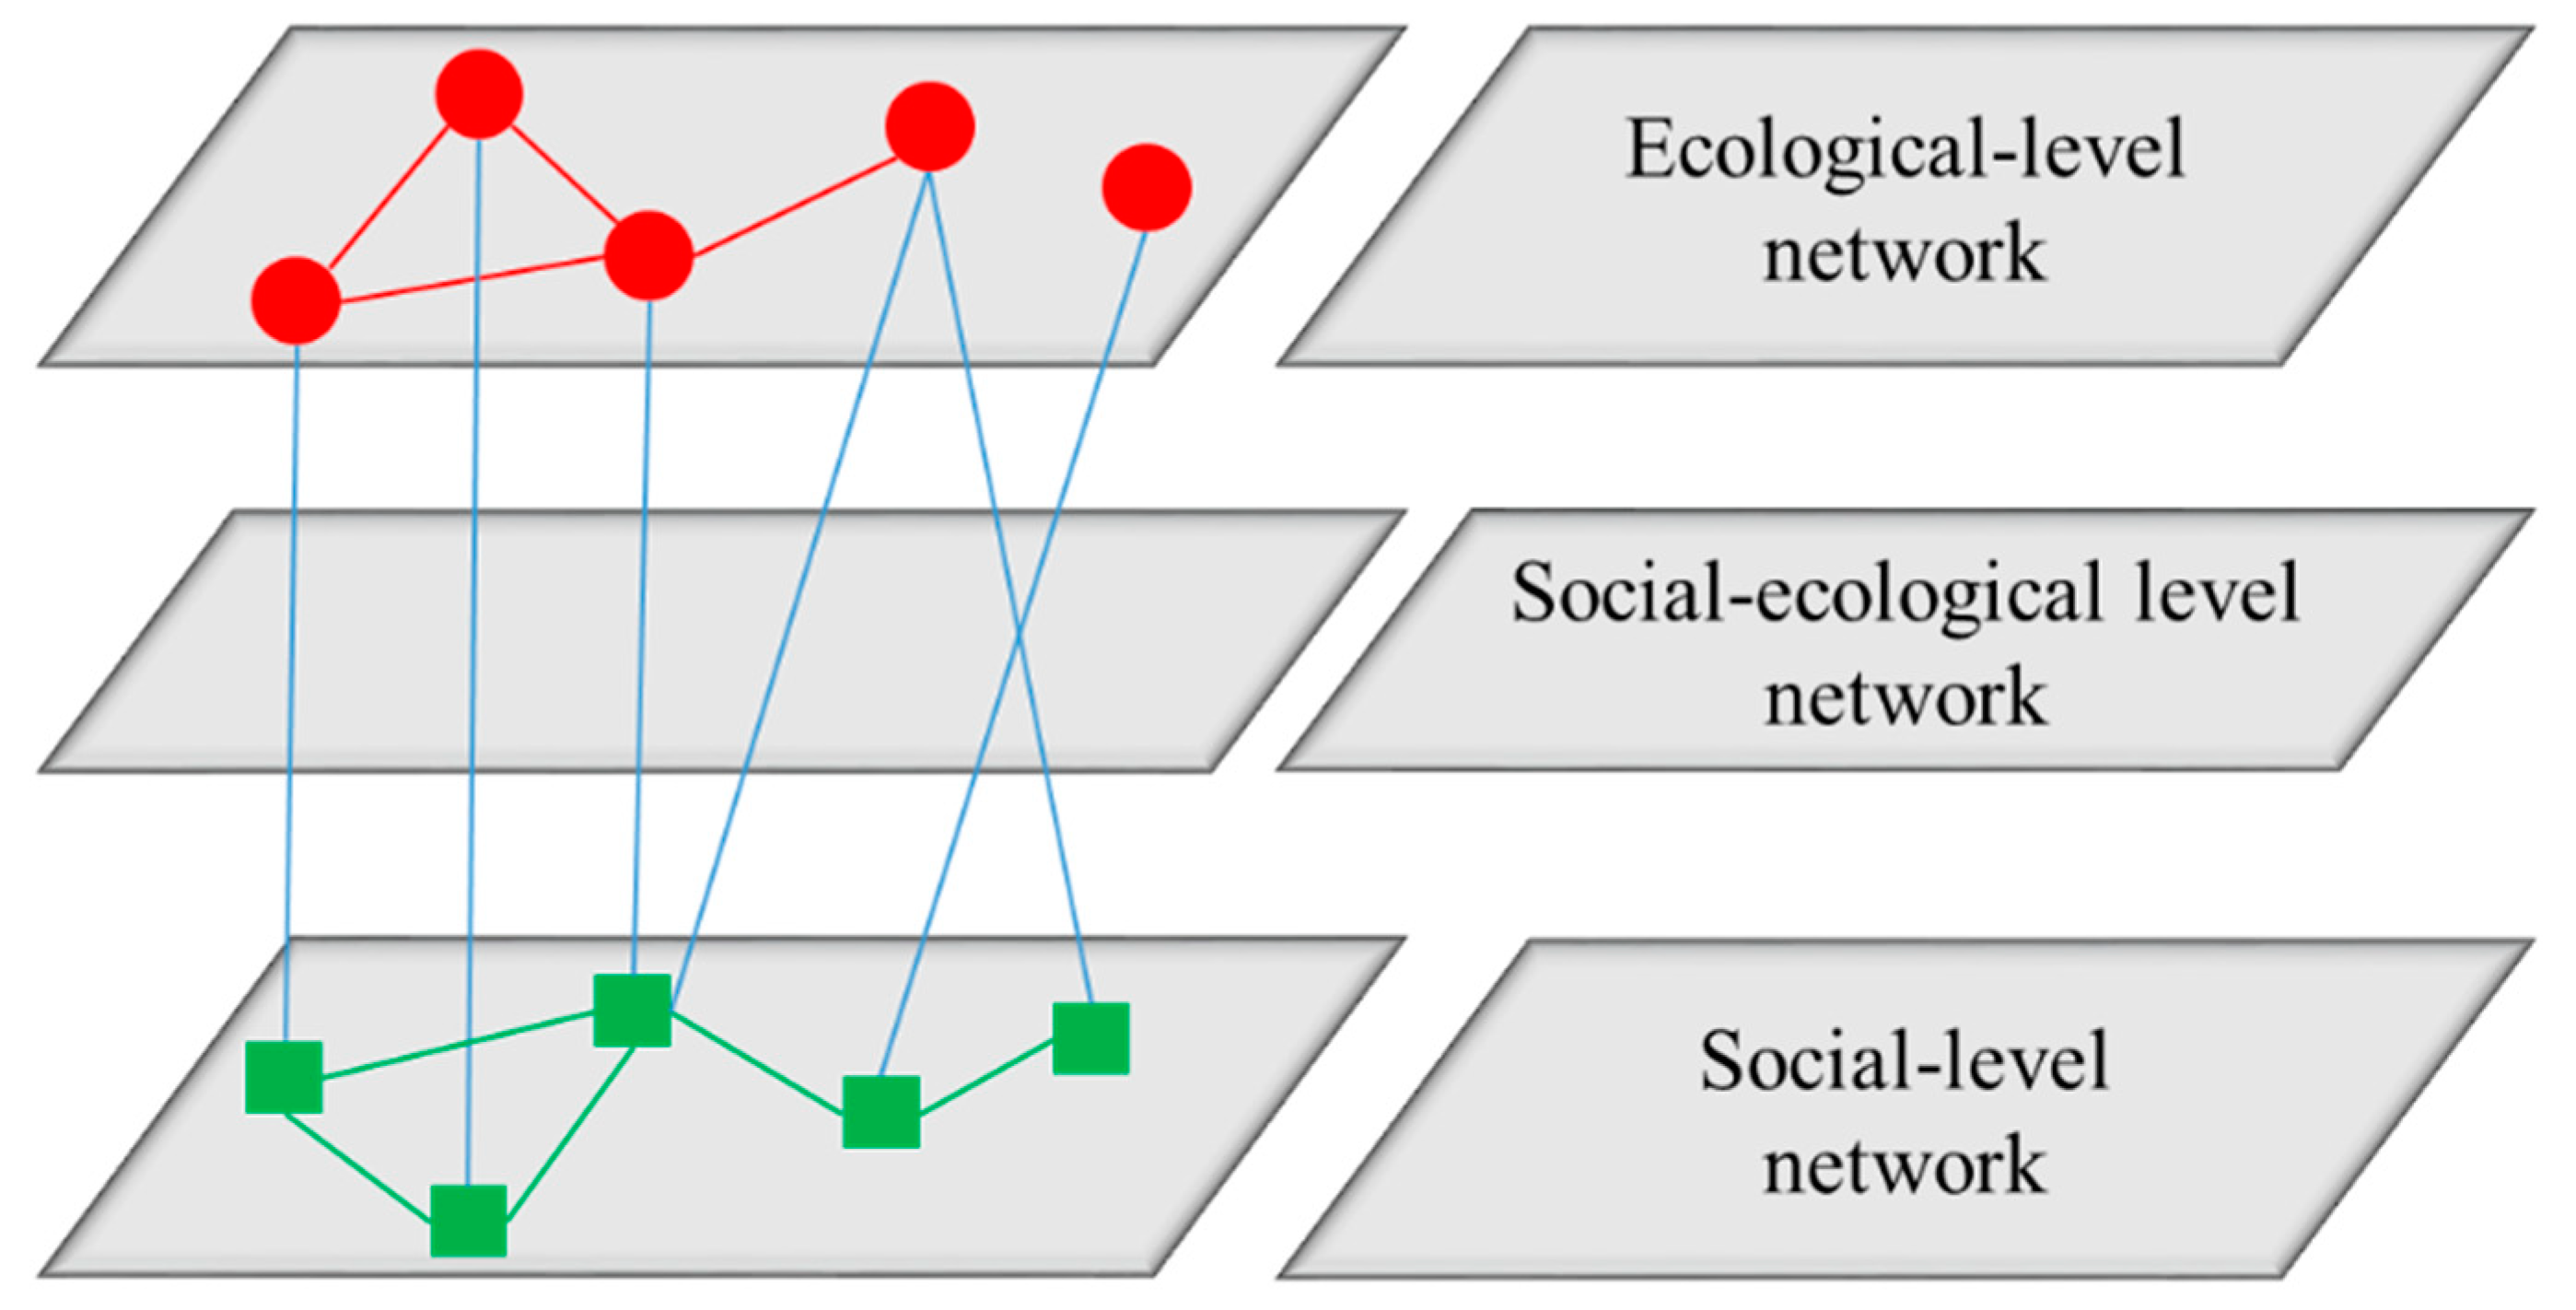
2.3.3. The Multiple SE Network Construction

After determining the SE adjacency matrix, we constructed the multiple SE networks. Networks in which multiple relations occur within the same system are termed “multiplexed”. In our study, this multiplex network consisted of only ecological nodes but there were two different types of linkages (edges) between ecological nodes. The first type of linkages were ecological connections, which were the same as the EE edges. The second type of linkages were managed links. They were formed between a pair of ecological nodes when one agency comanaged the two ecological nodes or there was a collaboration between the management agencies of the two ecological nodes. For example, from Figure S2, HRBR managed both the Middle reaches (E2) and Downstream reaches (E4) during RWAP; therefore, a managed link between E2 and E4 was established. Hence, each pair of connected ecological nodes (the value of EE edges = 1) would be judged based on the SS and SE edges in the adjacency matrix to establish whether there is a managed link between them. We only consider the managed links of the connected ecological nodes, because managed links between the unconnected ecological nodes are meaningless for our research. Hence, an adjacency table showing the two types of edges was established, which can be used to visualize the multiple SE networks in the R igraph software package.

2.4. Measuring Network Structures

Several well-known measures were used to analyze the network structure and one measure of matching degree was applied to analyze the SES match. Network density [32] measures the number of edges present between nodes relative to the total possible number of edges (ranging from 0 to 1). Strength (weighted vertex degree) [33] measures the strength of vertices in terms of the total weight of their connections. In the ecological networks, density reflects the intensity of connections between ecological nodes, while strength reveals the importance or centrality of a node in the network. Betweenness centrality [34] is defined as the number of shortest paths between pairs of vertices that pass through a given vertex. A social node with high betweenness is crucial for connecting different regions of the network by acting as a bridging actor. Community detection [35] refers to the division of the vertices of a network into groups or communities according to the pattern of edges in the networks. The groups that were formed were tightly knit, with many links inside the groups and only a few links between groups. We identified the optimal community structure of the ecological network by maximizing the modularity measure over all possible partitions [36] to understand the ecological network structure.
The matching degree is a new indicator that we developed in this study to reflect the extent of matching in SE networks. It is defined as the number of managed links relative to the total number of EE edges, which ranged from 0 to 1 (0 represents that there is no managed links between all the connected ecological nodes, and 1 represents that each pair of connected ecological nodes has a managed link). A high value represents a high match in the SES. All indexes were calculated in the R igraph software package.

3. Results

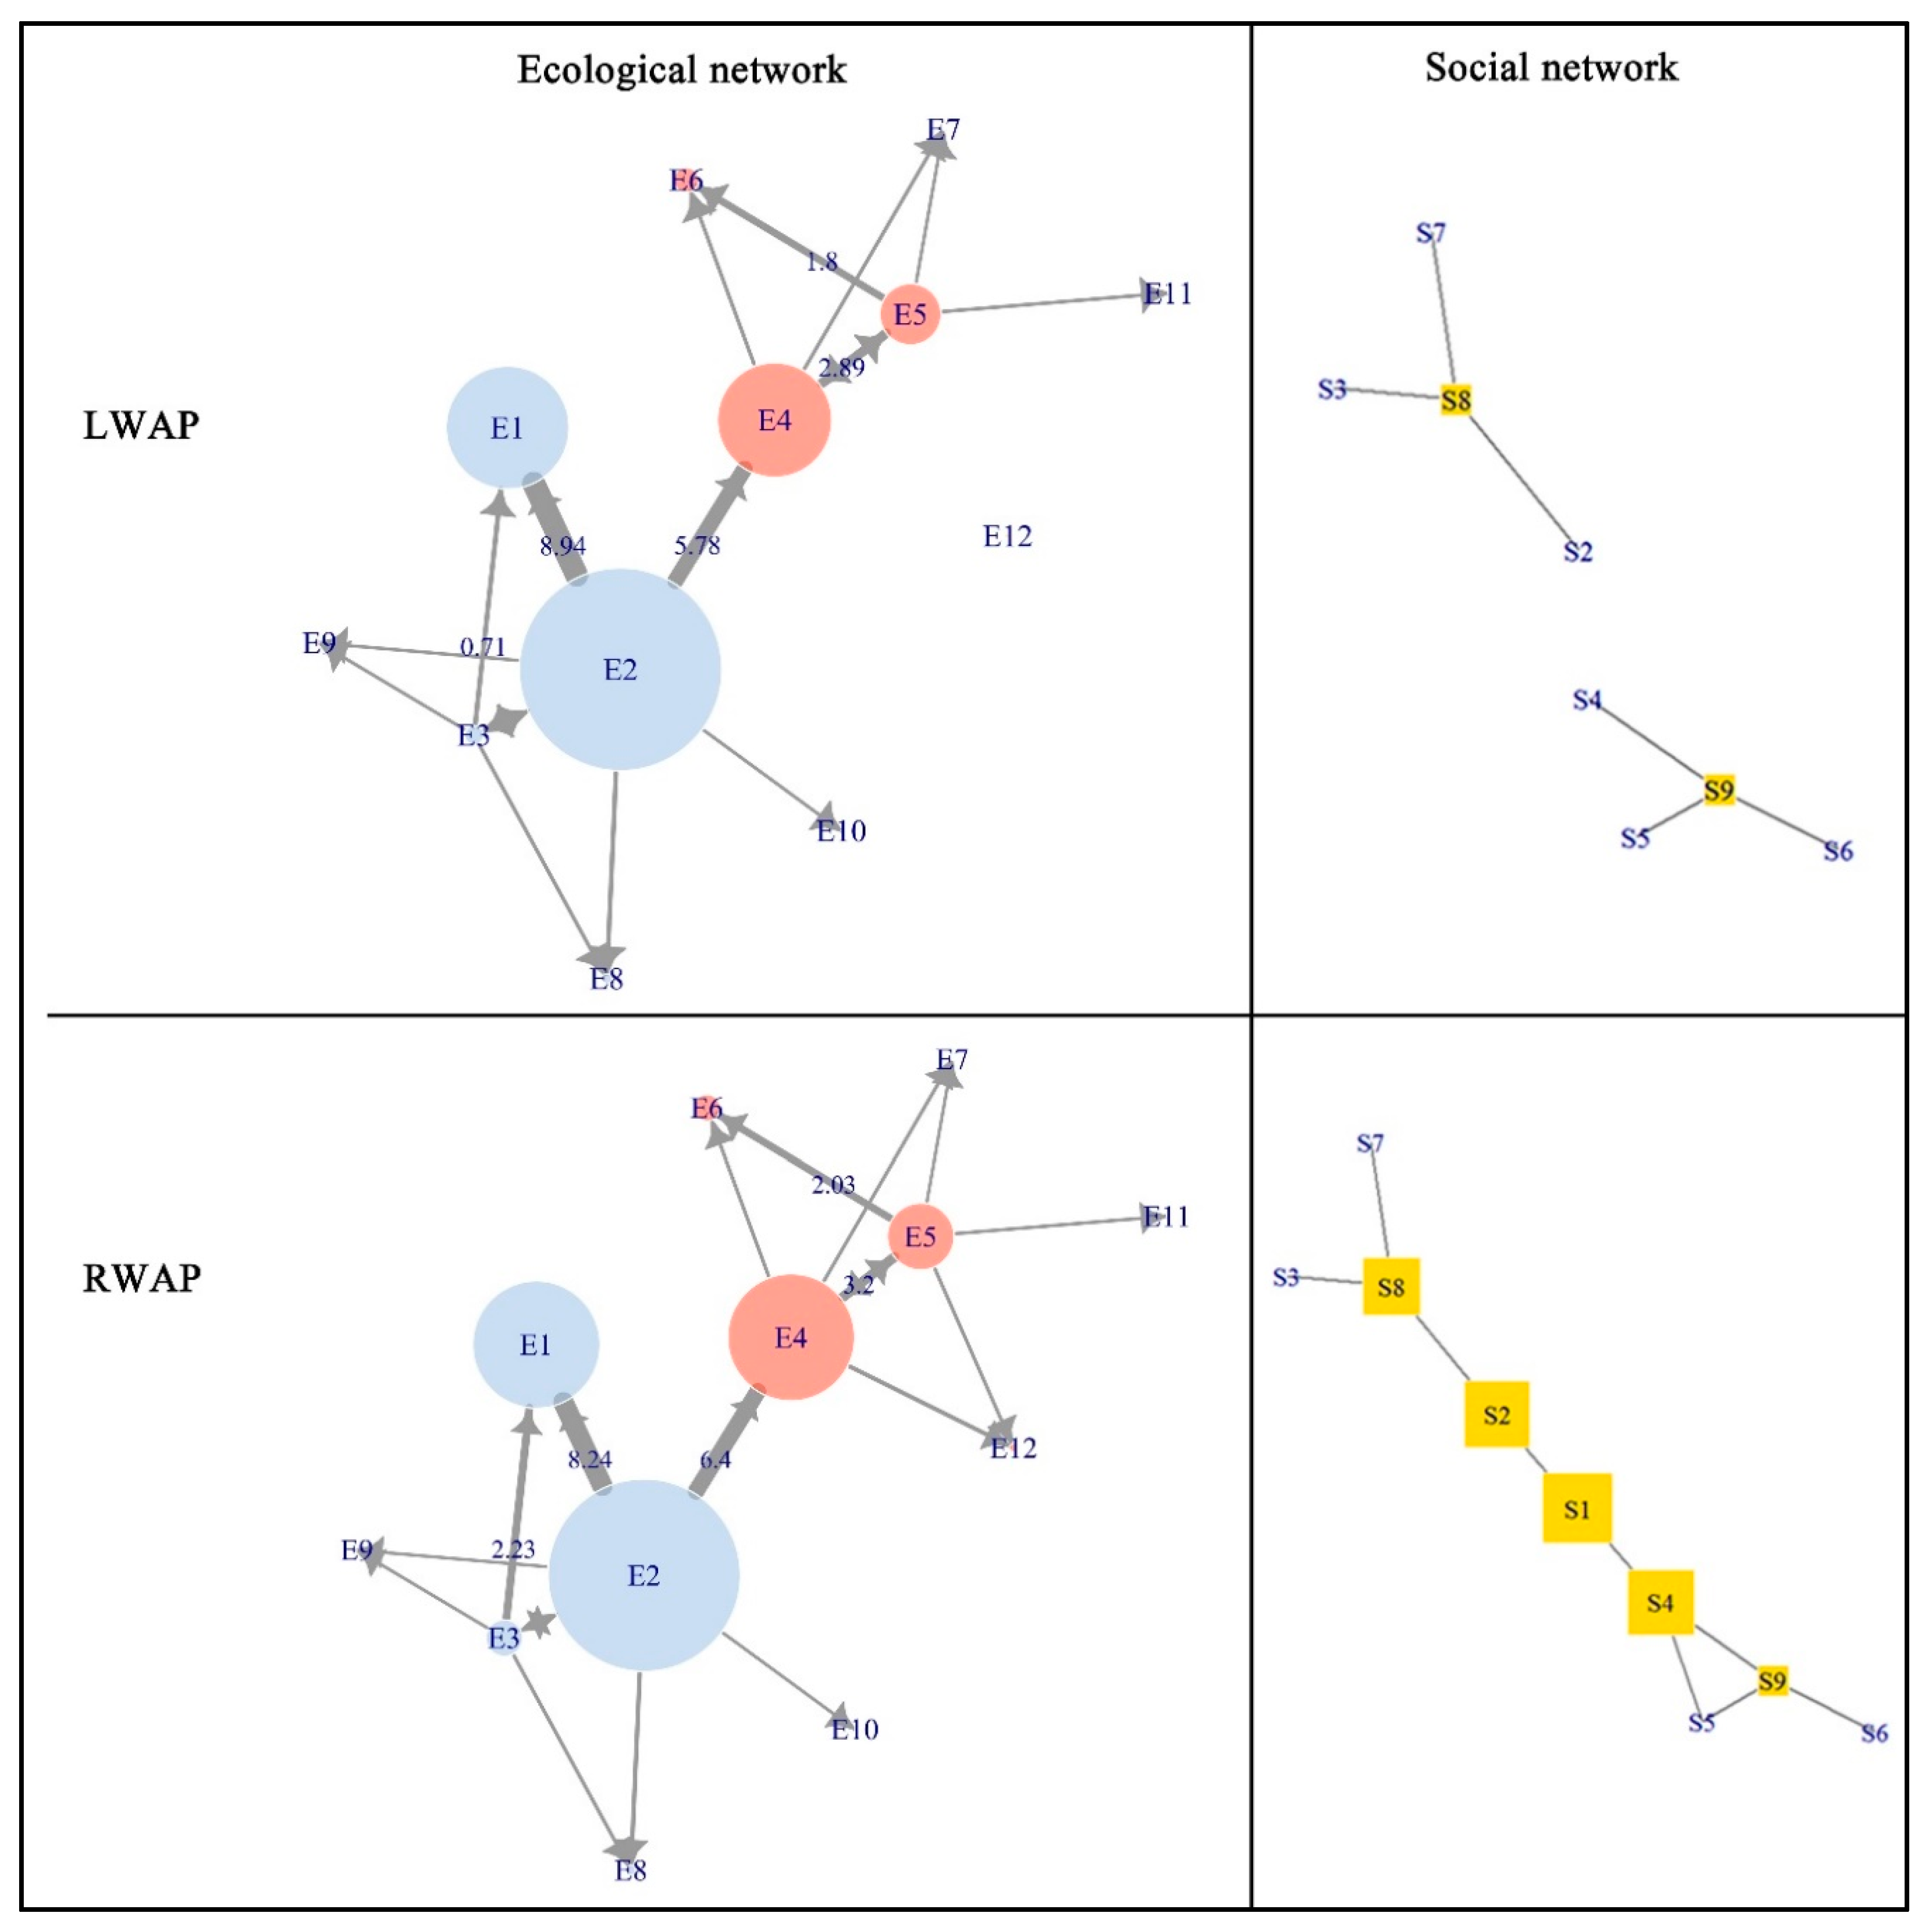
3.1. Evolution of the Ecological and Social Networks

Figure 4 shows the evolution of the ecological and social networks. The circles represent ecological nodes and rectangles represent social nodes. The analysis of the ecological network showed that the basin ecological network was a sparse network (network density = 0.12 and 0.13 during LWAP and RWAP) and the river system, groundwater systems, and farmland, which had a high degree of centrality, played vital roles in the networks. The topological structure of the ecological network only experienced minor changes from the LWAP to the RWAP, but the weighting of most edges in the network clearly changed. The colors of the nodes in the ecological networks denote the memberships of the two communities, which were identified by the optimal algorithm. The results of communities identified correspond almost perfectly to the known landscape groups in the middle and downstream regions. The two most weighted nodes, E2 (river landscape in the midstream reach) and E4 (river landscape in the downstream reach), appeared in different communities. The weight of edges in the downstream region (red ecological nodes) displayed an increasing trend.
From the social (governance) network in the HRB shown in Figure 4, there was no linkage between organizations in midstream and downstream regions during LWAP. It was apparent that the most significant change in the social (governance) network structure was that a new social node S1 (HRBR), which had the highest betweenness centrality, emerged and connected the water bureau in the midstream (S4) and downstream regions (S2) as a bridging organization. Besides, there was a collaboration between water (S4) and forest (S5) bureaus in Ejna during RWAP.

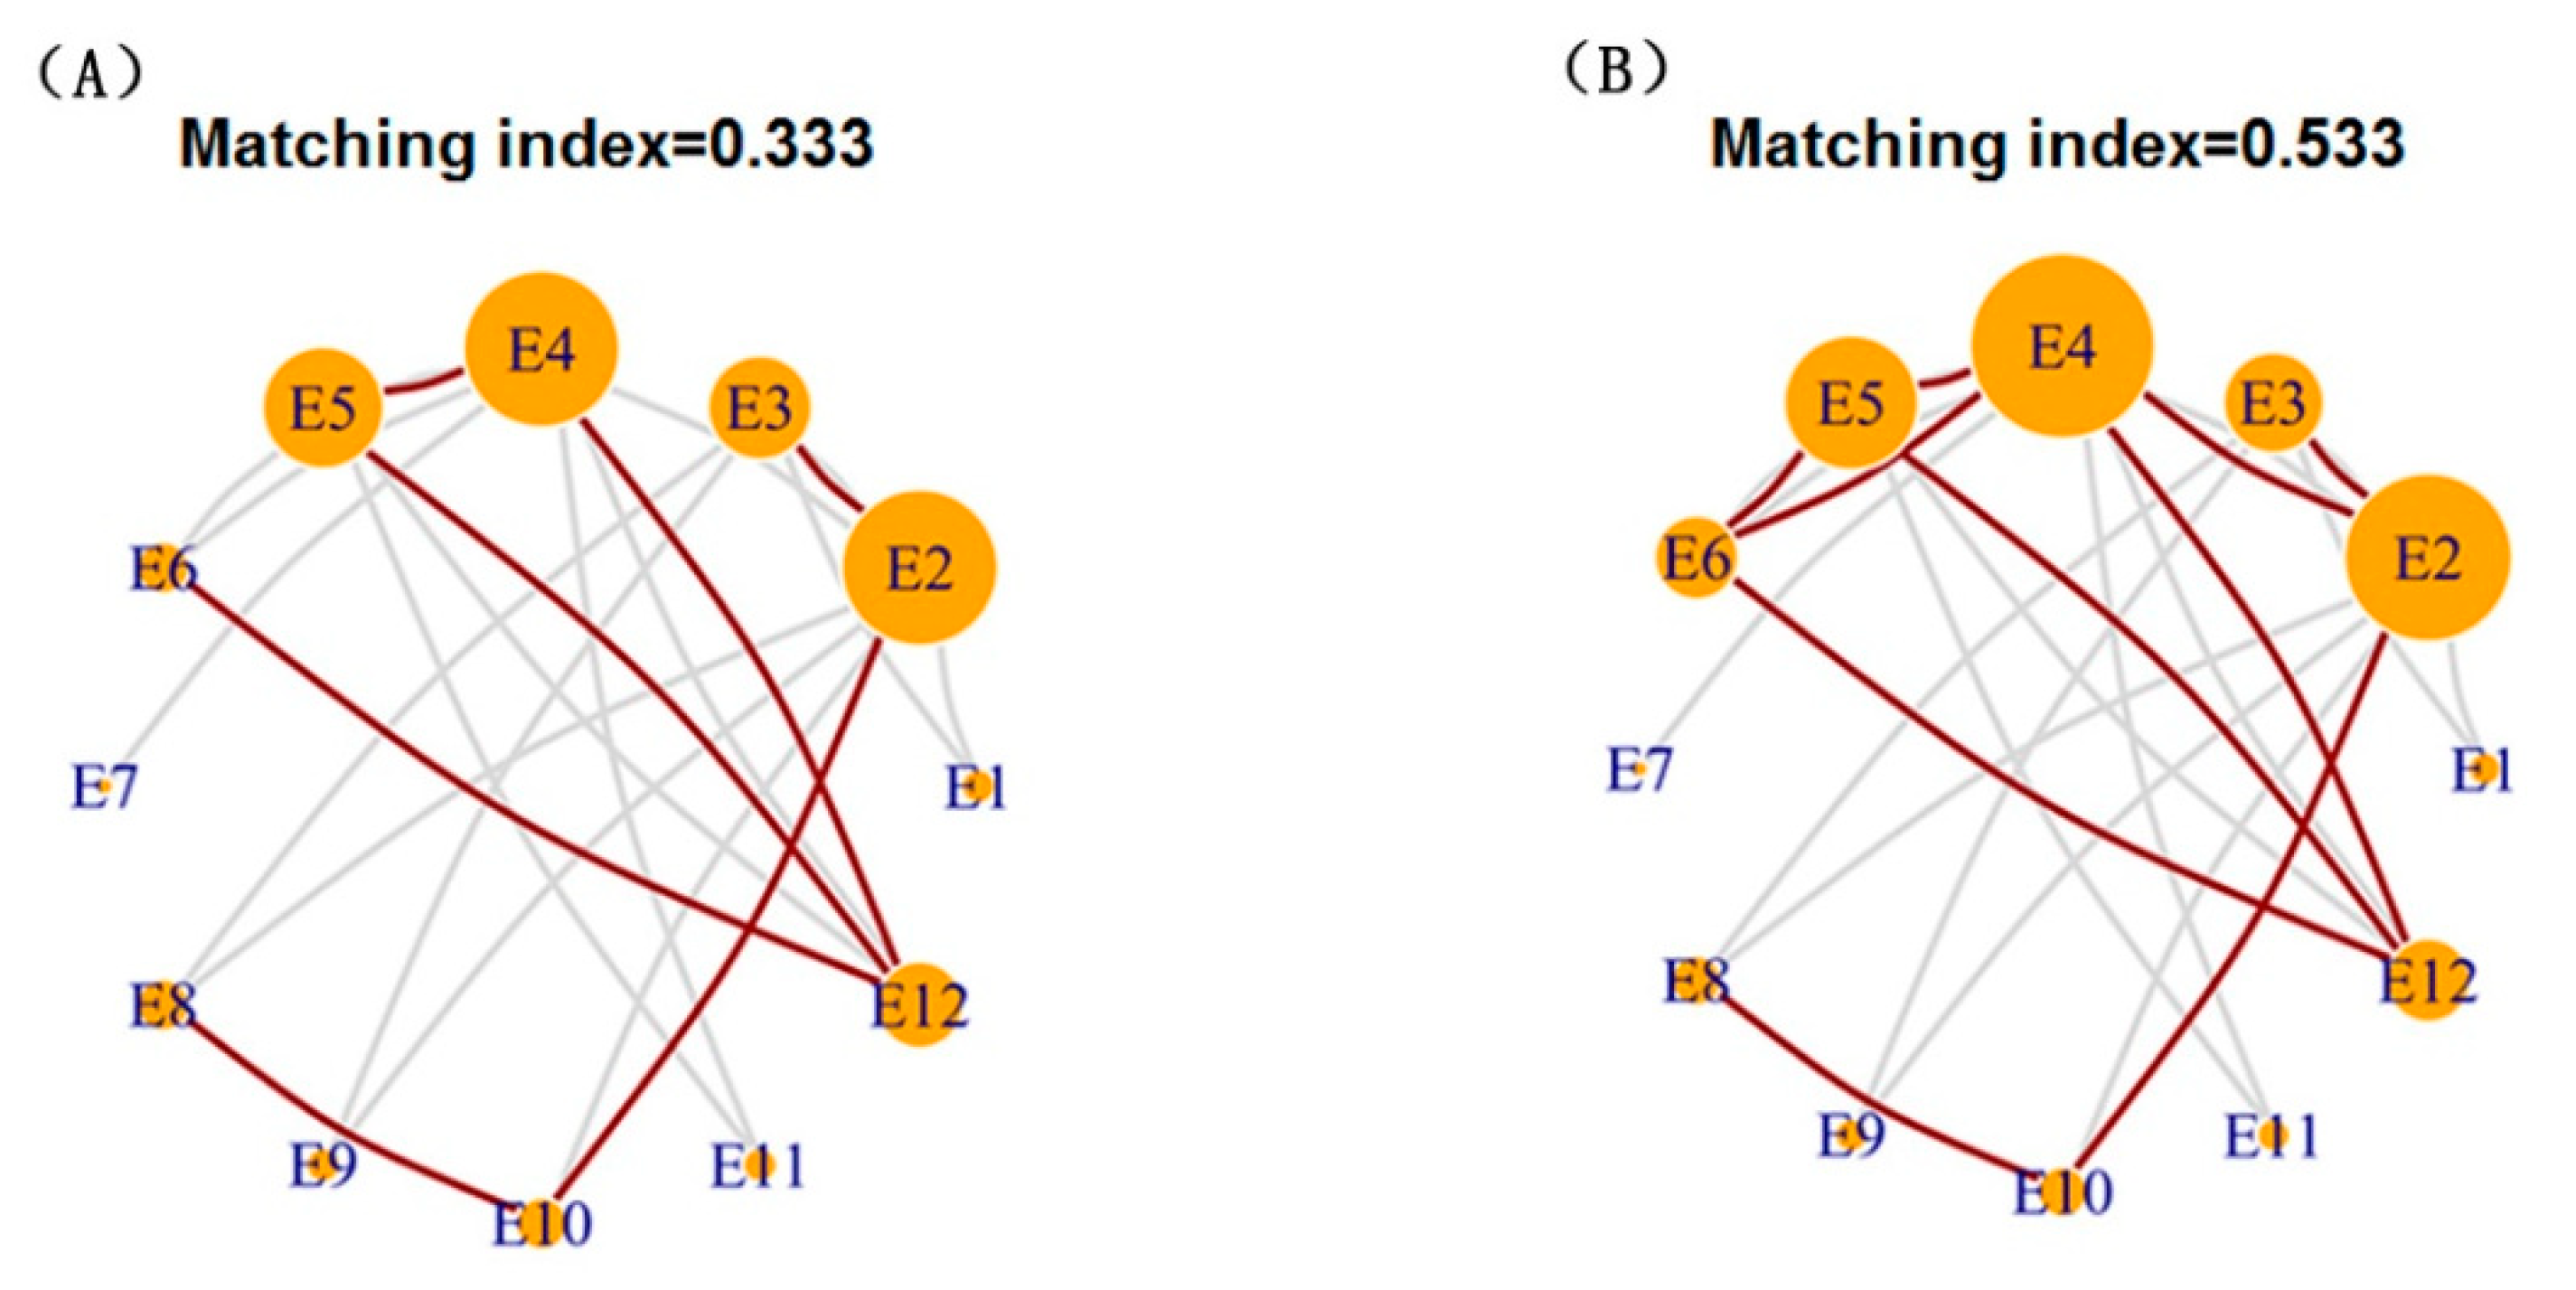
3.2. The Matching Degree of the Ecological and Social Systems

A matching index was used to understand the fit (match) between ecological and social systems. The results (Figure 5) showed that the basin SES had a low matching degree, although it increased from 0.33 to 0.53 over the two water allocation periods. The increase in the matching degree was mainly due to the emergence of a new managed link between E2 (the middle reaches of the river) and E4 (the lower reaches of the river). These two nodes had the greatest centrality degree in the SE network, which demonstrates that they had a significant impact on the entire network. Node E1 (farmland in midstream) had a high strength (weighted degree) in the ecological network, but had a low matching degree in the SE network. This indicated that the management of the farmland in the midstream region was relatively isolated.

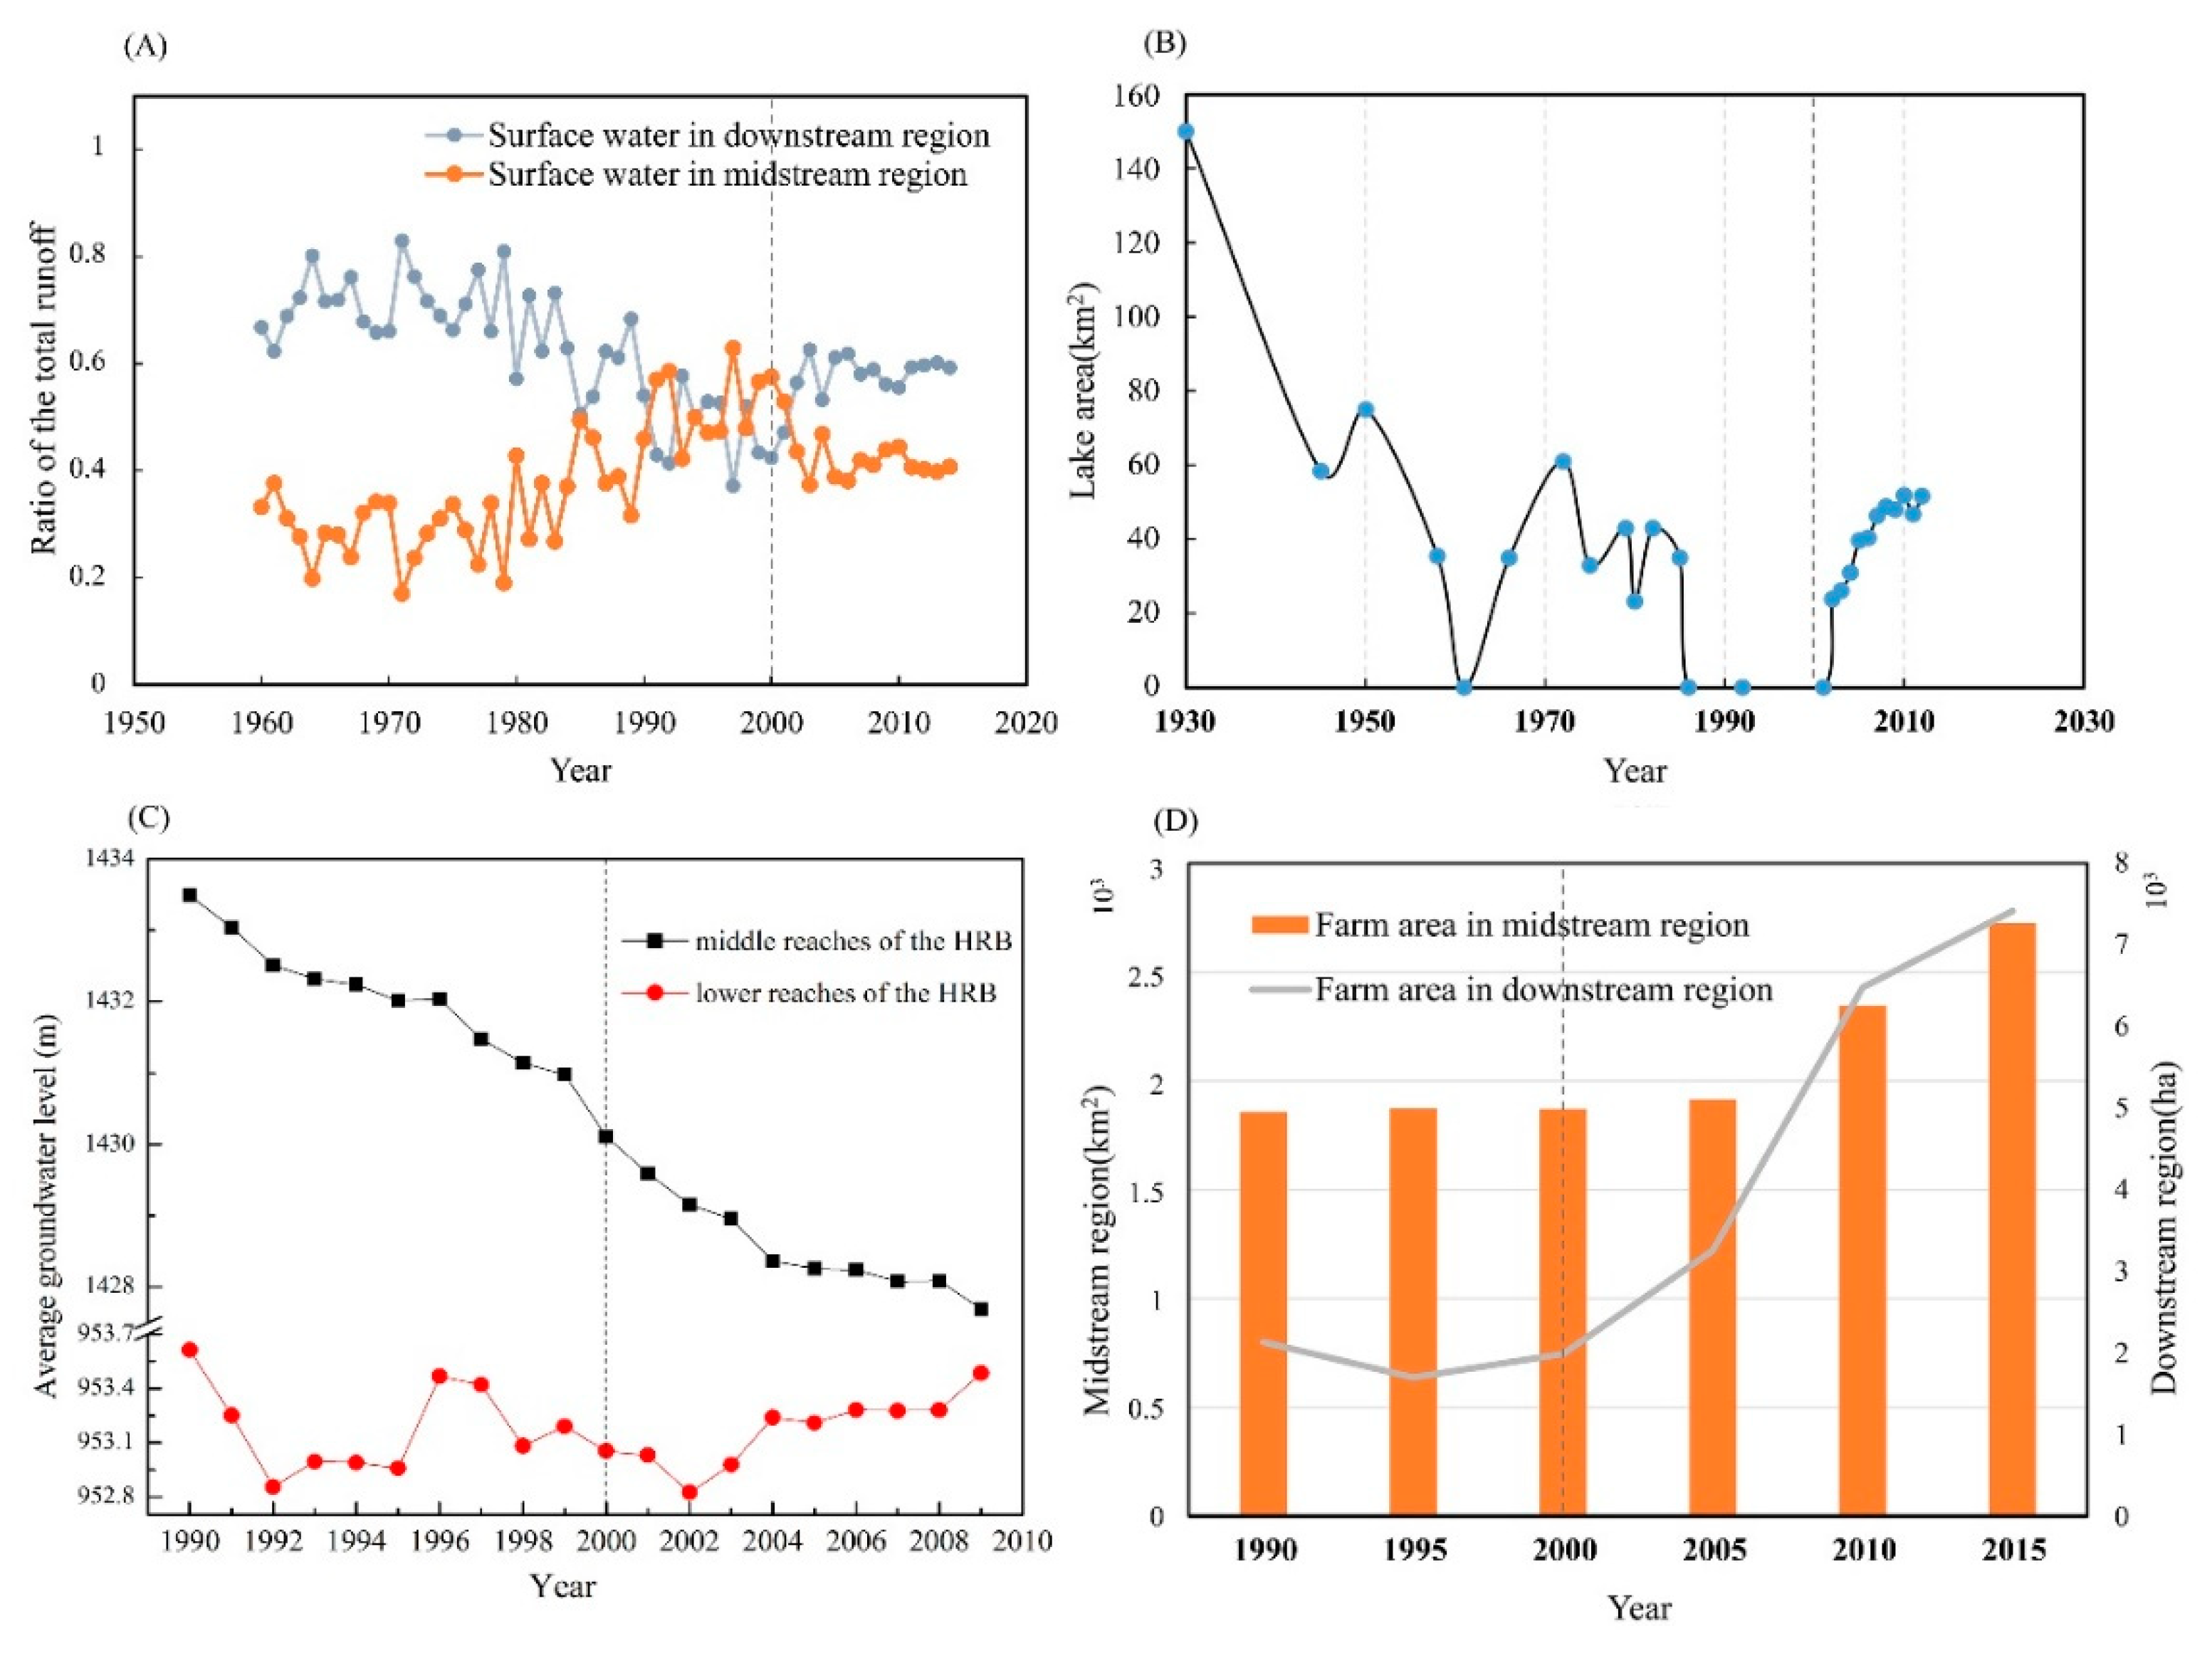
3.3. Effects of the SES Structure Change

From an analysis of the SE network, the structure of governance network did not align with the river systems which were governed during the LWAP, which led to the gradual decrease of streamflow in the downstream region (Figure 6A) and resulted in the degradation of downstream ecological functions. Figure 6B,C show that groundwater levels in the downstream region declined, and the terminal lake (E12) shrank and eventually disappeared during the LWAP.
After the structure of the SE network changed and the matching degree of SE systems increased, the increase in the proportion of downstream surface water followed the closure of these, and the water volume in the middle and lower reaches gradually reached a new balance (Figure 6A). The farmland in both downstream and midstream regions also responded to the structure change of the SE network and began to expand, and the expansion of the downstream farmland occurred at a remarkable rate (Figure 6D). The groundwater level in the downstream region was elevated and the terminal lake gradually recovered during the RWAP. However, the groundwater level in the midstream region continually declined after the structure of the SES changed.

4. Discussion

4.1. High-Level Authority Improved the Basin SES Fit Which Promoted the Sustainable Management of the River Basin

A spatial-scale mismatch resulting from rivers spanning various human-defined boundaries often results in ecological degradation [37,38,39]. Our results showed that the degradation of the downstream regions of the HRB before 2000 followed this general pattern. The directionality of the ecological network in the HRB indicated that local stakeholders in midstream and downstream regions were not equal in terms of water resource access, with downstream actors being at a disadvantage. They could not capitalize equally on the benefits of horizontal collaboration, which made horizontal collaboration difficult. Hence, a highly centralized government agency could coordinate stakeholders efficiently and manage the river by force. In our study, a new deliberate and purposeful governance regime obviously changed the structure of basin governance through HRBR. Due to its high betweenness, the HRBR is a bridge organization that promotes coordination and cooperation between the water-related organizations in the midstream and downstream areas. The matching degree of the basin SE system therefore increased from 0.33 to 0.53. The spatial-scale matching of the river and its management enabled river water reallocation between midstream and downstream areas, as shown in in Figure 6A, with the water volume in the middle and lower reaches gradually reaching a new balance. Both the economy and population in midstream and downstream regions then developed rapidly [40]. Given the huge impact of the downstream river reaches, the ecosystems in the downstream areas of the basin have therefore been considerably restored, with 11.8% of the downstream area showing a significant increasing trend in mean growing season normalized difference vegetation index (MGSNDVI) values over the RWAP [40]. The terminal lake also gradually recovered over the same period.

4.2. Cross-Boundary Management Restricted to Only the River Has Exacerbated Local Environmental Pressures

Although the emergence of bridging organization improved the SE match and increased the effectiveness of basin governance, there are still governance challenges to face, including the SE mismatch [41]. From our results, the ecological network in the HRB has a low network density and high vertex strength, and the ecological nodes with high strength (middle reaches and downstream reaches) are well-connected but belong to different communities. This implies that the effect of the actions of these high strength nodes can spread to other nodes beyond the realm of managing actors because the nodes inside one community always show stronger connections among them. Moreover, our results indicate that the basin SE network has a low matching degree, which demonstrates that many ecologically interconnected nodes have relatively isolated management regimes. For example, as an alternative surface water resource, the utilization of the groundwater in the midstream region cannot be independent of the surface water allocation pattern in the regional environment. Moreover, the regulation and monitoring of groundwater extraction are difficult and are therefore rarely applied. Without organizations comanaging the farmland and groundwater use, farmers in midstream regions would develop a greater dependence on ground water to irrigate because of the reduction of surface water in midstream regions caused by river comanagement. This is indicated by the continued decline in groundwater in midstream areas shown in Figure 6C. Hence, ignoring the location and importance of ecological nodes in the network, managing only a subset of the nodes (resources) will exacerbate local environmental and ecological pressures.
A similar problem has also occurred in the downstream region. After the change of the social governance network, the amount of streamflow discharged to the downstream region increased, and the economy and population developed rapidly. The water demand for farmland in the downstream region will therefore undoubtedly increase. It can be expected that farms will expand continuously and compete for water with the local ecosystems if there is no comanagement and coordination between farmland and ecological use on water.

4.3. Implications for Sustainable Basin Governance

The HRB has complex social and ecological factors that interact with each other and involves common resources, whose governance cannot be addressed by a single disciplinary approach but rather requires an integrative approach, with interdisciplinary consideration and collaboration. Hence, a social-ecological network perspective is required to fully understand the key processes and linkages between people and nature. Although this has been recognized [42,43], it is still a challenge to apply it to basin governance. To achieve sustainability in the basin, a more robust governance regime should be created, and the function of the sectors and organizations should be determined and improved by considering not only the spatial-scale of the ecosystem, but also the characteristics of the basin’s ecological network. Since the farmland is an important ecological node of the SES in HRB, its change in area and crop planning structure, which impact the irrigation amount, will affect the whole network. Hence, in the future, the HRBR should coordinate watershed spatial planning to manage both the cross-boundary river and the lands (forest, farm, and grass) within a network system. Moreover, the local land sectors should cooperate with the water sector, which will further improve the matching degree of the SES, to determine the appropriate scale of agricultural land and control its expansion to avoid the occupation of ecological water.

4.4. Comparisons With Other Commons Governance

Previous social-ecological system studies are based on separate commons, such as a fisheries [13,16,44], lakes [45], pasture [46], or forests [15,17,47]. When using the network approach to disentangle it, the focus of attention is the relationships between actors (who directly obtained resources) and resource, hence the construction of the network relationship is straightforward and the change of the dependence of the actor and resource will lead to direct short-term outcomes, even if governments also play different roles in the process. The key progress of the SES studies, the hypothesis of collaboration between actors causing positive outcomes of resource, is also based on these studies of SES. However, the riverscapes involving multiple commons resources (such as forest, lake, grass) and multisector management should be regarded as a hugely complex SES which consist of multiple small SESs [2]. Especially in China, governments play a leading role in riverscape management because of the unique social and cultural background. In our study, a social-ecological network approach was firstly used to conceptualize a complex SES, Heihe riverscapes in China, into a network, and effectively capture and analyze the relationships between social and ecological nodes. It is a meaningful attempt to advance the understanding of human–environment relationships and provides key and unique empirical insight into SES research. More similar cases are still needed to test the hypothesis based on separate SESs and to verify the practicality of the approach in the coupled complex social-ecological systems.

5. Conclusions

The social-ecological perspective is a new idea for dealing with riverscape management. In this paper, we constructed and analyzed a social-ecological network of riverscapes in the Heihe River Basin by a social-ecological network analysis method, which is a new and efficient method to deal with the structure of social-ecological systems, and investigated the structural changes and their outcomes. Results indicated that the success of basin governance for sustainability requires not only the spatial matching of a certain ecological node (resource) and its management, but also a matching between the management network and the ecological network. We suggest the local land sectors should cooperate with the water sectors to further the social-ecological matching and determine the appropriate scale of agricultural land. Land policies controlling the expansion of agricultural land should be formulated to avoid the occupation of ecological water. These will require new and creative forms of cooperation among government sectors, ecologists, and stakeholders to sustain and rebuild harmonious human and natural ecosystems in the future. More case studies in different fields and regions are necessary to investigate the relationship between social-ecological structure and its ecological outcomes.

Supplementary Materials

The following are available online at https://www.mdpi.com/2071-1050/11/19/5159/s1, Figure S1: The linkages in the SE system during LWAP. “1”s represent links and “0”s represent no links; Figure S2: The linkages in the SE system during RWAP. “1”s represent links and “0”s represent no links; Table S1: The lists of the nodes.

Author Contributions

Conceptualization, S.W.; Funding acquisition, B.F.; Methodology, M.Z. and S.S.; Software, M.Z.; Supervision, B.F.; Writing—original draft, M.Z.; Writing—review & editing, S.W., B.F., X.W., C.W., S.S. and F.W.

Funding

This research was funded by National Natural Science Foundation of China (No. 41722102), and the National Key Research and Development Program of China (NO. 2017YFA0604700).

Acknowledgments

The authors wish to acknowledge Haibin Chen in Northwest A&F University for the help in improving this research. Many thanks are due to the anonymous referees for their detailed and helpful comments.

Conflicts of Interest

The authors declare no conflict of interest.

References

  1. Hand, B.K.; Flint, C.G.; Frissell, C.A.; Muhlfeld, C.C.; Devlin, S.P.; Kennedy, B.P.; Crabtree, R.L.; McKee, W.A.; Luikart, G.; Stanford, J.A. A social-ecological perspective for riverscape management in the Columbia River Basin. Front. Ecol. Environ. 2018, 16, S23–S33. [Google Scholar] [CrossRef]
  2. Dunham, J.B.; Angermeier, P.L.; Crausbay, S.D.; Cravens, A.E.; Gosnell, H.; McEvoy, J.; Moritz, M.A.; Raheem, N.; Sanford, T. Rivers are social–Ecological systems: Time to integrate human dimensions into riverscape ecology and management. Wiley Interdiscip. Rev. Water 2018, 5, e1291. [Google Scholar] [CrossRef]
  3. Ostrom, E. Governing the Commons: The Evolution of Institutions for Collective Action; Cambridge University Press: Cambridge, UK, 1990; p. 280. [Google Scholar]
  4. Turner, M.G. Landscape Ecology: The Effect of Pattern on Process. Annu. Rev Ecol. Syst. 1989, 20, 171–197. [Google Scholar] [CrossRef]
  5. Nagendra, H.; Munroe, D.K.; Southworth, J. From pattern to process: Landscape fragmentation and the analysis of land use/land cover change. Agric. Ecosyst. Environ. 2004, 101, 111–115. [Google Scholar] [CrossRef]
  6. Opdam, P.; Luque, S.; Nassauer, J.; Verburg, P.H.; Wu, J. How can landscape ecology contribute to sustainability science? Landsc. Ecol. 2018, 33, 1–7. [Google Scholar] [CrossRef] [Green Version]
  7. White, P.S. Pattern, process, and natural disturbance in vegetation. Bot. Rev. 1979, 45, 229–299. [Google Scholar] [CrossRef]
  8. Stallins, J.A.; Parker, A.J. The Influence of Complex Systems Interactions on Barrier Island Dune Vegetation Pattern and Process. Ann. Assoc. Am. Geogr. 2003, 93, 13–29. [Google Scholar] [CrossRef]
  9. Liu, J.; Gao, G.; Wang, S.; Jiao, L.; Wu, X.; Fu, B. The effects of vegetation on runoff and soil loss: Multidimensional structure analysis and scale characteristics. J. Geogr. Sci. 2018, 28, 59–78. [Google Scholar] [CrossRef]
  10. Dallimer, M.; Strange, N. Why socio-political borders and boundaries matter in conservation. Trends Ecol. Evol. 2015, 30, 132–139. [Google Scholar] [CrossRef] [PubMed]
  11. Barnes, M.L.; Lynham, J.; Kalberg, K.; Leung, P. Social networks and environmental outcomes. Proc. Natl. Acad. Sci. USA 2016, 113, 6466–6471. [Google Scholar] [CrossRef] [PubMed] [Green Version]
  12. Sayles, J.S.; Baggio, J.A. Social–ecological network analysis of scale mismatches in estuary watershed restoration. Proc. Natl. Acad. Sci. USA 2017, 114, E1776–E1785. [Google Scholar] [CrossRef] [PubMed]
  13. Bodin, Ö.; Crona, B.; Thyresson, M.; Golz, A.-L.; Tengö, M. Conservation Success as a Function of Good Alignment of Social and Ecological Structures and Processes. Conserv. Boil. 2014, 28, 1371–1379. [Google Scholar] [CrossRef] [PubMed]
  14. Crona, B.; Bodin, Ö. What you know is who you know?—Communication patterns among resource extractors as a prerequisite for co-management. Ecol. Soc. 2006, 11, 7. Available online: http://www.ecologyandsociety.org/vol11/iss2/art7/ (accessed on 13 September 2019). [CrossRef]
  15. Bodin, Ö.; Tengö, M. Disentangling intangible social–ecological systems. Glob. Environ. Chang. 2012, 22, 430–439. [Google Scholar] [CrossRef]
  16. Baggio, J.A.; BurnSilver, S.B.; Arenas, A.; Magdanz, J.S.; Kofinas, G.P.; De Domenico, M. Multiplex social ecological network analysis reveals how social changes affect community robustness more than resource depletion. Proc. Natl. Acad. Sci. USA 2016, 113, 13708–13713. [Google Scholar] [CrossRef] [PubMed] [Green Version]
  17. Fischer, A.P. Forest landscapes as social-ecological systems and implications for management. Landsc. Urban Plan. 2018, 177, 138–147. [Google Scholar] [CrossRef]
  18. Lubell, M.; Jasny, L.; Hastings, A. Network Governance for Invasive Species Management. Conserv. Lett. 2017, 10, 699–707. [Google Scholar] [CrossRef]
  19. Janssen, M.A.; Bodin, Ö.; Anderies, J.M.; Elmqvist, T.; Ernstson, H.; McAllister, R.R.J.; Olsson, P.; Ryan, P. Toward a Network Perspective of the Study of Resilience in Social-Ecological Systems. Ecol. Soc. 2006, 11, 15. [Google Scholar] [CrossRef]
  20. Bodin, Ö.; Alexander, S.M.; Baggio, J.; Barnes, M.L.; Berardo, R.; Cumming, G.S.; Dee, L.E.; Fischer, A.P.; Fischer, M.; Garcia, M.M.; et al. Improving network approaches to the study of complex social–Ecological interdependencies. Nat. Sustain. 2019, 2, 551–559. [Google Scholar] [CrossRef]
  21. Cheng, G.; Li, X.; Zhao, W.; Xu, Z.; Feng, Q.; Xiao, S.; Xiao, H. Integrated study of the water–ecosystem–Economy in the Heihe River Basin. Natl. Sci. Rev. 2014, 1, 413–428. [Google Scholar] [CrossRef]
  22. Zhao, Y.; Wei, Y.; Li, S.; Wu, B. Downstream ecosystem responses to middle reach regulation of river discharge in the Heihe River Basin, China. Hydrol. Earth Syst. Sci. 2016, 20, 4469–4481. [Google Scholar] [CrossRef] [Green Version]
  23. Zhu, Y.; Chen, Y.; Ren, L.; Lü, H.; Zhao, W.; Yuan, F.; Xu, M. Ecosystem restoration and conservation in the arid inland river basins of Northwest China: Problems and strategies. Ecol. Eng. 2016, 94, 629–637. [Google Scholar] [CrossRef]
  24. Xiao, S.C.; Xiao, H.L.; Mi, L.; Li, L. Scientific Assessment on Ecological Effects of National Integrated Management Project in Heihe River Basin. Bull. Chin. Acad. Sci. 2017, 32, 45–54. [Google Scholar] [CrossRef]
  25. Qi, S.Z.; Luo, F. Water environmental degradation of the Heihe River Basin in arid northwestern China. Environ. Monit. Assess. 2005, 108, 205–215. [Google Scholar] [CrossRef] [PubMed]
  26. Feng, Q.; Cheng, G.D.; Endo, K.N. Towards sustainable development of the environmentally degraded River Heihe basin, China. Hydrol. Sci. J. 2001, 46, 647–658. [Google Scholar] [CrossRef]
  27. Cui, Y. The Development from the rule of Distribution to the Plan of Allocation of Water Between Upper Reaches and Lower Reaches of Heihe River. J. Hexi Univ. 2005, 21, 33–37. [Google Scholar] [CrossRef]
  28. Ao, F.; Yu, J.; Wang, P.; Zhang, Y. Changing Characteristics and Influencing Causes of Groundwater Level in the Lower Reaches of the Heihe River. J. Nat. Resour. 2012, 27, 686–696. (In Chinese) [Google Scholar]
  29. Barnes, M.L.; Bodin, Ö.; Guerrero, A.M.; McAllister, R.R.J.; Alexander, S.M.; Robins, G. The social structural foundations of adaptation and transformation in social-ecological systems. Ecol. Soc. 2017, 22. [Google Scholar] [CrossRef]
  30. Zheng, Y. Heihe Plan Science Data Center 2014. Available online: http://dx.doi.org/10.3972/heihe.070.2014.db (accessed on 13 September 2019).
  31. Wu, B.; Zheng, Y.; Tian, Y.; Wu, X.; Yao, Y.; Han, F.; Liu, J.; Zheng, C. Systematic assessment of the uncertainty in integrated surface water-groundwater modeling based on the probabilistic collocation method. Water Resour. Res. 2014, 50, 5848–5865. [Google Scholar] [CrossRef]
  32. Wasserman, S. Social Network Analysis: Methods and Applications; Cambridge university press: Cambridge, UK, 1994; Volume 24, pp. 219–220. [Google Scholar]
  33. Barrat, A.; Barthelemy, M.; Pastor-Satorras, R.; Vespignani, A. The architecture of complex weighted networks. Proc. Natl. Acad. Sci. USA 2004, 101, 3747–3752. [Google Scholar] [CrossRef] [PubMed] [Green Version]
  34. Brandes, U. A faster algorithm for betweenness centrality. J. Math. Sociol. 2001, 25, 163–177. [Google Scholar] [CrossRef]
  35. Girvan, M.; Newman, M.E.J. Community structure in social and biological networks. Proc. Natl. Acad. Sci. USA 2002, 99, 7821–7826. [Google Scholar] [CrossRef] [PubMed] [Green Version]
  36. Brandes, U.; Delling, D.; Gaertler, M.; Gorke, R.; Hoefer, M.; Nikoloski, Z.; Wagner, D. On Modularity Clustering. IEEE Trans. Knowl. Data Eng. 2008, 20, 172–188. [Google Scholar] [CrossRef]
  37. Bodin, Ö.; Robins, G.; McAllister, R.; Guerrero, A.; Crona, B.; Tengö, M.; Lubell, M. Theorizing benefits and constraints in collaborative environmental governance: A transdisciplinary social-ecological network approach for empirical investigations. Ecol. Soc. 2016, 21, 40. [Google Scholar] [CrossRef]
  38. Cumming, G.S.; Cumming, D.H.M.; Redman, C.L. Scale Mismatches in Social-Ecological Systems: Causes, Consequences, and Solutions. Ecol. Soc. 2006, 11, 14. [Google Scholar] [CrossRef]
  39. Folke, C.; Pritchard, J.L.; Berkes, F.; Colding, J.; Svedin, U. The Problem of Fit between Ecosystems and Institutions: Ten Years Later. Ecol. Soc. 2007, 12, 30. [Google Scholar] [CrossRef]
  40. Zhang, M.; Wang, S.; Fu, B.; Gao, G.; Shen, Q. Ecological effects and potential risks of the water diversion project in the Heihe River Basin. Sci. Total Environ. 2017, 619, 794–803. [Google Scholar] [CrossRef] [PubMed]
  41. Wang, S.; Fu, B.; Bodin, Ö.; Liu, J.; Zhang, M.; Li, X. Alignment of social and ecological structures increased the ability of river management. Sci. Bull. 2019, 64, 1318–1324. [Google Scholar] [CrossRef] [Green Version]
  42. McCluney, K.E.; Poff, N.L.; A Palmer, M.; Thorp, J.H.; Poole, G.C.; Williams, B.S.; Williams, M.R.; Baron, J.S.; Mc Cluney, K. Riverine macrosystems ecology: Sensitivity, resistance, and resilience of whole river basins with human alterations. Front. Ecol. Environ. 2014, 12, 48–58. [Google Scholar] [CrossRef]
  43. Scarlett, L.; McKinney, M. Connecting people and places: The emerging role of network governance in large landscape conservation. Front. Ecol. Environ. 2016, 14, 116–125. [Google Scholar] [CrossRef]
  44. Barnes, M.L.; Bodin, Ö.; McClanahan, T.R.; Kittinger, J.N.; Hoey, A.S.; Gaoue, O.G.; Graham, N.A.J. Social-ecological alignment and ecological conditions in coral reefs. Nat. Commun. 2019, 10, 2039. [Google Scholar] [CrossRef] [PubMed]
  45. Enqvist, J.P.; Tengö, M.; Bodin, Ö. Are bottom-up approaches good for promoting social–Ecological fit in urban landscapes? Ambio 2019, 1–13. [Google Scholar] [CrossRef] [PubMed]
  46. Baur, I.; Binder, C.R. Adapting to Socioeconomic Developments by Changing Rules in the Governance of Common Property Pastures in the Swiss Alps. Ecol. Soc. 2013, 18. [Google Scholar] [CrossRef] [Green Version]
  47. Guerrero, A.; Bodin, Ö.; McAllister, R.; Wilson, K. Achieving social-ecological fit through bottom-up collaborative governance: An empirical investigation. Ecol. Soc. 2015, 20. [Google Scholar] [CrossRef]
Figure 1. Location of the study area.
Sustainability 11 05159 g001
Figure 2. A social-ecological (SE) system represented as an SE network. The multilevel structure captures the dependencies that exist within the system, how social and ecological system elements relate to and depend on each other, and the constraints and opportunities social actors face in taking actions within the system structure.
Sustainability 11 05159 g002
Figure 3. Social-ecological adjacency matrix. The ecological nodes are linked directionally through ecological process (EE edges). Social nodes are connected nondirectionally (SS edges). The figure was modified from [12].
Sustainability 11 05159 g003
Figure 4. Variations in the ecological and social network characteristics of the basin. Ecological nodes (circles) are scaled in relation to the scores for strength and colored by the optimal community structure. Social nodes (rectangles) are scaled in relation to the scores for betweenness. The number of each node is shown in the nodes. The numbering details are provided in Table S1. LWAP was the local water allocation period (year 1990–2000), and the RWAP was the regional water allocation period (year 2000–2010).
Sustainability 11 05159 g004
Figure 5. Measures of SE networks structure during the LWAP and the RWAP in (A,B). Dark red lines between ecological nodes represent managed links. Gray lines represent ecological links. The nodes represent the landscape groups whose numberings are shown in the nodes and the sizes have been scaled by the degree of the nodes. We have omitted the arrows of the ecological link to improve the ease of display. The degree in this SE network was calculated according to undirected paths.
Sustainability 11 05159 g005
Figure 6. The main eco-hydrological and social-economic processes during the LWAP and RWAP. The ratio of surface runoff in the middle and lower reaches are shown in (A); (B) shows the area change of Heihe River Basin (HRB) terminal lake; the average groundwater levels in middle and lower regions are shown in (C); the changes of farm area in middle and downstream regions are shown in (D).
Sustainability 11 05159 g006

