Synergistic Activity of Mobile Genetic Element Defences in Streptococcus pneumoniae
by
 , and
, and
Min Jung Kwun
1, 
Marco R. Oggioni
2,
Stephen D. Bentley
3,
Christophe Fraser
4 and
Nicholas J. Croucher
1,* 1
MRC Centre for Global Infectious Disease Analysis, Department of Infectious Disease Epidemiology, St. Mary’s Campus, Imperial College London, London W2 1PG, UK
2
Department of Genetics and Genome Biology, University of Leicester, Leicester LE1 7RH, UK
3
Pathogens and Microbes, Wellcome Sanger Institute, Wellcome Genome Campus, Hinxton, Cambridge CB10 1SA, UK
4
Big Data Institute, Nuffield Department of Medicine, Old Road Campus, University of Oxford, Oxford OX3 7LF, UK
*
Author to whom correspondence should be addressed.
Genes 2019, 10(9), 707; https://doi.org/10.3390/genes10090707
Submission received: 31 July 2019
/
Revised: 1 September 2019
/
Accepted: 6 September 2019
/
Published: 13 September 2019
(This article belongs to the Special Issue Evolutionary Genetics of Streptococcus pneumoniae)
Abstract
:A diverse set of mobile genetic elements (MGEs) transmit between Streptococcus pneumoniae cells, but many isolates remain uninfected. The best-characterised defences against horizontal transmission of MGEs are restriction-modification systems (RMSs), of which there are two phase-variable examples in S. pneumoniae. Additionally, the transformation machinery has been proposed to limit vertical transmission of chromosomally integrated MGEs. This work describes how these mechanisms can act in concert. Experimental data demonstrate RMS phase variation occurs at a sub-maximal rate. Simulations suggest this may be optimal if MGEs are sometimes vertically inherited, as it reduces the probability that an infected cell will switch between RMS variants while the MGE is invading the population, and thereby undermine the restriction barrier. Such vertically inherited MGEs can be deleted by transformation. The lack of between-strain transformation hotspots at known prophage att sites suggests transformation cannot remove an MGE from a strain in which it is fixed. However, simulations confirmed that transformation was nevertheless effective at preventing the spread of MGEs into a previously uninfected cell population, if a recombination barrier existed between co-colonising strains. Further simulations combining these effects of phase variable RMSs and transformation found they synergistically inhibited MGEs spreading, through limiting both vertical and horizontal transmission.
1. Introduction
Streptococcus pneumoniae is a genetically diverse gram-positive bacterial commensal and respiratory pathogen that can be divided into hundreds of distinct strains [1,2]. The species can be commonly isolated from the nasopharynx of infants, typically occurring at prevalences of 20–90% [3]. Consequently, co-colonisation between distinct strains is common [4], facilitating the exchange of genetic variation through three primary recombination mechanisms. Two are driven by mobile genetic elements (MGEs): both phage and phage-related chromosomal islands move between S. pneumoniae cells in virion particles [5,6], whereas integrative and conjugative elements transmit via conjugative pili [7]. An immense diversity of these pneumococcal MGEs has been uncovered by genomic datasets [5,8]. The third recombination mechanism, transformation, is MGE-independent, instead driven by the cell through the competence machinery, which imports exogenous DNA from the environment in single-stranded form [9].
Although S. pneumoniae isolates commonly carry one or two MGEs [5], a burden quite typical for the approximately two megabase size of the species’ chromosome [10], many remain uninfected by active MGEs [11]. For instance, surveys of clinical isolates have found between 7% and 24% of S. pneumoniae not to carry any active prophage [12,13]. This is despite the species lacking any CRISPR systems [14], which can be considered the bacterial equivalent of adaptive immunity [15]. S. pneumoniae instead harbor alternative mechanisms to defend against MGE infection. The best-characterised are the restriction-modification systems (RMSs) [16]. These recognize a particular motif, and methylate it wherever it occurs in the bacterial chromosome. When the unmodified motif is identified in imported double-stranded DNA, such as an infecting MGE, it is cleaved by an endonuclease. The Type IV RMS McrBC has previously been identified as protecting S. pneumoniae from phage infection using a genome-wide screen [17], and multiple additional RMSs are found across the S. pneumoniae population [5,18]. Almost all isolates possess two Type I RMSs that are phase variable: they can reversibly switch between states owing to hypermutable genetic loci. One such RMS, SpnIII (known as SpnIIID39 in strain D39), is encoded by the inverting variable RMS (ivr) locus, while SpnIV is encoded by the translocating variable RMS (tvr) locus [5,11,19,20,21]. These loci have evolved such that recombinations between repeat sequences enable rearrangements that change the motif targeted by the RMS [22,23]. This genomic shuffling is primarily driven by site-specific recombinases encoded within the loci, with minor contributions from as yet uncharacterized recombination proteins [24,25,26]. Given the frequent transmission bottlenecks endured by S. pneumoniae [27], as it is only carried by each host for weeks or months [28], this is likely an effective means of rapidly generating diversity in RMS activity within the otherwise clonal bacterial population within a host [19,23]. Such within-population variation is important for the effectiveness of RMSs, as they can only inhibit the transmission of MGEs when their activities are discordant between the source and recipient cells. If both cells have the same RMS activities, then MGEs can freely transmit between them, as the pattern of methylated motifs will render the transmitted DNA indistinguishable from the recipient cell chromosome.
Experiments using locked variants of the ivr and tvr loci have demonstrated that SpnIII and SpnIV can inhibit the transmission of phage if the RMS motif specificity differs between the MGE source and recipient [29]. Additional work has also shown SpnIII is capable of inhibiting the transformation-mediated acquisition of plasmids [19,20], and SpnIV can similarly inhibit the integration of genomic islands [25,30]. This is the consequence of the newly imported heterologous sequence being converted into inappropriately methylated, or unmethylated, double stranded DNA after its entry into the cell, rendering it susceptible to cleavage by RMS endonucleases [30]. Consequently, RMSs do not typically affect the acquisition of single nucleotide polymorphisms (SNPs) or deletions, which do not import heterologous sequence. This contributes to the asymmetry of transformation—the extent to which transformation favours the deletion of genes over their import [31]. This property of transformation has been hypothesised to enable ‘chromosomal curing’ [32] through deleting MGEs integrated into the chromosome. This function could represent the primary evolutionary advantage of transformation and operate as another component of the S. pneumoniae immune system against MGE infection.
Characterisation of the interactions between S. pneumoniae cells and MGEs has been limited by the difficulties of constructing experimental models. Most pneumococci are encapsulated, yet only unencapsulated strains can be routinely infected in the laboratory [17,29]. Conversely, the role of RMSs as a defence system has proved difficult to disentangle from the action of abortive infection mechanisms [29], and both transformation and phage infection only efficiently occur during early exponential growth phase [9,29,32], which is difficult to maintain for long periods even for a clonal S. pneumoniae population in a chemostat [33,34]. Hence, mathematical modelling can play a valuable role in integrating the available data on the individual functioning of each component involved in the MGE-pneumococcus interaction to help understand this critical aspect of S. pneumoniae evolution. Hence, a previously described compartmental model of within-host bacterial evolution through MGE infection and transformation [32] was modified to incorporate phase variation of RMS activity [22]. Simulations were run to understand how these two aspects of the S. pneumoniae immune system operated when functioning separately, and the synergistic effects of both working in conjunction.
2. Materials and Methods
2.1. Quantification of tvr Locus Variation
To enable quantification of the absolute copy numbers of dominant and rare alleles, PCR amplicons were generated using genomic DNA from locked mutants [18] using the RedTaq PCR system (Sigma-Aldrich, St. Louis, MI, USA) and a fixed forward primer and the appropriate reverse primer (Table S1). The resulting amplicons were purified using a GenElute kit (Sigma-Aldrich), and their concentration calculated using the Qubit Broad Range kit (Invitrogen, Paisley, UK). Known numbers of amplicon molecules were then used as templates for quantitative PCR using the PowerUp SYBR Green kit (Thermo Fisher Scientific, Paisley, UK) and a QuantSTUDIO 7 Flex PCR instrument (Life Technologies, Paisley, UK). This allowed a standard curve to be constructed.
To measure the rate of tvr locus variation in vitro, S. pneumoniae cultures were grown for 16 h at 35 °C in 10 mL of a 2:3 ratio of Todd-Hewitt media (Sigma-Aldrich) and Brain-Heart Infusion media (Sigma-Aldrich). For each strain, two independent passages were conducted in parallel. Each first culture was inoculated from a single colony, and daily transfers inoculated each subsequent culture with 10 μL of the previous culture. Genomic DNA was extracted using the Wizard Genomic DNA Purification Kit (Promega, Madison, OH, USA). Quantitative PCRs for each distinguishable allele of the tvr locus were then performed in triplicate on each sample with the appropriate primers (Table S1). The standard curves for each allele were then used to convert these outputs to absolute concentrations of the corresponding genotypes, enabling ratios of prevalence to be calculated from the copy number of the dominant allele divided by the copy number of the rare allele.
2.2. Structure of the Compartmental Model
The previously described model [32] was modified to incorporate phase variation through enabling cells to switch between two variants at a symmetrical rate, pv. At the end of each timestep, a discrete number of cells, s, from a compartment containing X cells transitioned to the equivalent compartment of cells of the alternative genotype, according to the binomial distribution:
s ~ Bin(pv, X)
The restriction barrier was included through allowing MGEs originating from one variant to bind the other variant, but not permitting these associations to progress to a successful infection.
2.3. Analysis of Simulations
Simulations were run in one of two different modes. Parameters are listed in Table 1 and, unless specified, were the default values used previously [32].
The simulations in Figure 1 tested the interaction between phase variation and MGE invasion. In these simulations, the aim was to quantify the resilience of the cellular population to repeated invasions by MGEs. Therefore, M MGEs were introduced from an external source at a rate determined by the invasion parameter mi and the burst size b.
M ~ Bin(mi,b)
MGEs originating from variants A and B both entered at this rate. The results were highly variable if MGEs invaded prior to the population reaching carrying capacity, or a mixture of variants being generated by switching. Therefore the population was initialized at its carrying capacity, with two variants present at a starting ratio of 99:1, all uninfected by MGEs. This enabled the subsequent responses of the cellular population to be followed, with sufficiently little variability introduced by model structure for the relationship between the input parameters and output measurements to be discerned. To allow for multiple MGE invasions, each separated by a sufficient period for switching to regenerate variant diversity, mi was set to 10−7 t−1, and simulations were run for 10,000 timesteps. Twenty replicates per parameter combination were required to ensure the signal could be identified over the stochastic noise of variation between identically parameterised simulations.
The simulations in Figures 4 and 5 were run as described previously [32]. In these cases, populations were initiated with an inoculum of 100 uninfected and 100 infected cells. Simulations were run for 1000 timesteps. Only three replicates per parameter combination were required to identify trends in output measurements.
2.4. Analysis of Genomic Data
For the analysis of between-strain recombination in the S. pneumoniae PMEN1, PMEN2, and PMEN14 lineages [35,36,37], the previously published Gubbins [38] analyses were processed to quantify the number of recombination events overlapping each base in the reference genome across the entire datasets.
For the analysis of linkage disequilibrium, the sequences of core genes were extracted from the 4127 S. pneumoniae genomes previously analysed by Corander et al. [39]. These were translated into proteins, aligned using MAFFT [40], and back translated to generate codon alignments. The r2 statistics between all the biallelic single nucleotide polymorphisms with a minor allele frequency of at least 1% within the same core gene were calculated using the R package PopGenome [41]. Altering the threshold minor allele frequency did not substantially affect the observed patterns.
3. Results
3.1. Constraining the Optimal Rate of Phase Variation for RMSs
As RMSs inhibit the transmission of MGEs when they have discordant activities in source and recipient cells, a naïve expectation would be that they operate most effectively when all variants are equally prevalent in a population, as this minimizes the probability that the source and recipient are of the same variant. This can be achieved by high rates of phase variation, and explains the evolution of recombinase-driven repeat-mediated sequence rearrangements [22]. However, the tvr locus encodes a transcriptional attenuation mechanism that reduces the activity of the recombinase catalysing sequence rearrangements, implying selection for a moderated rate of phase variation [25]. Similarly, the switching rate varies between the types of repeat in the ivr locus, with further moderation resulting from changing expression of the locus’ recombinase according to the orientation of its encoding gene relative to the ivr transcriptional promoter [24]. These apparently sub-maximal switching rates likely contribute to the ratio of ivr variants in a bacterial population remaining highly unequal, but stable, over a week during in vivo carriage [19]. In vitro pneumococcal cultures appeared to be similarly dominated by a single variant of the tvr locus [25]. To quantify the relative prevalences alternative variants, and how these changed over time, the frequencies of two sets of mutually exclusive tvr variants that could be distinguished by PCR in mixed cultures were measured during in vitro passages in two isolates with active tvr loci: S. pneumoniae RMV5 and RMV8 [25]. As for the ivr locus, these experiments demonstrated that the frequency of the allele that was initially ‘rare’ remained low and stable over multiple days of passage (Figure 1a). This assay is specific to a particular rearrangement, rather than being able to detect all variation, due to the difficulty of distinguishing different tvr arrangements with a short PCR product. Nevertheless, it demonstrates the tvr locus, like the ivr locus, undergoes active rearrangement at a rate that does not achieve a random distribution of alleles even after multiple days of continuous growth.
One possible explanation for this limitation of the phase variation rate is that many S. pneumoniae MGEs integrate into the chromosome and transmit to descendent cells through vertical inheritance [5,42]. If an MGE enters a population with one particular methylation pattern, it is confined behind a restriction barrier that inhibits its transfer into other variants with a different RMS activity. If the host cell switches RMS activity while the MGE is integrated into its chromosome, then the MGE would be expected to acquire the new methylation pattern. This is confirmed by methylation-sensitive sequencing of lysogenic S. pneumoniae that were isolated from the same culture expressing different tvr locus variants (Figure S1) [25]. The MGE would then be able to infect other cells expressing this alternative variant of the RMS, and thereby undermine the barrier to horizontal transmission of the MGE between donors and recipients expressing different phase variable RMS activities. Therefore, to minimize the risks of such undermining of the restriction barrier, the optimal frequency of phase variation may be below the maximum achievable through intragenomic recombination.
To test this hypothesis, simulations were run using a previously described stochastic compartmental model of MGE transmission between S. pneumoniae within a host (Table 1 and Figure 1b). The model provides a representation of a cell population growing through clonal replication, limited by a carrying capacity (κ), determining the number of cells that can be supported by the environment, and washout rate (ω), which parameterises the rate at which cells, MGEs, and DNA are removed from the simulation. This particular set of simulations categorised cells according to their underlying genotype and whether or not they were infected with an MGE. Cells could move between categories through MGE infection or curing and, where biologically realistic, by changing genotypes. In these simulations, the cell genotypes were defined as RMS variants, which were able to interchange through phase variation at rate pv. Populations were initialized with a size of κ and comprised a dominant and rare phase-variable RMS variant starting at relative frequencies of 99:1.
To test the effectiveness of the phase variable RMS as a defence against mobile element infection, the cell population was challenged by MGE invasions occurring at random intervals. These MGEs were parameterized to spread predominantly through horizontal transfer and were labelled ‘ML’ (Table 1) as they were akin to lysogenic phage. They spread between cells of the same variant at a rate β (1.25 × 10⁻⁴ t−1) but could not transmit between cells of different variants, as a consequence of the restriction barrier. Once a cell was infected, its replication rate was reduced by a factor cM (0.5) to represent the fitness cost imposed by ML. At a rate f, ML activated within infected cells, killing their host and releasing a burst of b (10) MGEs. In the absence of a phase variable RMS, ML swept through the cell population and cleared all bacteria from the simulation. Hence, the success of the RMS could be quantified as the total number of uninfected cells surviving in a simulation. This was measured across multiple values of pv, controlling the switching rate of the RMS, and f, determining the duration for which ML was associated with a host prior to activation and cell lysis.
3.2. Phase Variable RMS Are Undermined by Vertical Transmission of MGEs
The results of these simulations are represented as a heatmap (Figure 1c), in which each grid cell corresponds to a particular combination of pv and f. The colour represents the mean uninfected cell population surviving MGE challenge; the better-performing the phase variable RMS, the greater the number of uninfected cells in the simulation. Due to the highly stochastic nature of the MGE invasion process, this was calculated as the mean over 20 replicates. For the previously used κ of 106 cells [32], the optimal pv was 10−7 t−1. This seemed likely to reflect a balance between being high enough to maintain both variants in the population, thereby inhibiting horizontal MGE transfer, while being low enough to prevent the restriction barrier being undermined by cells switching RMS activity while infected with an MGE.
If this hypothesis were correct, then the optimal pv should rise as κ decreases; faster switching maintains both variants in the smaller population, and the lower absolute number of infected cells means there is a reduced population-wide probability of at least one cell switching while infected with an MGE. Hence, the simulations were repeated with κ = 104. Correspondingly, the optimal pv increased to 10−4–10−5 t−1.
Analyses of individual simulations (κ = 104) were also consistent with this hypothesis. MGE invasions caused a collapse in the cell numbers of the variant they targeted. At an optimal switching frequency (Figure 1d; pv = 10−4), pv was sufficient to generate a diversity of variants in the population between each MGE invasion. However, it was low enough that during the MGE’s sweep through the population, and it was rare for an infected cell to switch its RMS activity, thereby maintaining the integrity of the restriction barrier. By contrast, a below-optimal switching rate (Figure 1e; pv = 10−6) meant the rare variant drifted out of the population, eliminating the restriction barrier and allowing the MGE to sweep through the population. An above-optimal pv (Figure 1f; pv = 10−2) ensured both variants were equally prevalent after a short period. Yet, this raised the rate of switching while infected sufficiently to undermine the restriction barrier, enabling the MGE to infect both variants, and drive down the cell densities of each.
Simulations with κ = 104 also demonstrated the relationship between the optimal pv and f, the MGE activation rate. The longer an MGE remained associated with its host cell (due to a lower f), the greater the risk that the cell could switch RMS activity while infected, making a lower pv optimal. This suggested phase variable RMS are unlikely to be highly effective against MGEs that are stably vertically inherited over many years, as phage-related chromosomal islands and integrative and conjugative elements appear to be in S. pneumoniae [5,35,36,37]. This was confirmed by further simulations with a different MGE, with a greater propensity to spread through vertical inheritance relative to horizontal transmission. This was based on an MGE previously labelled MV [32] (Table 1), although the reduced κ meant β had to be increased to 5 × 10⁻³ t−1. MV’s vertical transmission is enhanced by it causing a lower fitness cost to its host, through it having a lower impact on their replication (cM = 2.5 × 10⁻³) and not killing the cell on activation, as is the case for conjugative elements and some phage [43]. This enabled MV to successfully infect the cellular population when the tested range of activation rates, f, was lowered 100-fold (Figure S2). In these simulations, the MGE’s success increased with higher f, demonstrating horizontal transmission was aiding MV’s spread. However, increasing the rate of RMS phase variation above zero did not inhibit MV’s prevalence; counterintuitively, high pv values resulted in more cells being infected than when pv = 0. This reflects another disadvantage of rapid phase variation. The invading MGEs were equally likely to have been generated from a donor of either variant and therefore equalizing the prevalences of both RMS variants through rapid switching maximises the probability the incoming MGE can infect a recipient cell.
3.3. Between-Strain Transformation and the Inhibition of MGE Transmission
The S. pneumoniae MGEs that are most effective at transmitting horizontally are phage [5]. While lytic S. pneumoniae phage have proved difficult to isolate [44], lysogenic or temperate phage have been readily identified from prophages in genomic data [5,45,46]. These viruses spread through both horizontal and vertical transmission, and therefore both phase variable RMS and transformation may play roles in inhibiting their spread through the population. To infer which may be more important, the distribution of between-strain transformation events, detectable through the sequence divergence they caused, were analysed. This used data from three multidrug-resistant S. pneumoniae strains: PMEN1 [35], PMEN2 [36], and PMEN14 [37].
Whereas between-strain transformation events are randomly distributed in experimental analyses [47,48], selection drives a heterogeneous distribution across the S. pneumoniae chromosome when the evolution of clinical isolates is reconstructed [35]. Hotspots primarily correspond to loci encoding antibiotic resistance, antigenic surface structures, or prophage [49,50,51]. The prophage-associated hotspots may be a signal that between-strain transformation functions as an important means of deleting prophage from the chromosome [32]. Alternatively, they may simply represent the rapid transmission of these MGEs: as the detection of recombination uses alignments based on short read mapping to reference sequences [35], many of the reads of phage origin will align to prophage sequences in the reference, regardless of where the prophage is actually positioned in the genome [52]. These alternatives can be distinguished by analyzing the distribution of transformation events. If these recombination hotspots represent prophage infection, then the recombinations will be limited to prophage sequences in the reference genomes. However, if the hotspots are caused by transformations deleting prophage, they will need to extend into the regions flanking the prophage insertion, or att, site [31,45]. Additionally, transformations should be detected at prophage att sites even if the reference genome has no prophage inserted there, as an historical record of prophage removed from the chromosome.
To test these hypotheses, four prophage att sites were studied across the three strains (Figure 2). Two flank the purA gene and are collectively labelled attpurA; one was defined by the insertion of the φMM1 prophage (attMM1), and the fourth is within the comYC gene (attcomYC) [5,35,45]. This latter example inhibits the ability of the host cell to undergo transformation [35,36], which can be understood as a beneficial site to target if prophage were at risk of deletion through this mechanism. Plotting the density of recombination events demonstrated they were only high at an att site when a prophage sequence was present in this locus in the reference sequence. The recombination density was also elevated at attcomYC when occupied by a prophage, despite the abrogation of transformation in genotypes carrying an MGE at this site meaning prophage deletion through homologous recombinations should be much rarer at this locus [32,35,36]. Finally, the recombination density dropped sharply at the edges of the prophage, consistent with mapping of reads from a diversity of prophage to a representative in the reference sequence. This contrasted with the pattern of transformation around loci encoding antigens frequently altered through recombination, such as those encoding Pneumococcal Surface Proteins A (PspA) and C (PspC) and the capsule polysaccharide synthesis (cps) locus (Figure 2). Where these corresponded to transformation hotspots, the peak in recombination density was relatively smooth, lacking the sharp edges of the prophage recombination, and more closely resembled the pattern of transformation events selected in laboratory experiments [47,48,53,54]. These data were not consistent with interstrain transformation frequently removing prophage from S. pneumoniae genomes.
As interstrain transformations are detected through the diversification of the recipient genome sequence [38,55], their apparent absence from the regions flanking prophage could represent a false negative resulting from a lack of genetic variation across the population around these loci. These regions are likely to have atypically low diversity, as prophage target att sequences conserved between cells to ensure efficient spread throughout the species [56]. Hence, linkage disequilibrium was used as an alternative measure of local recombination rate that was less dependent on population-wide diversity available for import into a genotype. The r2 statistic was calculated for all biallelic SNPs with a minor allele frequency above 1% within the same core gene, and each core gene’s median r2 value plotted across the chromosome (Figure 3a). This demonstrated there was little evidence of extensive linkage anywhere across the S. pneumoniae genome, limiting the ability to infer an elevated rate of transformation surrounding the prophage att sites (Figure 3b–d). Hence, the test was essentially underpowered to identify locally elevated transformation rates, and it was not surprising that there was no detectable signal of reduced r2 surrounding the prophage att sites. These data collectively failed to find evidence for between-strain recombination frequently deleting prophage from the S. pneumoniae chromosome.
3.4. Partitioning Within-Strain and Between-Strain Recombination
S. pneumoniae lineages frequently co-colonise the same host, providing the opportunity for an MGE to transmit from an infected strain to an uninfected strain. The lack of transformation hotspots at prophage att sites is inconsistent with the infected strain ‘curing’ itself with DNA from the uninfected co-colonising strain. However, the chromosomal curing hypothesis was originally proposed to apply to transformation within clonally descended populations in a single host [32], which is undetectable in the evolutionary reconstructions of lineages’ diversification [38]. The previously described model was therefore adapted to test whether transformation could still benefit an initially uninfected clonally related cell population by limiting the spread of MGEs, without eliminating the MGE in the source strain. This would reconcile chromosomal curing with the lack of a signal of between-strain diversification at prophage att sites.
These simulations compartmentalized the within-host bacterial population into two co-colonising strains, A and B, which were considered immutably distinct from one another (Figure 4a). Hence, there was no interchange of cells between the strains, as for the phase variants. Strain A began completely uninfected by MGEs, whereas all cells of strain B were infected with an MGE. Both MGE transmission and transformation occurred freely within each strain, but a barrier was assumed to exist that limited the rate at which both processes occurred between cells of different strains by a factor, i. When transformation (occurring at rate τ) was sufficiently high and asymmetric, favouring deletion of MGEs [31,32], it had been previously shown to be effective at eliminating the MV MGE from an individual cell population. Therefore, simulations were run for 1000 timesteps, with transformation asymmetry fixed at 10−3, starting with an inoculum of 100 uninfected strain A cells and 100 strain B cells infected with MV (Table 1), as described previously [32].
A heatmap shows the results of these simulations for different combinations of τ and i (Figure 4b). When i = 1, there was no barrier between the strains, and they behaved as a single population; hence the MGE-infected, or uninfected, genotype fixed across the population, depending on τ. When i = 0, the two strains were entirely uncoupled from one another, and each remained fixed as their initial genotype. When i and τ were both high, the MGE was eliminated in both strains. However, such extensive exchange between co-colonising genotypes would require an explanation as to why prophage att sites are not easily detectable as between-strain transformation hotspots (Figure 2 and Figure 3). Reducing τ to account for this observation meant transformation provided no advantage in preventing MGE acquisition, if i were still high. However, when both i and τ were relatively low, transformation was effective at preventing the MGE from becoming widespread in strain A, without removing it from strain B. Although this result is only evident from a few parameter combinations in Figure 4, the trend suggests it is the situation that would be expected whenever both τ and i were non-zero but below the relevant thresholds. Such a region of parameter space reflects the non-linear transmission of MGEs within a cell population. In strain B, the prevalence of infected cells means any cells sporadically cured by transformation are likely to be rapidly re-infected. However, the same transformation rate can prevent an MGE becoming established in strain A, where the force of MGE infection is much lower, and most DNA available for transformation is from uninfected cells, which can drive MGE deletion when recombined into the recipient chromosome [31,32]. Hence, transformation can be advantageous in preventing the spread of MGEs, despite the lack of observed between-strain transformation hotspots at prophage att sites.
3.5. Synergistic Combinations of S. pneumoniae ‘Immune System’ Components
These simulations suggest asymmetric transformation is effective at preventing integrative MGEs from leaking across a permeable barrier between compartments of a structured population. This complements the weakness of phase variable RMSs (Figure 1), as the restriction barrier can be undermined by a fraction of the population switching between RMS variants while harbouring an MGE. Hence, it appears likely these two mechanisms may be synergistic in preventing MGE transmission. To test this, the previous model structures were combined to simulate the evolution of a single strain that was both transformable and possessed a phase variable RMS. The different cell genotypes again represented interchangeable RMS phase variants of a single strain. Simulations were run with all cells being the same variant, but with 50% of them initialized as being infected by an MGE: either MV, as in the previous section, or MH, an MGE that transmitted more rapidly through horizontal transfer than MV (albeit less so than ML). Both of these MGEs were able to spread through cell populations in the absence of transformation and phase variable RMSs through a mixture of horizontal and vertical transmission [32]. Hence, the rates of both phase variation (pv) and asymmetric transformation (τ) were varied to test the effectiveness of both mechanisms acting in conjunction.
The results of these simulations are shown as a heatmap (Figure 5), with the outcomes summarized by the proportion of cells infected by MGEs over the course of three replicate simulations for each parameter combination. For MV, the only determinant of its success was asymmetric τ—highly transformable cell populations eliminated the MGE. The rate of phase variation, pv, had no effect on MV, as its stable association with hosts meant it frequently undermined the restriction barrier through its presence in cells as they switched between variants. However, transformation was unable to eliminate MH from the cell population in the absence of a phase variable RMS (pv = 0), in accordance with previous simulations [32]. Similarly, phase variable RMSs alone were also not effective at preventing the spread of MH, which transmitted through vertical inheritance to a greater extent than ML (Figure 1). However, when both pv and τ were elevated, MH was prevented from transmitting between cells. This reflected phase variation establishing a restriction barrier that limited the horizontal transmission of MH, while transformation-mediated curing of cells limited MH’s vertical transmission. Unlike ML, MH was transmitted too effectively through vertical inheritance for there to be an optimal rate of phase variation, and therefore the highest pv rates were best at preventing MGE transmission, as transformation was able to compensate for sporadic undermining of the restriction barrier. These conclusions were robust to changing the simulation structure such that the population was initialised at its carrying capacity, with the MGE either confined to the initially rare variant B (Figure S3), or repeatedly invading an initially uninfected population (Figure S4).
The differing methylation patterns distinguishing RMS variants have been found to affect phenotypes, such as encapsulation, in S. pneumoniae [19,20,21]. Such alteration of the capsule thickness can impact on transformability [58]. Hence, the simulations were repeated with variant B having a transformation rate 100-fold lower than that of variant A. The only major differences with the outputs summarized in Figure 5 were that MH and MV both spread more effectively when phase variation and transformation were both high (Figure S5). This reflected a combination of two effects. Firstly, the high overall rate of transformation depleted DNA from the environment, limiting the ability of the relatively less transformable variant B to compete for genetic material it can use to cure integrated MGEs from its chromosome. Secondly, uninfected representatives of these more susceptible variant B cells were continually generated by switching from the more transformable variant A. For MV, these factors resulted in the MGE being confined to variant B, as variant A cells could eliminate MV infections through transformation; for MH, the high rate of phase variation enabled the restriction barrier to be undermined, resulting in the MGE transmitting throughout both variants. Hence, if MGEs are susceptible to being removed by homologous recombination, they may be able to enhance their fitness even if they only inhibit transformation in a subset of all phase variants.
4. Discussion
While lytic phage and plasmids infecting S. pneumoniae have proved difficult to isolate [44,59], the species can be infected by a wide variety of MGEs that integrate into the cell chromosome, thereby enabling efficient transmission through vertical inheritance as well as horizontal transmission. The analyses described in this work outline how two putative S. pneumoniae ‘immune system’ components, RMSs and transformation, can target both modes of integrative MGE transmission. These conclusions are primarily drawn from simulations, which are necessarily simplifications of in vivo evolution, and therefore cannot account for the full biological complexity of the interactions between pneumococci and their MGEs. Nevertheless, RMSs have been found to be significantly enriched in prokaryotic species encoding transformation machinery [60], suggesting the apparent synergy of this combination may affect the distribution of both types of system across many bacteria.
The model employed in this study is designed for analyzing systems where the identity of the donor and recipient affect horizontal DNA transfer, such as asymmetric transformation and RMSs. S. pneumoniae are likely to have further MGE defences where this is not such an important consideration, which are less well-suited to analysis with this framework. For instance, attempts to design an in vitro model of SpnIII activity against the siphovirus SpSL1, one of the few phages to readily replicate in S. pneumoniae in laboratory conditions, were prevented by an abortive infection system [29]. This caused infected cells to lyse, even if the activity of the SpnIII RMS should have protected against infection by the virus. However, fully quantifying the benefits of abortive infection mechanisms requires spatially structured models [61]. Bacteria can also develop resistance to MGEs through alteration of the receptor bound by the element, and evolutionary models predict Red Queen dynamics will govern the ongoing divergence of both the cell receptor and MGE antireceptor [62]. However, the only characterized receptor for a phage in S. pneumoniae is the teichoic acid phosphorylcholine, by which many cellular proteins are bound to the cell surface [63], making such a mutation highly pleiotropic and difficult to simulate. Mutations blocking infection by phage are often associated with such a high fitness cost, and while they may dominate a small population over the short term, such variation is typically lost from the population once the selecting MGE disappears [64].
RMSs are effective at preventing the horizontal transmission of MGEs through cleaving the elements after their entry into the cell, but before they integrate into the genome. Phase variation enables such a restriction barrier to be generated within a clonally descended population of cells. Yet these simulations highlight two drawbacks of fast phase variation. The first essentially corresponds to convergence between the RMSs of co-colonising strains. If S. pneumoniae rapidly diversify their RMS-encoding loci, all RMS variants will be present, maximizing the probability that a given MGE from another strain will bind to a recipient with the same RMS activity as the cell from which it originated, rendering the RMS ineffective. Hence, there is a trade-off between generating restriction barriers within a clonally descended population and maintaining these barriers between strains. This can be addressed through combining phase-variable RMSs with non-phase variable RMSs, which stably differ between strains, as observed in many S. pneumoniae genotypes [5,65]. The second is that the restriction barrier is undermined by vertical inheritance of MGEs, which reside in the cell while it switches RMS specificity, enabling the element to subsequently horizontally transmit to recipients previously protected by the restriction barrier. Consequently, the optimal rate of phase variation may have to balance two competing pressures. Fast switching enables a diversity of RMS specificities to accumulate in uninfected cells following the tight bottleneck of transmission between hosts [27]. Slow switching limits the diversity of RMS specificities among infected cells, which is critical in confining the MGE behind a restriction barrier. Multiple factors affect the value of this optimal rate, including the interval between MGE exposures, the size of the population, and the period for which MGEs remain associated with a host cell. For instance, there was an upper bound for the optimal RMS switching frequencies when cells were challenged by a rapidly horizontally-transmitting MGE such as ML (Figure 1). Yet for more vertically-inherited MGEs, such as MV (Figure 5), the analogous upper bound appears to have been so low as to not be compatible with the generation of variation within the population during the course of the simulation. Hence the RMS’s effectiveness in inhibiting MGE transmission only exhibits a lower constraint, albeit in the presence of transformation compensating for the undermining of the restriction barrier.
The number of alternative functional forms of the phase variable RMS is likely to also be relevant to the optimal switching rate. This model only considered a phase variable system with two arrangements, whereas the ivr-encoded SpnIII RMS has six arrangements [11,19], and the tvr-encoded SpnIV RMS has up to four in a given isolate [25]. The two simulated variants can be regarded as being separated by the slowest phase variation mechanism, each representing a set of more rapidly interconverting variants. This links the outputs of this modelling analysis to the slow inversion rate via short repeats at the ivr locus [24] and the infrequent interchange at part of the tvr locus (Figure 1), providing a potential explanation for the transcriptional attenuation mechanism that seems to have evolved to limit the rate of switching at the tvr locus [25].
The transformation machinery has the potential to act as a complementary branch of the S. pneumoniae immune system, through preventing the vertical transmission of MGEs by deleting them after they have integrated in the bacterial chromosome [32]. The analyses presented here refine and improve this chromosomal curing hypothesis. No evidence was found of easily detectable between-strain transformations driving such deletions, but this may have been confounded by conservation of prophage att sites and the low genome-wide levels of linkage disequilibrium in S. pneumoniae [39,66]. Should these results reflect a genuine absence of between-strain transformation hotspots at prophage att sites, they would still be consistent with transformation curing the chromosome of integrated MGEs. However, such data would suggest transformation’s window of effectiveness ends once the MGE becomes common in the cell population within a host, indicating it primarily functions to contain the spread of a newly acquired MGE. This is because a successfully transmitting MGE increases the force of infection in the population, and simultaneously reduces the number of uninfected cells that can act as donors to drive chromosomal curing. Once the MGE is fixed in a within-host bacterial population, any subsequent MGE deletion through interstrain transformation affecting a single cell will likely be undone by reinfection from a clonally related MGE carrier. This scenario, in which MGEs are not at continual risk of being deleted post-fixation, seems a more evolutionary stable situation than that in which transformation is so rapid it can remove a prophage already fixed in a cell population. In the latter situation, either MGEs would be eliminated from the species altogether, else selection would likely be strong enough to compel MGEs to inhibit transformation in all infected S. pneumoniae cells, as is currently observed in the minority of the population in which comYC is disrupted by prophage insertion [35,36].
The scenario in which asymmetric transformation is advantageous through its deletion of recently acquired MGEs through only within-strain recombination, depends on there being barriers to sequence exchange between different strains co-colonising the same host. These may be the result of physical separation, competition [67], or synchronized regulation of within-strain fratricide and competence for transformation [9]. These barriers are likely to be beneficial to individual cells, as they reduce the probability of being infected by an MGE, or acquiring a genomic island from a donor with a different RMS activity that could cause self-restriction [25]. Such barriers are the most likely explanation for the independent observation that S. pneumoniae isolates spend a high proportion of their time sharing the nasopharynx with divergent genotypes [4] and yet only exchange DNA between strains once every few years or decades [68], resulting in strains having stable non-prophage accessory genomes over many years [1,5]. This scenario also proposes transformation is beneficial over the short timescales of MGE invasion into a cell population in the nasopharynx [32], rather than the multi-year timescales of adaptive evolution facilitated by acquisition of diversity from other strains [68]. This would be consistent with the intrinsic instability of the transformation machinery [69], and the observed negative effect of its disruption on S. pneumoniae carriage durations [28], which are typically measured in weeks or months.
By contrast, between-strain transformation appears to be beneficial to S. pneumoniae when it diversifies antigenic loci. If such changes are highly advantageous, it raises the question of why no phase variation machinery, equivalent to that modifying RMS activity, has evolved to alter the structure, or expression, of the S. pneumoniae antigens most frequently altered by transformation? These are common in many other bacterial pathogens [70], and intrachromosomal recombinations have recently been identified that cause alterations to loci encoding Pneumococcal Histidine Triad proteins [71]. Broader analyses of the many antigens recognized by natural immune responses to S. pneumoniae may help address whether changing a single epitope would result in sufficient benefit to the cell to select for the necessary sequence rearranging machinery [63,72,73].
The chromosomal curing hypothesis can account for the benefit of transformation to each individual cell, unlike many other explanations for the evolution of this system. However, a longer-term problem that might result from this mechanism is the generation of a selection pressure for MGEs to become more virulent, to compensate for reduced vertical transmission. Defences such as phase variable RMS, which are only active against horizontal transmission of MGEs, can counteract this effect. Conversely, MGEs could evolve to stably integrate into the chromosome such that there is no optimal RMS phase variation rate low enough to avoid switching in an infected cell, while still being high enough to generate diversity during a carriage episode (e.g., Figure 5); yet such elements would be highly susceptible to elimination through transformation. Hence, the synergies between these two immune mechanisms are likely to extend beyond the interactions modelled here, through each preventing the evolution of elements that could evade the other.
5. Conclusions
The invasion of MGEs into a clonally related S. pneumoniae population can be synergistically inhibited by phase variable restriction modification systems limiting MGE horizontal transmission and asymmetric transformation limiting MGE vertical transmission.
Supplementary Materials
The following are available online at https://www.mdpi.com/2073-4425/10/9/707/s1: Figures S1: Vertical inheritance of mobile genetic elements in S. pneumoniae expressing different variants of the phase-variable SpnIV RMS, S2: Heatmap displaying the results of simulations in which a cellular population expressing a phase-variable RMS was repeatedly challenged by MV-type invading MGEs, S3: Heatmap showing the results of simulations of sequence exchange between a transformable S. pneumoniae population, initiated at carrying capacity , S4: Heatmap showing the results of simulations of sequence exchange between a transformable S. pneumoniae population, initiated at carrying capacity, repeatedly challenged by MGE invasions, S5: Heatmap showing the outputs of simulations of sequence exchange between a transformable S. pneumoniae population expressing a phase-variable RMS, with τ varying between variants, Table S1: Primers used to quantify variants of the tvr locus in S. pneumoniae RMV5 and RMV8. The updated C++ model code used for simulations is available from [73].
Author Contributions
Conceptualization, all authors; methodology, M.J.K., C.F., and N.J.C.; software, N.J.C.; formal analysis, M.J.K. and N.J.C.; writing—original draft preparation, N.J.C.; writing—review and editing, all authors; visualization, M.J.K. and N.J.C.; supervision, M.R.O., S.D.B., C.F., and N.J.C.
Funding
This research was funded by the BBSRC, grant number BB/N002903/1. N.J.C. was supported by a Sir Henry Dale fellowship jointly funded by Wellcome and the Royal Society, grant number 104169/Z/14/Z. The APC was funded by Wellcome.
Conflicts of Interest
N.J.C. has consulted for Antigen Discovery Inc. and been award an investigator-initiated grant from GlaxoSmithKline. The funders had no role in the design of the study; in the collection, analyses, or interpretation of data; in the writing of the manuscript, or in the decision to publish the results.
References
- Lees, J.A.; Harris, S.R.; Tonkin-Hill, G.; Gladstone, R.A.; Lo, S.; Weiser, J.N.; Corander, J.; Bentley, S.D.; Croucher, N.J. Fast and flexible bacterial genomic epidemiology with PopPUNK. Genome Res. 2019, 29, 304–316. [Google Scholar] [CrossRef] [PubMed] [Green Version]
- Gladstone, R.A.; Lo, S.W.; Lees, J.A.; Croucher, N.J.; van Tonder, A.J.; Corander, J.; Page, A.J.; Marttinen, P.; Bentley, L.J.; Ochoa, T.J.; et al. International genomic definition of pneumococcal lineages, to contextualise disease, antibiotic resistance and vaccine impact. EBioMedicine 2019, in press. [Google Scholar] [CrossRef] [PubMed]
- Croucher, N.J.; Løchen, A.; Bentley, S.D. Pneumococcal Vaccines: Host Interactions, Population Dynamics, and Design Principles. Annu. Rev. Microbiol. 2018, 72, 521–549. [Google Scholar] [CrossRef] [PubMed]
- Turner, P.; Hinds, J.; Turner, C.; Jankhot, A.; Gould, K.; Bentley, S.D.; Nosten, F.; Goldblatt, D. Improved detection of nasopharyngeal cocolonization by multiple pneumococcal serotypes by use of latex agglutination or molecular serotyping by microarray. J. Clin. Microbiol. 2011, 49, 1784–1789. [Google Scholar] [CrossRef] [PubMed]
- Croucher, N.J.; Coupland, P.G.; Stevenson, A.E.; Callendrello, A.; Bentley, S.D.; Hanage, W.P. Diversification of bacterial genome content through distinct mechanisms over different timescales. Nat. Commun. 2014, 5, 5471. [Google Scholar] [CrossRef]
- Novick, R.P.; Christie, G.E.; Penadés, J.R. The phage-related chromosomal islands of Gram-positive bacteria. Nat. Rev. Microbiol. 2010, 8, 541. [Google Scholar] [CrossRef] [PubMed]
- Cury, J.; Touchon, M.; Rocha, E.P.C. Integrative and conjugative elements and their hosts: composition, distribution and organization. Nucleic Acids Res. 2017, 45, 8943–8956. [Google Scholar] [CrossRef] [Green Version]
- Hiller, N.L.; Janto, B.; Hogg, J.S.; Boissy, R.; Yu, S.; Powell, E.; Keefe, R.; Ehrlich, N.E.; Shen, K.; Hayes, J.; et al. Comparative Genomic Analyses of Seventeen Streptococcus pneumoniae Strains: Insights into the Pneumococcal Supragenome. J. Bacteriol. 2007, 189, 8186–8195. [Google Scholar] [CrossRef]
- Johnston, C.; Campo, N.; Bergé, M.J.; Polard, P.; Claverys, J.P. Streptococcus pneumoniae, le transformiste. Trends Microbiol. 2014, 22, 113–119. [Google Scholar] [CrossRef]
- Touchon, M.; Bernheim, A.; Rocha, E.P.C. Genetic and life-history traits associated with the distribution of prophages in bacteria. ISME J. 2016, 10, 2744–2754. [Google Scholar] [CrossRef] [Green Version]
- Tettelin, H.; Nelson, K.E.; Paulsen, I.T.; Eisen, J.A.; Read, T.D.; Peterson, S.; Heidelberg, J.; DeBoy, R.T.; Haft, D.H.; Dodson, R.J.; et al. Complete genome sequence of a virulent isolate of Streptococcus pneumoniae. Science 2001, 293, 498–506. [Google Scholar] [CrossRef] [PubMed]
- Romero, P.; Garcia, E.; Mitchell, T.J. Development of a prophage typing system and analysis of prophage carriage in Streptococcus pneumoniae. Appl. Environ. Microbiol. 2009, 75, 1642–1649. [Google Scholar] [CrossRef] [PubMed]
- Ramirez, M.; Severina, E.; Tomasz, A. A high incidence of prophage carriage among natural isolates of Streptococcus pneumoniae. J. Bacteriol. 1999, 181, 3618–3625. [Google Scholar] [PubMed]
- Bikard, D.; Hatoum-Aslan, A.; Mucida, D.; Marraffini, L.A. CRISPR interference can prevent natural transformation and virulence acquisition during in vivo bacterial infection. Cell Host Microbe 2012, 12, 177–186. [Google Scholar] [CrossRef] [PubMed]
- Terns, M.P.; Terns, R.M. CRISPR-based adaptive immune systems. Curr. Opin. Microbiol. 2011, 14, 321–327. [Google Scholar] [CrossRef] [PubMed] [Green Version]
- Roberts, R.J.; Vincze, T.; Posfai, J.; Macelis, D. REBASE-a database for DNA restriction and modification: Enzymes, genes and genomes. Nucleic Acids Res. 2015, 43, D298–D299. [Google Scholar] [CrossRef]
- Leprohon, P.; Gingras, H.; Ouennane, S.; Moineau, S.; Ouellette, M. A genomic approach to understand interactions between Streptococcus pneumoniae and its bacteriophages. BMC Genomics 2015, 16, 972. [Google Scholar] [CrossRef]
- Eutsey, R.A.; Powell, E.; Dordel, J.; Salter, S.J.; Clark, T.A.; Korlach, J.; Ehrlich, G.D.; Hiller, N.L. Genetic Stabilization of the Drug-Resistant PMEN1 Pneumococcus Lineage by Its Distinctive DpnIII Restriction-Modification System. MBio 2015, 6, e00173-15. [Google Scholar] [CrossRef] [Green Version]
- Manso, A.S.; Chai, M.H.; Atack, J.M.; Furi, L.; De Ste Croix, M.; Haigh, R.; Trappetti, C.; Ogunniyi, A.D.; Shewell, L.K.; Boitano, M.; et al. A random six-phase switch regulates pneumococcal virulence via global epigenetic changes. Nat. Commun. 2014, 5, 5055. [Google Scholar] [CrossRef] [Green Version]
- Li, J.; Li, J.W.; Feng, Z.; Wang, J.; An, H.; Liu, Y.; Wang, Y.; Wang, K.; Zhang, X.; Miao, Z.; et al. Epigenetic Switch Driven by DNA Inversions Dictates Phase Variation in Streptococcus pneumoniae. PLoS Pathog. 2016, 12, e1005762. [Google Scholar] [CrossRef]
- Oliver, M.B.; Basu Roy, A.; Kumar, R.; Lefkowitz, E.J.; Swords, W.E. Streptococcus pneumoniae TIGR4 Phase-Locked Opacity Variants Differ in Virulence Phenotypes. mSphere 2017, 2, e00386-17. [Google Scholar] [CrossRef] [PubMed]
- De Ste Croix, M.; Vacca, I.; Kwun, M.J.; Ralph, J.D.; Bentley, S.D.; Haigh, R.; Croucher, N.J.; Oggioni, M.R. Phase-variable methylation and epigenetic regulation by type I restriction-modification systems. FEMS Microbiol. Rev. 2017, 41, S3–S15. [Google Scholar] [CrossRef] [PubMed]
- Feng, Z.; Li, J.; Zhang, J.R.; Zhang, X. Qdnamod: A statistical model-based tool to reveal intercellular heterogeneity of DNA modification from SMRT sequencing data. Nucleic Acids Res. 2014, 42, 13488–13499. [Google Scholar] [CrossRef] [PubMed]
- De Ste Croix, M.; Chen, Y.; Vacca, I.; Manso, A.S.; Johnston, C.; Polard, P.; Kwun, M.J.; Bentley, S.D.; Croucher, N.J.; Bayliss, C.D.; et al. Recombination of the phase variable spnIII locus is independent of all known pneumococcal site-specific recombinases. J. Bacteriol. 2019, 201, e00233-19. [Google Scholar] [CrossRef] [PubMed]
- Kwun, M.J.; Oggioni, M.R.; De Ste Croix, M.; Bentley, S.D.; Croucher, N.J. Excision-reintegration at a pneumococcal phase-variable restriction-modification locus drives within- and between-strain epigenetic differentiation and inhibits gene acquisition. Nucleic Acids Res. 2018, 46, 11438–11453. [Google Scholar] [CrossRef]
- Li, J.W.; Li, J.; Wang, J.; Li, C.; Zhang, J.R. Molecular mechanisms of hsdS inversions in the cod locus of Streptococcus pneumoniae. J. Bacteriol. 2019, 201, e00581-18. [Google Scholar] [CrossRef]
- Kono, M.; Zafar, M.A.; Zuniga, M.; Roche, A.M.; Hamaguchi, S.; Weiser, J.N. Single Cell Bottlenecks in the Pathogenesis of Streptococcus pneumoniae. PLoS Pathog. 2016, 12, e1005887. [Google Scholar] [CrossRef] [PubMed]
- Lees, J.A.; Croucher, N.J.; Goldblatt, D.; Nosten, F.; Parkhill, J.; Turner, C.; Turner, P.; Bentley, S.D. Genome-wide identification of lineage and locus specific variation associated with pneumococcal carriage duration. Elife 2017, 6, e26255. [Google Scholar] [CrossRef]
- Furi, L.; Crawford, L.A.; Rangel-Pineros, G.; Manso, A.S.; De Ste Croix, M.; Haigh, R.D.; Kwun, M.J.; Engelsen Fjelland, K.; Gilfillan, G.D.; Bentley, S.D.; et al. Methylation warfare: interaction of pneumococcal bacteriophages with their host. J. Bacteriol. 2019, JB.00370-19. [Google Scholar] [CrossRef]
- Johnston, C.; Martin, B.; Granadel, C.; Polard, P.; Claverys, J.P. Programmed Protection of Foreign DNA from Restriction Allows Pathogenicity Island Exchange during Pneumococcal Transformation. PLoS Pathog. 2013, 9, e1003178. [Google Scholar] [CrossRef]
- Apagyi, K.J.; Fraser, C.; Croucher, N.J. Transformation asymmetry and the evolution of the bacterial accessory genome. Mol. Biol. Evol. 2018, 35, 575–581. [Google Scholar] [CrossRef] [PubMed]
- Croucher, N.J.; Mostowy, R.; Wymant, C.; Turner, P.; Bentley, S.D.; Fraser, C. Horizontal DNA Transfer Mechanisms of Bacteria as Weapons of Intragenomic Conflict. PLOS Biol. 2016, 14, e1002394. [Google Scholar] [CrossRef] [PubMed]
- Cornejo, O.E.; Rozen, D.E.; May, R.M.; Levin, B.R. Oscillations in continuous culture populations of Streptococcus pneumoniae: Population dynamics and the evolution of clonal suicide. Proc. R. Soc. B Biol. Sci. 2009, 276, 999–1008. [Google Scholar] [CrossRef] [PubMed]
- Engelmoer, D.J.P.; Donaldson, I.; Rozen, D.E. Conservative Sex and the Benefits of Transformation in Streptococcus pneumoniae. PLoS Pathog. 2013, 9, e1003758. [Google Scholar] [CrossRef] [PubMed]
- Croucher, N.J.; Harris, S.R.; Fraser, C.; Quail, M.A.; Burton, J.; van der Linden, M.; McGee, L.; von Gottberg, A.; Song, J.H.; Ko, K.S.; et al. Rapid pneumococcal evolution in response to clinical interventions. Science 2011, 331, 430–434. [Google Scholar] [CrossRef] [PubMed]
- Croucher, N.J.; Hanage, W.P.; Harris, S.R.; McGee, L.; van der Linden, M.; de Lencastre, H.; Sá-Leão, R.; Song, J.-H.; Ko, K.S.; Beall, B.; et al. Variable recombination dynamics during the emergence, transmission and “disarming” of a multidrug-resistant pneumococcal clone. BMC Biol. 2014, 12. [Google Scholar] [CrossRef] [PubMed]
- Croucher, N.J.; Chewapreecha, C.; Hanage, W.P.; Harris, S.R.; McGee, L.; van der Linden, M.; Song, J.-H.H.; Ko, K.S.; de Lencastre, H.; Turner, C.; et al. Evidence for soft selective sweeps in the evolution of pneumococcal multidrug resistance and vaccine escape. Genome Biol. Evol. 2014, 6, 1589–1602. [Google Scholar] [CrossRef] [PubMed]
- Croucher, N.J.; Page, A.J.; Connor, T.R.; Delaney, A.J.; Keane, J.A.; Bentley, S.D.; Parkhill, J.; Harris, S.R. Rapid phylogenetic analysis of large samples of recombinant bacterial whole genome sequences using Gubbins. Nucleic Acids Res. 2015, 43, e15. [Google Scholar] [CrossRef] [PubMed]
- Corander, J.; Fraser, C.; Gutmann, M.U.; Arnold, B.; Hanage, W.P.; Bentley, S.D.; Lipsitch, M.; Croucher, N.J. Frequency-dependent selection in vaccine-associated pneumococcal population dynamics. Nat. Ecol. Evol. 2017, 1, 1950–1960. [Google Scholar] [CrossRef]
- Katoh, K.; Standley, D.M. MAFFT multiple sequence alignment software version 7: Improvements in performance and usability. Mol. Biol. Evol. 2013, 30, 772–780. [Google Scholar] [CrossRef]
- Pfeifer, B.; Wittelsbuerger, U.; Ramos-Onsins, S.E.; Lercher, M.J. PopGenome: An Efficient Swiss Army Knife for Population Genomic Analyses in R. Mol. Biol. Evol. 2014, 31, 1929–1936. [Google Scholar] [CrossRef] [PubMed] [Green Version]
- Stewart, F.M.; Levin, B.R. The population biology of bacterial viruses: Why be temperate. Theor. Popul. Biol. 1984, 26, 93–117. [Google Scholar] [CrossRef]
- Bull, J.J.; Molineux, I.J.; Rice, W.R. Selection of Benevolence in a Host-Parasite System. Evolution (N. Y.) 1991, 45, 875–882. [Google Scholar]
- Kot, W.; Sabri, M.; Gingras, H.; Ouellette, M.; Tremblay, D.M.; Moineau, S. Complete Genome Sequence of Streptococcus pneumoniae Virulent Phage MS1. Genome Announc. 2017, 5, e00333-17. [Google Scholar] [CrossRef] [PubMed]
- Romero, P.; Croucher, N.J.; Hiller, N.L.; Hu, F.Z.; Ehrlich, G.D.; Bentley, S.D.; García, E.; Mitchell, T.J. Comparative genomic analysis of ten Streptococcus pneumoniae temperate bacteriophages. J. Bacteriol. 2009, 191, 4854–4862. [Google Scholar] [CrossRef] [PubMed]
- Brueggemann, A.B.; Harrold, C.L.; Rezaei Javan, R.; Van Tonder, A.J.; McDonnell, A.J.; Edwards, B.A. Pneumococcal prophages are diverse, but not without structure or history. Sci. Rep. 2017, 7, 42976. [Google Scholar] [CrossRef] [PubMed]
- Croucher, N.J.; Harris, S.R.; Barquist, L.; Parkhill, J.; Bentley, S.D. A high-resolution view of genome-wide pneumococcal transformation. PLoS Pathog. 2012, 8, e1002745. [Google Scholar] [CrossRef]
- Mell, J.C.; Lee, J.Y.; Firme, M.; Sinha, S.; Redfield, R.J. Extensive Cotransformation of Natural Variation into Chromosomes of Naturally Competent Haemophilus influenzae. Genes|Genomes|Genetics 2014, 4, 717–731. [Google Scholar] [CrossRef]
- Chewapreecha, C.; Harris, S.R.; Croucher, N.J.; Turner, C.; Marttinen, P.; Cheng, L.; Pessia, A.; Aanensen, D.M.; Mather, A.E.; Page, A.J.; et al. Dense genomic sampling identifies highways of pneumococcal recombination. Nat. Genet. 2014, 46, 305–309. [Google Scholar] [CrossRef] [Green Version]
- Croucher, N.J.; Finkelstein, J.A.; Pelton, S.I.; Mitchell, P.K.; Lee, G.M.; Parkhill, J.; Bentley, S.D.; Hanage, W.P.; Lipsitch, M. Population genomics of post-vaccine changes in pneumococcal epidemiology. Nat. Genet. 2013, 45, 656–663. [Google Scholar] [CrossRef] [Green Version]
- Yahara, K.; Didelot, X.; Jolley, K.A.; Kobayashi, I.; Maiden, M.C.J.; Sheppard, S.K.; Falush, D. The landscape of realized homologous recombination in pathogenic bacteria. Mol. Biol. Evol. 2016, 33, 456–471. [Google Scholar] [CrossRef] [PubMed]
- Croucher, N.J.; Harris, S.R.; Grad, Y.H.; Hanage, W.P. Bacterial genomes in epidemiology- present and future. Philos. Trans. R. Soc. B Biol. Sci. 2013, 368, 0120202. [Google Scholar] [CrossRef] [PubMed]
- Cowley, L.A.; Petersen, F.C.; Junges, R.; Jimson, D.; Jimenez, M.; Morrison, D.A.; Hanage, W.P. Evolution via recombination: Cell-to-cell contact facilitates larger recombination events in Streptococcus pneumoniae. PLoS Genet. 2018, 14, e1007410. [Google Scholar] [CrossRef] [PubMed]
- Power, P.M.; Bentley, S.D.; Parkhill, J.; Moxon, E.R.; Hood, D.W. Investigations into genome diversity of Haemophilus influenzae using whole genome sequencing of clinical isolates and laboratory transformants. BMC Microbiol. 2012, 12, 273. [Google Scholar] [CrossRef] [PubMed]
- Didelot, X.; Wilson, D.J. ClonalFrameML: Efficient Inference of Recombination in Whole Bacterial Genomes. PLoS Comput. Biol. 2015, 11, e1004041. [Google Scholar] [CrossRef] [PubMed]
- Touchon, M.; Bobay, L.M.; Rocha, E.P.C. The chromosomal accommodation and domestication of mobile genetic elements. Curr. Opin. Microbiol. 2014, 22, 22–29. [Google Scholar] [CrossRef] [PubMed] [Green Version]
- Croucher, N.J.; Walker, D.; Romero, P.; Lennard, N.; Paterson, G.K.; Bason, N.C.; Mitchell, A.M.; Quail, M.A.; Andrew, P.W.; Parkhill, J.; et al. Role of conjugative elements in the evolution of the multidrug-resistant pandemic clone Streptococcus pneumoniaeSpain23F ST81. J Bacteriol 2009, 191, 1480–1489. [Google Scholar] [CrossRef] [PubMed]
- Weiser, J.N.; Kapoor, M. Effect of intrastrain variation in the amount of capsular polysaccharide on genetic transformation of Streptococcus pneumoniae: Implications for virulence studies of encapsulated strains. Infect. Immun. 1999, 67, 3690–3692. [Google Scholar]
- Romero, P.; Llull, D.; García, E.; Mitchell, T.J.; López, R.; Moscoso, M. Isolation and characterization of a new plasmid pSpnP1 from a multidrug-resistant clone of Streptococcus pneumoniae. Plasmid 2007, 58, 51–60. [Google Scholar] [CrossRef]
- Oliveira, P.H.; Touchon, M.; Rocha, E.P.C. The interplay of restriction-modification systems with mobile genetic elements and their prokaryotic hosts. Nucleic Acids Res. 2014, 42, 10618–10631. [Google Scholar] [CrossRef]
- Fukuyo, M.; Sasaki, A.; Kobayashi, I. Success of a suicidal defense strategy against infection in a structured habitat. Sci. Rep. 2012, 2, 238. [Google Scholar] [CrossRef] [PubMed] [Green Version]
- Weitz, J.S.; Hartman, H.; Levin, S.A. Coevolutionary arms races between bacteria and bacteriophage. Proc. Natl. Acad. Sci. USA 2005, 102, 9535–9540. [Google Scholar] [CrossRef] [PubMed] [Green Version]
- Croucher, N.J.; Campo, J.J.; Le, T.Q.; Liang, X.; Bentley, S.D.; Hanage, W.P.; Lipsitch, M. Diverse evolutionary patterns of pneumococcal antigens identified by pangenome-wide immunological screening. Proc. Natl. Acad. Sci. USA 2017, 114, E357–E366. [Google Scholar] [CrossRef] [PubMed] [Green Version]
- Wielgoss, S.; Bergmiller, T.; Bischofberger, A.M.; Hall, A.R. Adaptation to parasites and costs of parasite resistance in mutator and nonmutator bacteria. Mol. Biol. Evol. 2016, 33, 770–782. [Google Scholar] [CrossRef] [PubMed]
- Tock, M.R.; Dryden, D.T.F. The biology of restriction and anti-restriction. Curr. Opin. Microbiol. 2005, 8, 466–472. [Google Scholar] [CrossRef] [PubMed]
- Arnold, B.J.; Gutmann, M.U.; Grad, Y.H.; Sheppard, S.K.; Corander, J.; Lipsitch, M.; Hanage, W.P. Weak epistasis may drive adaptation in recombining bacteria. Genetics 2018, 208, 1247–1260. [Google Scholar] [CrossRef] [PubMed]
- Masala, G.L.; Lipsitch, M.; Bottomley, C.; Flasche, S. Exploring the role of competition induced by non-vaccine serotypes for herd protection following pneumococcal vaccination. J. R. Soc. Interface 2017, 14, 20170620. [Google Scholar] [CrossRef] [PubMed] [Green Version]
- Mostowy, R.; Croucher, N.J.; Hanage, W.P.; Harris, S.R.; Bentley, S.; Fraser, C. Heterogeneity in the Frequency and Characteristics of Homologous Recombination in Pneumococcal Evolution. PLoS Genet. 2014, 10, e1004300. [Google Scholar] [CrossRef]
- Redfield, R.J. Genes for breakfast: The have-your-cake and-eat-it-too of bacterial transformation. J. Hered. 1993, 84, 400–404. [Google Scholar] [CrossRef]
- Wisniewski-Dyé, F.; Vial, L. Phase and antigenic variation mediated by genome modifications. Antonie van Leeuwenhoek Int. J. Gen. Mol. Microbiol. 2008, 94, 493–515. [Google Scholar] [CrossRef]
- Slager, J.; Aprianto, R.; Veening, J.W. Deep genome annotation of the opportunistic human pathogen Streptococcus pneumoniae D39. Nucleic Acids Res. 2018, 46, 9971–9989. [Google Scholar] [CrossRef] [PubMed]
- Campo, J.J.; Le, T.Q.; Pablo, J.V.; Hung, C.; Teng, A.A.; Tettelin, H.; Tate, A.; Hanage, W.P.; Alderson, M.R.; Liang, X.; et al. Panproteome-wide analysis of antibody responses to whole cell pneumococcal vaccination. Elife 2018, 7, e37015. [Google Scholar] [CrossRef] [PubMed]
- Croucher, N.J. Model of horizontal DNA transfer within a simple bacterial community. Available online: https://github.com/nickjcroucher/mgeTransformation (accessed on 20 August 2019).
Figure 1.
The role of phase-variable restriction modification systems in preventing infection of S. pneumoniae by mobile genetic elements. (a) The lack of tvr locus randomization in S. pneumoniae strains RMV5 and RMV8. The relative abundances of different alleles at a segment of the phase variable tvr locus were measured using a specific quantitative PCR assay at the start and end of passage experiments. These bar charts show the ratio of the frequency of the dominant allele to the rare allele. The error bars show the standard error of the mean from combining three technical replicate measurements from two biological replicate experiments. (b) Structure of the mathematical model of an S. pneumoniae population. The population is split into variants A and B, which interchange through phase variation at a rate pv. ML MGEs intermittently invade the population. These transmit between cells of the same variant at a fixed rate, but cannot transmit between cells of different variants. (c) Heatmap displaying simulation results. The heatmap is split into two halves vertically, corresponding to a large (κ = 106; left) or small (κ = 104; right) population. Within each half, the cells correspond to a particular parameter combination, with pv determined by the column, and the rate of MGE activation, f, determined by the row. The colour of the cell represents the mean number of uninfected cells that survived over the 104 timesteps of the simulation, across 20 replicates. (d–f) Examples of simulated populations (κ = 104) with different pv and f fixed at 0.3. The arrows above the plots indicate instances of sustained MGE transmission in the cell population. (d) Simulation with pv = 10−4. The population survives repeated MGE sweeps through phase variation, ensuring a minority of rare variants are able to expand and replace the cells of the dominant variant killed by the MGE. (e) Simulation with pv = 10−8. This slow rate of variation does not sustain multiple variants in the population. (f) Simulation with pv = 10−2. At this rapid rate of interchange, MGEs undermine the restriction barrier between variants through being within cells as they switch, enabling them to infect both variants equally effectively.

Figure 2.
Distribution of recombinations importing sequence diversity at variable loci. These graphs use the outputs of Gubbins, which reconstructs the evolutionary diversification of strains through identifying recombinations and excluding these regions from the set of polymorphisms used for phylogeny generation. Data are shown from the analyses of reference-based alignments for the S. pneumoniae strains (a) PMEN1, (b) PMEN2, and (c) PMEN14. The horizontal axes are labelled with the genome co-ordinates in the relevant reference sequence used to generate the alignments. For each, the top row shows three genomic regions around the loci encoding antigenic structures: pneumococcal surface proteins PspA and PspC, and the capsule polysaccharide synthesis (cps) locus. In each plot, the grey stripe indicates the coding sequence, or sequences, that encode the antigens. Where inferred recombinations were detected within the regions, the red line shows the number spanning each base. The bottom row for each strain shows genomic regions encompassing the insertion, or att, sites for prophage. Two flank purA (attpurA); one was identified as the insertion side of φMM1 (attMM1), and a fourth is within comYC (attcomYC). Where prophage were present in the reference sequences (at attMM1 in PMEN1, and at attpurA and attcomYC in PMEN2), the grey stripe extends across their entire length of the MGE; otherwise a coding sequence flanking the att site is indicated by the stripe. The red lines again indicate the density of recombination events. The peak on the right in the attMM1 plots corresponds to the gene encoding dihydrofolate reductase, the alteration of which can cause trimethoprim resistance.

Figure 3.
Linkage disequilibrium across the S. pneumoniae chromosome, calculated from a species-wide sample of 4127 isolates [39]. A median pairwise r2 could be calculated between all biallelic single nucleotide polymorphisms with a minor allele frequency above 1% for 904 of the 1447 core genes. The higher r2 values reflect greater disequilibrium, and therefore lower levels of recombination. (a) Genome-wide pattern of linkage disequilibrium. The median r2 for each core gene is shown relative to its position in the S. pneumoniae ATCC 700669 genome, the reference isolate for the PMEN1 lineage [57]. The conjugative element, ICESp23FST81, is marked as the explanation for the absence of core genes in one segment of the genome. The red line shows the LOESS local regression line, with the 95% confidence interval shaded. (b–d) Detailed view of the linkage disequilibrium statistics for the core genes surrounding the prophage att sites highlighted in Figure 2. The att positions are indicated by vertical grey stripes; attMM1 contains an inserted prophage, whereas the others are empty in this genome. The smoothed LOESS regression line segments for these regions are shown in red.

Figure 4.
Simulations of sequence exchange between co-colonising S. pneumoniae strains. (a) Structure of the model. Two distinct strains co-colonise a single host. There is no interconversion between them. Both behave identically when they have the same MGE infection status. Strain A is initially completely uninfected, whereas strain B is uniformly infected. Sequence exchange within each strain is unimpeded. However, interstrain exchange is limited by a factor, i, which applies equally to both recombination through transformation (it) and MGE transmission (im). (b) Heatmap showing the results of simulations. The properties of the MGE, MV, were constant across simulations, with variation in transformation rate (τ) shown across columns, and variation in i shown across rows. Each cell is split in two, with the halves showing the proportion of cells infected with an MGE in strains A (left) and B (right). Differences between the cell halves represent impeded MGE transmission between the strains. The displayed values are calculated as the mean across three replicate simulations.

Figure 5.
Simulations of sequence exchange between a transformable S. pneumoniae population expressing a phase-variable RMS. (a) Structure of the model. The cell population was initialized as being entirely of variant A, with 50% of cells carrying an MGE. The MGE present was either MV, which had a relatively greater tendency towards vertical transmission, or MH, which had a relatively greater tendency towards horizontal transmission. Phase variation at an RMS occurred at a rate pv, generating a mixed population of variants, between which MGEs could not transmit, owing to the restriction barrier. Transformation was asymmetric and not inhibited by the restriction barrier, as RMSs are only expected to inhibit acquisition of new genes by transformation. (b) Heatmap showing the results of simulations. Variation in within-strain transformation rate (τ) is shown across columns, and variation in pv shown across rows. Each cell is split in two, with the halves showing the proportion of cells infected with an MGE in simulations with MH (left) and MV (right). These values are calculated as the mean across three replicate simulations.


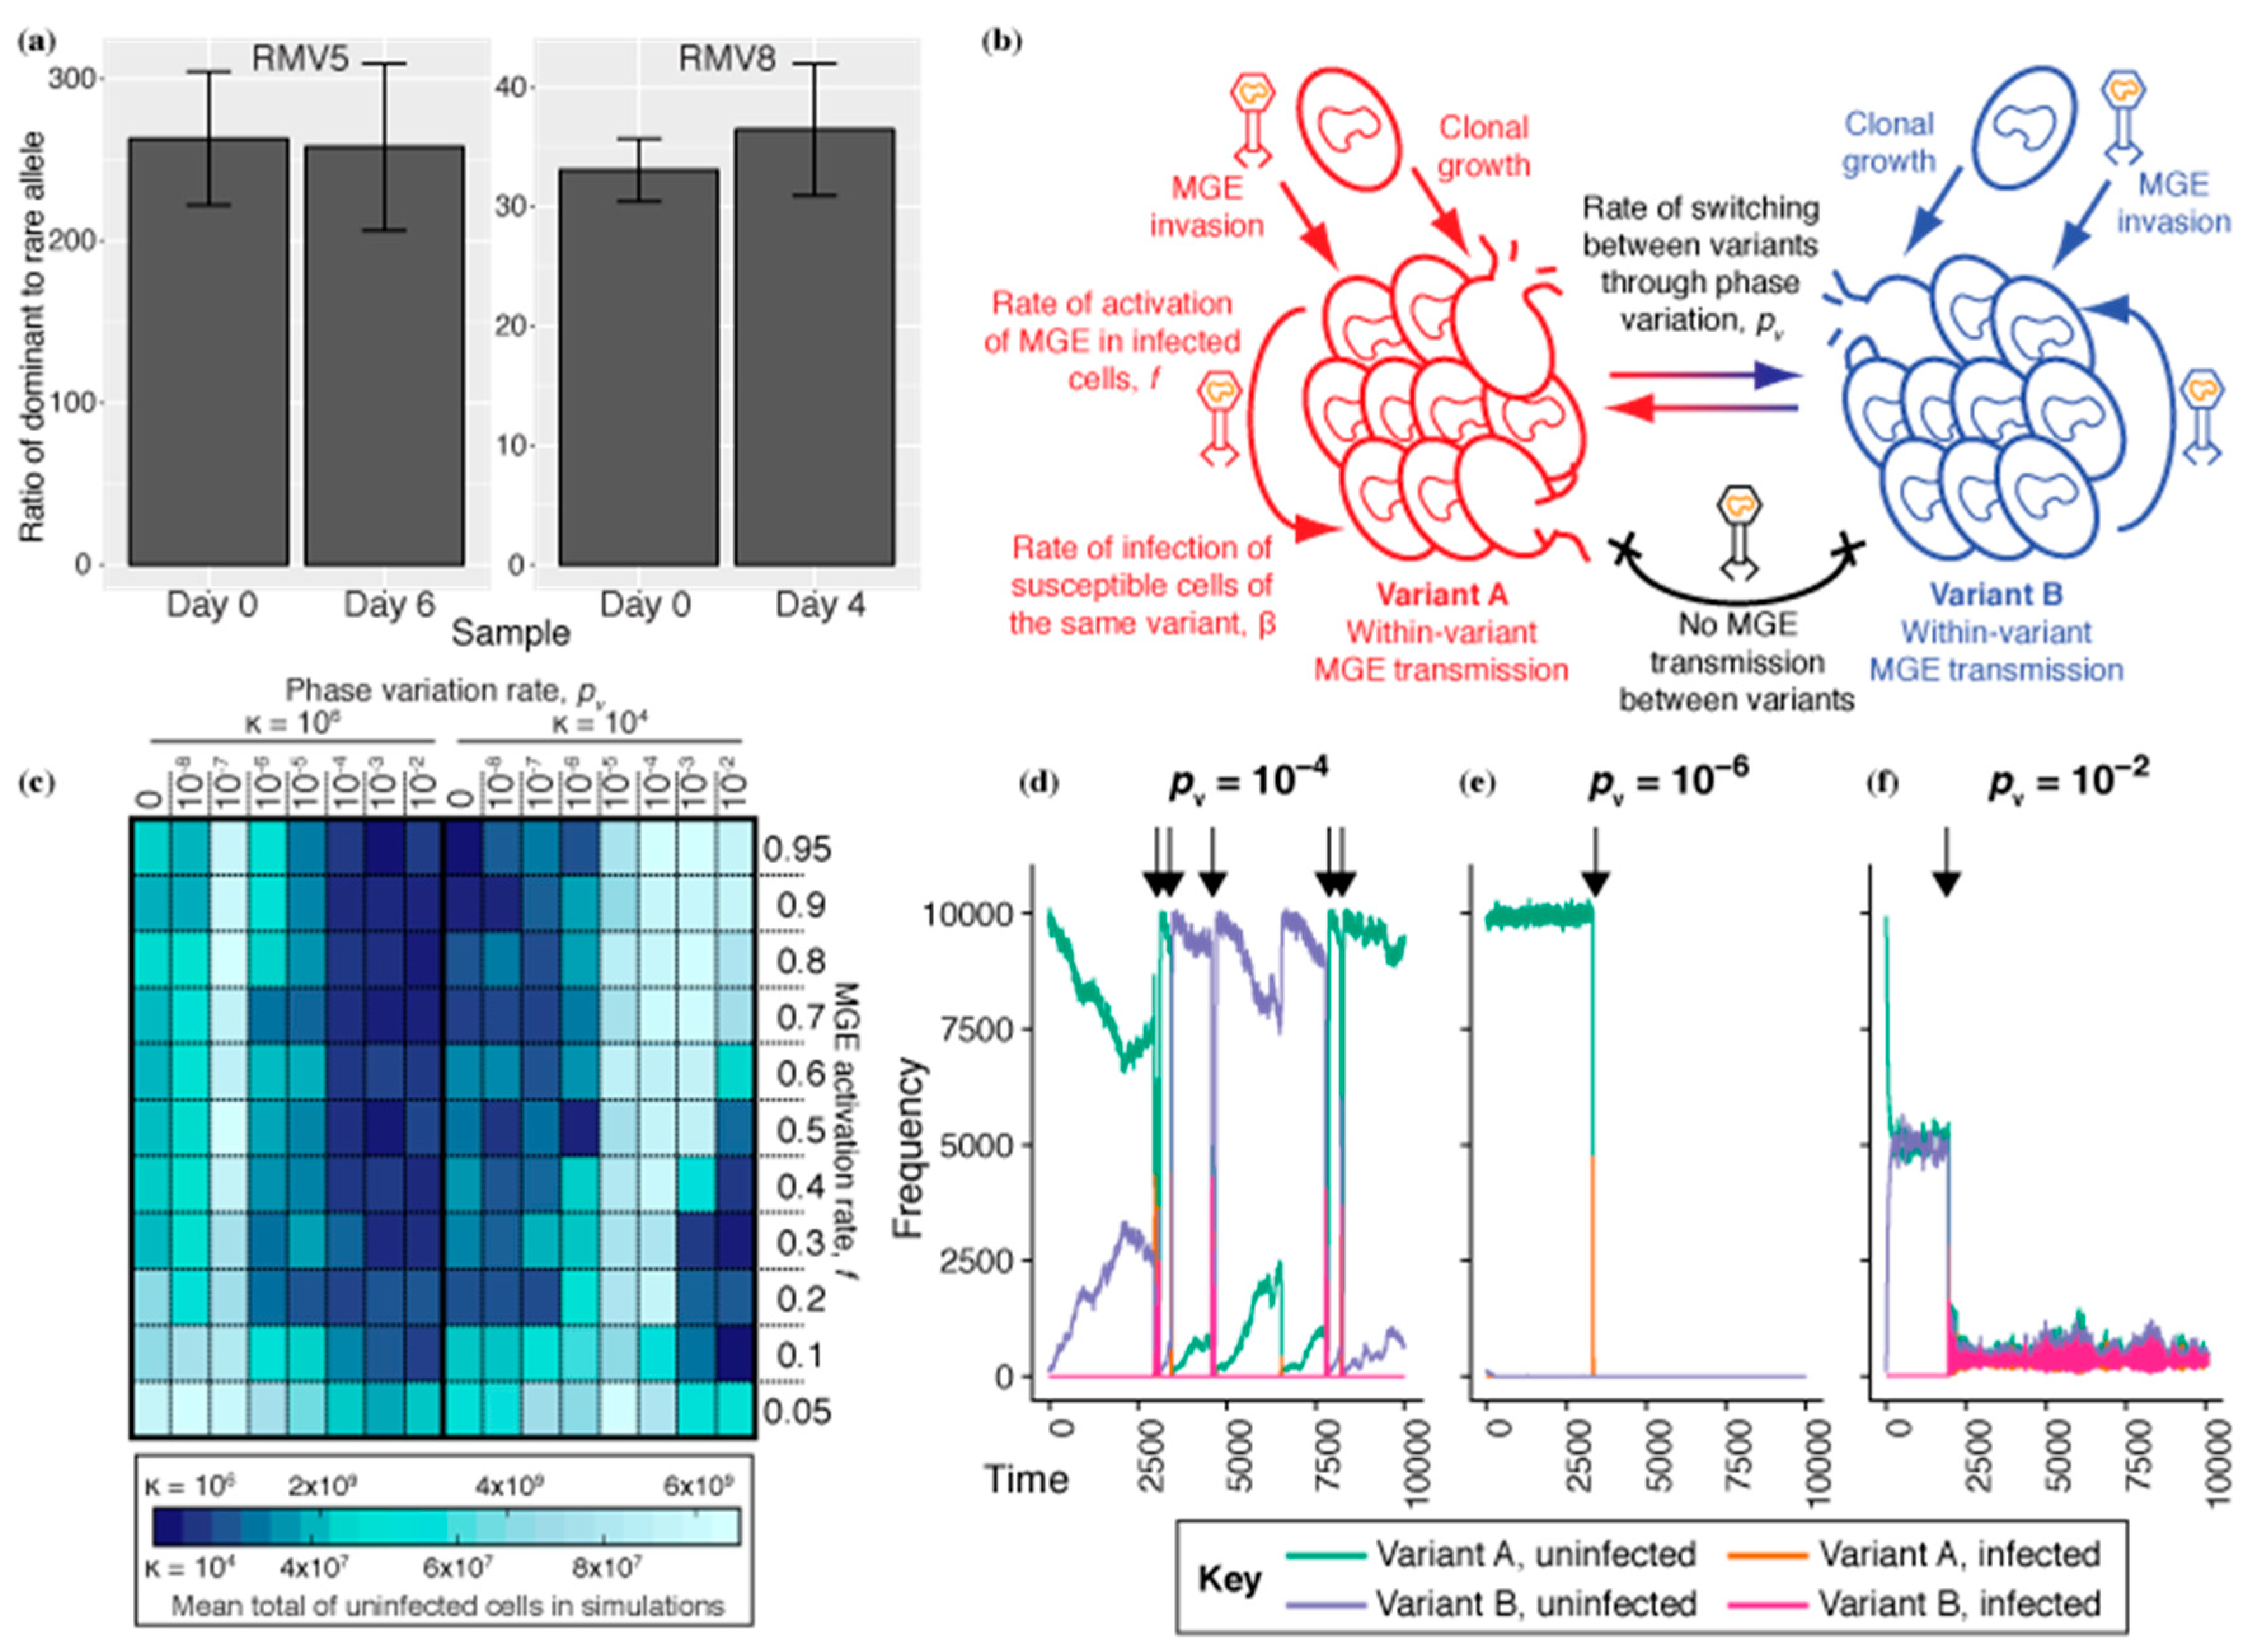
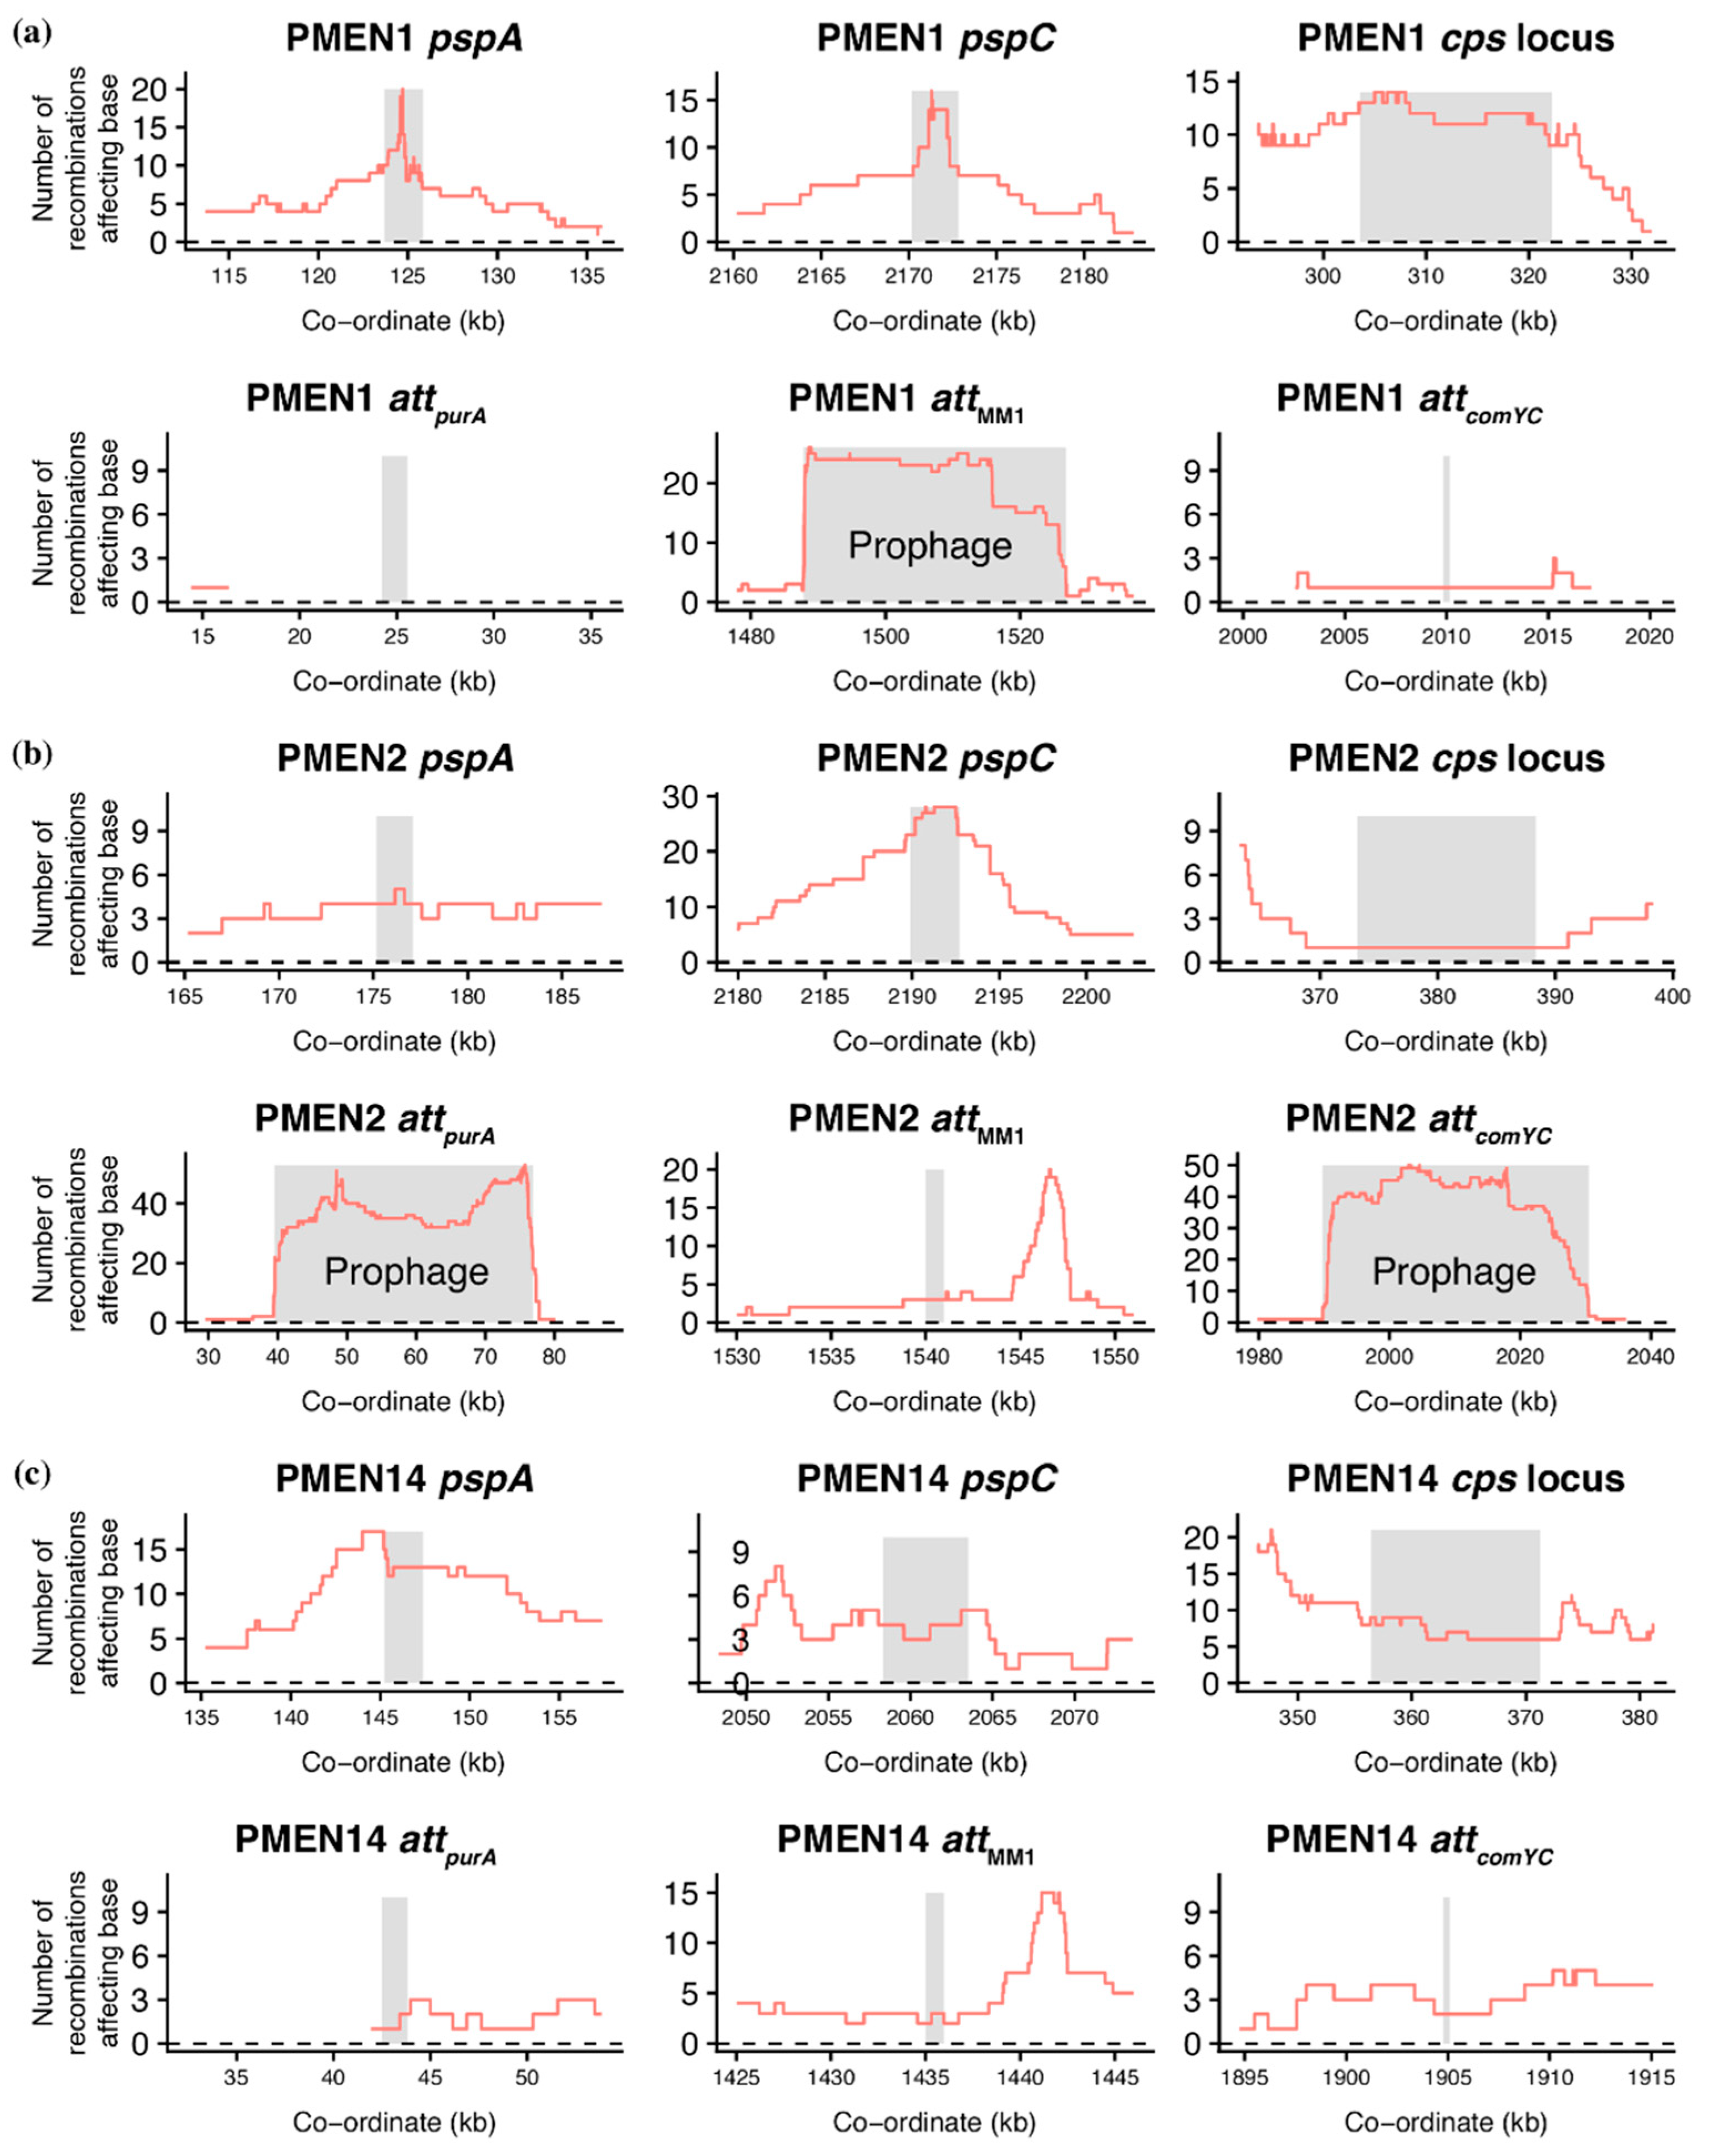
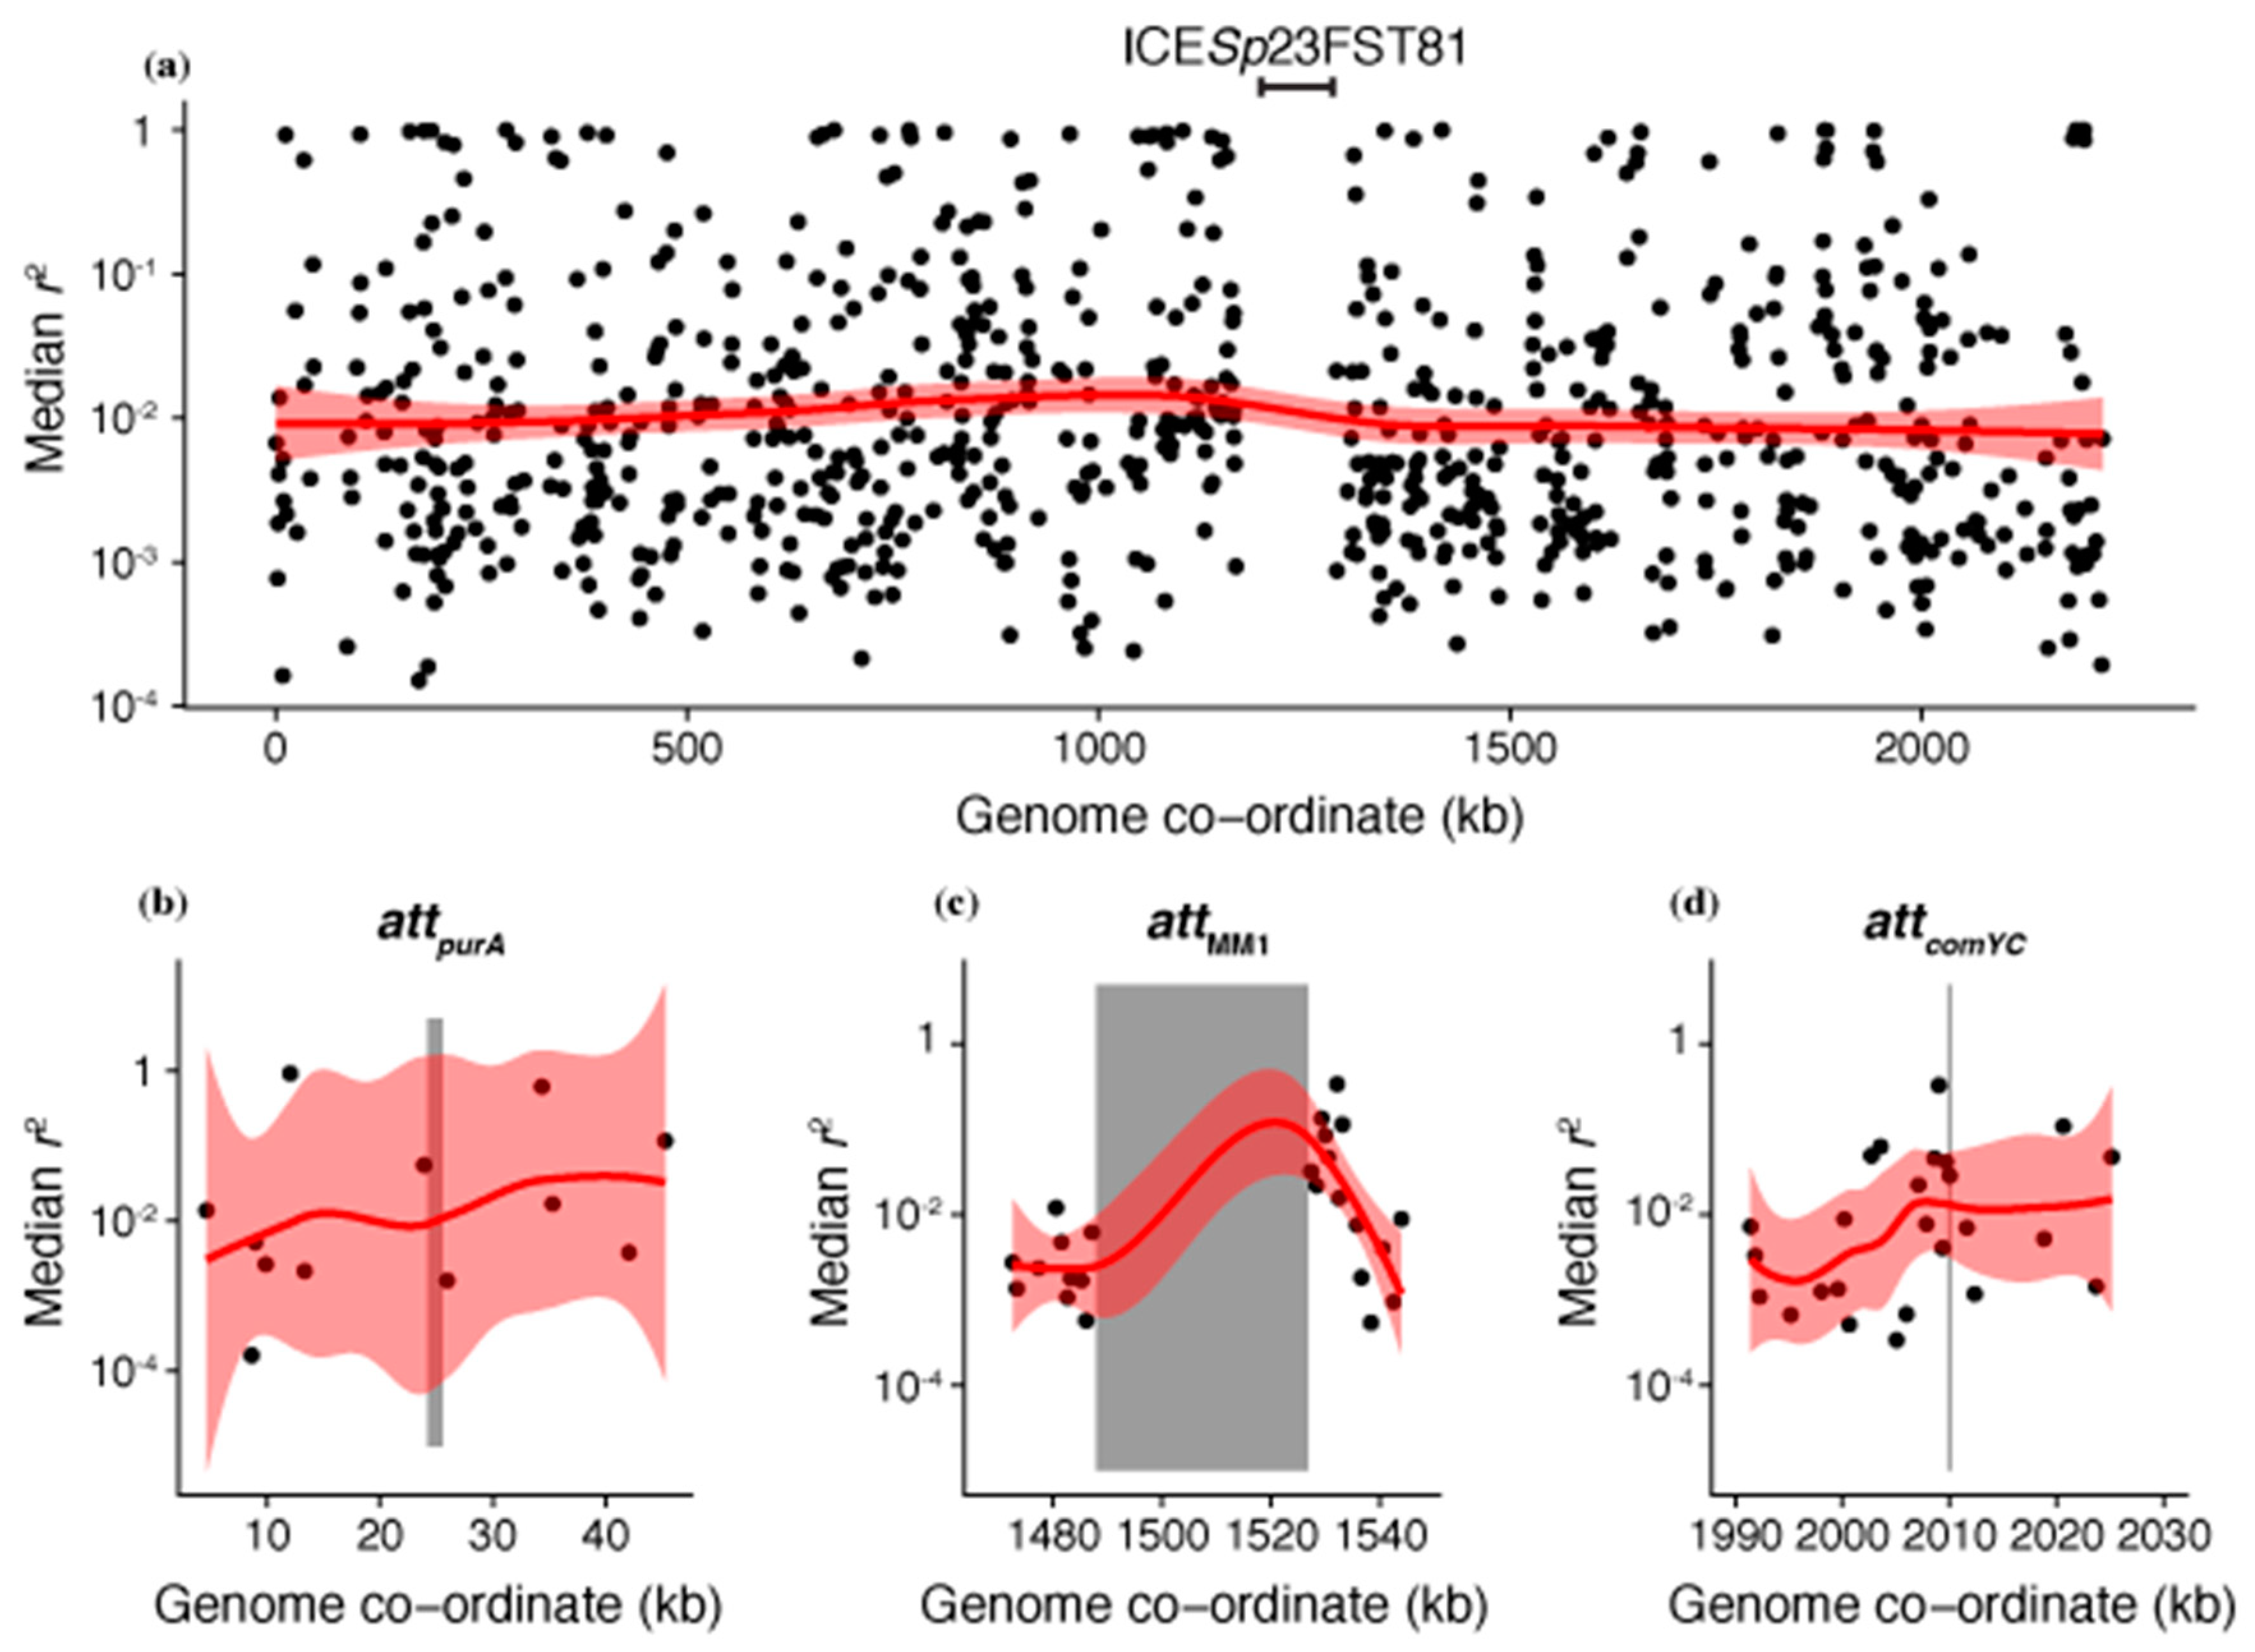
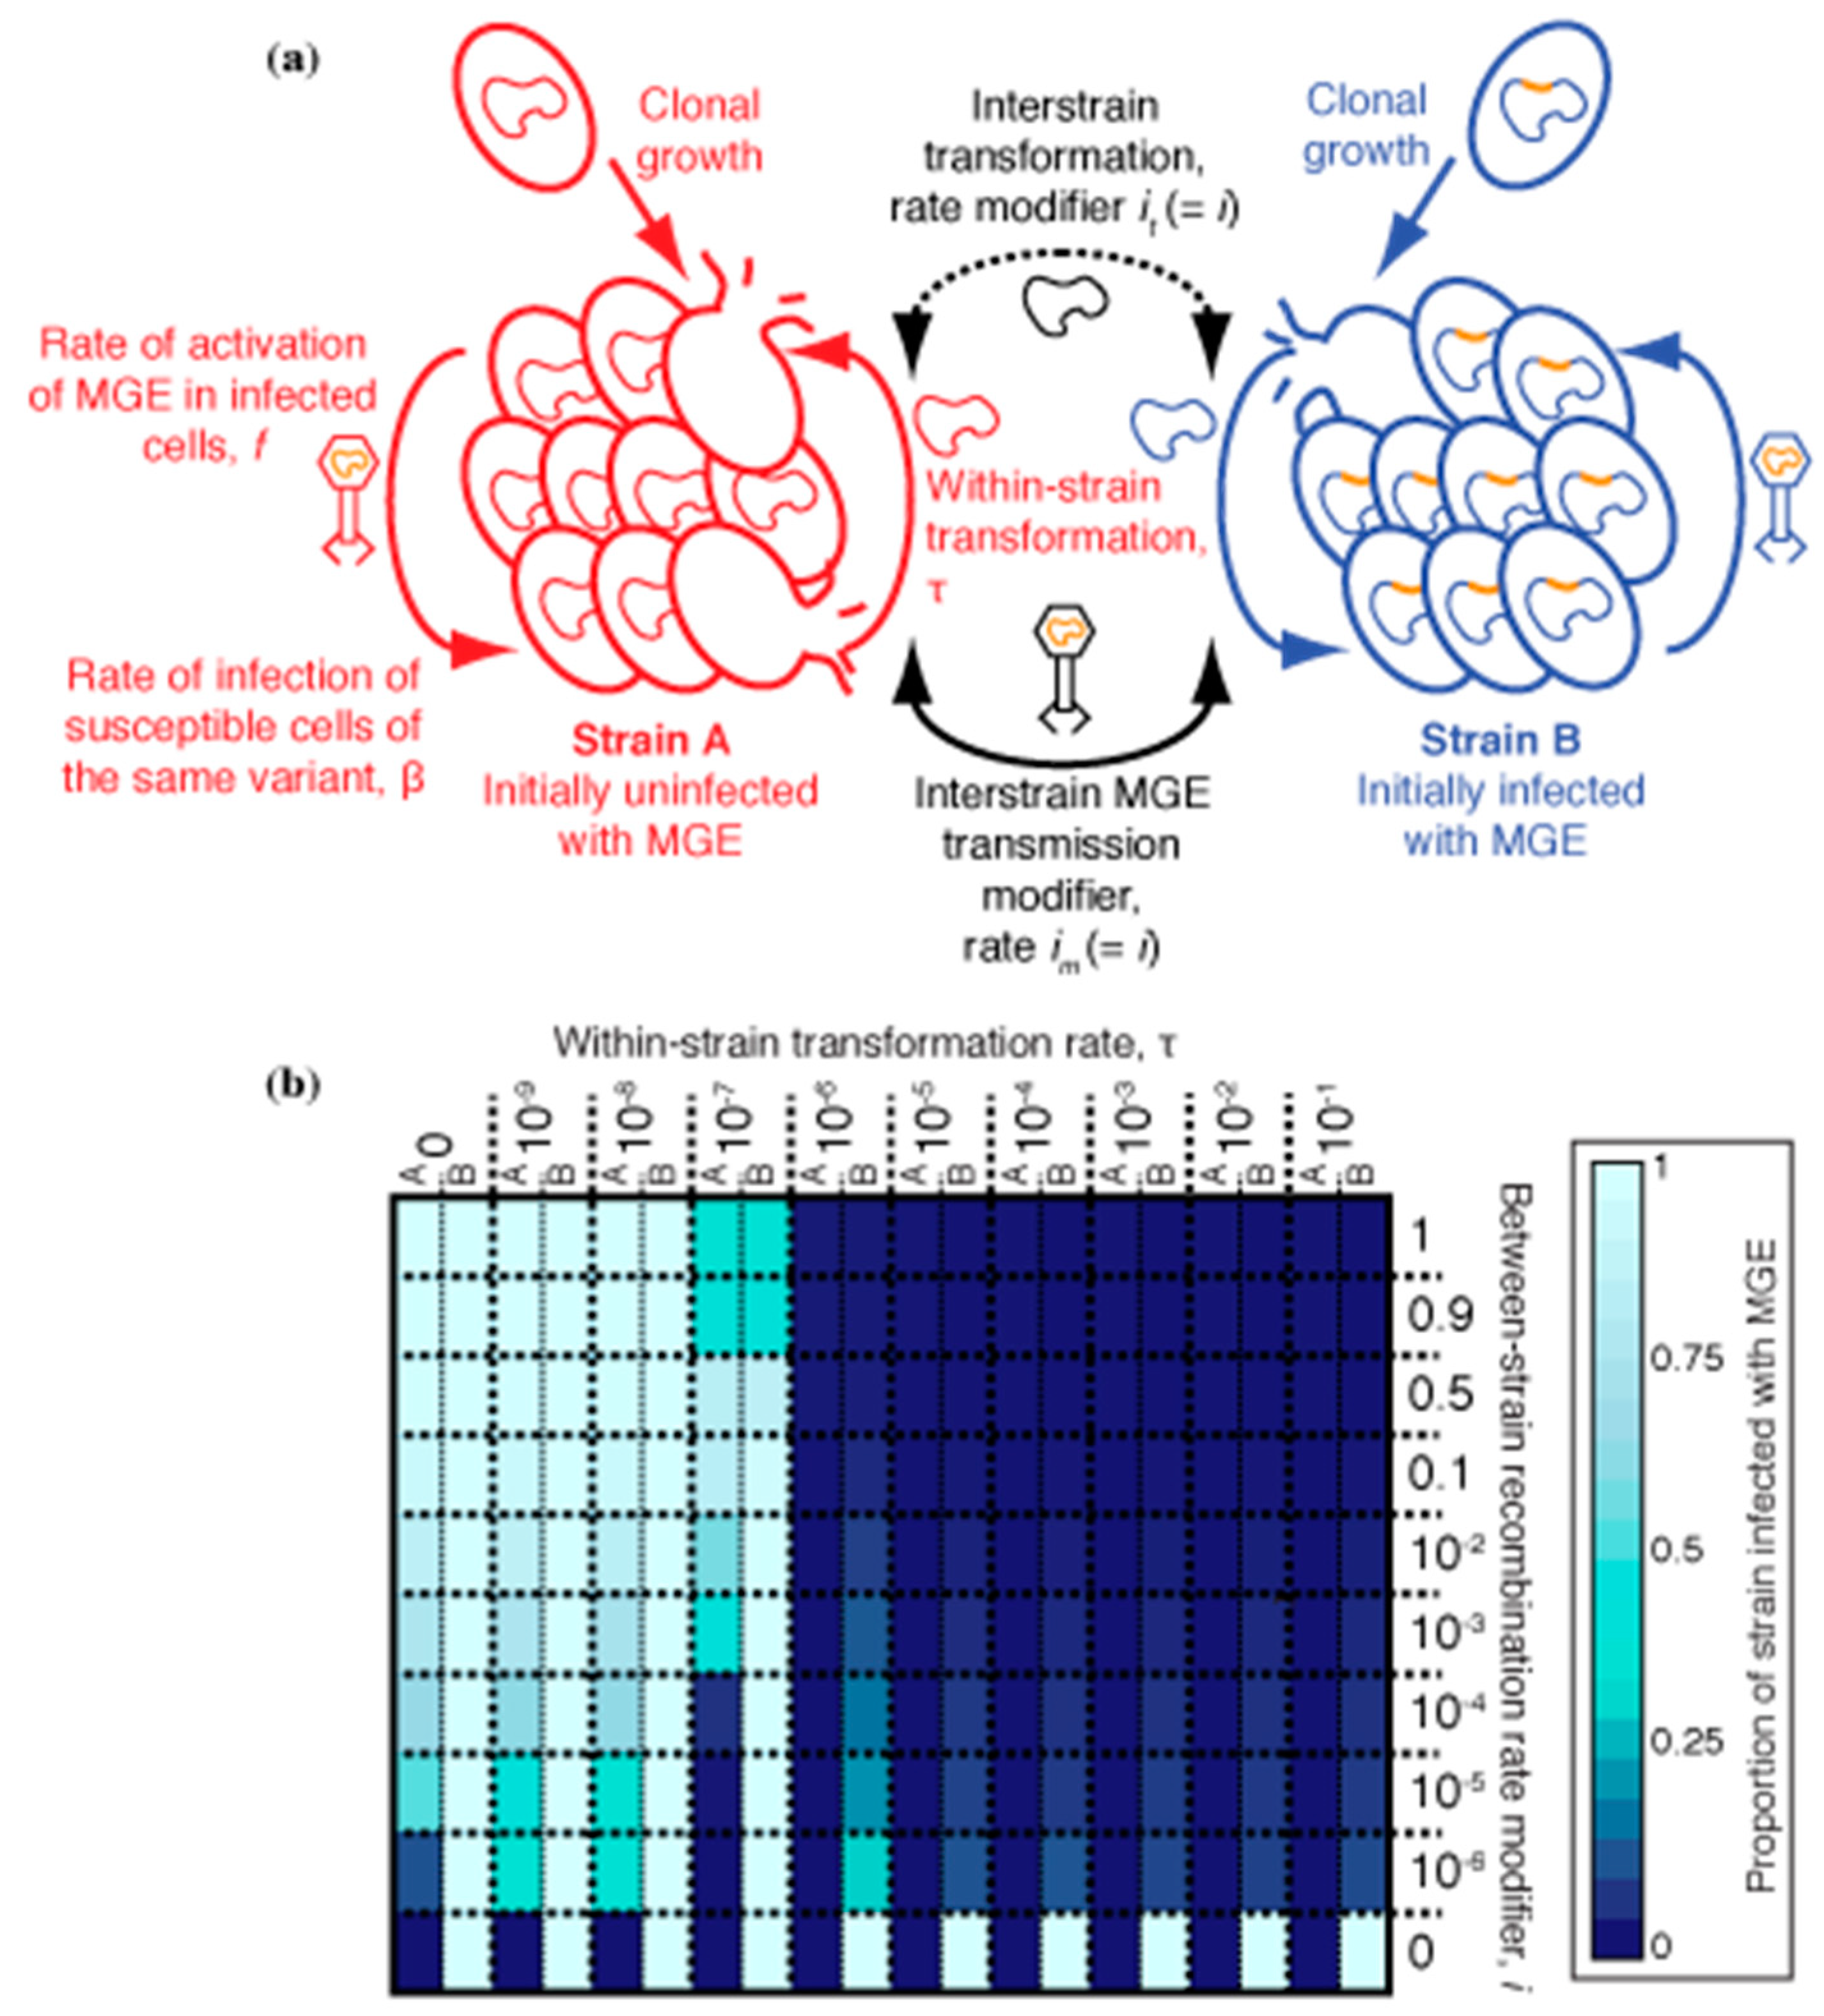
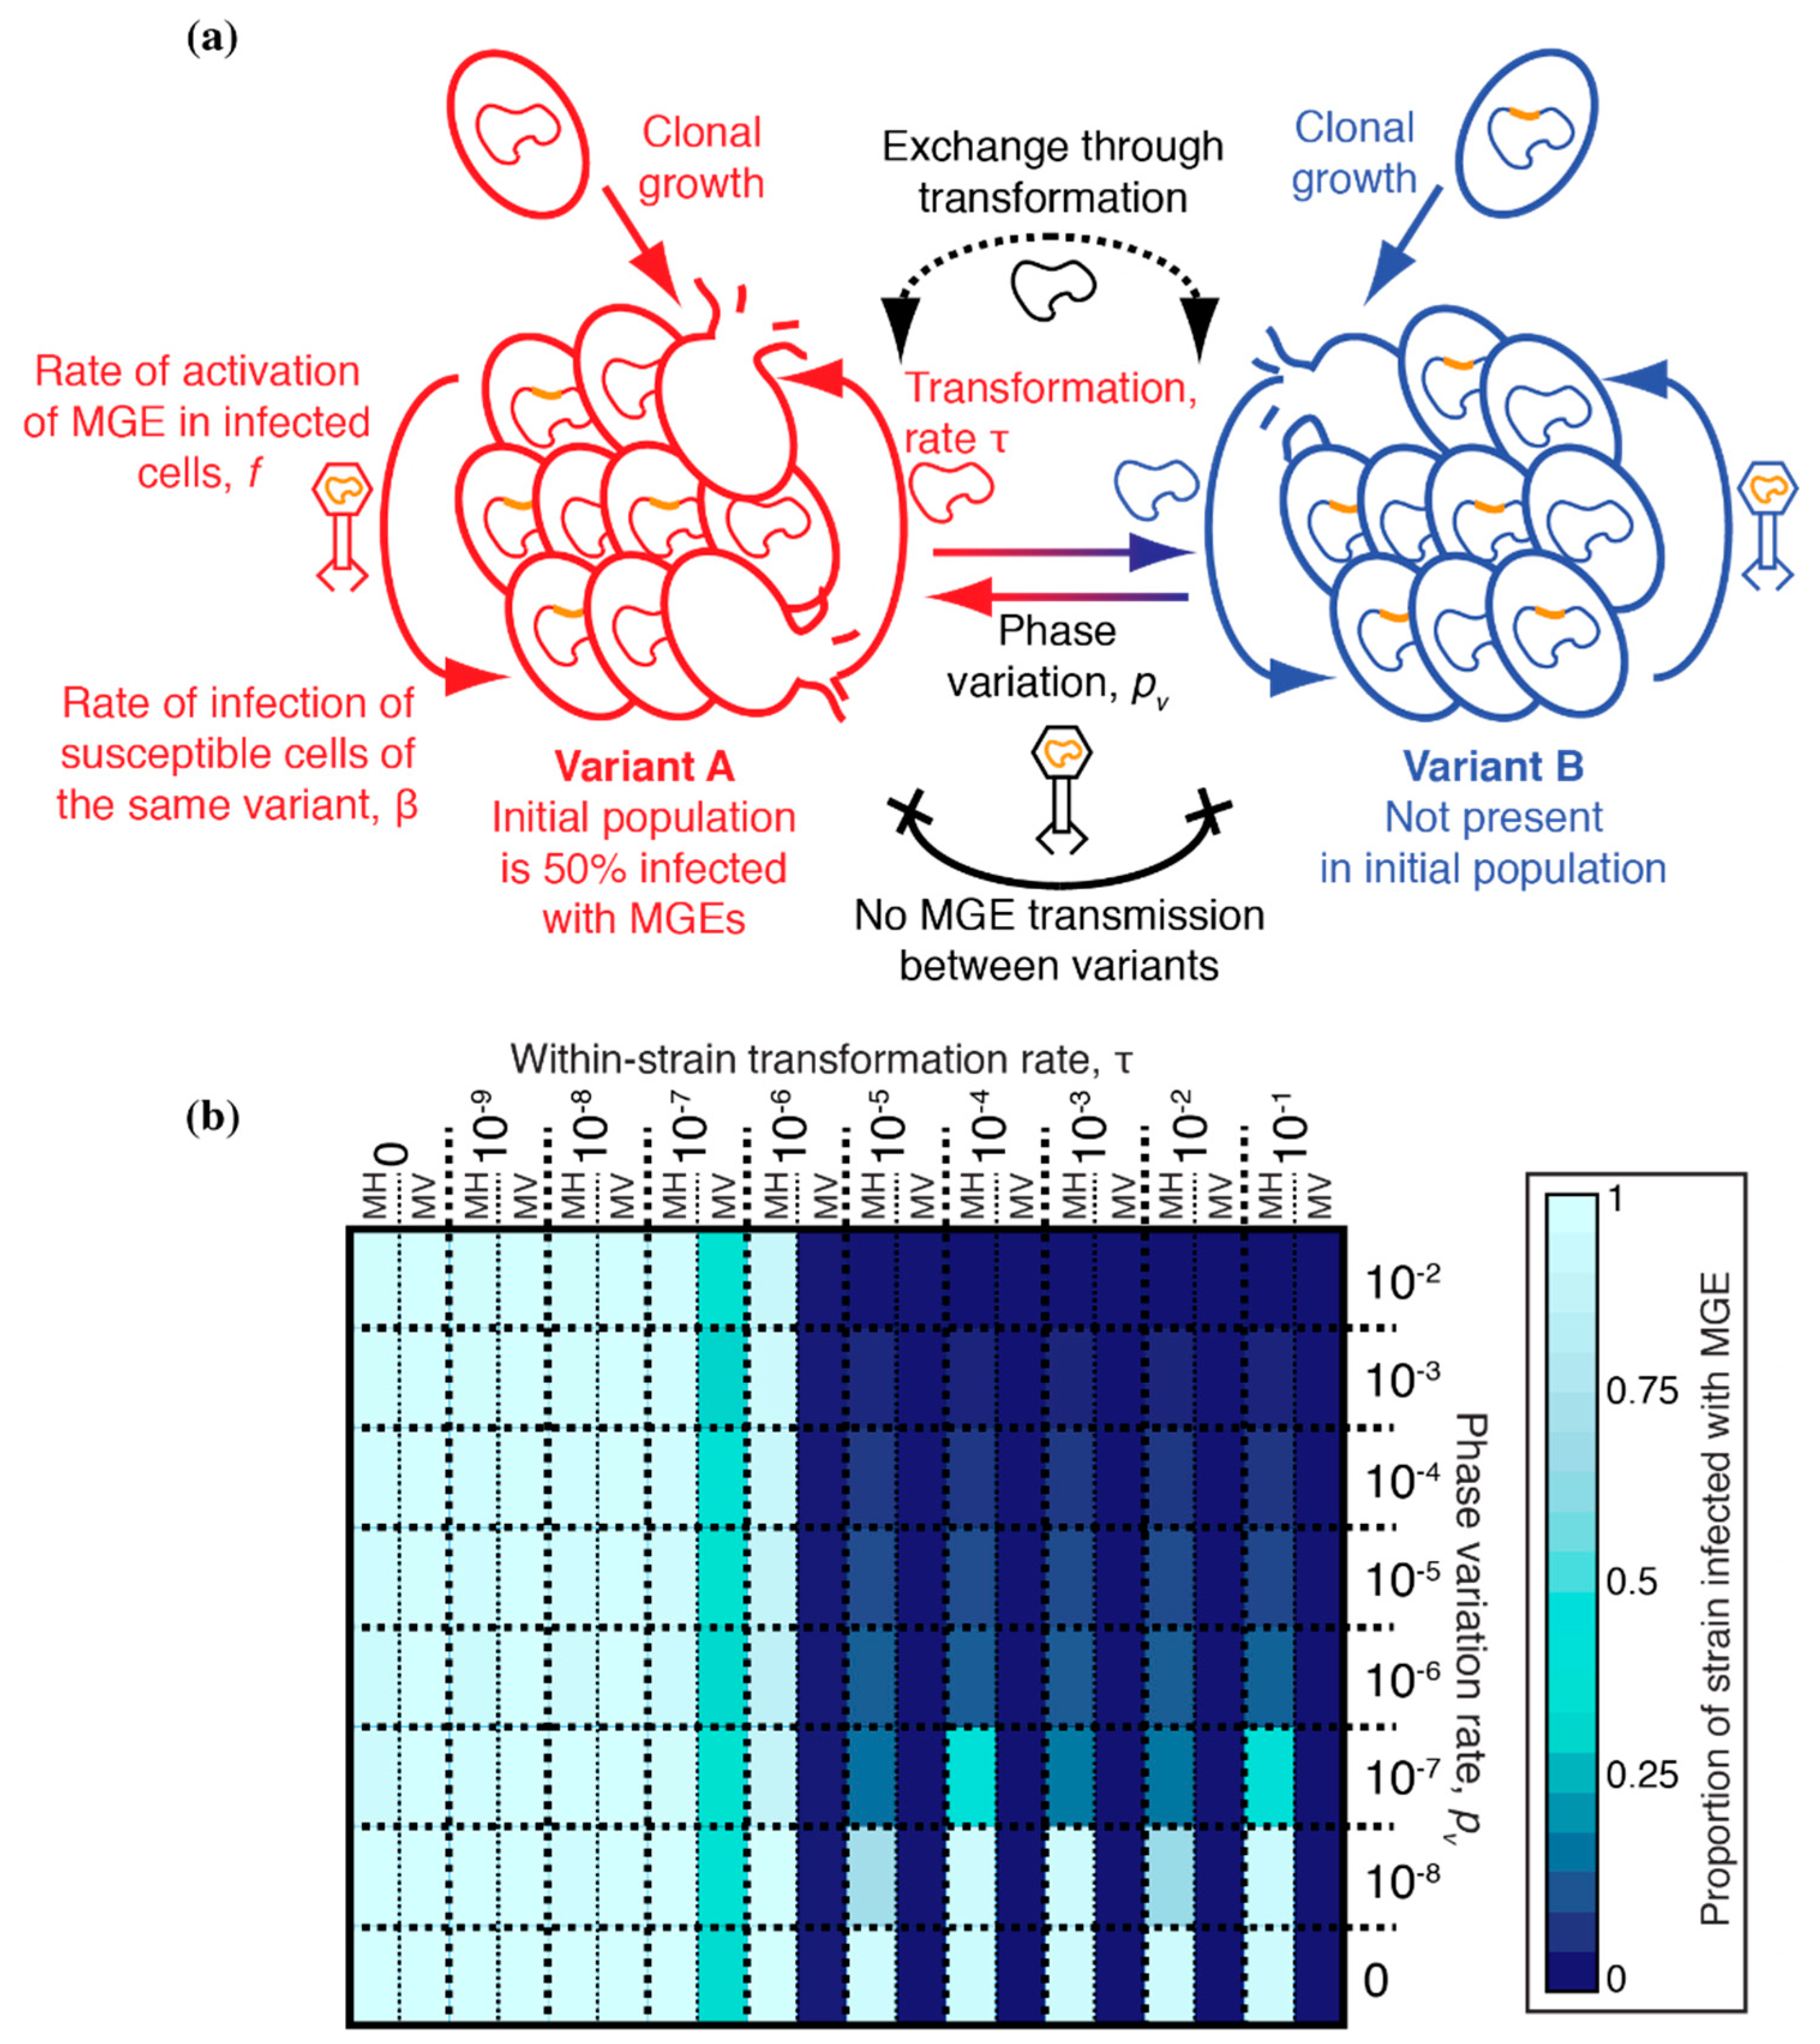
Table 1.
Parameters used in simulations. Parameters relating to mobile genetic elements (MGEs) are specified for the lysogenic phage-type MGE (ML), the integrative MGE with a greater propensity for horizontal transmission (MH), and the integrative MGE with a greater propensity for vertical transmission (MV). The unit t is a timestep in the simulation.
| Parameter Name | Parameter Description | Parameter Value |
|---|---|---|
| γ | Cell growth rate | 0.2 t−1 |
| κ | Environment carrying capacity | 106 or 104 |
| ω | Washout rate | 0.6 t−1 |
| τ | Transformation rate | 0 unless specified |
| φ | Transformation asymmetry | 10−3 |
| β | Rate of MGE horizontal transmission | 1.25 × 10⁻⁴ t−1 (ML); 10−6 t−1 (MH); 10−3 t−1 (MV), unless specified |
| b | Mean MGE burst size | 10 (ML); 10 (MH); 5 (MV) |
| f | Frequency of MGE activation | Always specified (ML); 5 × 10⁻² (MH); 5 × 10⁻³ (MV) |
| cM | Cost of carrying MGE | 0.5 (ML); 7.5 × 10⁻² (MH); 2.5 × 10⁻³ (MV) |
| a | Host cell death on MGE activation | Yes (ML); Yes (MH); No (MV) |
| mi | MGE invasion rate | 10−7 t−1 (ML); 5 × 10⁻⁷ t−1 (MV, MH) |
| pv | Phase variation rate | Always specified |
| i | Interstrain sequence exchange rate | Always specified |
© 2019 by the authors. Licensee MDPI, Basel, Switzerland. This article is an open access article distributed under the terms and conditions of the Creative Commons Attribution (CC BY) license (http://creativecommons.org/licenses/by/4.0/).
Share and Cite
MDPI and ACS Style
Kwun, M.J.; Oggioni, M.R.; Bentley, S.D.; Fraser, C.; Croucher, N.J. Synergistic Activity of Mobile Genetic Element Defences in Streptococcus pneumoniae. Genes 2019, 10, 707. https://doi.org/10.3390/genes10090707
AMA Style
Kwun MJ, Oggioni MR, Bentley SD, Fraser C, Croucher NJ. Synergistic Activity of Mobile Genetic Element Defences in Streptococcus pneumoniae. Genes. 2019; 10(9):707. https://doi.org/10.3390/genes10090707
Chicago/Turabian StyleKwun, Min Jung, Marco R. Oggioni, Stephen D. Bentley, Christophe Fraser, and Nicholas J. Croucher. 2019. "Synergistic Activity of Mobile Genetic Element Defences in Streptococcus pneumoniae" Genes 10, no. 9: 707. https://doi.org/10.3390/genes10090707
Note that from the first issue of 2016, this journal uses article numbers instead of page numbers. See further details here.