Service Quality Scales and Tourists with Special Needs: A Systematic Review

1
Kveloce I+D+i, Torres Quevedo Researcher, 46002 Valencia, Spain
2
Polibienestar Research Institute, University of Valencia, 46022 Valencia, Spain
*
Author to whom correspondence should be addressed.
Sustainability 2019, 11(14), 3844; https://doi.org/10.3390/su11143844
Submission received: 31 May 2019
/
Revised: 9 July 2019
/
Accepted: 10 July 2019
/
Published: 15 July 2019
(This article belongs to the Special Issue Service Quality in Leisure and Tourism)
Abstract
:This paper reviews the most commonly used scales for measuring service quality in sustainable tourism destinations to analyse if the requirements of tourists with special needs are considered. Results highlight that most of the recent research on service quality in tourism published in scientific journals is focused on a relative reduced number of validated scales. Variables related to tourists with special needs are often omitted or represent a reduced weight in the complete scale. Thus, this paper highlights the importance of including variables that collect the perceptions of service quality in this target group to better understand the individual perception of service quality and to move forward to sustainable tourism, considering the social dimension.
1. Introduction
According to the United Nations Environment Programme and the World Tourism Organisation (UNWTO), the sustainable tourism considers its present and future environmental, social and economic impacts, addressing the needs of tourists, business, environment, and destinations [1]. This definition includes three main pillars (economic, social and environmental) that should be balanced in order to achieve the needs of related stakeholders and to promote sustainable tourism.
In this framework, the definition and use of indicators is a key component to plan and manage sustainable tourism. With this aim, and with the United Nations Statistics Division, UNWTO is creating a transnational statistical framework for determining the role of tourism in the sustainable development, considering the economic, social and environmental dimensions mentioned. Concretely, the Statistical Framework for Measuring the Sustainability of Tourism (MST) has the objective of extending the economic statistical frameworks to social and environmental dimensions [2].
The social dimension is addressed to respect human rights and equal opportunities for all. Among the 12 goals of the Agenda for Sustainable Tourism launched in 2005, the visitor fulfilment goal was included to respond to the social dimension of sustainable tourism. This aims to provide a safe, satisfying and gratifying experience for tourists, accessible to all without discrimination by gender, race, or disability. The policies to address this aim are: improving access for all, providing holidays opportunities for economic and social vulnerable groups, guaranteeing visitors’ care, and monitoring and pursuing visitor satisfaction and the quality of experience [1]. In the same line, the MST identifies four aspects for the conceptual approach of the social dimension [3]:
- Inclusion: tourism as a tool for social inclusion, considering vulnerable groups.
- Capital: tourism as generator of social relationships to reinforce and create community.
- Equity: tourism to foster understanding of different cultures, justice, equity, etc.
- Individual and community well-being: tourism to increase quality of life.
Thus, the social dimension, an aspect that has been traditionally ignored, is now being considered in the latest developments of sustainable tourism. According to Darcy et al. [4], research about sustainable tourism has not focused on social dimensions related to ageing and disability. In fact, the social dimension that is now being defined by the MST includes this aspect (accessibility) and population groups (older people and people with disabilities).
The consideration of accessibility and above population groups is particularly relevant due to the social challenge that Europe is facing. The European population on January 1st, 2017 was estimated at 511.5 million and 19.4% were older people aged 65 or over (2.4% more than 10 years earlier) [5]. The population ageing is a long-term trend observable in the changes of the population age structure that will increase the percentage of older people to 28.7% by 2080 [6]. Moreover, 28% of the European population between 15 and 64 years old have a disability [7] and an increasing trend is foreseen in the next years [8]. This situation poses a social and economic challenge that requires solutions from public and private sustainable tourism service providers who should respond to their requirements if they want to maintain their position in the tourism market. Moreover, initiatives that consider accessibility and universal design have also an impact in other population groups such as pregnant women and people with temporary impairments [9]. In this line, Alén [10] identified some market benefits of promoting accessibility in the tourism destinations: business opportunities because the extension of goods and services for all, adaptation to changes in the demography and lifestyles, response to a growing market, tool to avoid seasonality, promotion of tourism for all and quality and competitive tourism.
Service quality mostly assesses the quality standards of different tourism-related services provided at destinations by public and private entities [11]. Several multidimensional scales have been implemented to score service quality to allow owners to objectively evaluate the quality of their tourism services, not considering the subjective perceptions. This fact can cause a loss of competitiveness in the tourism sector, mainly if the requirements and desires of the different tourist groups are not considered when measuring the tourism service quality. Moreover, this is considerably relevant due to the social challenge described above. In fact, the European Commission adopted a communication [12] focused on facing tourism challenges, among them, the demographic change in Europe. Thus, tourism entities should be aware of their competitive advantage and the aspects they should improve or maintain [13], as those addressed to respond to the older tourists and tourists with special needs. In fact, previous research has shown differences in tourism priorities by age groups that can be used by destinations to tailor their offer [14]. Older tourists are usually very loyal to high-quality tourism providers and, consequently, there is an increasing interest to study the perceived quality among them [15]. Indeed, previous research identified travel satisfaction, motivation, and service quality as predictors of older tourists’ intention to come back to the tourism destination [16,17]. Consequently, there is a growing body of literature that studies tourism and older tourists [18], among other topics, their participation [19], the effects [20], and the potential market segmentation [21]. The majority of the studies on service quality used SERVQUAL (Service Quality) and its adaptations as the main instrument to analyse service quality [22]. SERVQUAL is the most broadly used and accepted scale to measure tourism service quality and has been adapted to different components of the tourism supply chain, for example: HOTELQUAL (Service Quality in Accommodation) [23]; LOGQUAL (Service Quality in Lodging Services) [24,25]; DINESERV (service quality in restaurants) [26]; LODFSERV (service quality in Lodging Services) [27]; and ECOSERV (service quality in ecotourism) [28]. Some of previous scales had been used with older people, such as the SERVQUAL, where authors detected significant differences between older and younger participants in the perception of the five dimensions [29].
In this framework, and considering the challenge of the ageing population and people with disabilities, authors review the most widely used scales for measuring service quality in sustainable tourism destinations to analyse if the requirements of this growing market share are considered. According to [30], tourism generates 1 out of 10 jobs, represents the 10% of the world Gross Domestic Product and generates the 7% of world’s exports, among other relevant figures that show the important contribution of tourism to the world economy. In the same line, the tourism sector has an important role in EU economy with social and environmental implications [31]. Europa remains the main tourist destination and has half of the 10 top destinations [32]. Therefore, some authors suggested that the demographic change will impact in market variations [33]. Consequently, European tourism should consider the needs and requirements of older and disabled people to maintain their preference positions in world tourism, as previous authors have demonstrated differences between the satisfaction of older and young groups in service delivery [34].
This paper analyses variables such as accessibility and universal design together with variables that respond to the travel profiles and motivations of tourists with special needs. The results of the review allow to identify the gaps and deficits of the current and most commonly used quality assessment scales in sustainable tourism destinations, analysing if they include dimensions to consider the specific needs of tourists with special needs (particularly, older and disabled tourists).
Thus, this paper tries to respond to the research questions listed below:
- To what extent are the specific perceptions of tourists with special needs considered in validated instruments used in the recent scientific literature to quantify service quality?
- To what extent are the perceptions of tourists with special needs analysed in recent scientific literature measuring tourism service quality?
- How the new scales proposed by the scientific literature to quantify service quality are considering the needs of older and disabled tourists?
2. Materials and Methods
An increasing body of literature has focused on measuring tourism service quality. The aim of this paper is to systematically review scientific papers, following PRISMA (a minimum compilation of evidence-based items for systematic review), using service quality scales to detect the most frequently used scales in tourism to analyse if they consider the social dimension of tourism sustainability in relation to tourists with special needs. For that, a systematic desk research has been carried out in ScienceDirect and EBSCOHost, the main academic and most complete databases for tourism and hospitality [35,36]. The search criteria in both databases were:
- Research articles (both empirical and theoretical).
- Key words “tourism” and “service quality” in the title, abstract or keywords.
- Published since 2015, when the European Commission tabled the Accessibility Act.
- Written in English.
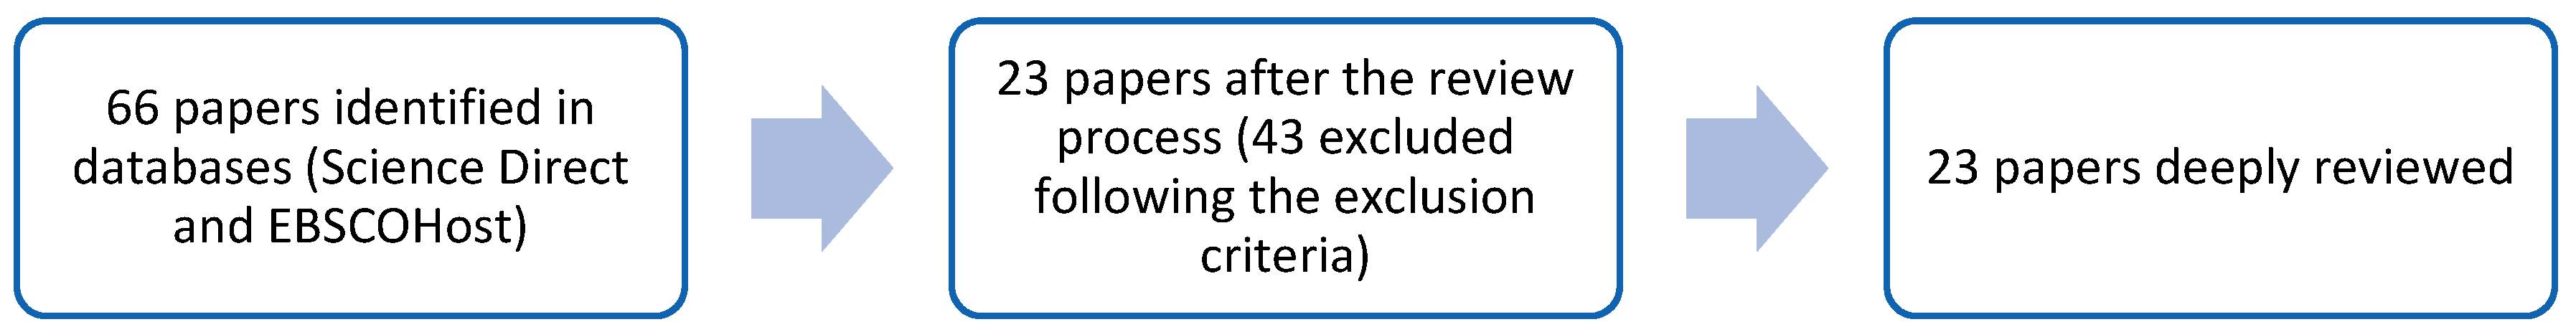
A total of 66 papers were extracted with the above criteria: 43 papers from ScienceDirect and 23 from EBSCOHost. These papers were reviewed to guarantee the alignment with the topic of tourism field and service quality. Thus, authors checked within the abstract, key words and the methodology section, if these papers had used or adapted an instrument to quantify the service quality in tourism or along the tourism sector chain. Those dealing with medical tourism and experience quality were excluded as did not respond to the aim of the analysis. Qualitative research and case studies were also excluded as the authors’ objective is to review the quantitative scales most commonly used in tourism to measure the service quality. Finally, 23 papers were deeply analysed to extract the scales and instruments used to evaluate the service quality in tourism. The scales were systematically analysed, extracting dimensions and items, and checking if the variables consider the social dimension.
3. Results
From the 66 papers collected in the scientific datasets, authors developed a systematic review of those papers resulting in an analysis of the scales used by the 23 papers selected following the criteria described above to identify if they consider the social dimension related to tourists with special needs when assessing service quality (Figure 1).
Out of the 23 papers analysed, nine used self-designed questionnaires, and the others used validated scales or adaptations. The validated scales or adaptations used by the 14 detected papers are listed below:
- Fleisher et al. [39] measurement is rooted in SERVQUAL instrument to adapt it to rural accommodations.
- The TNM-QUAL (Tourism Night Market service quality) scale proposed by Chuang and colleagues [40] measures the service quality of tourism night markets.
- The SEQSS (event quality for spectator sports) was suggested by Ko et al. [41] to evaluate event quality from the users’ perspective.
- The SERVPERF (performance-based measure of service quality) scale was proposed to assess the quality of a service as a form of consumer attitude [42].
- Later, Cronin et al. [43] proposed a questionnaire to clarify the relations between satisfaction, value, quality, and behavioural purposes suggesting that the customer decisions are best modelled as a complicated system considering the effects on behavioural intentions (indirect and direct).
- Airport Service Quality (ASQ) was proposed by Bezerra and Gomes [44] as a multi-item instrument for evaluating passenger service quality perception in airports.
- Hutchinson et al. [45] proposed a combined model to simultaneously analyse the relations of service quality and value, equity and satisfaction.
These scales have been thoroughly analysed in terms of dimensions and items to assess if they consider the social dimension related to particular needs of tourists with special needs such as older and disabled tourists. That is, if they assess the accessibility of the tourism facility or service, if they consider the special needs of tourists, if they offer adapted activities for people with special needs, etc.
SERVQUAL considers two sets of 22 items to measure the customers’ expectations and perception about the service quality along five dimensions, namely responsiveness, assurance, tangibles, reliability, and empathy [37,38]. The tangible dimension is about physically visible aspects, but not reference to accessibility is made. The last dimension, empathy, refers the ease of relationships, good communication, personal attention, and understand the need of customers. It can be understood that it makes a reference to accessibility as it considers the following five items:
- “The employees are expected to give customers individual attention”
- “The employees are expected to give customers personal attention”
- “It is expected that the employees know what the needs of their customers are”
- “It is expected that the employees have their customers’ best interests at heart”
- “The employees are expected to have operating hours convenient to all their customers”
Each item is scored with a Likert scale of seven points starting from “strongly disagree” to “strongly agree” So, SERVQUAL allows assessing the quality of a determinate firm for each of the above five dimensions taking the average of the sum of items constituting the dimension. Moreover, SERVQUAL also provides a global score for service quality with the average sum across all five dimensions.
The SERVPERF model is composed by the same five dimensions of SERVQUAL (assurance, tangibles, reliability, responsiveness, and empathy) eliminating the expectations items of customers. So, it only measures the perception about the service quality with equivalent items of SERVQUAL. Consequently, the social dimension is measured with the same items detailed above.
Fleisher et al. [39]’s measurement is rooted in SERVQUAL to adapt it to rural accommodations, and adds four more items: “(i) Programs for adults; (ii) The cleanliness of food; (iii) The variety of excellent choices; (iv) Various opportunities in the village’s news and events”. Although the first item is interesting for this paper, no description is provided. Consequently, only the items detected for the SERVQUAL measures the social dimension of service quality. The importance and performance are evaluated with a Likert scale of 5-points, from “very low importance/performance” to “very high importance/performance”. In the same line, Hutchinson et al. [45] measured the service quality using five features of service quality, which were revised from Hellier et al. [50] and are in line with the five dimensions of SERVQUAL. The five aspects are related to employees and do not consider the accessibility of services provided and customers’ needs. Also, Meizhen and Quian [51] used 10 items from SERVQUAL to measure the service quality of frontline employees’ and added one item about the employees’ overall service quality. No reference to accessibility or tourists with special needs is made.
Mohd et al. [52] developed a descriptive cross-sectional survey to analyse the association between satisfaction, service quality, and behavioural purpose. They used the same dimensions of SERVQUAL but with a Likert scale of five points. Although the items are not detailed in the paper, the attributes made a reference to visitors needs not described in SERVQUAL “Prioritise the visitors’ needs” (in the responsiveness dimension). In addition, in the same line of SERVQUAL, the last dimension about empathy suggests measures about dedicated attention to tourists with special needs:
- Understand visitors’ needs
- Individualized attention
- Treating guests in a friendly manner
- Specific attention to visitors’ special needs
- Providing assistance in other required areas
Based on previous studies that used SERVQUAL scale, the HISTOQUAL scale and other studies, Yaohu and Weichen [53] detected twelve dimensions of service quality to measure 32 complaint sections. Among them, the assurance dimension (based on SERVQUAL) measured the ability to physical involve all the guests at the museum; and the empathy dimension (also based on SERVQUAL) measured the individualised attention the museum providers have for its visitors.
The TNM-QUAL is a 22-item survey composed of six dimensions: diversity, courtesy, uniqueness, delicious food, affordable consumption, and comprehensiveness [40]. In relation to the scope of the paper, authors analysed the items inside the dimension of diversity and comprehensiveness. The items inside the first dimension are focused on the possibility to choose foods and products. The items composing the second dimension are related to bathroom cleanliness, availability of parking spaces and trash cans. Consequently, no reference to accessibility or universal design is made.
The SEQSS is composed by 40 items representing 12 dimensions: sociability, ambience, operating time, entertainment, information, concessions, employee interaction, skill performance, fan interaction, valence, design and signage. In the information dimension, how easy it is to obtain information and its availability in Internet is included, but not the accessibility criteria and how the information is presented to be understood by different target groups. Nevertheless, there are some dimensions with items related to accessibility:
In the employee interaction section, there is an item that considers the special needs of spectators, namely “Employees in the event deal effectively with the special needs of each customer”.
In the design dimension section, two items consider the freedom of movement, i.e., “I can move freely in this facility” and “It is easy to get in and out of the facility”.
In the signage dimension section, we can also detect an item related with accessibility: “Scoreboard is easy to read”.
The SEQSS uses a Likert scale of seven points to measure the items performance from “strongly disagree” to “strongly agree”.
The Cronin et al. [43] instrument measures the service quality performance with 10 items and the overall service quality with three items. All of them with a nine-point scale scaling rom “very low” to “very high”. Among them, only one item in the service quality performance dimensions refers to accessibility: “Generally, the employees make the effort to understand my needs”.
The ASQ reflects six dimensions related to the main aspects of passenger–airport interaction: (i), security (ii), convenience (iii) check-in, (iv) mobility, (v) basic facilities, (vii) ambience [44]. The dimension of mobility considers the following three items: walking distance inside the terminal, wayfinding, and flight information. So, it tries to measure if the airport has the needed mobility solutions to reduce the passengers’ time and ambiguity when they are inside the terminal. However, the item is very broad to respond to the accessibility needs of tourists with special needs.
The adapted version of Burns et al. [47] questionnaire made by Chieh [46] has four dimensions with a total of 21 items: facility, service, information and management. Among them, the first dimension considers items related with accessibility:
- I have access to the place(s) I like to visit
- Facilities are accessible to all visitors
- Facilities are convenient
- Facilities are well maintained
Also, the dimension about information has the following item relevant for tourists with special needs: “Accurate and current information about the area is available”. A Likert scale of five points is used to score all items.
The Ka and Hitchcock [48] adaptation of Ramsaran-Fowdar’s [49] questionnaire resulted in a 62-item questionnaire measured on customers’ expectations with a Likert scale of seven points, from 1 as ‘strongly unimportant’ to 7 as ‘strongly important’. Among them, the following can be related with tourists with special needs:
- Giving special attention to the customer
- Understanding the customers’ requirements
- Listening carefully to complaints
- Problem-solving abilities of staff
- Hotel to have customers’ best interests at heart”
In addition to previous scales, there are nine articles that propose their own self-designed questionnaire. The items they use are identified below:
Bekir et al. [54] proposed a questionnaire to measure destination services quality based on Kozak [55], Tosun, Temizkan, Timothy and Fyall [56], and Moutinho et al. [57]. Concretely, in the evaluation of the service quality in the destination, they used 33 statements with a five-point Likert scale to measure: accommodation services (six statements), activities (six statements), cleanliness (five items), hospitality (five items), local transportation (four items), airport services (four items), and language communication (four statements). Among them, there are two items that can be related with accessibility and tourists with special needs:
- Availability of health services (in the activities dimension)
- Network (accessibility) of local transport services (in local transport dimension)
Later, Bekir [58] used a Likert scale of seven points with 28 items to quantify service quality in a questionnaire with more items to assess other dimensions such as image. Service quality was measured for the destination considering: accommodation, transport, cleanliness, hospitality, activities, amenities, language and security. However, no description about the items is provided, so no results about this study can be provided. In the same line, Yadegaridehkordi et al. [59] measured service quality with three items based on previous authors, but no detailed information is provided about the concrete items used; so no results can be outlined from this paper.
Tahir [60] tried to recognise the attributes of the service quality for a daily tour service and to assess the irregular impact of each characteristic on the satisfaction of tourists. For that, he established a 22-item scale to assess the daily tour service quality based on previous studies. He found out that the service quality attributes that contributed positively to the global satisfaction of tourists are composed by 6 dimensions: stopover facility, tour guide, food and beverage facility, transportation, shopping facility, museums and sites. These items were measured using a Likert scale of seven points. None of the items that compose these variables are related to accessibility or special needs.
Based on previous research, Mahdi et al. [61] designed a questionnaire with specific features of scientific conventions addressed to sports. The questionnaire included various variables to score the service quality in those events, such as: venue access quality, access quality, accommodation quality and intent to return. All 45 items were measured using a Likert scale of five points. Mahdi and colleagues [61] considered some items that can be related to accessibility and special needs although not detailed reference to this target group is made:
- Quality of Access:
- ○
- Travelling around the city was easy
- ○
- I had no problems with going to different parts of the city
- Access to destination:
- ○
- I had no problem in reaching the city in which the convention was held.
- ○
- Finding the ways and routes in order to reach the city in which the convention is held was easy.
- Access to convention venue:
- ○
- Access to the convention hall was easy for me.
- ○
- The convention hall was in a proper and easy to access place.
- ○
- Getting to the convention venue and entering it was a comfortable and easy process.
- Quality of interior environment of the convention hall
- ○
- Convention hall had some special features.
Silvestri et al. [62] included questions about service quality in their research to collect the quality perception around eight aspects: (i) thermal facilities, (ii) lounge bar, (iii) thermal pool, (iv) lounge bar employees, (v) thermal pool employees, (vi) reactivity, (vii) thermal employees, and (viii) image. For all of them, they identified three components: company image, technical quality, and functional service quality. In the technical quality, an item measures the reachability of the thermal facilities, another the adequacy of the thermal pool, and other one the accessibility of lounge bar. A Likert scale of 6 points was used to measure the 46 items.
Shenwei and Tkaczynski [63] used 27 items to quantify service quality expectations developed from a literature review. In the same line of previous studies on airline service quality, each item was measured using a Likert scale of seven points, but no reference to accessibility or special needs is made.
Pinkus et al. [64] measured the overall service quality using three items with a seven-point Likert scale. None of them related with accessibility or social needs.
Finally, Sakul [65] used a Likert five-point questionnaire to measure young tourists’ quality perception during their visit to Thailand. In his paper, five variables are used to measure tourist’s perception of quality, all related with employees and with no reference to accessibility or tourists’ special needs.
4. Discussion and Conclusions
Authors developed a systematic literature review to analyse if recent scientific publications on service quality measures used in tourism are considering the needs and requirements of tourists with special needs. In this systematic review, authors consulted ScienceDirect and EBSCOHost datasets that are identified as the main academic and most complete databases for tourism and hospitality [35,36]. From a total of 66 papers obtained in those databases, only 23 were addressed to tourism and used quantitative scales to measure service quality. From those, 14 used previous validated scales and the rest developed new scales. In this sense, it is important to highlight that SERVQUAL, the scale most frequently used for service quality assessment, was used or adapted by six papers. Other known scales are also used as such SERVPERF and SEQSS, but other validated scales such as HOTELQUAL [23], ECOSERV [28] or DINESERV [26] have not been used in the studies screened. Consequently, most of the recent research on service quality in tourism published in scientific journals is focused on a relative reduced number of validated scales, although there are validated scales that have not received attention by the scientific community. Therefore, more attention and scientific analyses is needed towards recent scientific literature with validated scales of service quality in tourism.
On the one hand, from the 14 papers analysed that used previous validated scales, 10 papers included some aspect that can be linked with tourists with special needs. For example, those using or based in SERVQUAL analysed five items that can be related with personal or individual attention. Other aspects considered are: the employee interaction with particular attention to the special needs of each customer [43,48,66]; mobility [66]; easy information [47,66]; accessibility of facilities [47]. However, those items do not represent more than 24% of the total number of items in each scale.
On the other hand, a total of nine papers proposed their own scales to measure the service quality. Thus, recent literature has provided new scales that need to be validated by future research. Only 5 of these scales included items related to tourists with special needs. These scales measured the availability of health services [54], accessibility of local transport services [54] and quality of access [61,62]. In this case, these items represent no more than 18% of all items considered in the proposed scale.
All the scales analysed used Likert scales to measure the items for assessing the service quality. Consequently, service quality in tourism is measured by all of them using a quantitative methodology.
As a result of the systematic review, this paper highlights the omission or low representation of variables related to tourists with special needs in the evaluation of tourism service quality in recent scientific literature. It is important to take into account this social dimension in order to guarantee that the tourism sector respects human rights and equal opportunities for all in society. Indeed, among the twelve goals of the Agenda for Sustainable Tourism launched in 2005, some aims to respond to the social dimension of sustainable tourism were included, among them improving access for all [1]. Thus, as identified by Oliver [3] the conceptual approach of the social dimension comprises inclusion, community creation, equity and individual and community well-being. In relation to this last aspect, a growing body of literature is being addressed to determinate the links between tourism and well-being [67]. Hence, in different contexts, the relationship between enjoying holidays and variables related to health, quality of life, stress reduction, healthy and active lifestyles have been evidenced. In the context of this paper, some authors identified as one of the most relevant aspects of older people life their leisure time enjoying tourism that impacts their well-being at the mental, social and physical levels [68,69]. Therefore, it is vital to include items that assess the quality of tourism service related to the perception of tourists with special needs to better appreciate the subjective perception of service quality of those tourists and move forward towards sustainable tourism from a complete approach (social, economic and environmental). Accordingly, further research should propose and validate items that measure the individual perception of tourists with special needs to be incorporated in the service quality scales and, consequently, respond to the requirements and needs of this rising market niche. Indeed, authors will continue working in this line to propose a new scale or a dimension of accessibility to be integrated in existing scales.
In relation to the limitations in the individual studies analysed, authors checked the limitations highlighted by the corresponding authors. These authors included as limitations the geographical coverage of the study limited to an area [53,60,62,66,70]; the specificity of the tourism facility (such as: thermal [62], sport event tourism [66] museums [53]) or service [60]; the sample size [66] and source [53]; the lack of qualitative data considered [59,71] and the restriction of the analyses made or techniques used [59,71]. Moreover, they also stressed the affective component of the variables studied [62], value perceptions [54] and subjective well-being [70] that emphasise the outcomes of this study towards research that propose and validate items to assess the individual perception of service quality, in particular, for tourists with special needs.
In relation to the bias across studies, authors only analysed papers written in English as it was a selection criterion of the study. Another limitation, as detailed above, is related to studies that are addressed to a particular link of the tourism supply chain, so not applicable to other tourism resources. Nevertheless, this limitation does not alter the results of the study as it is addressed to highlight the consideration of the perception of service quality for tourists with special needs in any tourism facility. Finally, authors are aware of the reduced number of papers screened with the inclusion criteria, but these papers are those who respond to the paper’s objective: to identify gaps of the current and most used quality assessment scales in the main datasets in tourism and written in English. In fact, these papers allow authors to contribute evidence to the existing gaps on the social dimension in service quality scales and to respond to the research questions stated at the beginning of this paper.
Author Contributions
All authors contributed significantly to the writing of the paper. J.G.F., M.F.S., carried the desk research to develop the introduction, results and conclusions of the paper; E.D.F., defined the methodology and analysed the results outcomes; J.G.F., contributed to the discussion and conclusions.
Funding
The corresponding author is a Torres Quevedo Researcher developing a post-doctoral fellowship in Kveloce I+D+I funded by the Spanish Ministry of Science, Innovation and Universities.
Conflicts of Interest
No conflicts of interest is declared by authors.
References
- UNWTO and UNEP. Making Tourism More Sustainable—A Guide for Policy Makers; UNWTO: Madrid, Spain, 2005. [Google Scholar]
- UNWTO. Measuring Sustainable Tourism; UNWTO: Madrid, Spain, 2017. [Google Scholar]
- Oliver, R.; Working Group of Experts on Measuring the Sustainability of Tourism. Measuring the social sustainability of tourism (draft Chapter 4). In Proceedings of the Second Meeting—UNWTO, Madrid, Spain, 24–25 October 2018. [Google Scholar]
- Darcy, S.; Cameron, B.; Pegg, S. Accessible tourism and sustainability: A discussion and case study. J. Sustain. Tour. 2010, 18, 515–537. [Google Scholar] [CrossRef]
- Eurostat. Population Structure and Ageing. Statistics Explained. 2019. Available online: https://ec.europa.eu/eurostat/statistics-explained/index.php/Population_structure_and_ageing (accessed on 20 February 2019).
- European Commission. The 2015 Ageing Report. Economic and Budgetary Projections for the 28EU Member States (2013–2060); European Commission: Brussels, Belgium, 2015. [Google Scholar]
- EUROSTAT. Disability Statistics—Health. Statistics Explained. 2018. Available online: https://ec.europa.eu/eurostat/statistics-explained/index.php/Disability_statistics (accessed on 20 February 2019).
- World Health Organisation. World Report on Disability; WHO: Geneva, Switzerland, 2011; ISBN 978 92 4 068823 0. [Google Scholar]
- Ferri, M. Sustainability of the Social Tourism Policy: The Self-Assessment model of Accessible Social Tourism. In Sustainability and transformation in European Social Policy; Ferrer, J.G., Paya, I.M., Eds.; Peter Lang AG: Oxford, UK, 2013; Chapter 12; pp. 253–272. ISBN 978-3-0343-0901-1. [Google Scholar]
- Alén, E.; Domínguez, T.; Losada, N. New Oportunities for the Tourism Market: Senior Tourism and Accessible Tourism; University of Vigo: Pontevedra, Spain, 2012. [Google Scholar]
- Chen, L.; Huang, S.C.; Fang, W.T. A self-evaluation system of quality planning for tourist attractions in Taiwan: An integrated AHP-Delphi Approach from Career Professionals. Sustainability 2017, 9, 1751. [Google Scholar] [CrossRef]
- European Commission. Communication from the Commission “A renewed EU Tourism Policy: Towards a Stronger Partnership for European Tourism”; European Commission: Brussels, Belgium, 2006. [Google Scholar]
- Aurel, M.; Simina, A.; Titu, S. Measuring Service Quality in Tourism Industry. Procedia Soc. Behav. Sci. 2016, 221, 294–301. [Google Scholar] [Green Version]
- Ryglova, K.; Vajcnorava, I.; Sacha, J.; Stojarova, S. The quality as a competitive factor of the Destiation. Procedia Econ. Finance 2015, 34, 550–556. [Google Scholar] [CrossRef]
- Lindqvist, L.J.; Börk, P. Perceived Safety as an important quality dimension among senior tourists. Tour. Econ. 2000, 6, 151–158. [Google Scholar] [CrossRef]
- Um, S.; Chon, K.; Ro, Y. Antecedents of revisit intention. Ann. Tour. Res. 2006, 33, 1141–1158. [Google Scholar] [CrossRef]
- Yoon, Y.; Uysal, M. An examination of the effects of motivation and satisfaction on destination loyalty: A structural model. Tour. Manag. 2005, 26, 45–56. [Google Scholar] [CrossRef]
- Glover, P.; Prideaux, B. Implications of Population Aging for the Development of Tourism Products and destinations. J. Vacat. Mark. 2009, 15, 25–37. [Google Scholar] [CrossRef]
- Fleischer, A.; Pizam, A. Tourism Constraints among Israelí Seniors. Ann. Tour. Res. 2002, 1, 106–123. [Google Scholar] [CrossRef]
- Wei, S.; Milman, A. The Impact of Participation in Activities While on Vacation on Seniors’ Psychological Well-Being: A Path Model Application. J. Hosp. Tour. Res. 2002, 26, 175–185. [Google Scholar] [CrossRef]
- Schröder, A.; Widmann, T. Demographic Change and its Impact on the Travel Industry: Oldies-Nothing but Goldies? In Trends and Issues in Global Tourism; Conrady, R., Buck, M., Eds.; Springer: Berlin/Heidelberg, Germany, 2007; pp. 3–17. [Google Scholar]
- Ladhari, R. A review of twenty years of SERVQUAL research. Int. J. Qual. Serv. Sci. 2009, 2, 172–198. [Google Scholar] [CrossRef]
- Falces, C.; Sierra, B.; Becerra, A.B.P. HOTELQUAL: Una escala para medir calidad percibida en servicios de alojamiento. Estud. Turísticos 1999, 139, 95–110. [Google Scholar]
- Getty, J.M.; Thompson, K.N. A procedure for scaling perceptions of lodging quality. Hosp. Res. J. 1994, 18, 75. [Google Scholar] [CrossRef]
- Patton, M.; Stevens, P.; Knutson, B.J. Internationalizing LODGSERV as a measurement tool: A pilot study. J. Hosp. Leis. Mark. 1994, 2, 39–55. [Google Scholar] [CrossRef]
- Stevens, P.; Knutson, B.; Patton, M. DINESERV: A tool for measuring service quality in restaurants. Cornell Hotel Restaur. Adm. Q. 1995, 36, 556–560. [Google Scholar] [CrossRef]
- Knutson, B.; Stevens, P.; Wullaert, C.; Patton, M.; Yokoyama, F. LODGSERV: A service quality index for the lodging industry. J. Hosp. Tour. Res. 1990, 14, 277–284. [Google Scholar] [CrossRef]
- Khan, M. ECOSERV: Ecotourists’ quality expectations. Ann. Tour. Res. 2003, 30, 109–124. [Google Scholar] [CrossRef]
- Jeonglyeol, T.; Cho, H.; Ahn, T.H. Senior Citizen Satisfaction with Restaurant Service Quality. J. Hosp. Mark. Manag. 2012, 21, 215–226. [Google Scholar] [CrossRef]
- UNWTO. Tourism Highlights: 2018 Edition; UNWTO: Madrid, Spain, 2018; ISBN 978-92-844-1986-9. [Google Scholar]
- Eurostat Tourism Statistics—Tourism Destinations Data Statistics Explained. 2019. Available online: https://ec.europa.eu/eurostat/statistics-explained/index.php?title=Tourism_statistics (accessed on 5 July 2019).
- Eurostat. Tourism Introduced. Statistics Explained. 2019. Available online: https://ec.europa.eu/eurostat/statistics-explained/index.php?title=Tourism_introduced#cite_note-1 (accessed on 5 July 2019).
- Nedelea, A.; State, M. The demographic ageing and consumer market. In Ştiinţe Economice, Tom. XVII, Volumul IV—Management and Marketing; Universitatea din Oradea: Oradea, Romania, 2008; pp. 1010–1014. [Google Scholar]
- Anselmsson, J. Sources of customer satisfaction with shopping malls: A comparative study of different customer segments. International Review of Retail. Distrib. Consum. Res. 2006, 16, 115–138. [Google Scholar] [CrossRef]
- Buhalis, D.; Law, R. Progress in information technology and tourism management: 20 years on and 10 years after the Internet—The state of eTourism research. Tour. Manag. 2008, 29, 609–623. [Google Scholar] [CrossRef]
- Hung, K.; Law, R. An overview of Internet-based surveys in hospitality and tourism journals. Tour. Manag. 2011, 32, 717–724. [Google Scholar] [CrossRef]
- Parasuraman, A.; Zeithaml, V.A.; Berry, L.L. SERVQUAL: A multiple-item scale for measuring consumer perception of service quality. J. Retail. 1988, 64, 12–40. [Google Scholar]
- Berry, L.; Zeithaml, V.; Parasuraman, A. Five imperatives for improving service quality. Sloan Manag. Rev. 1990, 31, 29–38. [Google Scholar]
- Fleischer, A.; Rotem, A.; Banin, T. New Directions in Recreation and Tourism Activities in the Rural Sector in Israel: Demand and Supply Factors; Research Report; Development Study Center: Rehovot, Israel, 1993. [Google Scholar]
- Chuang, Y.F.; Hwang, S.N.; Wong, J.Y.; Ho, C.H.; Chang, W.H. TNM-QUAL: A service quality measure-item scale for assessing tourist night market. In Proceedings of the 7th WSEAS International Conference on Economy and Management Transformation, Nanjing, China, 17–19 November 2013; pp. 155–160. [Google Scholar]
- Ko, Y.J.; Zhang, J.; Cattani, K.; Pastore, D. Assessment of event quality in major spectator sports. Manag. Serv. Qual. 2011, 21, 304–322. [Google Scholar]
- Cronin, J.; Taylor, S.A. Measuring service quality: A re-examination and extension. J. Mark. 1992, 56, 55–68. [Google Scholar] [CrossRef]
- Cronin, J.J.; Brady, M.K.; Hult, G.T.M. Assessing the effects of quality, value and customer satisfaction on consumer behavioural intentions in service environments. J. Retail 2000, 76, 193–218. [Google Scholar] [CrossRef]
- Bezerra, G.; Gomes, C. Measuring airport service quality: A multidimensional approach. J. Air Transp. Manag. 2016, 53, 85–93. [Google Scholar] [CrossRef]
- Hutchinson, J.; Lai, F.; Wang, Y. Understanding the relationships of quality, value, equity, satisfaction, and behavioral intentions among golf travelers. Tour. Manag. 2009, 30, 298–308. [Google Scholar] [CrossRef]
- Chieh, L. Outdoor recreation in a Taiwanese national park: A Hakka ethnic group study. J. Outdoor Recreat. Tour. 2018, 22, 37–45. [Google Scholar]
- Burns, R.; Graefe, A.; Absher, J. Alternate measurement approaches to recreational customer satisfaction: Performance-only and importance-performance gap scores. Leis. Sci. 2003, 25, 363–380. [Google Scholar] [CrossRef]
- Ka, I.; Hitchcock, M. A comparison of service quality attributes for stand-alone and resort-based luxury hotels in Macau: 3-dimensional importance performance analysis. Tour. Manag. 2016, 55, 139–159. [Google Scholar]
- Ramsaran-Fowdar, R.R. Developing a service quality questionnaire for the hotel industry in Mauritius. J. Vacat. Mark. 12007, 3, 19–27. [Google Scholar] [CrossRef]
- Hellier, P.K.; Geursen, G.M.; Carr, R.A.; Richard, J.A. Customer repurchase intention: A general structural equation model. Eur. J. Mark. 2003, 37, 1762–1800. [Google Scholar] [CrossRef]
- Meizhen, L.; Qian, L. Is role stress always harmful? Differentiating role overload and the role ambiguity in the challenge-hindrance stressors framework. Tour. Manag. 2018, 68, 355–366. [Google Scholar]
- Mohd, I.; Mohd, H.; Norliza, A.; Norazah, M. Community-based homestay Service quality, visitor satisfaction, and behavioral intention. Procedia Soc. Behav. Sci. 2016, 222, 398–405. [Google Scholar]
- Su, Y.; Teng, W. Contemplating museums’ service failure: Extracting the service quality dimensions of museums from negative on-line reviews. Tour. Manag. 2018, 69, 214–222. [Google Scholar] [CrossRef]
- Bekir, B.; Dedeoğlu, S.; Balikçioğlu, D.; Kemal, G. The moderating role of nationality on destination experience. J. Qual. Assur. Hosp. Tour. 2018, 19, 217–242. [Google Scholar] [CrossRef]
- Kozak, M.; Bigne, E.; Gonzalez, A.; Andreu, L. Cross-cultural behavior research in tourism: A case study on destination image. Tour. Anal. 2004, 8, 253–257. [Google Scholar] [CrossRef]
- Tosun, C.; Temizkan, S.P.; Timothy, D.J.; Fyall, A. Tourist shopping experiences and satisfaction. Int. J. Tour. Res. 2007, 9, 87–102. [Google Scholar] [CrossRef]
- Moutinho, L.; Albayrak, T.; Caber, M. How far does overall service quality of a destination affect customers’ post-purchase behaviours? Int. J. Tour. Res. 2012, 14, 307–322. [Google Scholar] [CrossRef]
- Bekir, B. Shaping tourists’ destination quality perception and loyalty through destination country image: The importance of involvement and perceived value. Tour. Manag. Perspect. 2019, 29, 105–117. [Google Scholar]
- Yadegaridehkordi, E.; Nilashi, M.; Hairul, M.; Ibrahim, O. Predicting determinants of hotel success and development using Structural Equation Modelling (SEM)-ANFIS method. Tour. Manag. 2018, 66, 364–386. [Google Scholar] [CrossRef]
- Tahir, A. Classifying Daily Tour Service Attributes by Three-Factor Theory of Customer Satisfaction. J. Qual. Assur. Hosp. Tour. 2018, 19, 112–125. [Google Scholar] [CrossRef]
- Mahdi, T.; Zahed, G.; Mojtaba, R.; Mohammad, M.; Mohammad, A.S. Service quality aspects and sports scientific conventions:An experience from Iran. J. Conv. Event Tour. 2017, 18, 260–281. [Google Scholar] [CrossRef]
- Silvestri, C.; Aquilani, B.; Ruggieri, A. Service quality and customer satisfaction in thermal tourism. TQM J. 2017, 29, 55–81. [Google Scholar] [CrossRef]
- Shenwei, S.; Tkaczynski, A. Origin and money matter: The airline service quality expectations of international students. J. Hosp. Tour. Manag. 2017, 31, 244–252. [Google Scholar]
- Pinkus, E.; Moore, S.; Taplin, R.; Pearce, J. Re-thinking visitor loyalty at ‘once in a lifetime’ nature-based tourism destinations: Empirical evidence from Purnululu National Park, Australia. J. Outdoor Recreat. Tour. 2016, 16, 7–15. [Google Scholar] [CrossRef]
- Sakul, J. An investigation of safety tourism: An experience of young tourists in Bangkok, Thailand. Procedia Soc. Behav. Sci. 2015, 197, 1931–1935. [Google Scholar]
- Yamaguchi, S.; Akiyoshi, R.; Yamaguchi, Y.; Nogawa, H. Assessing the Effects of Service Quality, Past Experience, and Destination Image on Behavioral Intentions in the Spring Training Camp of a Japanese Professional Baseball Team. J. Conv. Event Tour. 2015, 16, 228–252. [Google Scholar] [CrossRef]
- Garcés, J.; Ferri, M.; Durá, E.; McCabe, S.; Sánchez, J. Social Tourism and Healthy Ageing. Int. J. Tour. Res. 2014, 18, 4. [Google Scholar] [CrossRef]
- Lee, S.H.; Tideswell, C. Understanding attitudes towards leisure travel and the constraints faced by senior Koreans. J. Vacat. Mark. 2005, 11, 249–263. [Google Scholar] [CrossRef] [Green Version]
- Vellas, P. Aspectos Psicológicos y Sociales del Desarrollo del Turismo en la Tercera Edad; Primeras Jornadas Técnicas de Turismo y Tercera Edad: Alicante, Spain, 1986. [Google Scholar]
- Su, L.; Huang, S.; Chen, X. Effects of Service Fairness and Service Quality on Tourists’ Behavioral Intentions and Subjective Well-Being. J. Travel Tour. Mark. 2015, 32, 290–307. [Google Scholar] [CrossRef]
- Hyunsuk, C.; Saehya, A.; Kwang-Woo, L.; Duk-Byeong, P. Measuring Service Quality of Rural Accommodations. Sustainability 2018, 10, 443. [Google Scholar] [CrossRef]
Figure 1.
Flow diagram.

© 2019 by the authors. Licensee MDPI, Basel, Switzerland. This article is an open access article distributed under the terms and conditions of the Creative Commons Attribution (CC BY) license (http://creativecommons.org/licenses/by/4.0/).
Share and Cite
MDPI and ACS Style
Ferri Sanz, M.; Durá Ferrandis, E.; Garcés Ferrer, J. Service Quality Scales and Tourists with Special Needs: A Systematic Review. Sustainability 2019, 11, 3844. https://doi.org/10.3390/su11143844
AMA Style
Ferri Sanz M, Durá Ferrandis E, Garcés Ferrer J. Service Quality Scales and Tourists with Special Needs: A Systematic Review. Sustainability. 2019; 11(14):3844. https://doi.org/10.3390/su11143844
Chicago/Turabian StyleFerri Sanz, Mireia, Estrella Durá Ferrandis, and Jorge Garcés Ferrer. 2019. "Service Quality Scales and Tourists with Special Needs: A Systematic Review" Sustainability 11, no. 14: 3844. https://doi.org/10.3390/su11143844
Note that from the first issue of 2016, this journal uses article numbers instead of page numbers. See further details here.