Metal-Bearing Nanoparticles Observed in Soils and Fault Gouges over the Shenjiayao Gold Deposit and Their Significance
by
Bimin Zhang
1,2, 
Zhixuan Han
1,2,*,
Xueqiu Wang
1,2,
Hanliang Liu
1,2,
Hui Wu
1,2 and
Hui Feng
3,* 1
Key Laboratory of Geochemical Exploration, Institute of Geophysical and Geochemical Exploration, CAGS, Langfang 065000, China
2
UNESCO International Centre on Global-scale Geochemistry, Langfang 065000, China
3
Beijing Institute of Geo-exploration Technology, Beijing 102209, China
*
Authors to whom correspondence should be addressed.
Minerals 2019, 9(7), 414; https://doi.org/10.3390/min9070414
Submission received: 30 April 2019
/
Revised: 30 June 2019
/
Accepted: 3 July 2019
/
Published: 5 July 2019
(This article belongs to the Special Issue Nanomineralogy)
Abstract
:Mineral deposits concealed by thick cover sequences present special problems for geochemical exploration. A variety of penetrating geochemical methods have been developed in the last few decades to explore for buried deposits. The theoretical basis of the mechanism by which metals migrate upward from buried deposits through the cover to the surface is still not fully understood. One hypothesis is that metal particles or metal elements could be carried onto bubbles or micro-flow of geogas and migrate upward to the surface. After years of study, nano-scale metal-bearing particles have been widely observed in geogas samples from different kinds of concealed deposits. However, the occurrence of these metal-bearing particles carried by geogases in near-surface media, such as soil, has not been studied in detail. In this study, metal-bearing nanoparticles were observed in samples from soils and fault gouges over the Shenjiayao gold deposit. The results indicate that (1) the ore-forming elements in soils can only come from deep-seated ore bodies and they occur in nanoparticles in the study area; (2) there is an obvious relationship between metal nanoparticles in fault gouges and soils; (3) the metallic nanoparticles in fault gouges represent a transitional phase along the whole vertical migration process. In addition, the observation results show that the metal-bearing nanoparticles tend to be adsorbed on the surface of clay minerals, which provide theoretical support for using fine fraction soils as sampling media to carry out geochemical exploration in sediment-covered terrains. Based on the results and discussion, a simple migration model was built in this paper.
1. Introduction
As discoveries of world-class mineral deposits continue to decline, increased attention is being focused on geochemical exploration methods specifically designed for terrains covered by thick regolith [1,2]. These methods include partial extraction techniques, geogas analysis, electrogeochemistry, biogeochemistry, hydrochemistry, etc. [3,4,5,6,7,8,9,10,11,12,13,14,15,16,17]. Geogas is an effective method in the search for concealed deposits in covered terrains and has been used for mineral deposit exploration with satisfactory results [9,18,19,20,21,22,23,24,25]. This method is based on the assumption that the geogas could carry ultrafine metal-bearing particles or metal elements in the form of tiny bubbles or micro-flow and migrate upwards to the surface [9,12,18,26,27,28,29]. In order to prove the theory is plausible, the best way is to find ultrafine metal-bearing particles in geogas samples that definitely come from deep-seated ore bodies. After years of studies, ultrafine metal-bearing particles at the nano-scale have been widely observed in geogas samples from different kinds of concealed deposits [12,30,31,32,33,34,35,36,37,38,39,40,41], which provide the evidence for the vertical migration of elements through geogas media and also indicate that geogas is a proper sampling media for geochemical exploration in covered terrains. However, soil is the most common sampling media in prospecting activities. Many studies have proved that soils over concealed deposits contain anomalies that can reflect deep-seated ore bodies [2,9,10,14,15,36,37,42,43,44,45,46,47,48,49,50,51,52]. In some cases, the sediment cover over the deep-seated ore bodies is very simple and uniform. Often, the only source of anomalies in soils is from the deep-seated ore bodies [2,10,36,46,49]. In order to explain the anomaly formation mechanism, the key approach is to ascertain the occurrence and origin of ore-forming elements in soils over concealed deposits.
In this study, we observed the nanoparticles in soils and fault gouges over the Shenjiayao gold deposit in China, which is covered by several to tens of meters of loess. The loess land in China covers 632,000 km2, occupying approximately 6% of the total area of the country. The objective of this study is to (a) characterize and compare the nanoparticles sampled from various media; (b) determine the origin of the metal-bearing nanoparticles; and (c) illuminate the migration mechanism of ore-forming elements from deep-seated ore bodies to the earth’s surface and discuss the significance of nanoparticles in geogas for mineral prospecting.
2. Geological Setting
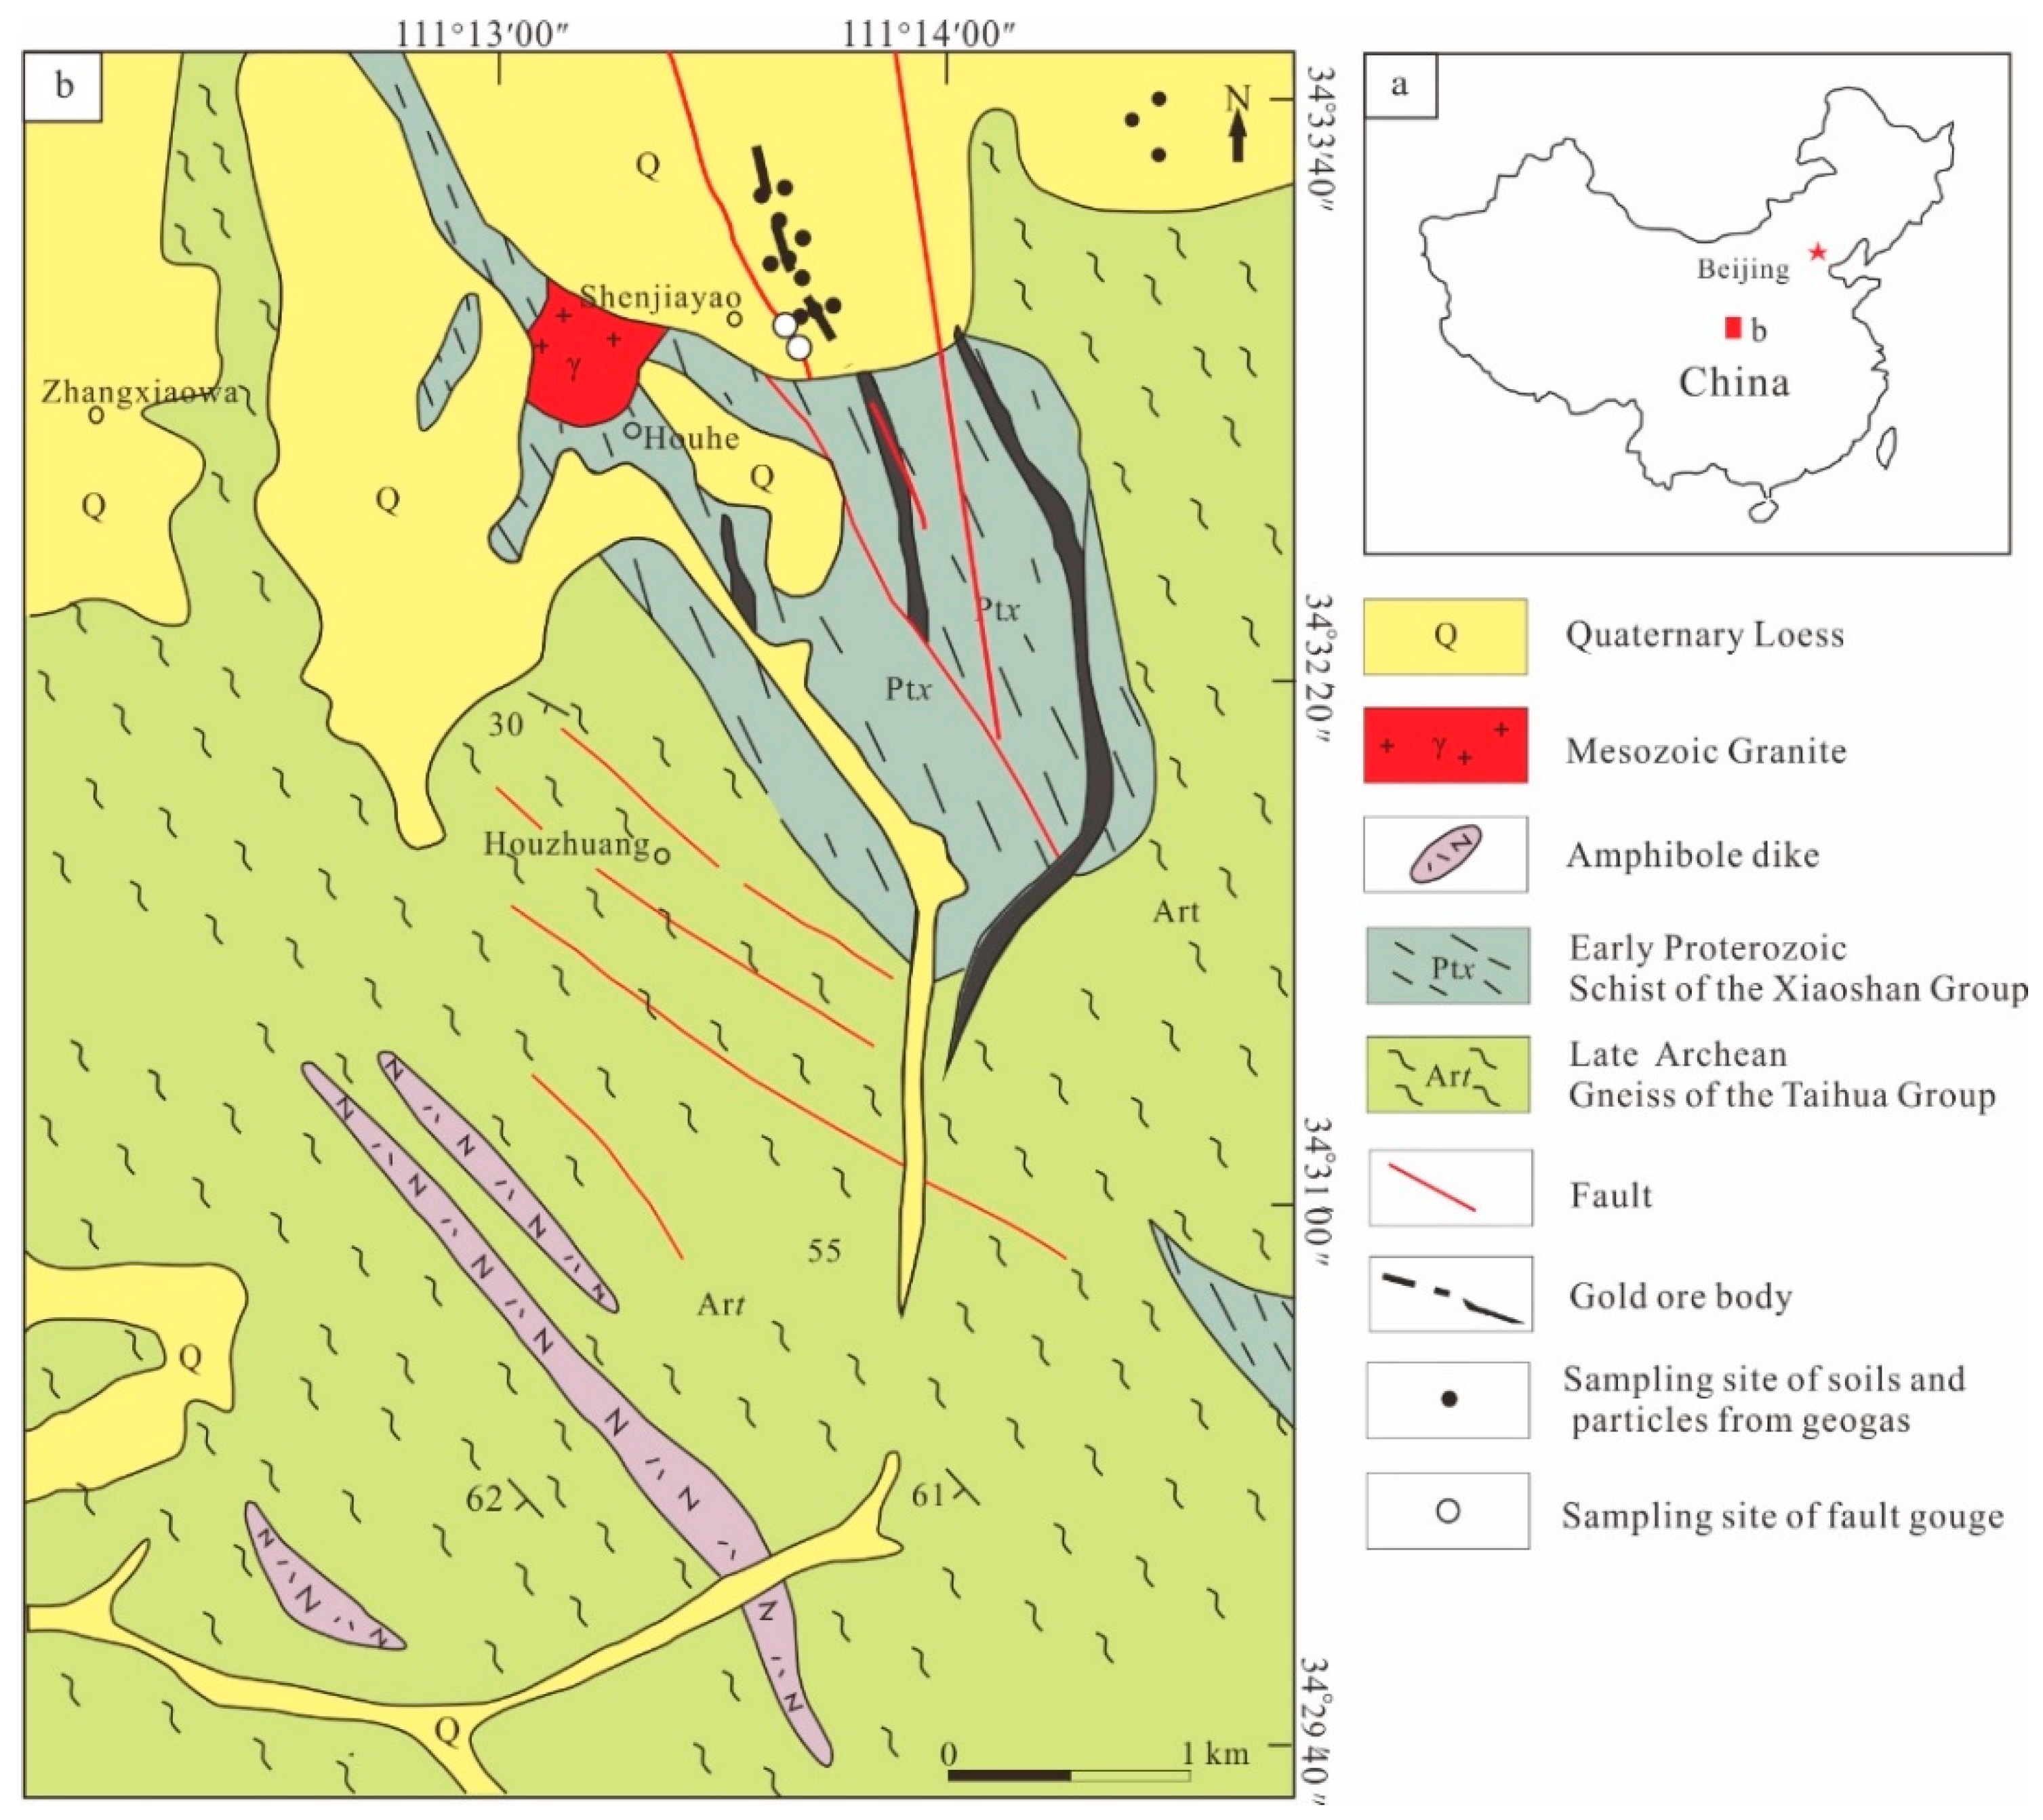
The Shenjiayao gold deposit (134,000 oz of gold) is situated in the Xiaoqinling-Xiong’ershan gold metallogenic belt in the Qinling Mountains of eastern Shananxi and western Henan provinces in central China [53]. The Xiaoshan area is a structural dome bounded by the regional Sanmenxia-Baofeng Fault to the north and the Jiaohe Fault to the south. The dome has a core of Archean basement rocks, which is surrounded by Proterozoic metamorphic rocks (Figure 1). The Xiaoqinling-Xiong’ershan region has an indicated resource of more than 400 tonnes of gold and is second in China [54]. Deposits in this region are commonly small but of high grade.
The Shenjiayao deposit is a metamorphic hydrothermal gold deposit and is the largest deposit in the Xiaoshan area. The gold ores occur in quartz veins and in highly altered and fractured rocks. The faults in this area are primarily striking to the NNW–NW and the ore bodies are also primarily striking the same direction (Figure 1). Gneiss, plagiogranitic gneiss, and granodioritic rocks of the Taihua Group hosts the deposit. Principal ore minerals include: Native gold, electrum, pyrite, chalcopyrite, galena, sphalerite, arsenopyrite, and marmatite. Gangue minerals mainly include: Quartz, sericite, siderite, dolomite, calcite, chlorite, barite, and kaolinite [25,53].
The concealed ore bodies mainly locate in the contact zones of Archean plagioclase gneiss and Early Proterozoic schist. The bed rock is covered by loess in study area. The thickness of loess cover is 22–75 m.
3. Materials and Methods
3.1. Sample Collection and Preprocessing
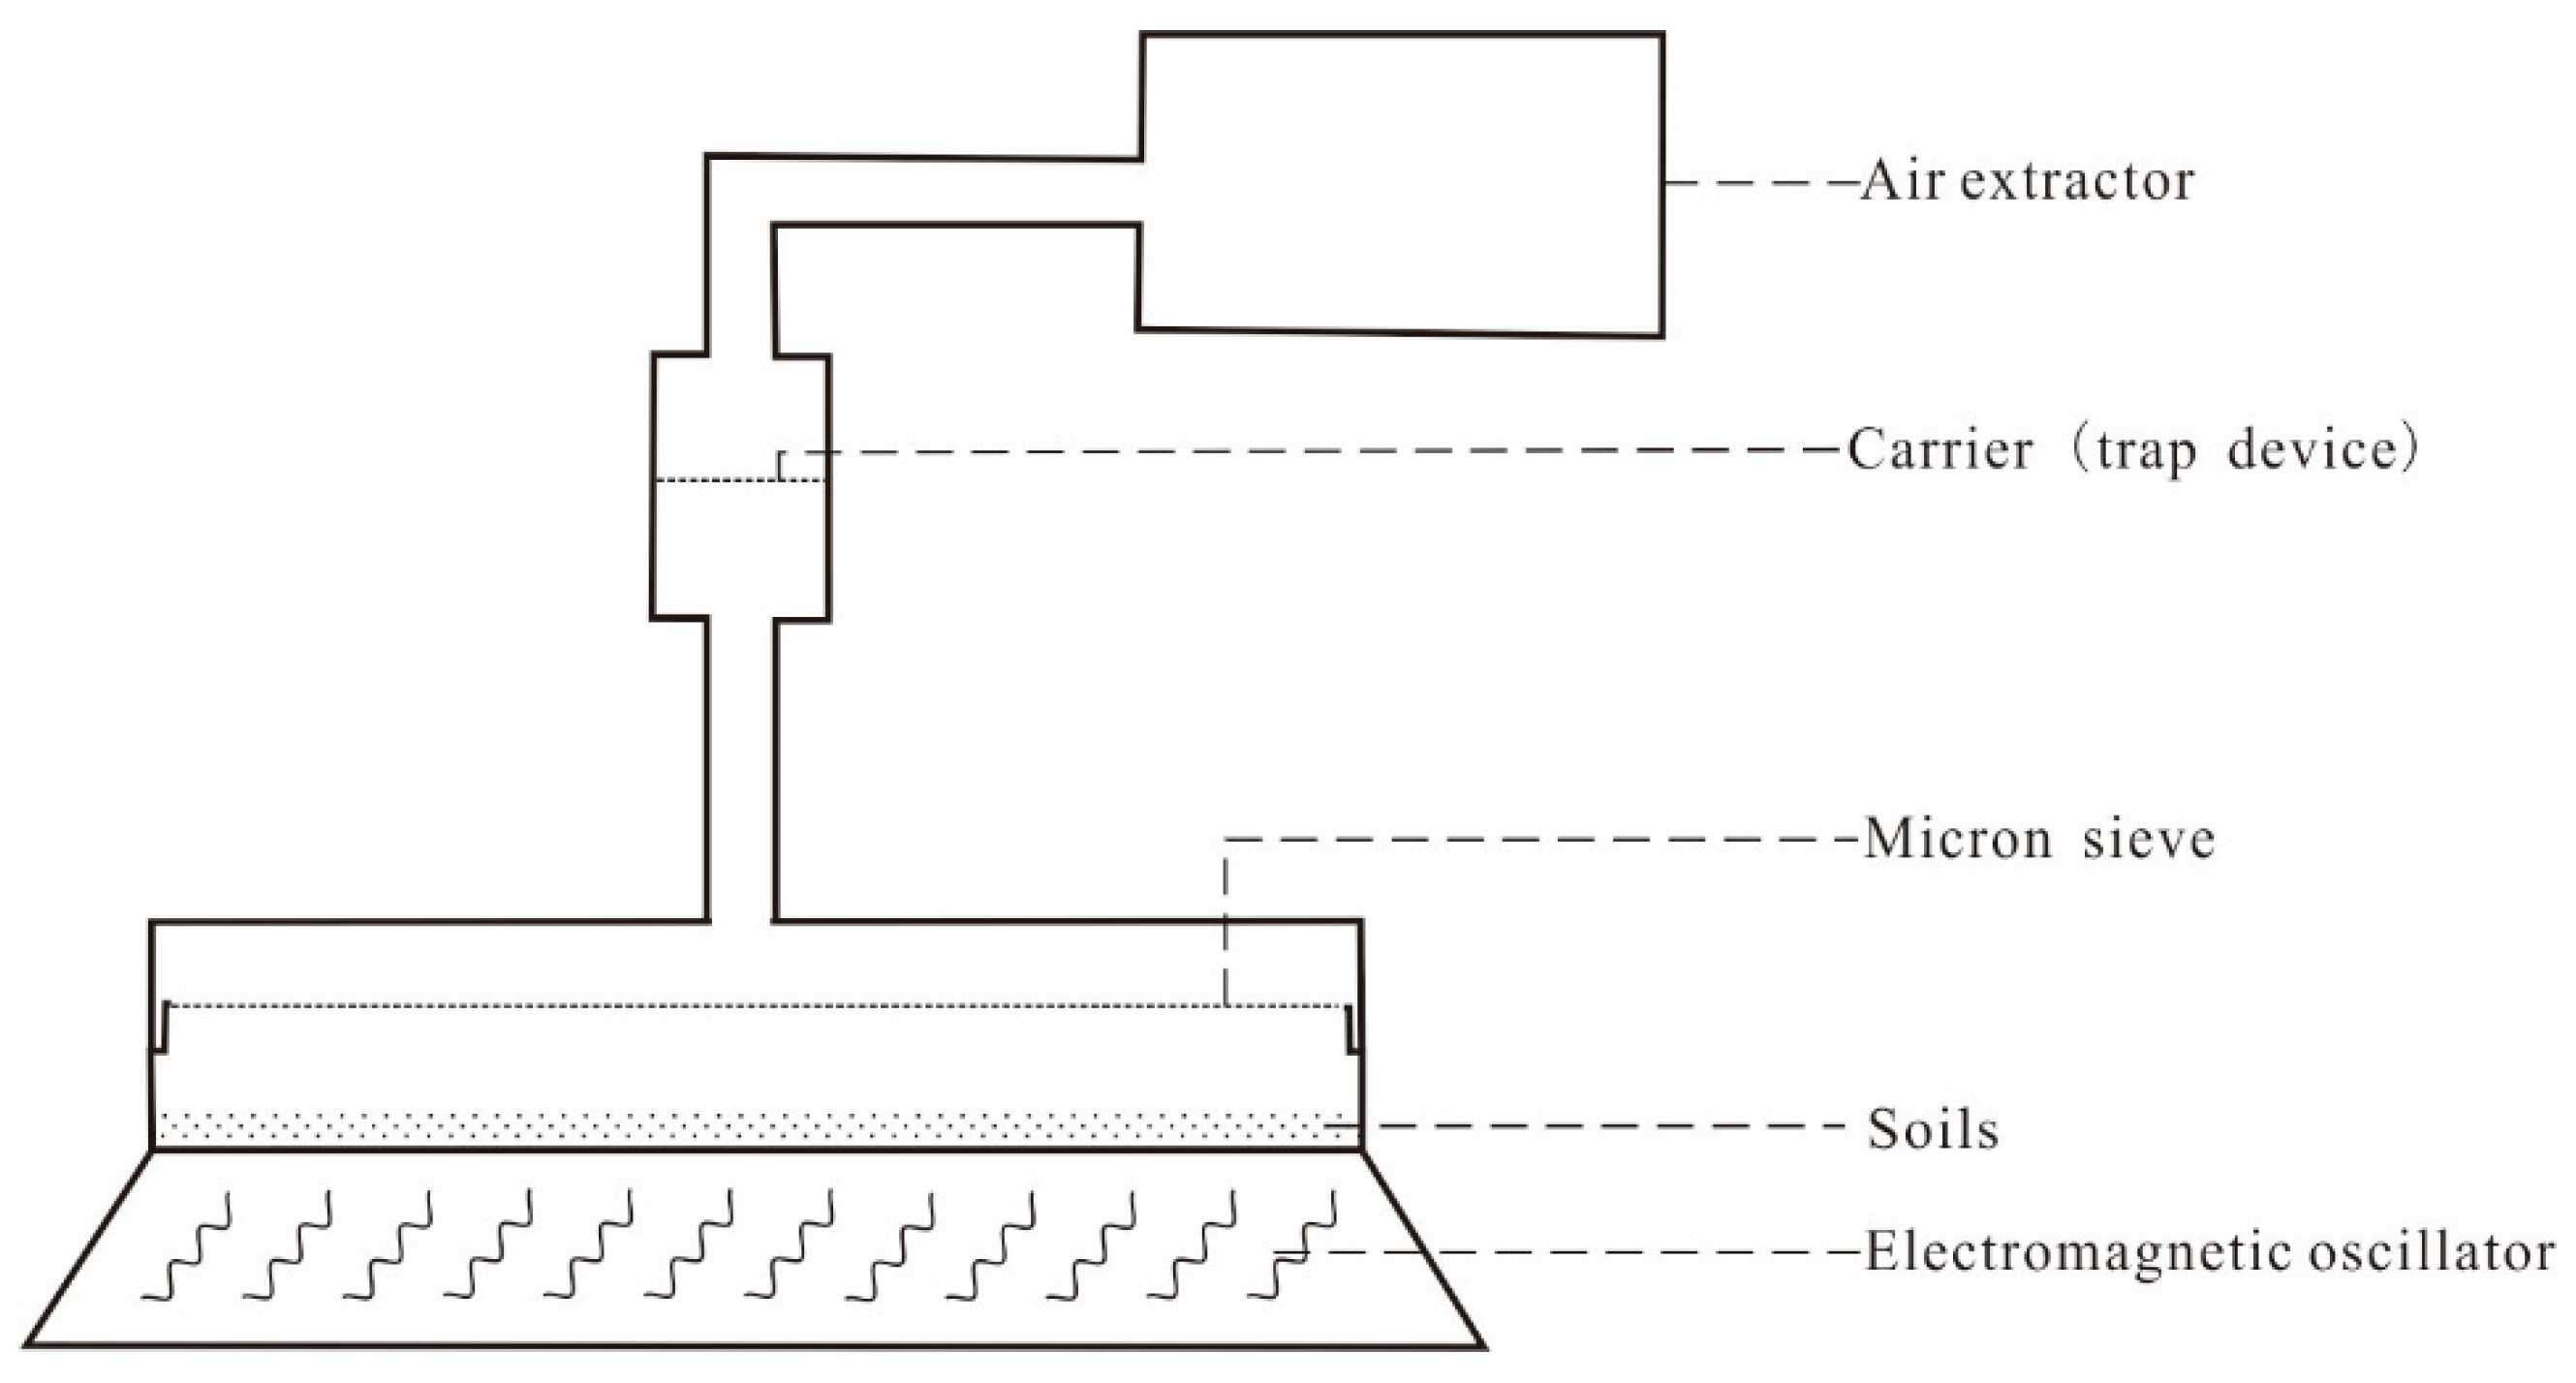
Open stope method was adopted by Shenjiayao deposit for underground mining. To avoid mining-related contamination, the sampling sites were located away from the mine adits, roads, tailings lagoons, and the ore processing mill. Ten soil samples were collected in different sites above the concealed gold ore bodies. Two fault gouge samples were collected from a deep gully over the ore bodies in the loess-covered area, three soil samples were collected in the background area, and three ore samples were collected in the underground mine. The locations of sampling sites are shown in Figure 1. At each soil sampling site, one soil sample around 100 g was collected at a depth of 20–30 cm to avoid organic horizon. After field work, the soil samples were dried at room temperature, and sieved to <76 μm. About 10 g soil was scattered using an electromagnetic oscillation micrometer vibrating screen connected to a trap device and an air extractor (Figure 2). The trapping device contains 1 μm Millipore filter and carbon-coated aluminum TEM (transmission electron microscopy) grid to collect nanoparticles. During the oscillation of the vibrating screen and the air extractor, the gases in the sample carrying the micro-nanoparticles enter the collector through a 0.45 μm Millipore filter and metal-bearing particles are captured on a carbon-coated aluminum TEM grid. This process needs to continue about 3 minutes in order to adsorb appropriate particles on the grid. Following this procedure, a clean tweezer was used to pick up the TEM grids, then the grids with the attached nanoparticles were placed into a special grid sample box. The fault gouge samples and ore samples were ground by a ceramic mill to <76 μm. The fault gouge samples were separated nanoparticles in the same way as soil samples.
3.2. TEM Observation
After preprocessing, the TEM grids were analyzed by a transmission electron microscopy (TEM) at Beijing Center for Physical and Chemical Analysis to observe particle features (such as size, shape, structure, composition, and form of polymerization) (Beijing, China). The TEM (Tecnai G2 F30) had a spot resolution of 0.20 nm, lattice resolution of 0.1 nm, resolution of STEM HAADF of 0.17 nm, and minimum beam spot diameter of 0.8 nm. It was equipped with an X-ray energy dispersive spectrometer (EDS) at an accelerating voltage of 300 kV, which can measure the composition of the nanoparticles.
3.3. Chemical Analysis
At the same time, all samples were analyzed in the laboratory of Institute of Geophysical and Geochemical Exploration (CAGS) in Langfang, China. A 0.25 g sample was digested in a hot mixture of acids (HCl, HF, HNO3, and HClO4). Inductively coupled plasma-mass spectrometry (ICP-MS) was used for the determination of Ag, Cu, Pb, Sb, and Zn concentrations. In addition, a 10 g sample was digested in aqua regia and analyzed by graphite furnace atomic absorption spectrometry (GF-AAS) to obtain the Au concentration. Furthermore, a 0.5 g sample was subjected to an aqua regia digest and analyzed by hydride generation atomic fluorescence spectrometry (HG-AFS) to determine the As and Hg concentrations. Analytical accuracy and precision for the laboratory quality were strictly controlled by laboratory replicate samples and standard reference materials (SRMs).
4. Results
4.1. Nanoparticles from the Deposit
4.1.1. Nanoparticles in Soils over the Gold Deposit
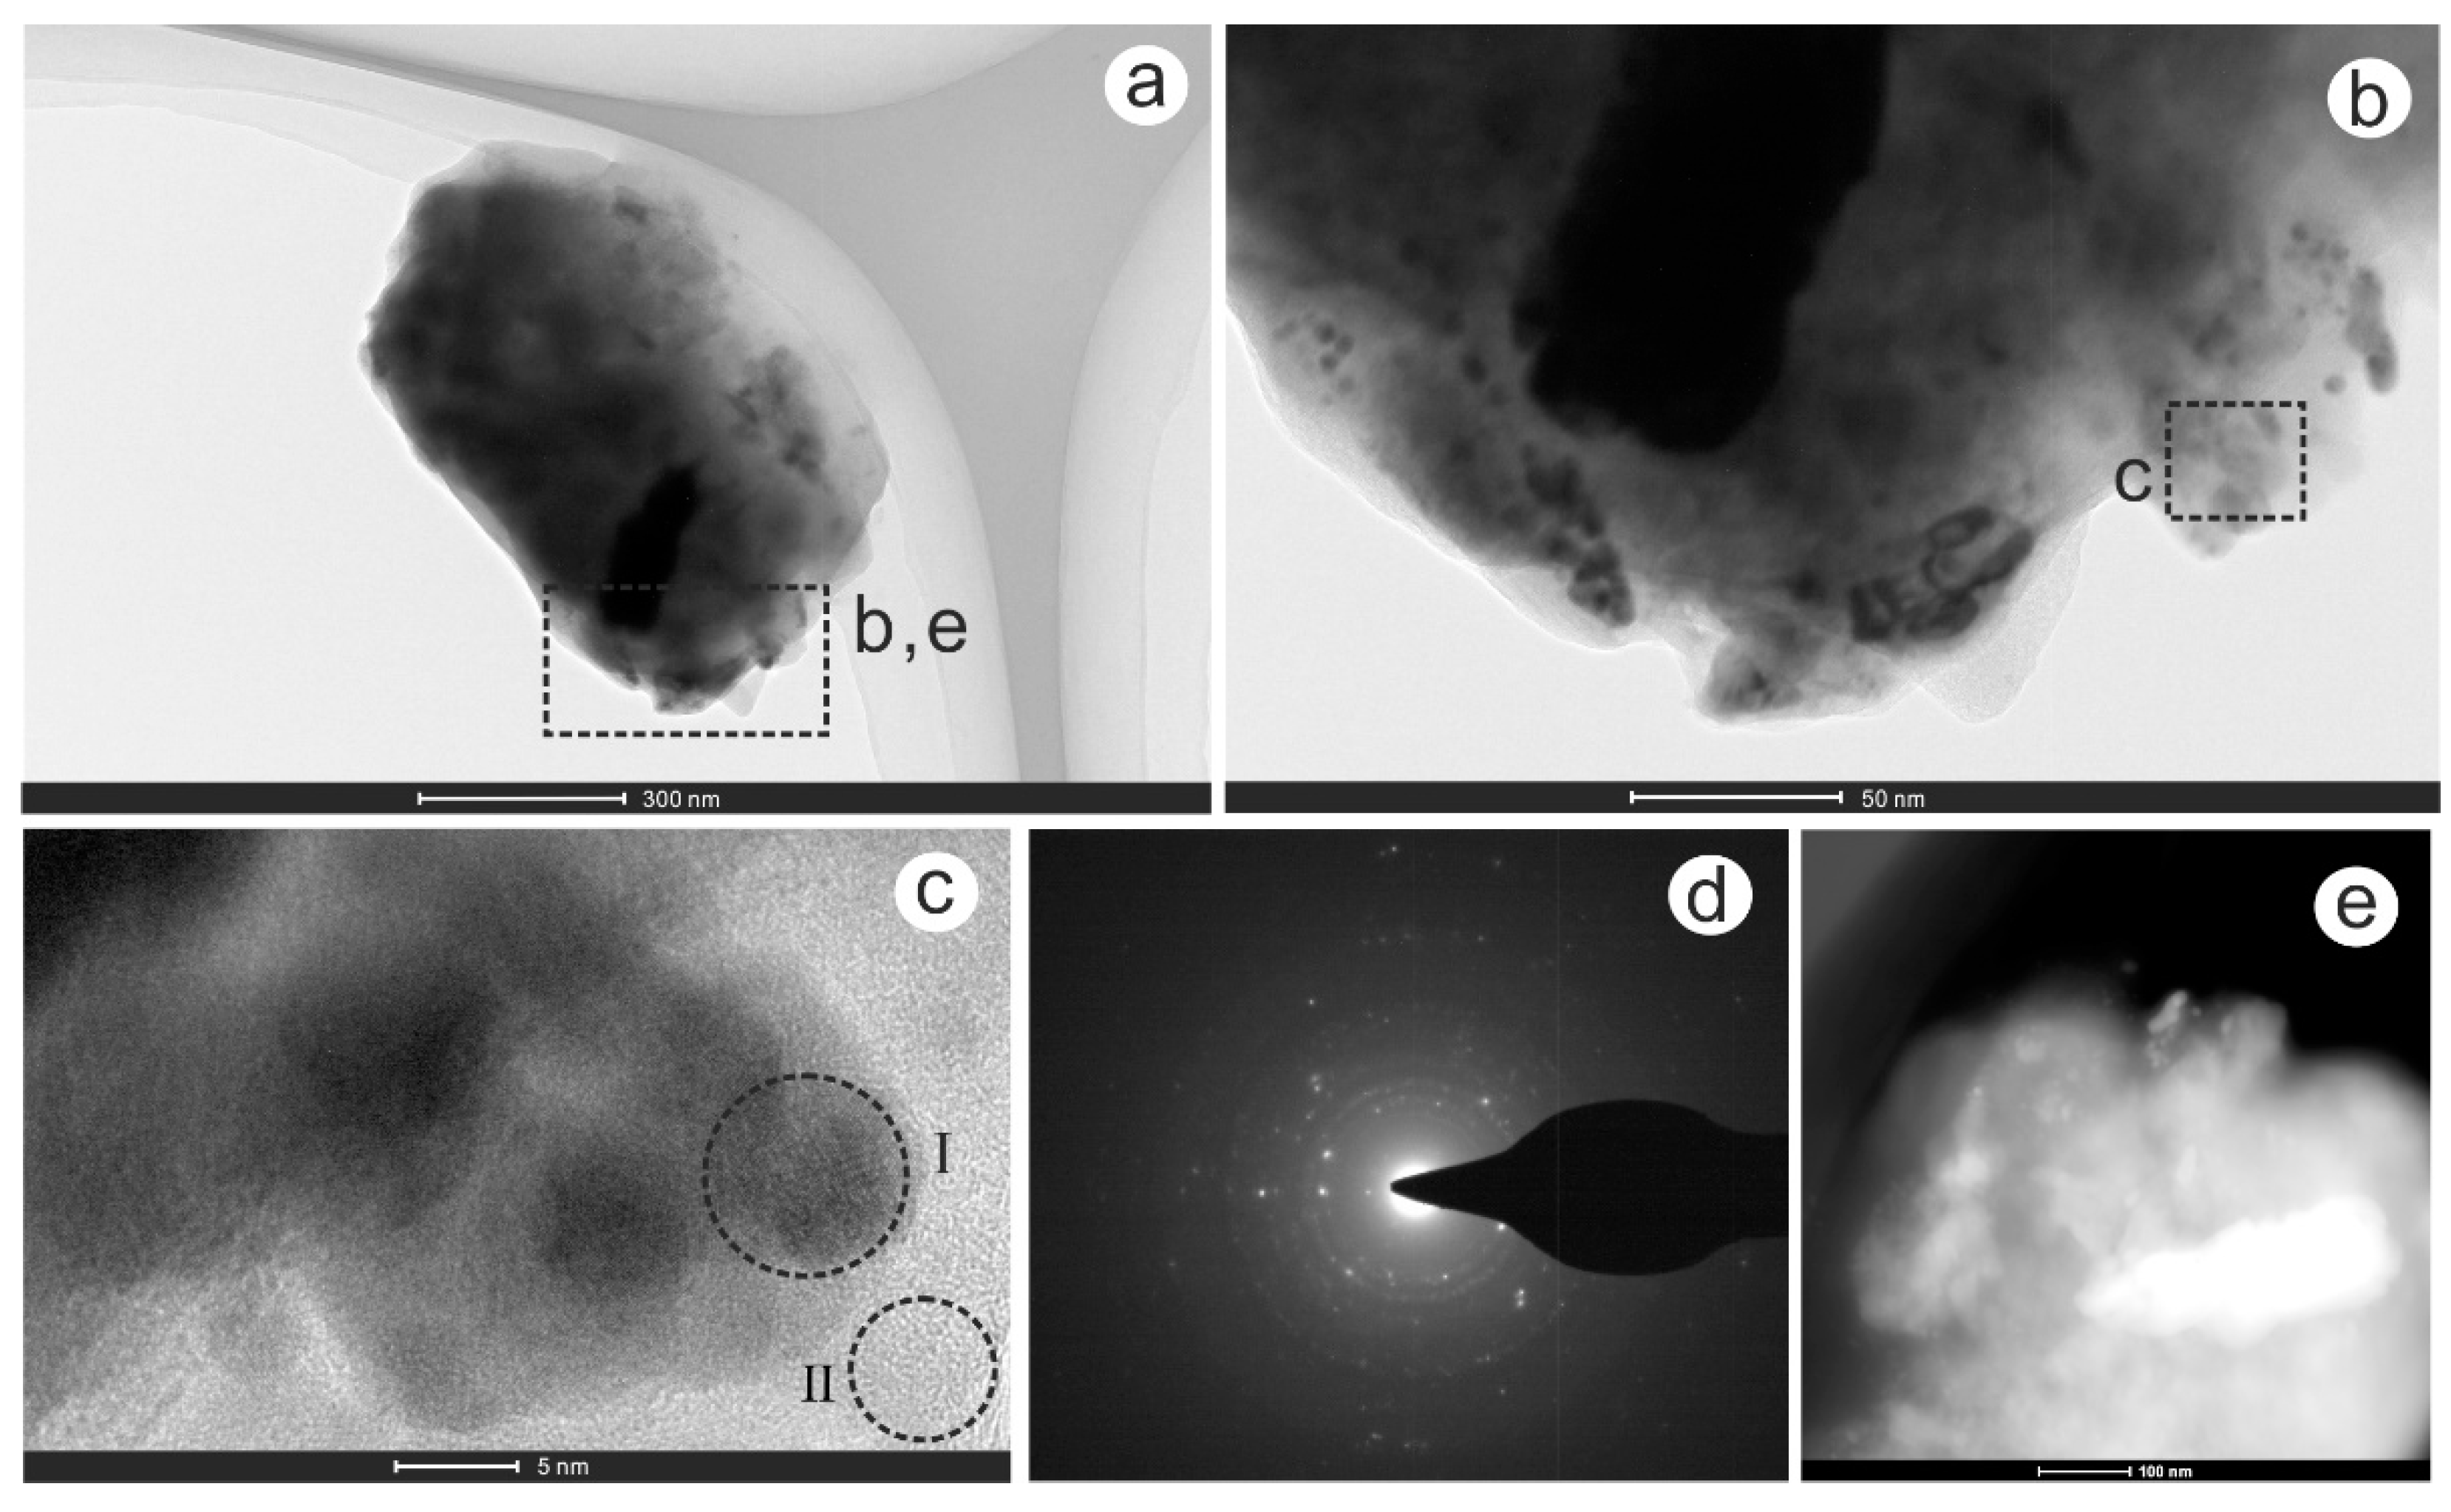
Gold-bearing nanoparticles are very infrequent in the studied particles. An important reason is the abundance of Au in nature is too low, even in the gold mining area. Figure 3a,b shows an Au-bearing particle in soils over Shenjiayao gold deposit. The particle exhibits an irregular shape with a diameter of approximately 800 nm. The energy dispersive X-ray (EDX) results (Table 1; ID:1) show the particle contains Au (34.11%), Cu (12.16%), Fe (12.91%), Ni (5.54%), C (9.15%), and O (7.38%). Figure 3c is the high-resolution transmission electron microscope (HRTEM) image, which marks two circular regions. The gray black area (I) has a clear crystal face, which reveals a crystalline nature, while the gray white area (II) has no crystal face, which reveals an amorphous nature. The selected area electron diffraction (SAED) pattern (Figure 3d) shows regularly distributed diffraction spots of the gray black area. The scanning transmission electron microscope with high angle annular dark field (STEM-HAADF) image (Figure 3e) reveals that some smaller nanoparticles are attached on the surface of a big particle. The EDX was used to detect the gray area in the edge of the particle, which shows that the main components are C (20.15%), O (15.36%), and Fe (28.59%). The C:O:Fe atomic ratio is nearly 4:2:1. According to the above, we can infer that some nano-scale native gold, hematite, and Cu-, Ni-bearing particles are attached on the surface of a carbon-bearing particle.
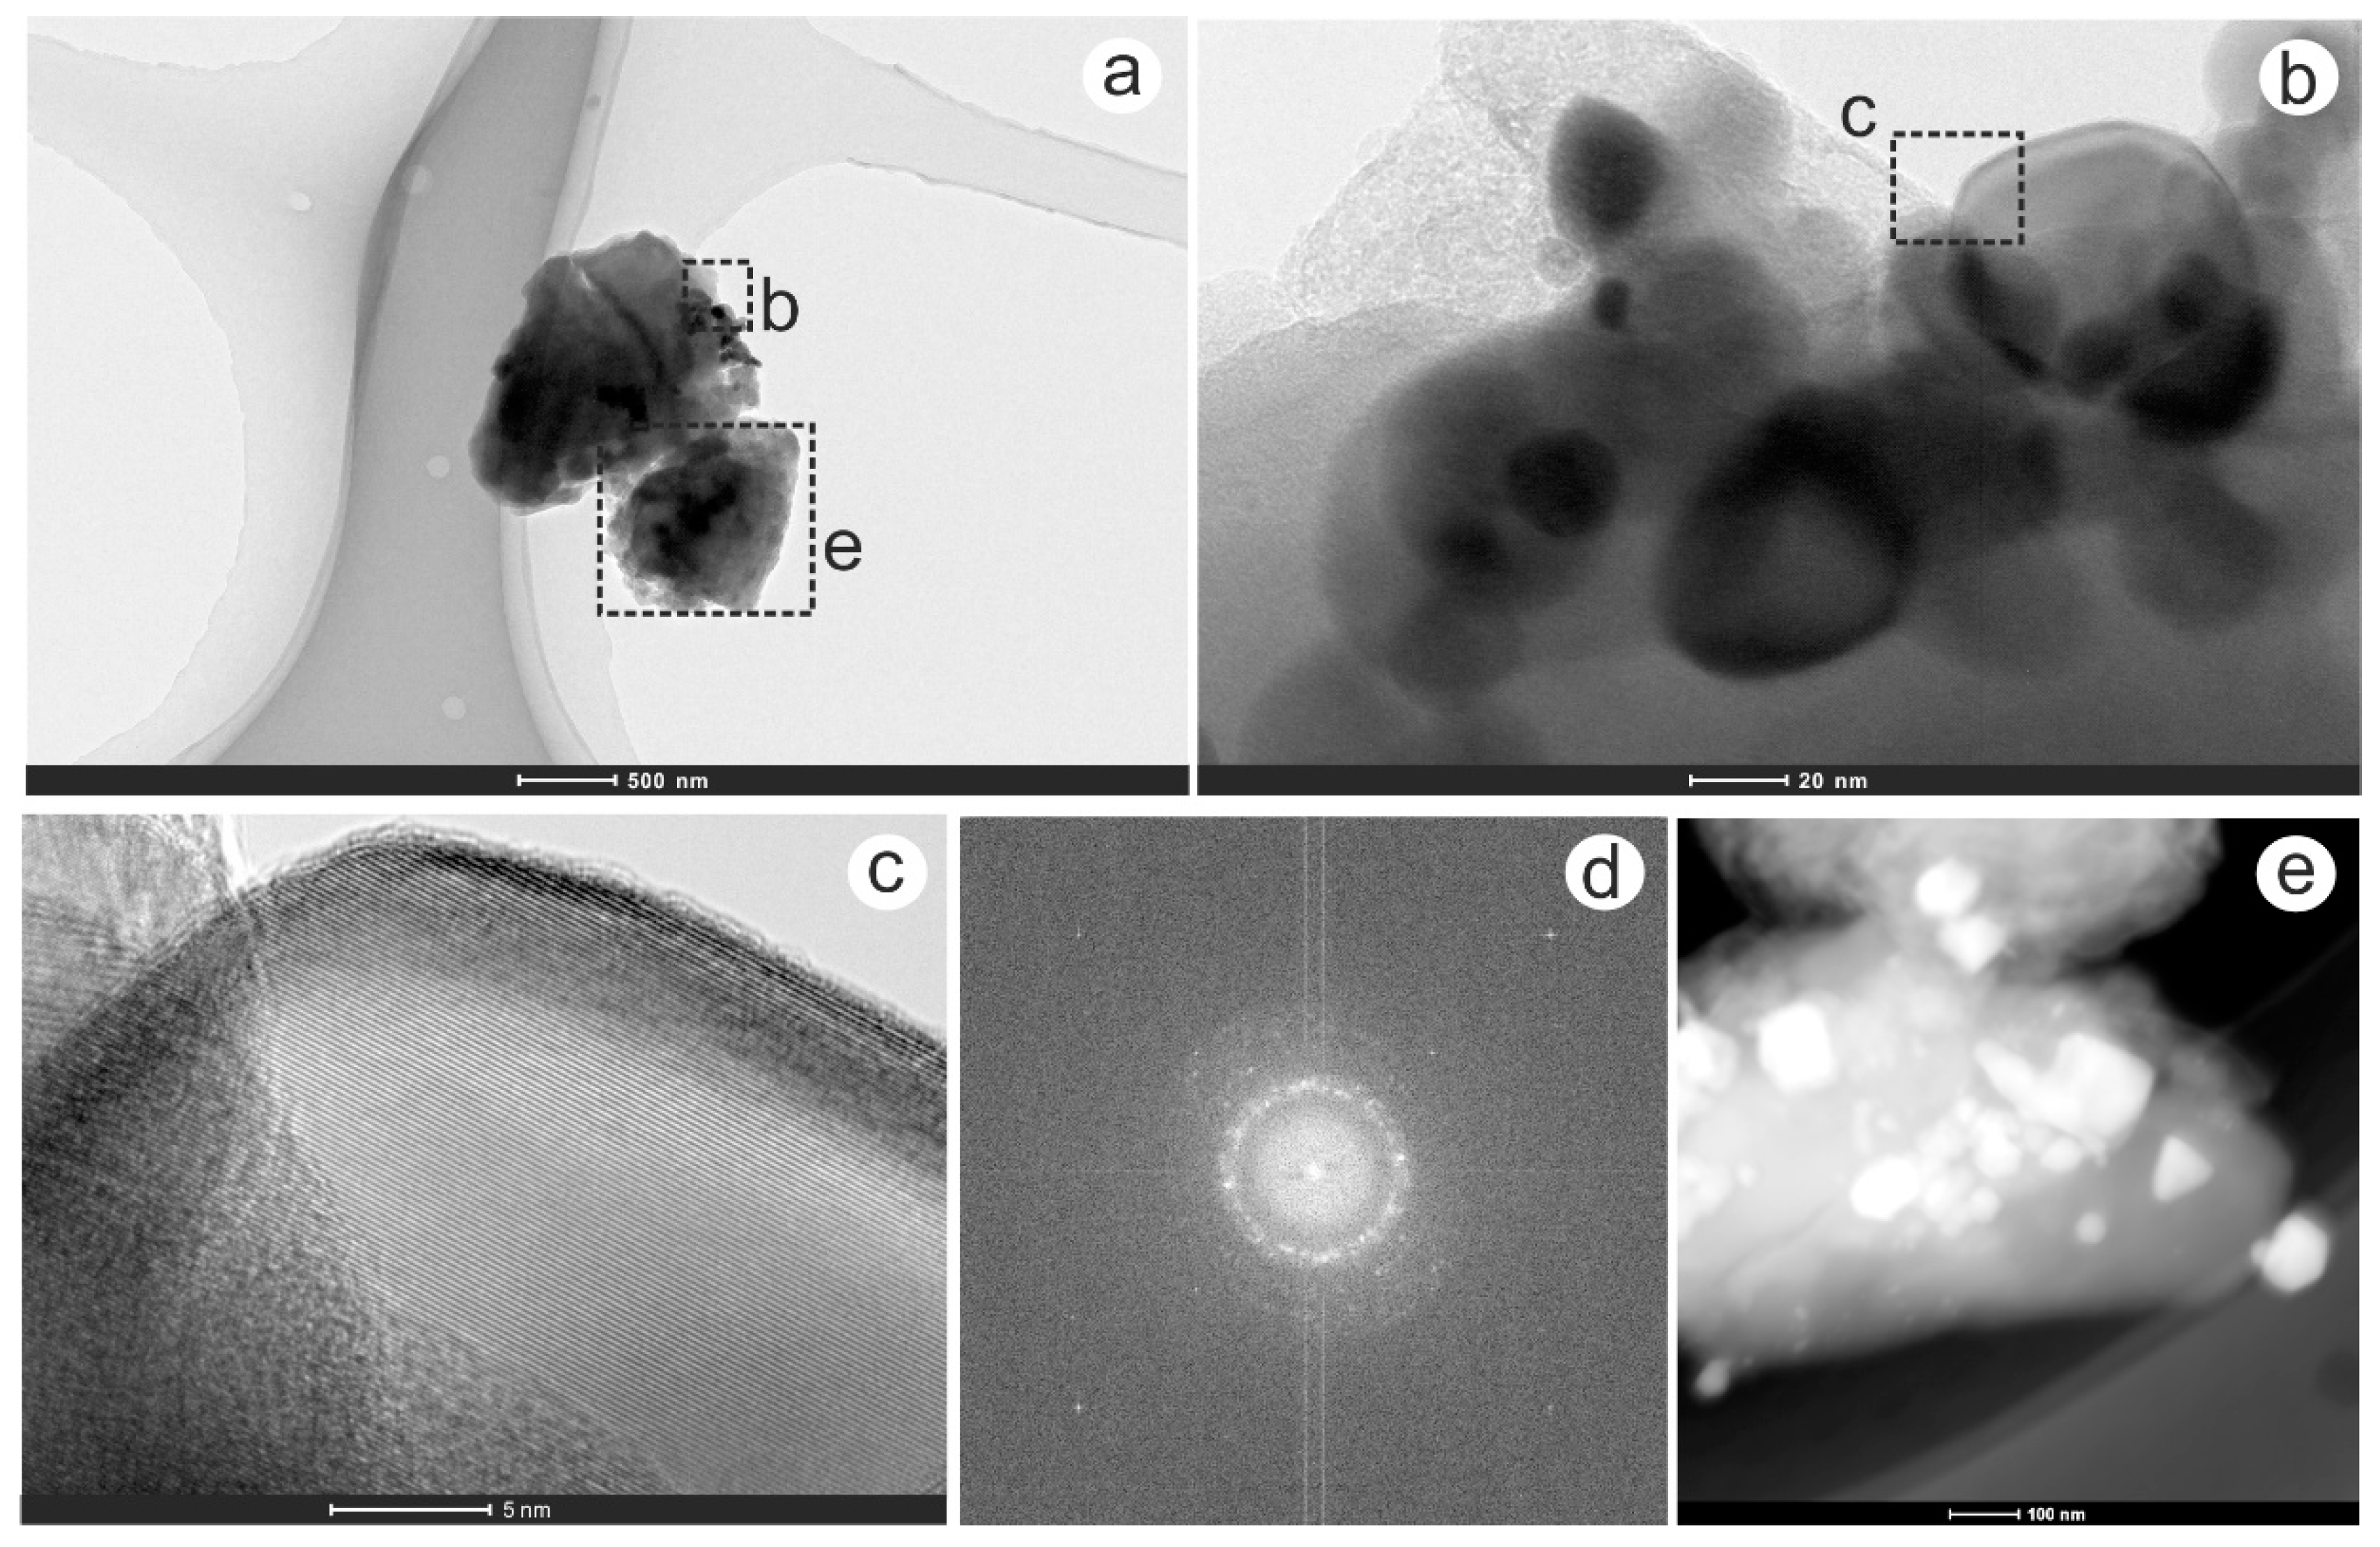
Figure 4a shows a Cu–Zr–Au–C–O particle, approximately 1 μm in size and irregular in shape. It comprises two sub-particles. The EDX results (Table 1; ID:2) show that this particle contains Cu (24.15%), Zr (21.44%), Au (1.36%), C (36.71%), and O (10.22%). The magnified image (Figure 4b) and STEM-HAADF image (Figure 4e) reveals that some smaller nanoparticles are adsorbed on the surface of a big particle. The HRTEM image (Figure 4c) and SAED pattern (Figure 4d) shows that the smaller nanoparticles have clear crystal face and regularly distributed diffraction spots, indicative of a crystalline nature. This suggests that this particle is a carbon-bearing particle and some smaller Cu- and Zr-bearing nanoparticles are attached on its surface. It is worth noting that a small amount of gold occurs in this particle, too.
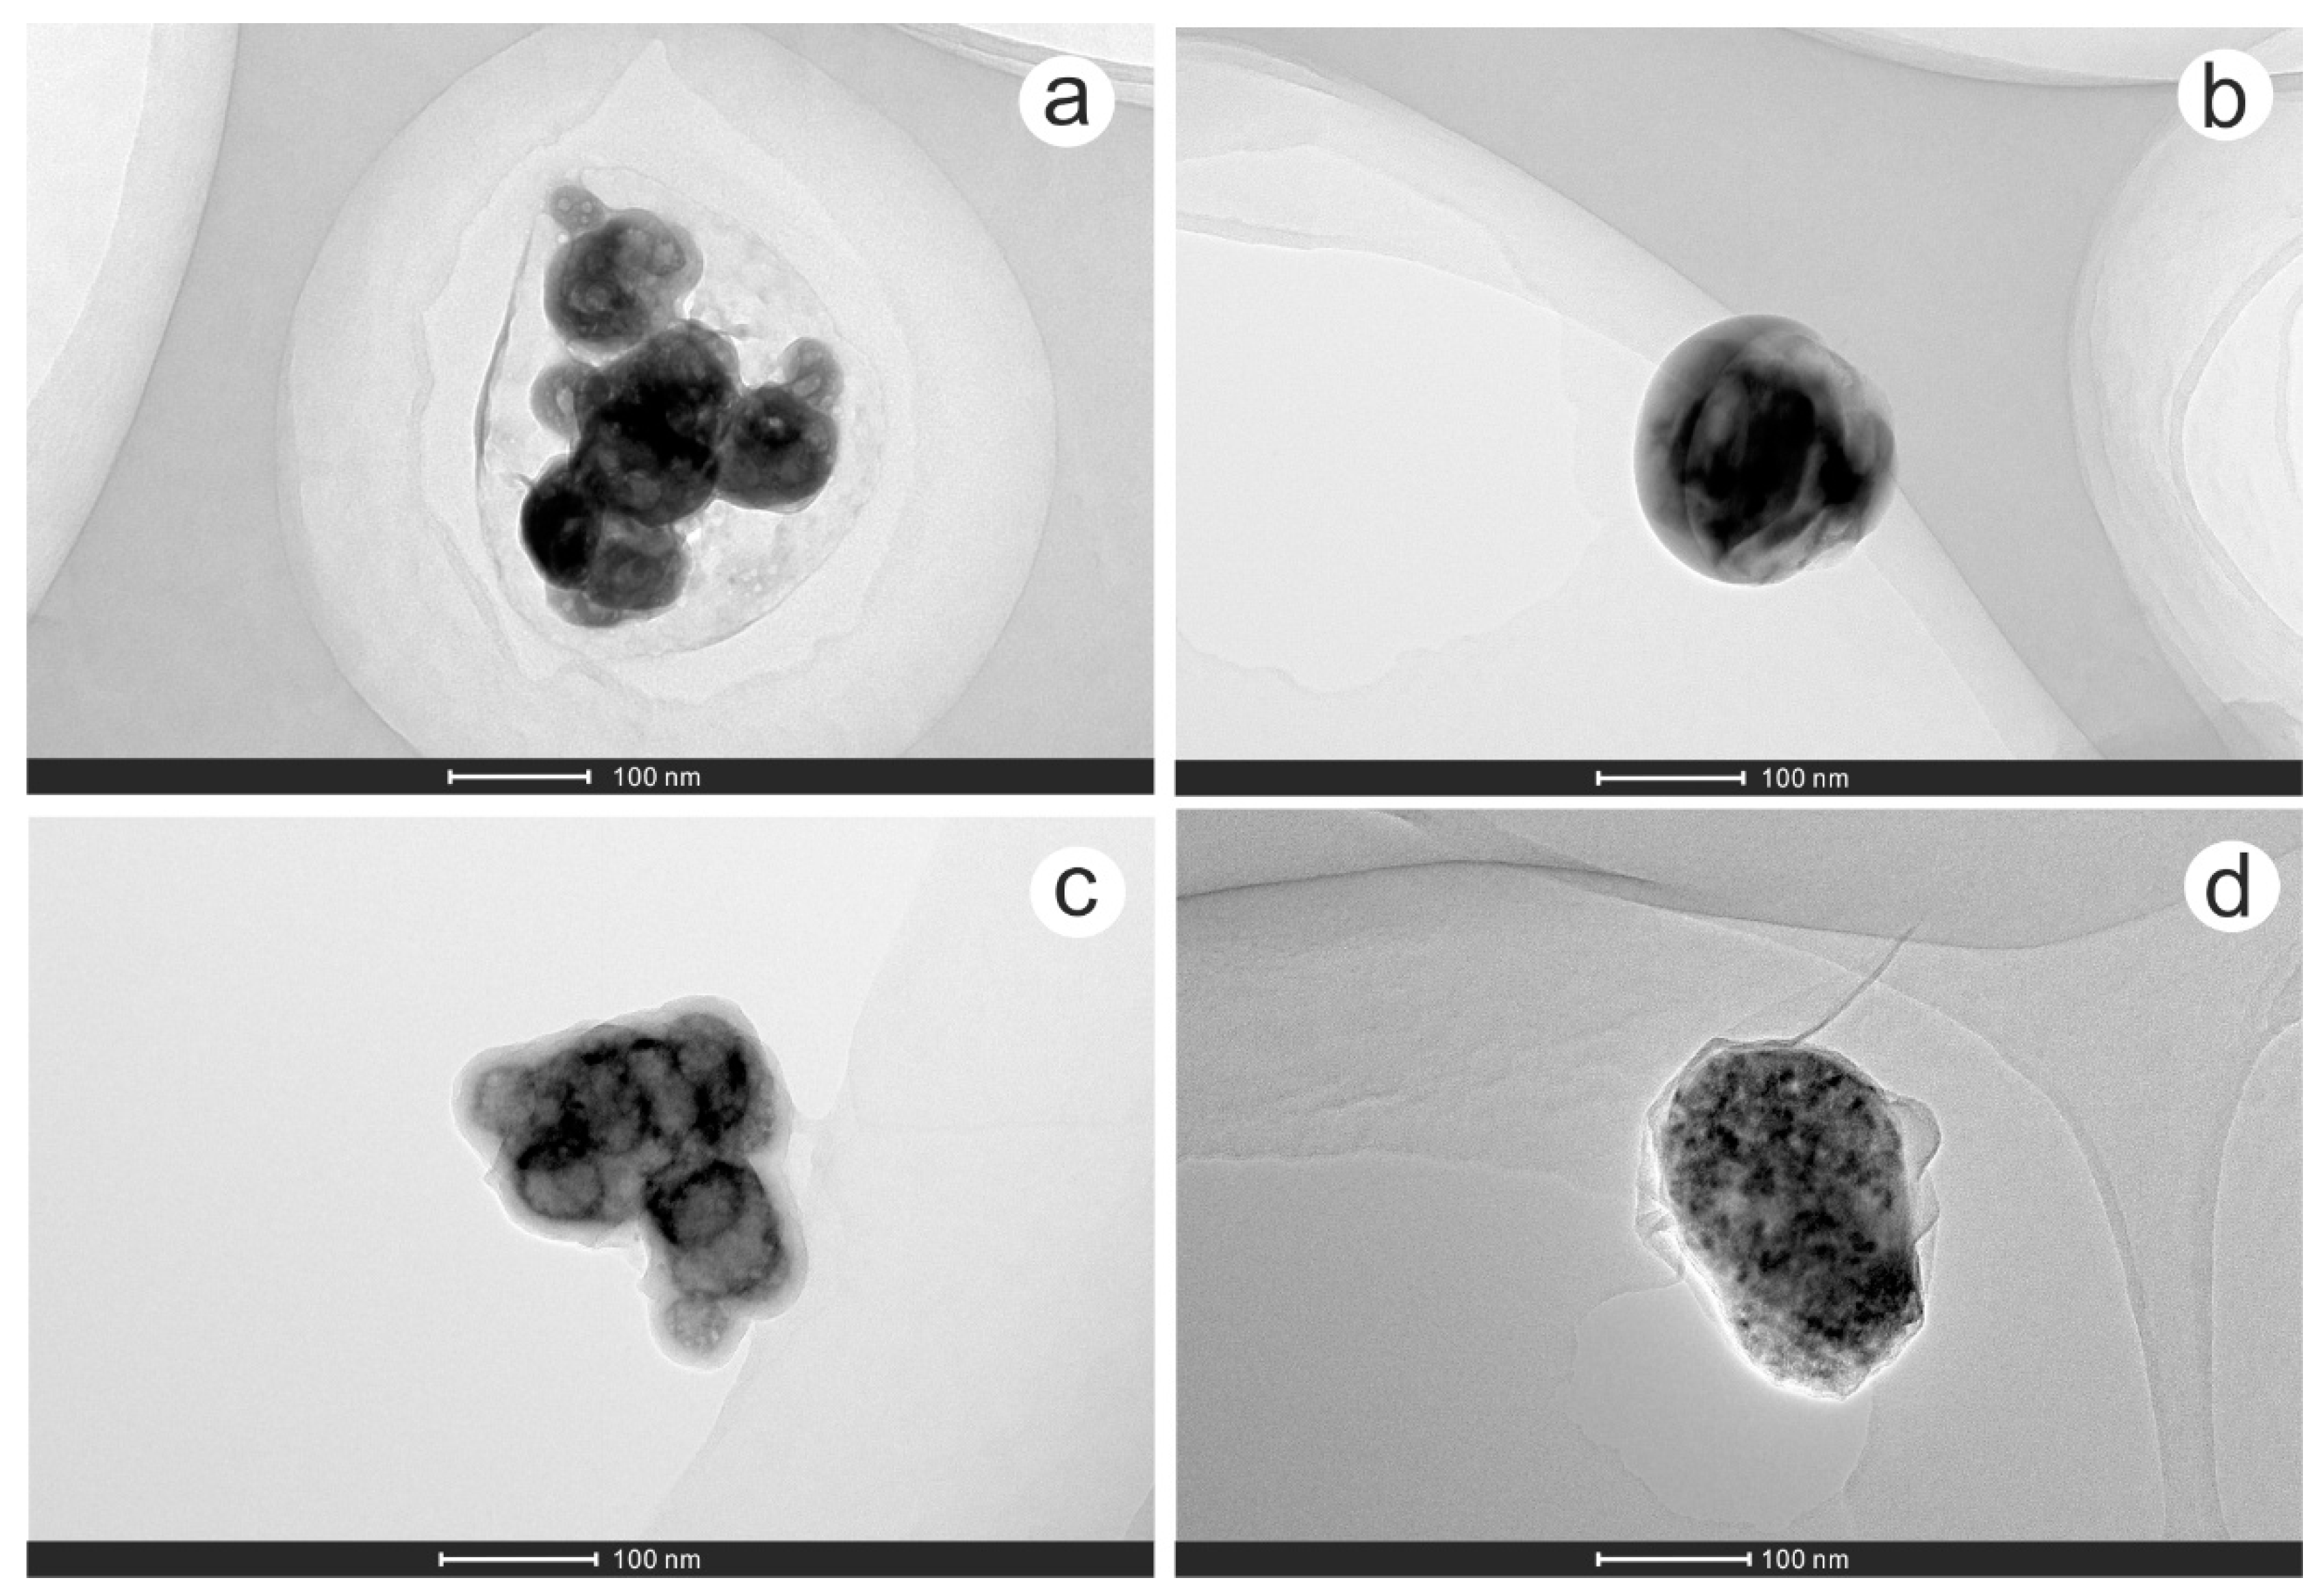
Numerous Pb-, Zn-, and Cu-bearing particles were observed in the soil samples over the studied gold deposit. Figure 5a shows a Pb- and Zn-bearing particle aggregation, approximately 50–100 nm in size and roughly circular in shape for every individual particle. The particle aggregation (Table 1; ID:3) contains Pb (65.93%), Zn (9.62%), C (10.21%), and O (6.52%). Figure 5b shows a Zn-bearing particle that exhibits a nearly circular shape with a diameter of approximately 150 nm. The particle (Table 1; ID:4) contains Zn (64.90%), O (18.35%), and Fe (6.57%). Figure 5c shows a Cu-bearing particle aggregation, approximately 200 nm in size and also roughly circular in shape for every individual particle. The particle aggregation (Table 1; ID:5) contains Cu (33.83%), Al (25.98%), Cl (24.27%), and Zn (1.86%). Figure 5d shows a Zn-bearing particle that exhibits an irregular shape with a diameter of approximately 250 nm. The particle (Table 1; ID:6) contains Zn (17.15%) and Fe (28.79%).
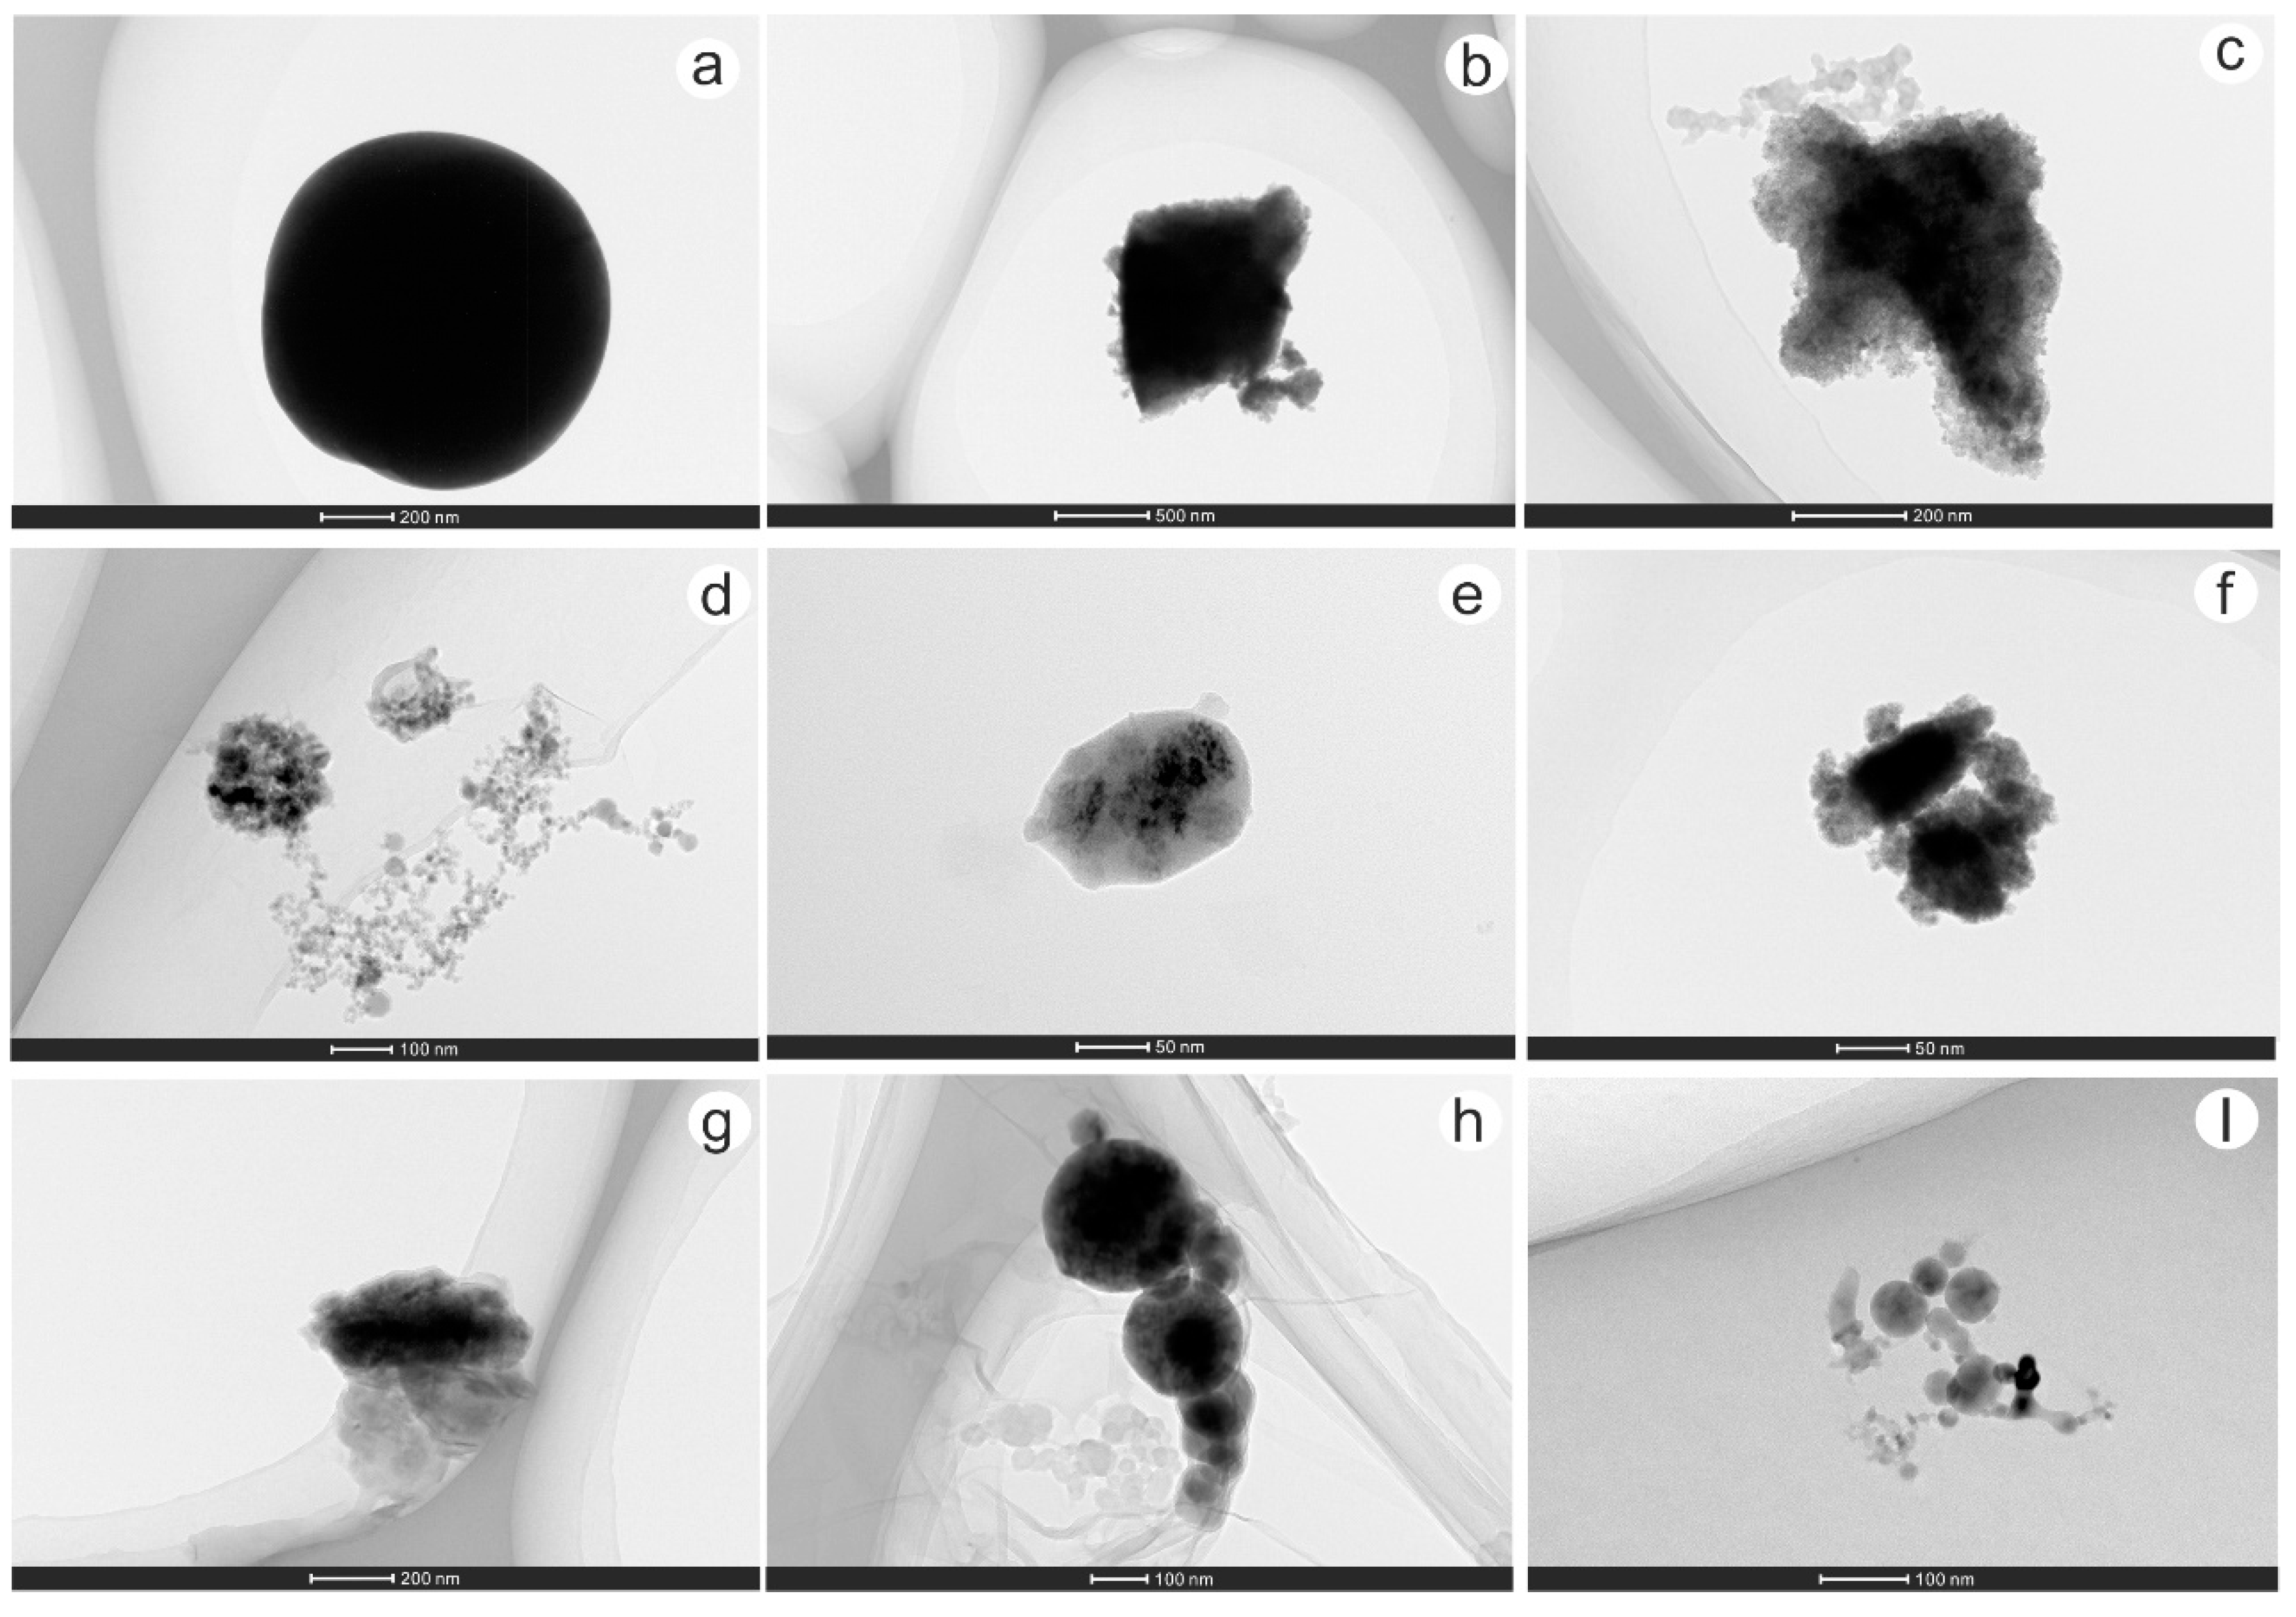
Fe-bearing particles are the most common metal-bearing particles in the studied soil samples and some of them are attached by clay minerals. Figure 6 shows some Fe-bearing particles. Most of them are adsorbed to clay minerals (Table 1, ID: 10, 11, 12, 13; Figure 6d–g) or carbon-bearing particles (Table 1, ID: 14, 15; Figure 6h,I) and some of them appear aggregations (ID: 10, 12, 14, 15; Figure 6d,f,h,i). Besides, numerous Ca-, Ba-, Ti-, and Na-bearing nanoparticles (Table 2, ID: 16–21; Figure 7a–f) occur in soils, most likely in the form of CaCO3, BaSO4, TiO2, and NaCl. In addition, many quartz, amorphous carbon, organic matter, and clay nanoparticles were observed in soils, which indicates that these particles prevail in the studied soils.
4.1.2. Nanoparticles in Fault Gouges
Figure 8a shows an Au-bearing particle aggregation in fault gouges, approximately 200 nm in size and roughly circular in shape. The particle aggregation (Table 3; ID:22) contains Fe (87.44%), Mn (3.06%), Cu (1.10%), and Au (0.33%). Figure 8b shows another Au-bearing particle in fault gouges. The particle (Table 3; ID:23) contains Mn (54.24%), Fe (6.28%), and Au (0.23%). There are still four other particles contain Au in fault gouges, but the gold content of all these Au-bearing particles is very low.
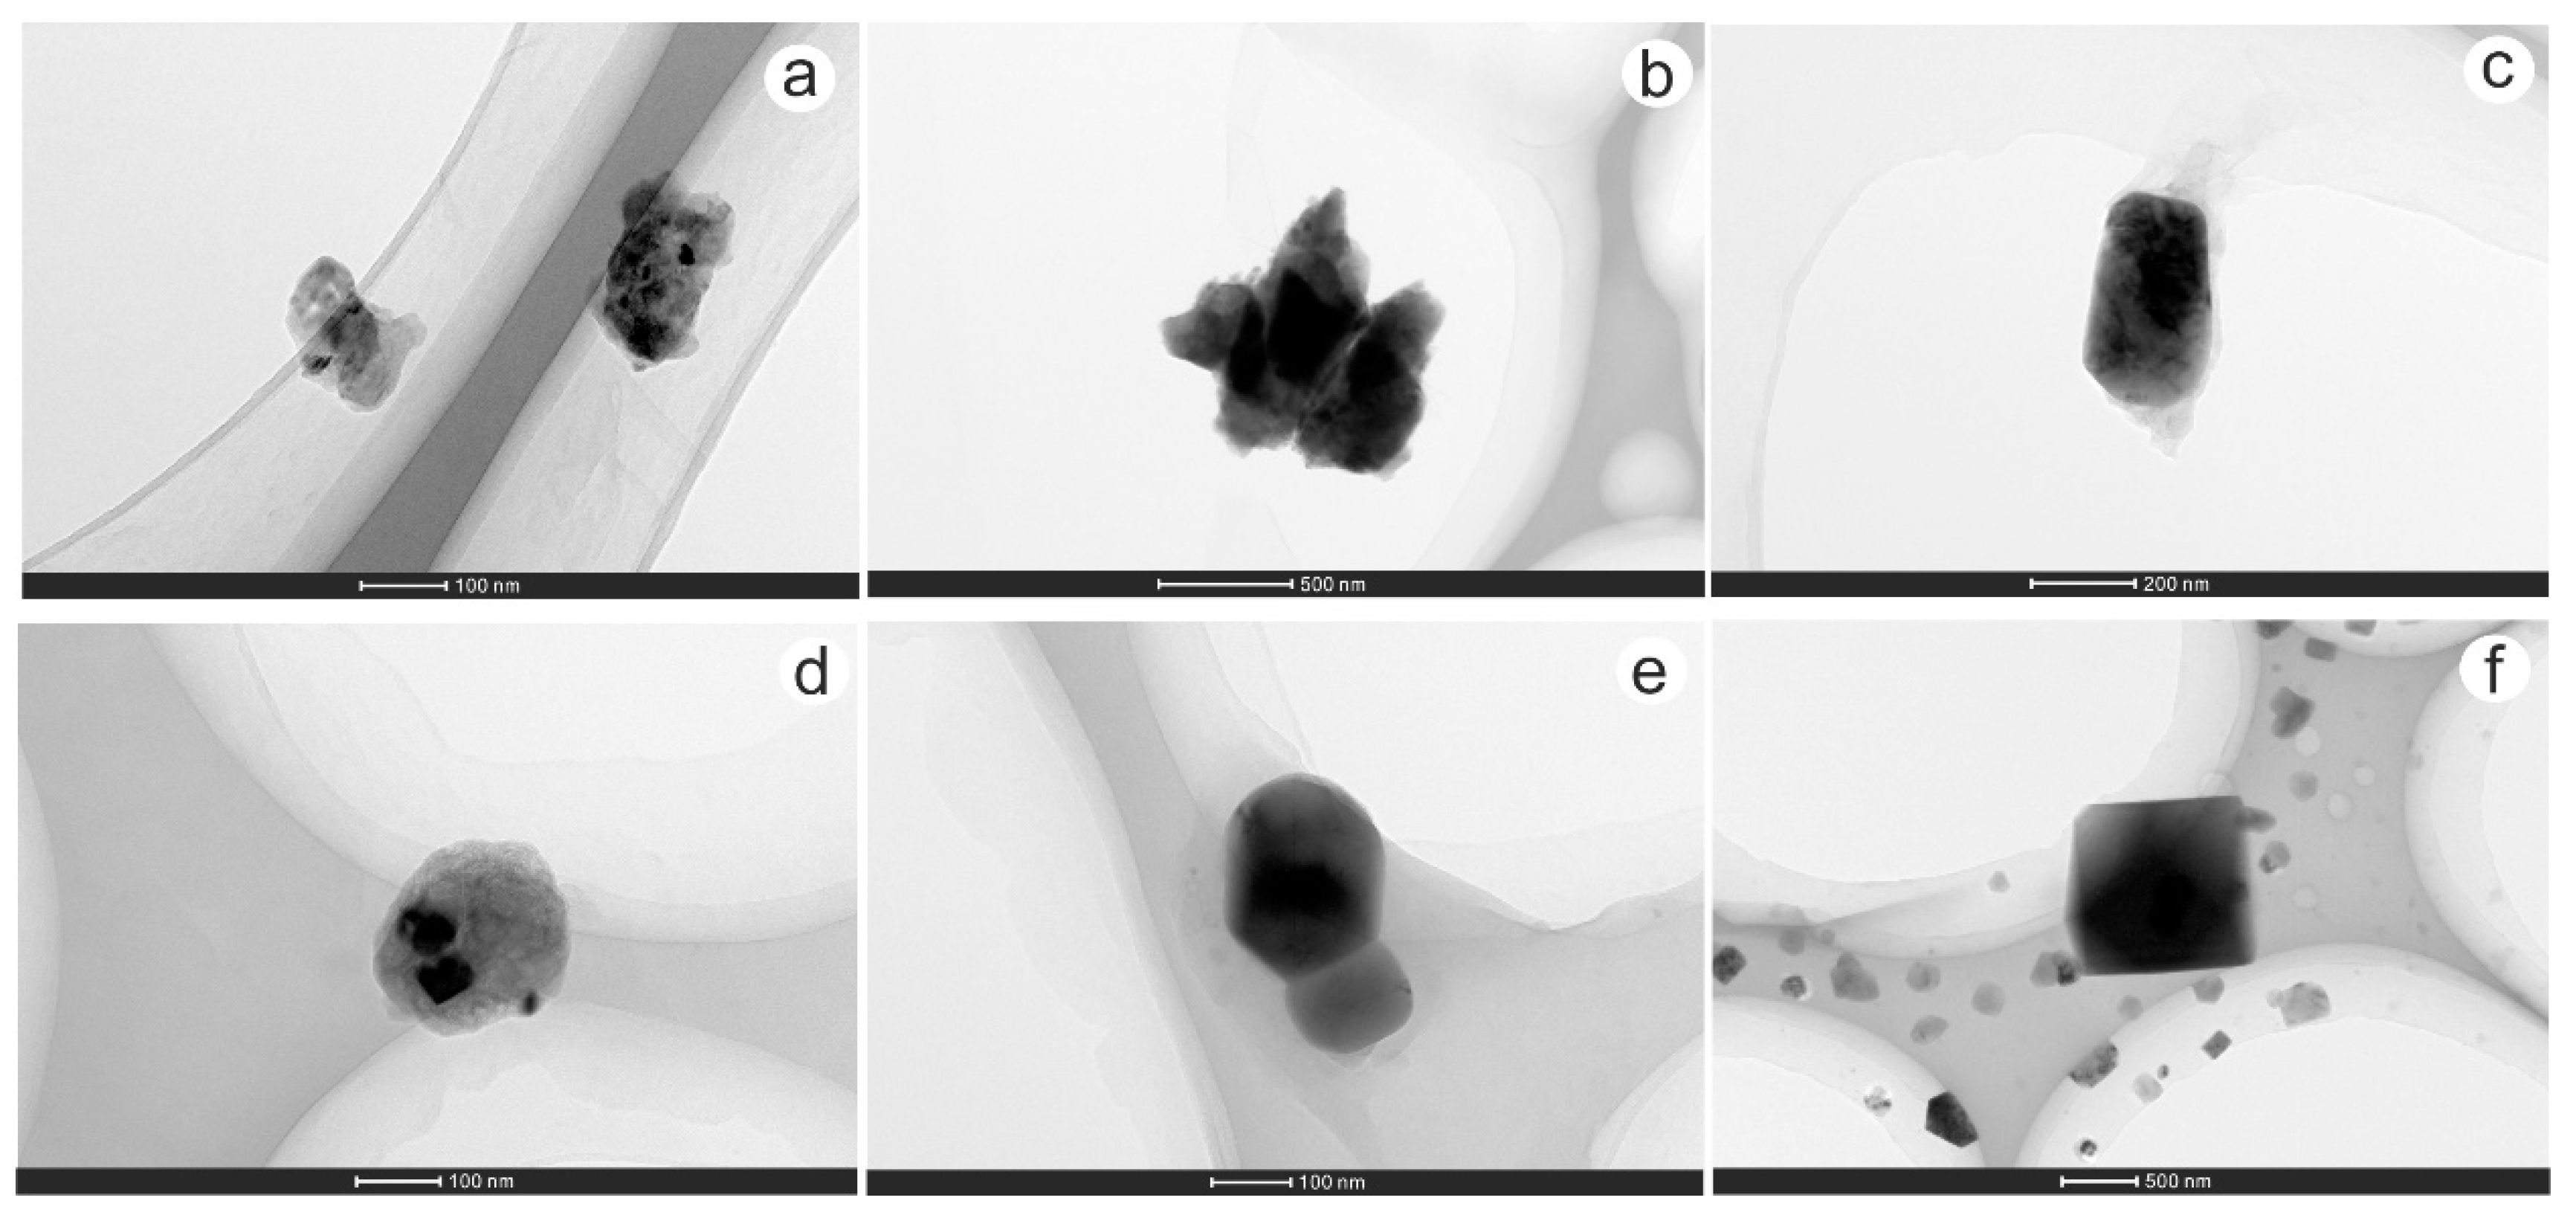
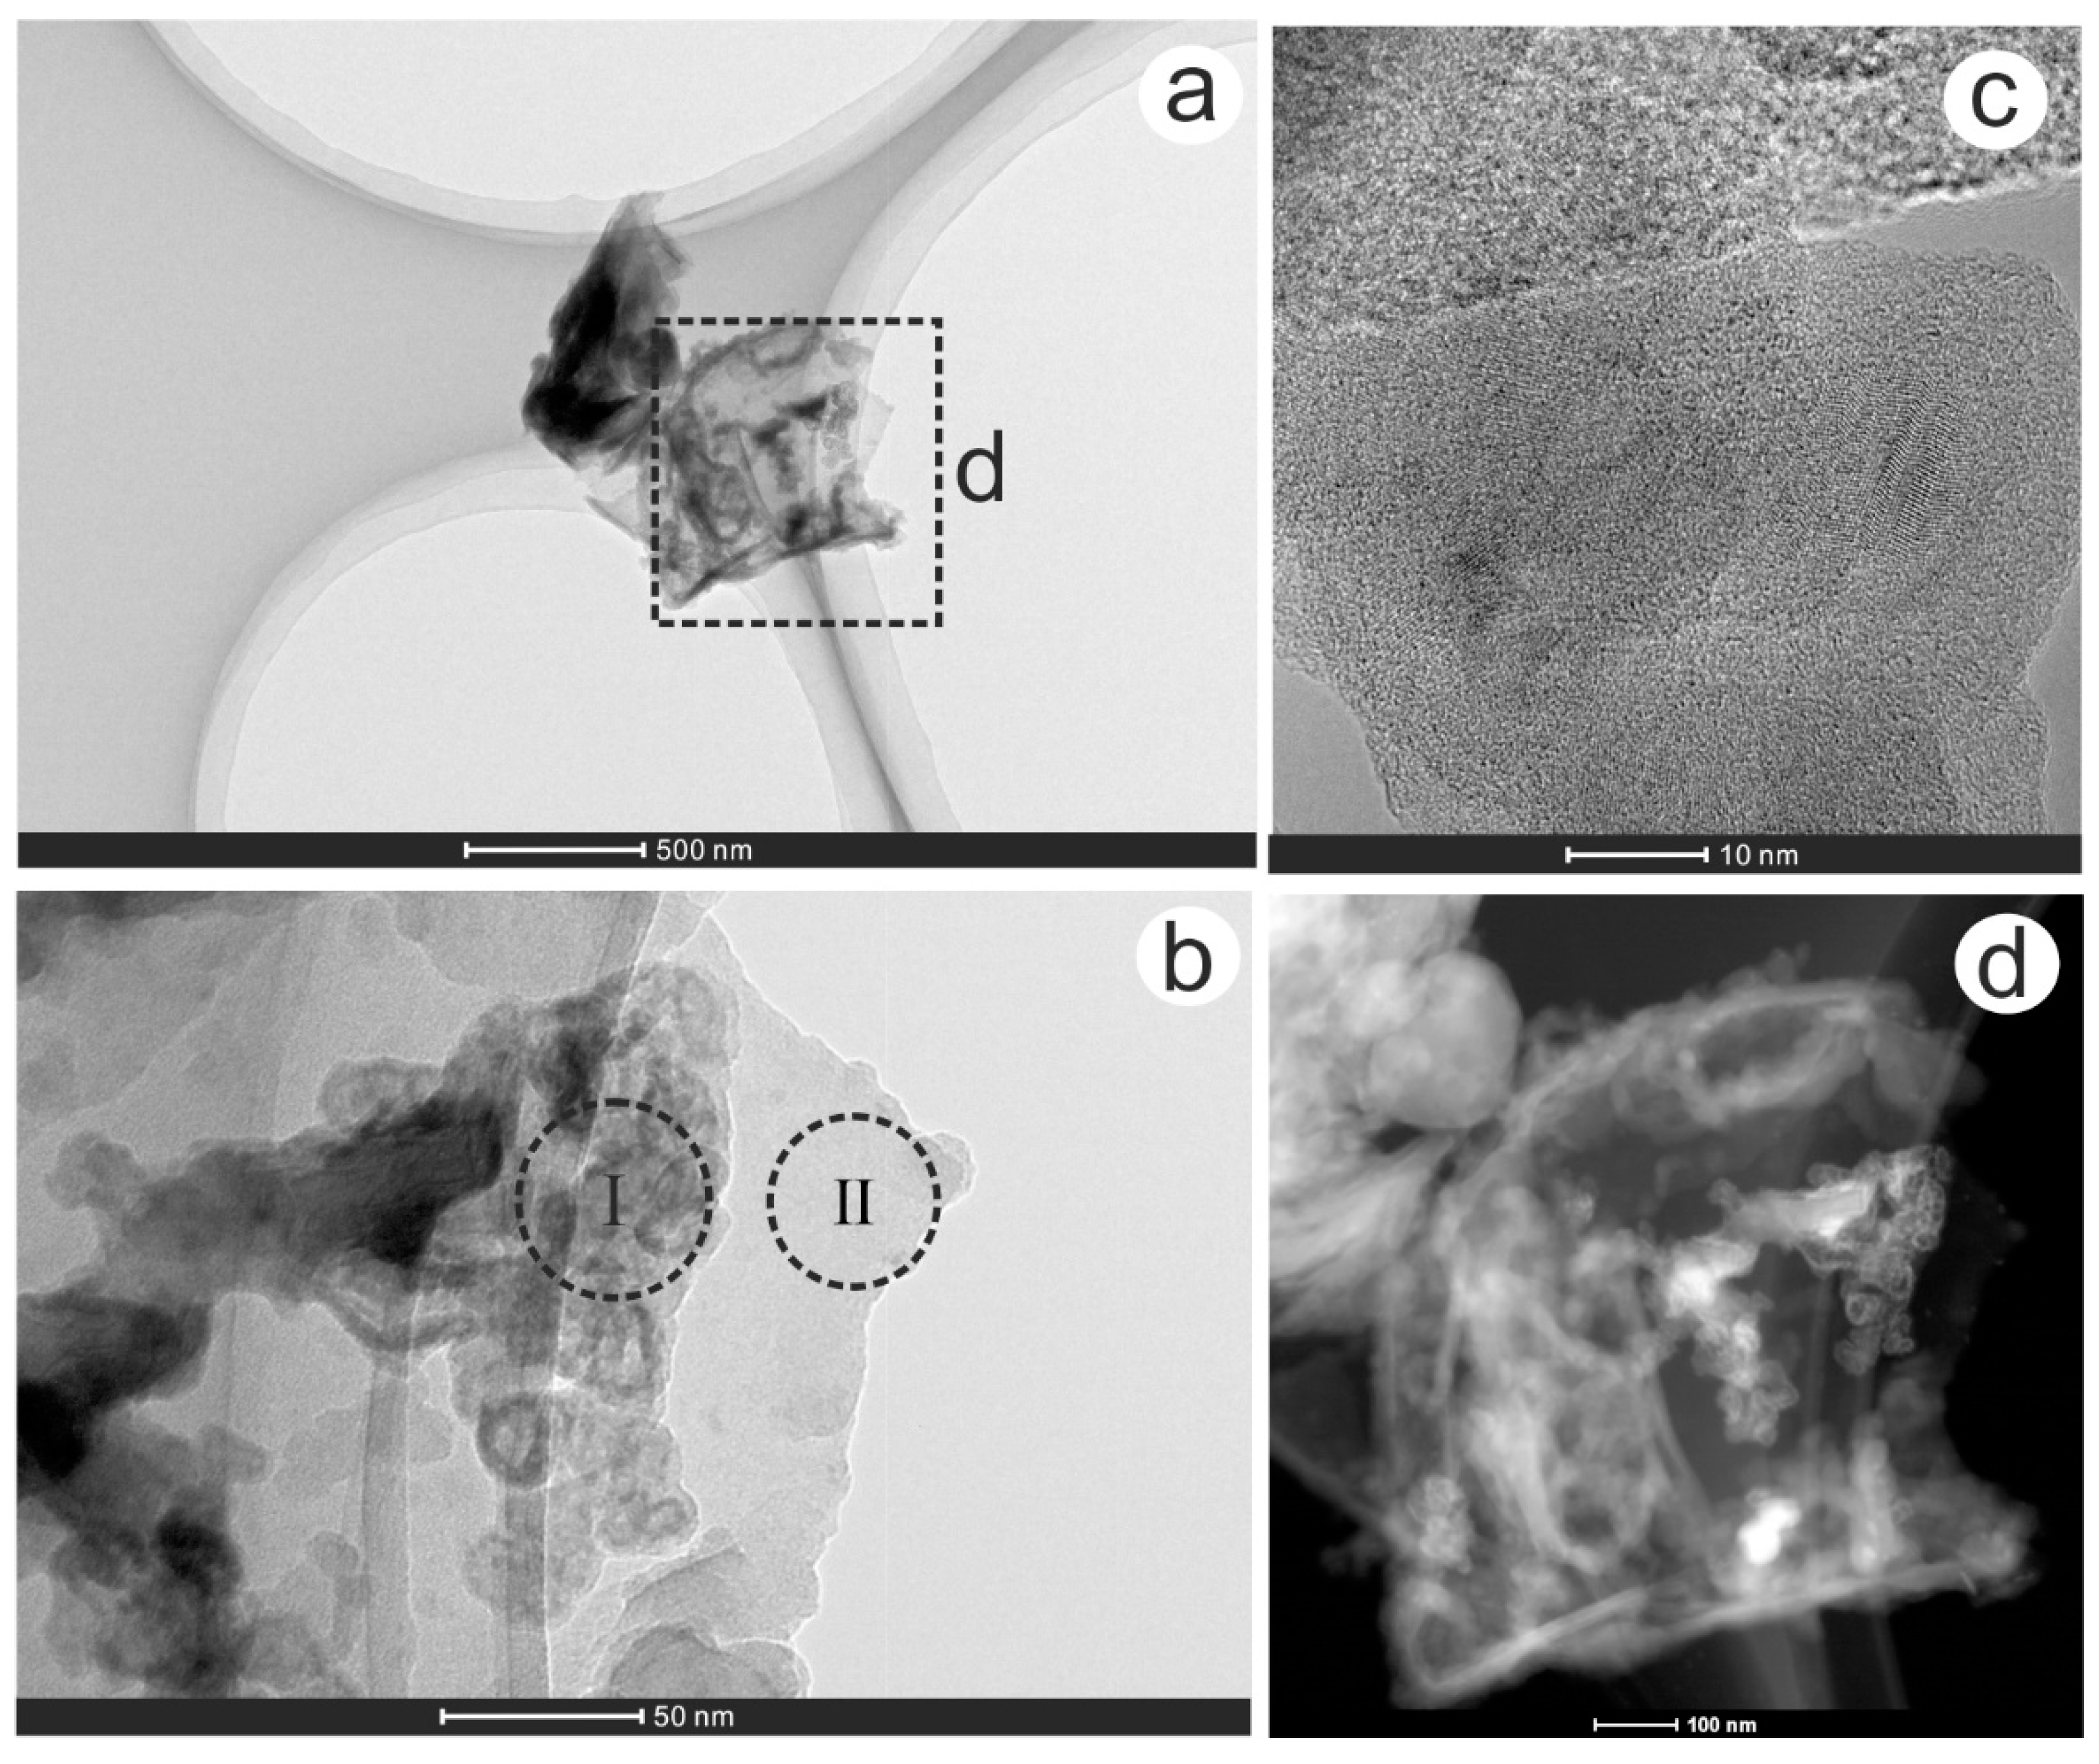
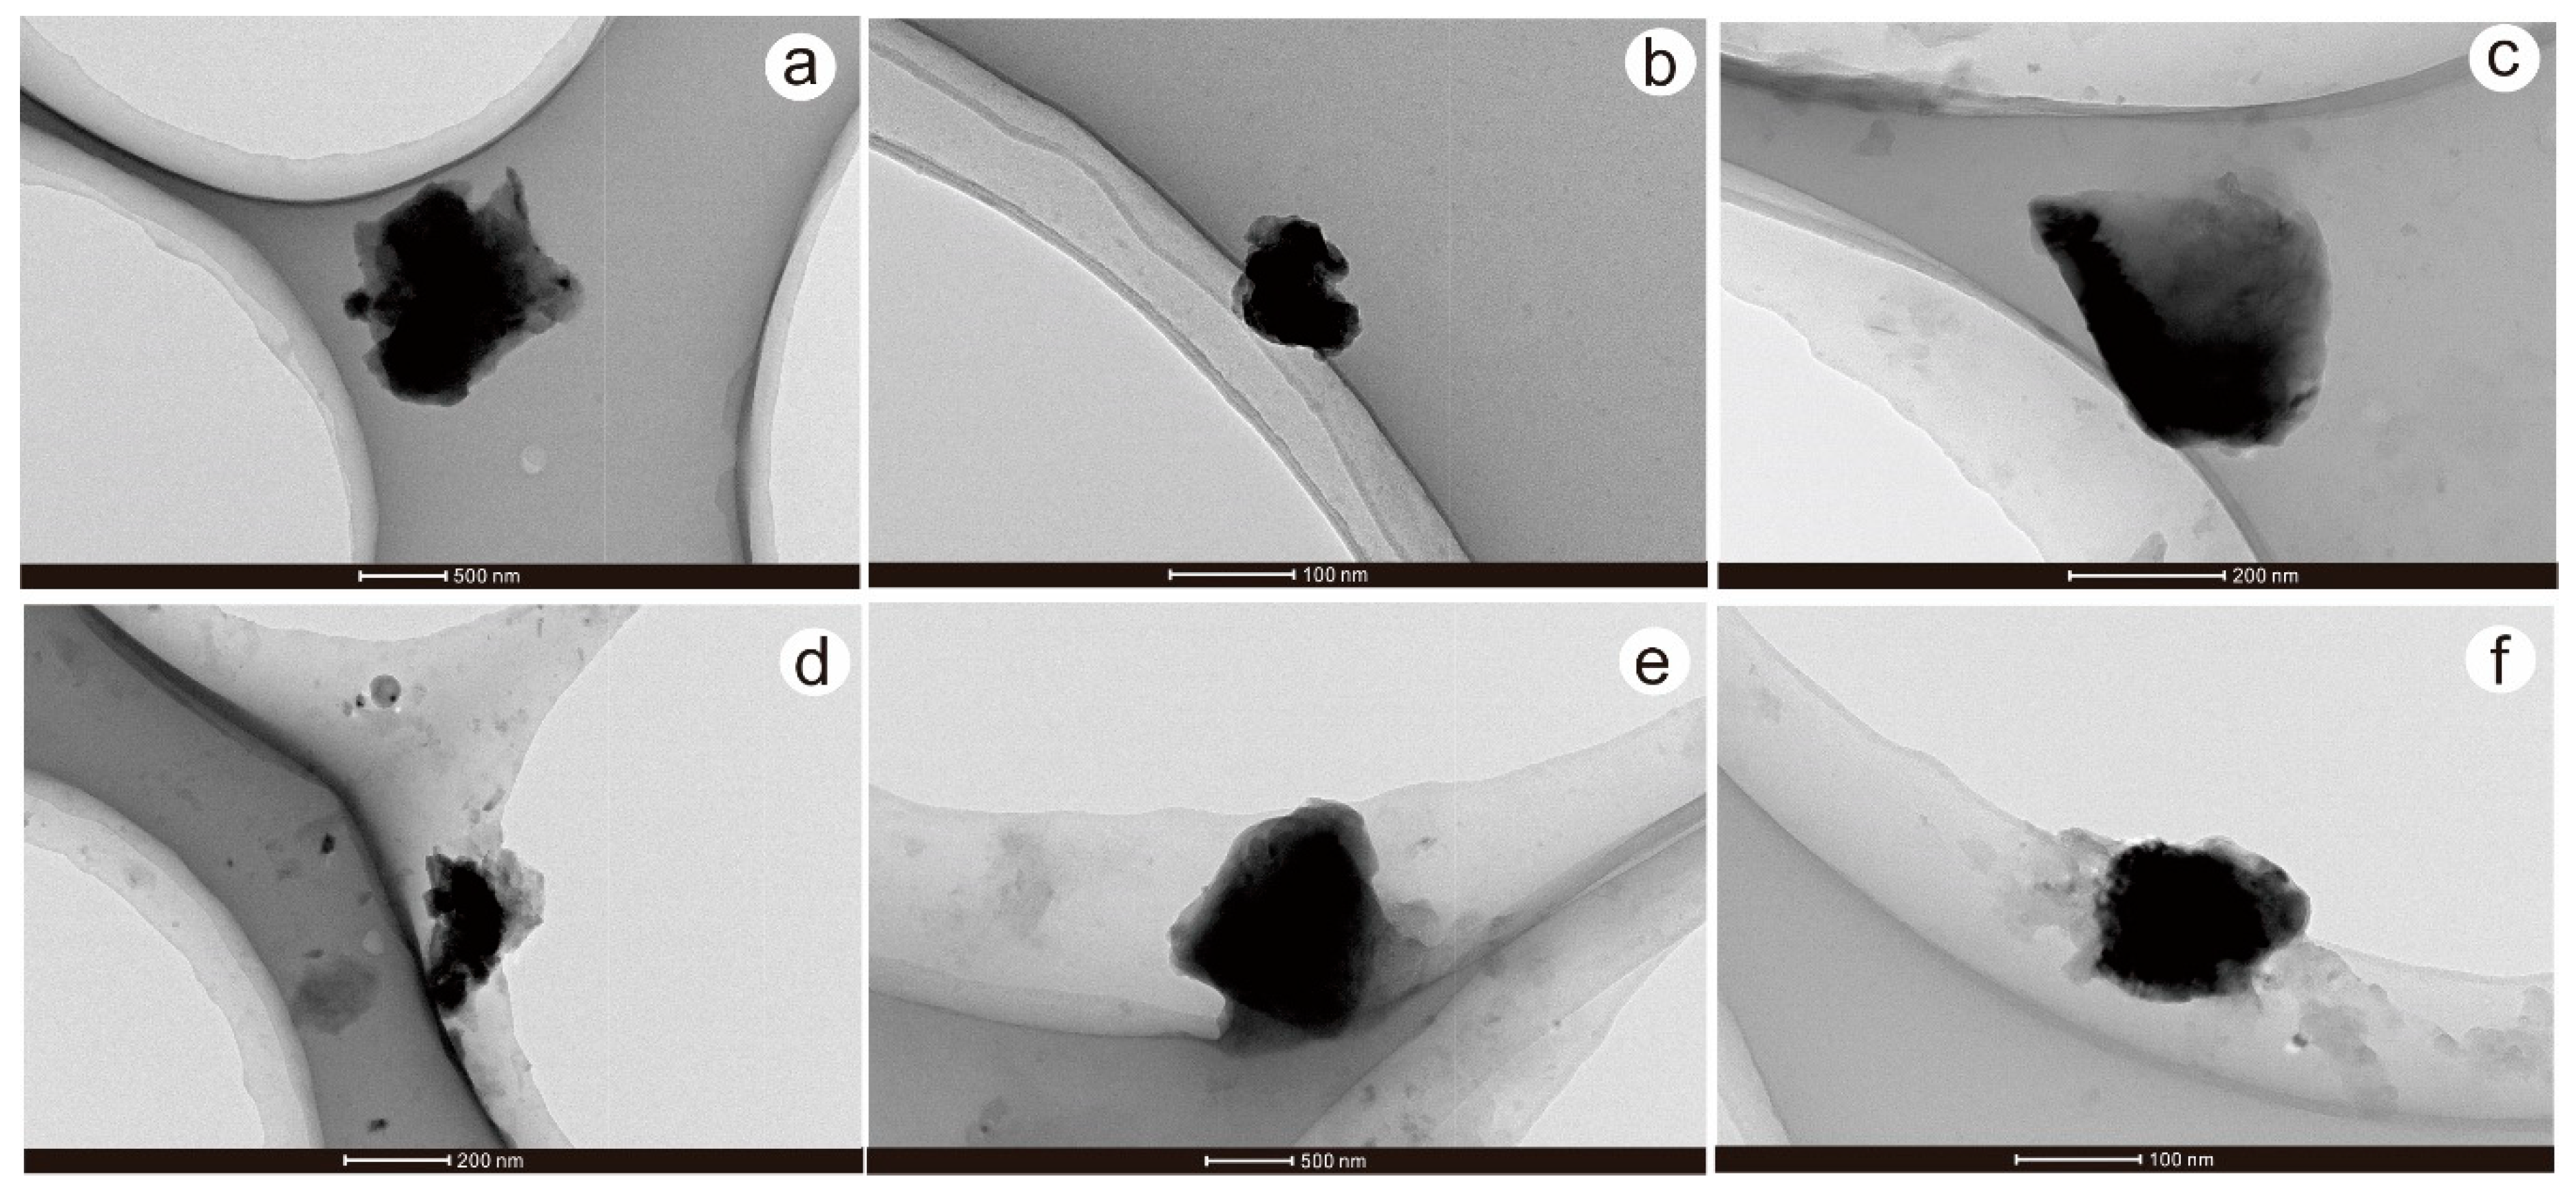
Numerous Cu-, Pb-, and Zn-bearing particles were observed in the fault gouge samples. Figure 9a shows a Cu-bearing particle in the fault gouges. The particle exhibits an irregular shape with a diameter of approximately 1000 nm. The EDX results (Table 3; ID:24 (I)) show the particle contains Cu (45.19%), S (16.73%), Si (11.97%), Al (8.46%), and O (14.83%) in area I (Figure 9b). The EDX results (Table 3; ID:24 (II)) show the particle contains Cu (3.10%), Si (31.28%), Al (20.90%), and O (42.12%) in area II (Figure 9b). It indicates that some copper sulfide or copper oxide nanoparticles are adsorbed by clay minerals, which also can be inferred from the STEM-HAADF image (Figure 9d). The HRTEM image (Figure 9c) shows that the small Cu-bearing nanoparticle has a clear crystal face, indicative of its crystalline nature. Figure 10a also shows a Cu-bearing particle (Table 3; ID: 25), which contains Cu (10.15%), Fe (14.92%), Al (19.68%), Si (15.41%), S (4.14%), and O (32.09%). It reveals some Cu-, Fe-bearing sulfide or oxide nanoparticles that are adsorbed to clay minerals. Figure 10b,c shows two Zn-bearing particles. The Zn content (Table 3; ID: 26, 27) is higher than 26% and S are higher than 17%. Figure 10d–f shows three Pb-bearing nanoparticles. The EDX results (Table 3; ID: 28, 29, 30) indicate that these three particles are composed of a lead oxide particle, a lead sulfide particle, and a native lead particle.
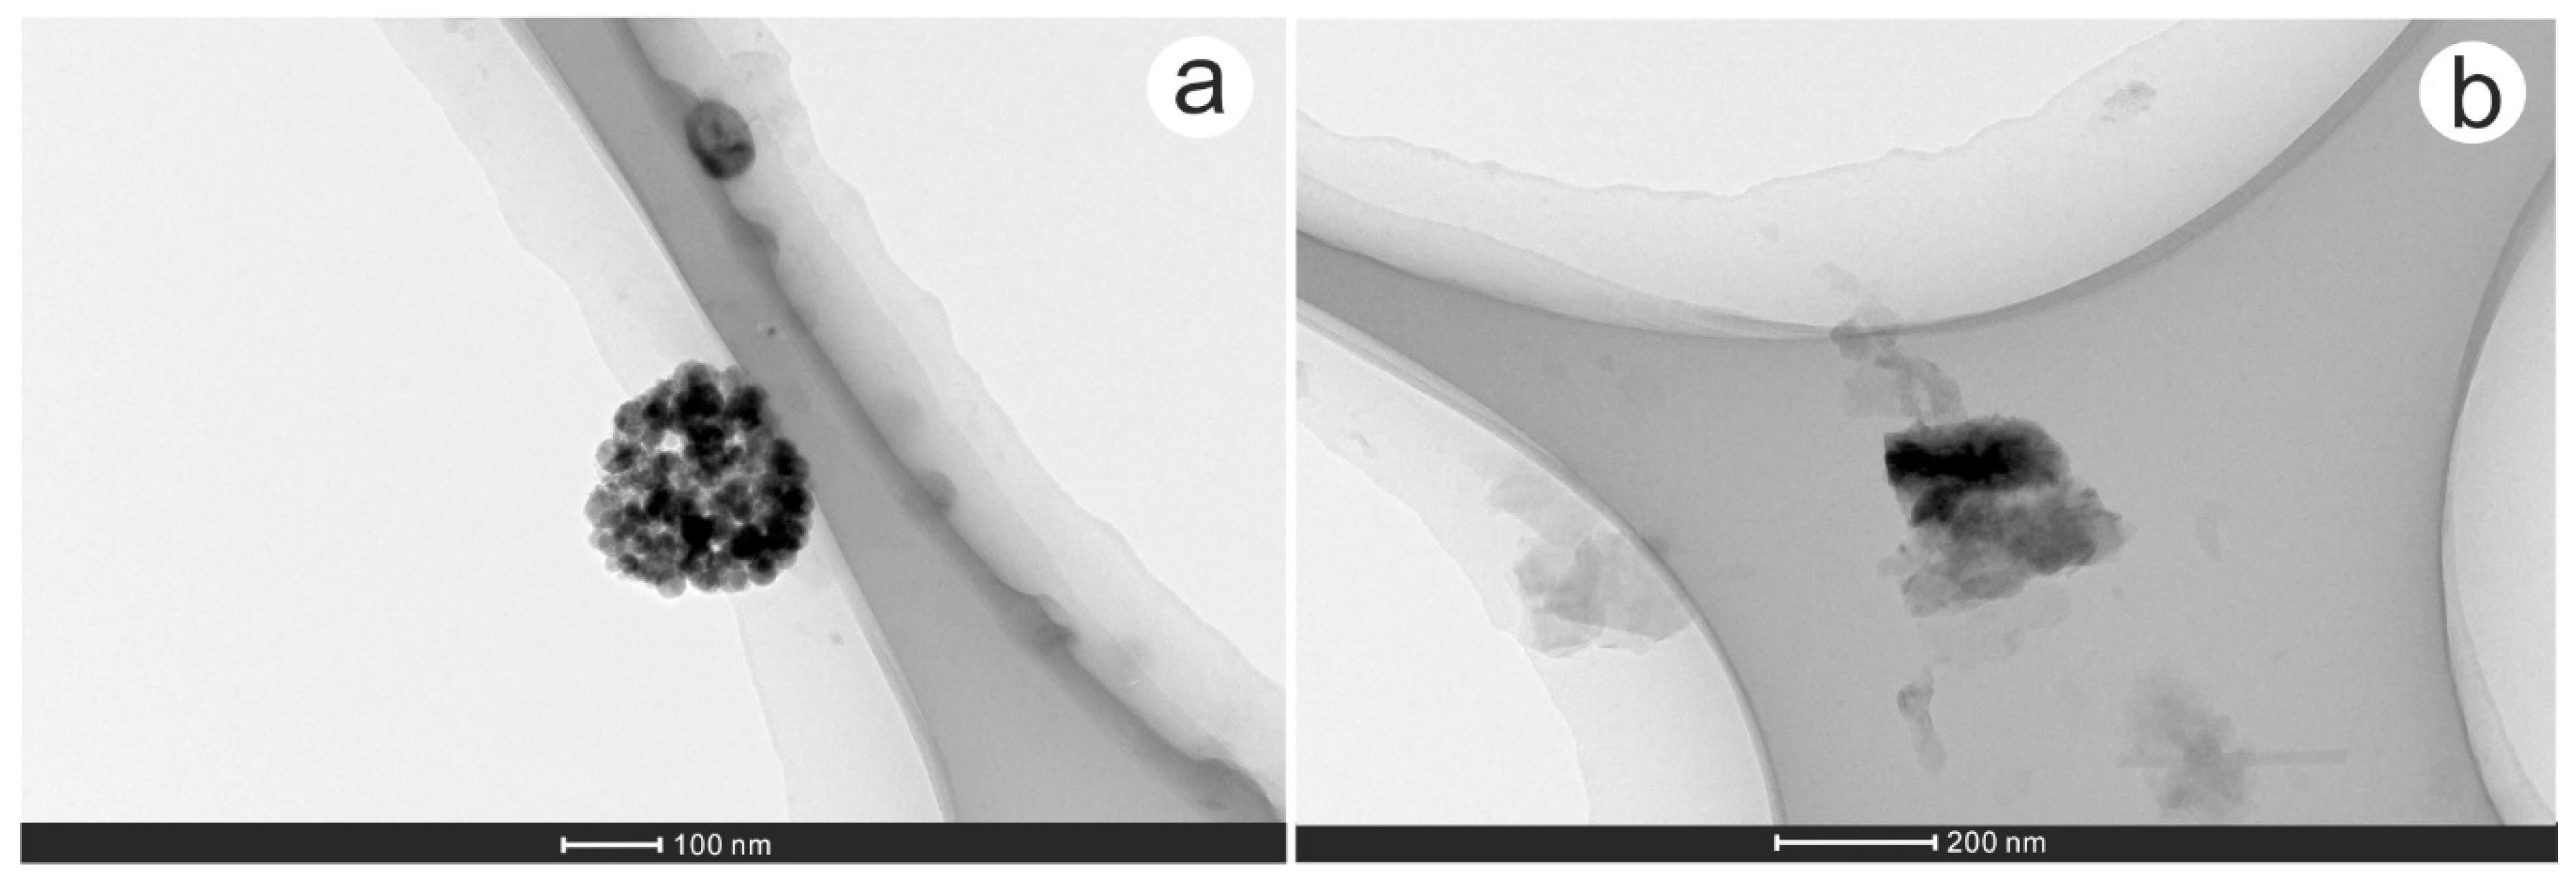
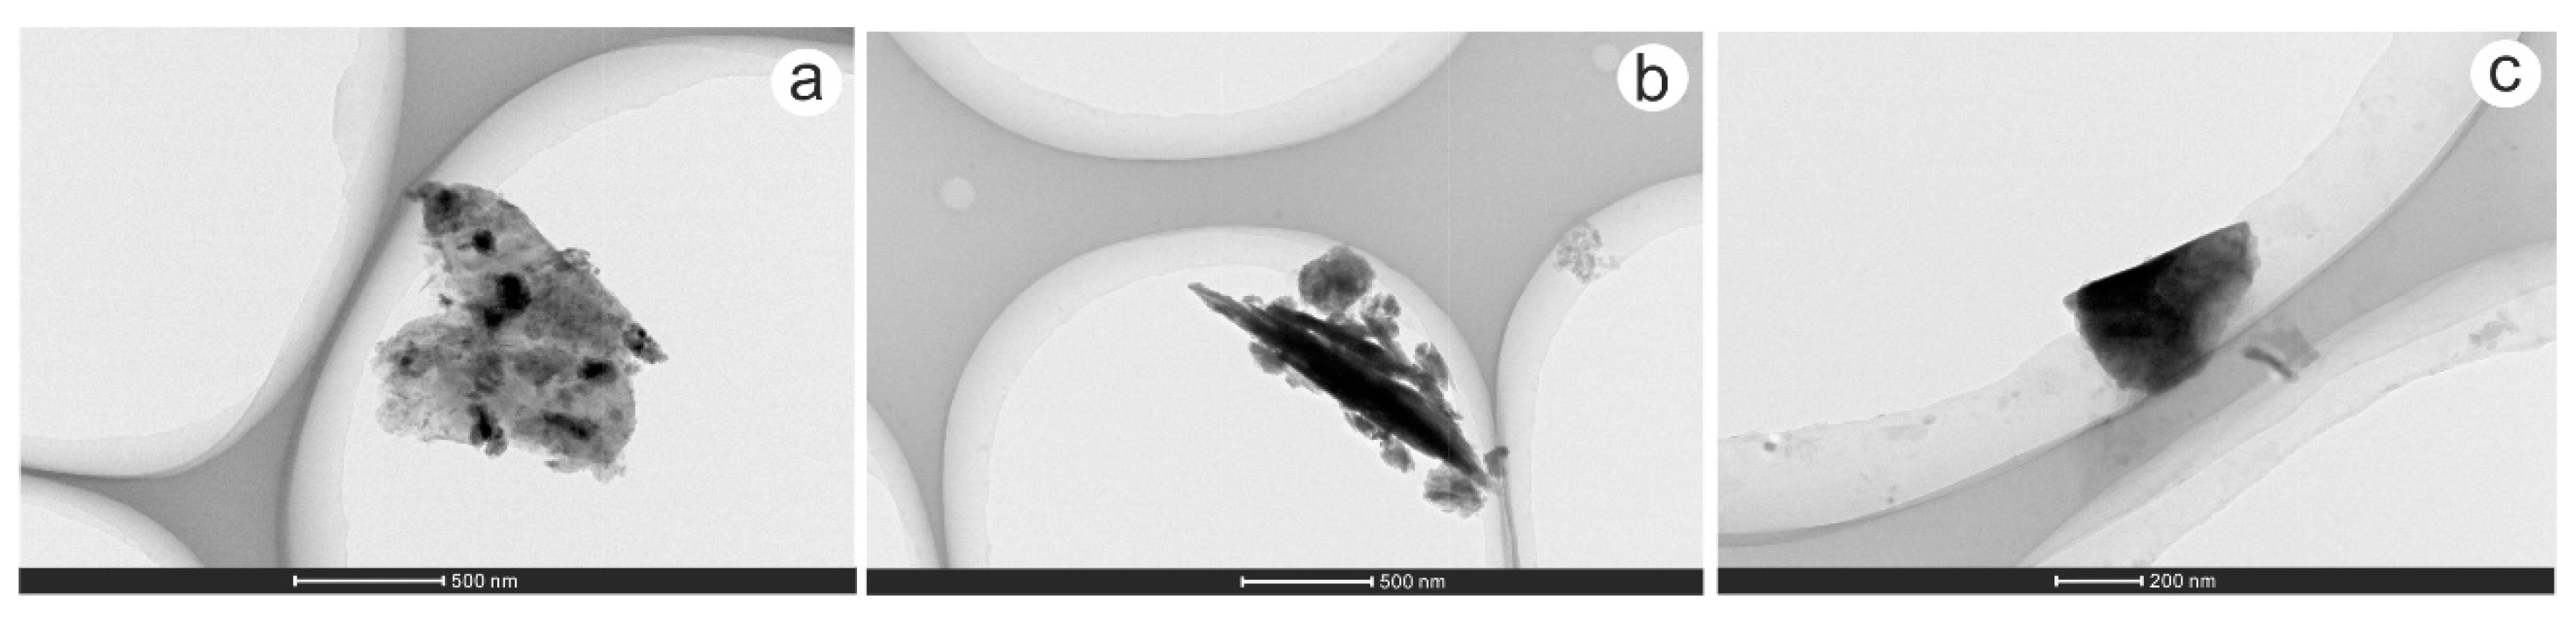
Fe-bearing particles also abound in the studied fault gouges. Most of Fe-bearing particles are adsorbed to clay minerals (Figure 11a,b; Table 3, ID: 31, 32). Figure 11c shows an Fe-bearing nanoparticle observed in fault gouges. The EDX results (Table 3; ID:33) show the particle contains Fe (52.25%) and S (38.13%), which indicates it is an independent pyrite particle. In addition, clay nanoparticles are also numerous in the studied gault gouges samples.
4.2. Nanoparticles in the Geochemical Background Area
More than 50 nanoparticles were investigated in the background soil samples. Most of them are Fe-, Al-, Si-, Ca-, Ti-, and Ba-bearing nanoparticles. Although a few particles contain Cu, Pb, and Zn, the content of these ore-forming elements are usually lower than 1%. Hematite, clay minerals, quartz, and amorphous carbon particles are the most common nanoparticles observed in background soil samples.
4.3. The Concentration of Ore-Forming Elements in Soil Samples, Fault Gouge Samples, and Ore Samples
The ore-forming chemical element concentrations in various media are displayed in Table 4. The mean value of Au reaches up to 3520 ng/g in the ore samples. By contrast, the mean value of Au in fault gouge samples is 429 ng/g, in soil samples over the concealed ore bodies is 14.1 ng/g, and in soil samples from background area is 2.28 ng/g. The results show that Au concentrations are the highest in ores, which is followed by fault gouge material, soils over concealed ore bodies, and soils from background area. Silver, Cu, Pb, Zn, As, Sb, and Hg have the same distribution pattern as Au.
5. Discussion and Conclusions
5.1. Comparison of Metal-Bearing Nanoparticles in Soil and Fault Gouge Samples in the Studied Gold Mining Area
TEM analysis shows that nanoparticles are widespread in the soil and fault gouge samples collected in the studied gold mining area. Comparing the particles from these two different media, we found there were several common features. The nanoparticles, especially the metal-bearing nanoparticles, exhibit distinct features in shape, structure, component, and form of polymerization. The size of these particles ranges from several nanometers to more than 100 nanometer and their shape is ellipse, sphere, hexagon, schistose, or irregular. The metal-bearing nanoparticles tend to attach to the surface of clay minerals and amorphous carbon. In addition, numerous Cu-, Pb-, and Zn-bearing particles, as well as particles containing other metal compounds, occur in the soil and fault gouge samples collected at the deposit. Fe-bearing particles are the most common metal-bearing particles and a small number of Au-bearing particles also occur in samples. Most of the metal-bearing nanoparticles have internal ordered crystal structure.
At the same time, some differences between the metal-bearing particles in these two media have also been presented in this study. Firstly, nano-scale sulfides occur in the fault gouge samples, such as copper sulfide (Table 3; ID: 24, 25), lead sulfide (Table 3; ID: 29), zinc sulfide (Table 3; ID: 26, 27), and iron sulfide (Table 3; ID: 26, 29, 33). Metal-bearing particles mainly occur in the form of oxide in the studied soils, such as copper oxide (Table 1; ID: 1, 2, 5), lead oxide (Table 1; ID: 3), zinc oxide (Table 1; ID: 3, 4, 6), and iron oxide (Table 1; ID: 7–15). Secondly, the nanoparticles tend to form aggregate clusters in soils (Figure 5a,c; Figure 6c,d,f,h,i) and the nanoparticles in the fault gouge samples tend to occur as single particles. Thirdly, Au-, Cu-, Pb-, Zn-, and Fe-bearing particles in the fault gouges have better-defined crystal shape than in soils. The particles in the soil samples tend to exhibit a rounded or sub-rounded shape.
5.2. Comparison of Nanoparticles in Soil Samples in the Mining Area and in the Background Area
Fe-, Al-, Si-, Ca-, Ti-, and Ba-bearing nanoparticles commonly occur in the geochemical background of the studied gold mining area. Hematite, clay mineral, quartz, and amorphous carbon particles are the most common nanoparticles in samples. The main difference is that the Au-, Cu-, Pb-, and Zn-bearing nanoparticles are frequently observed in samples from the mining area and are very rare in samples from background area. Although a few particles contain Cu, Pb, and Zn, the contents of these ore-forming elements are very low.
5.3. Migration Mechanism of Metallic Nanoparticles from Mineralized Bodies to Earth’s Surface
Understanding the mechanisms and their effectiveness in transferring ore-related metals upwards through the sedimentary cover are very important for the mineral exploration of areas with thick sediment cover [1]. Since element migration through sediment cover is a slow and complex process, the mechanism is still not fully understood, especially for allochthon cover, or for a thick sequence of various overlying post-mineralization rocks and regolith. It is generally thought that trace elements are transported from ore bodies to the earth’s surface by one or more mechanisms [2]. The migration mechanisms include groundwater flow, capillary action, ionic diffusion, self-potential effect, vaporization, biological processes, and transportation by gases [1,2]. Because the movement of ions and particles through the sediment cover is upwards against gravity, a medium and a force are necessary to cause the upward transport of metals [1]. The transporting medium can include gas, water, and mineral particles and the transporting force can include pressure, concentration, electrical, and temperature gradients.
The migration mechanism of transportation by geogas has been proposed and studied for decades [3,9,12,18,56,57,58]. Nano-scale metal-bearing particles can be adsorbed onto the surfaces of gas bubbles and migrate with the bubbles upwards. The geogas may be derived from the atmosphere and driven to the surface by barometric pumping [15], be released from the ore minerals, or derived from mantle degassing. As mentioned in the first part of this paper, numerous metal-bearing nanoparticles have been observed in geogas samples [12,30,31,32,33,34,35,36,37,38,39,40,41]. However, answering the questions whether the element anomalies in soils are caused by particles transported by geogas and whether the ore-forming elements in soils occur in the form of nanoparticles need more research.
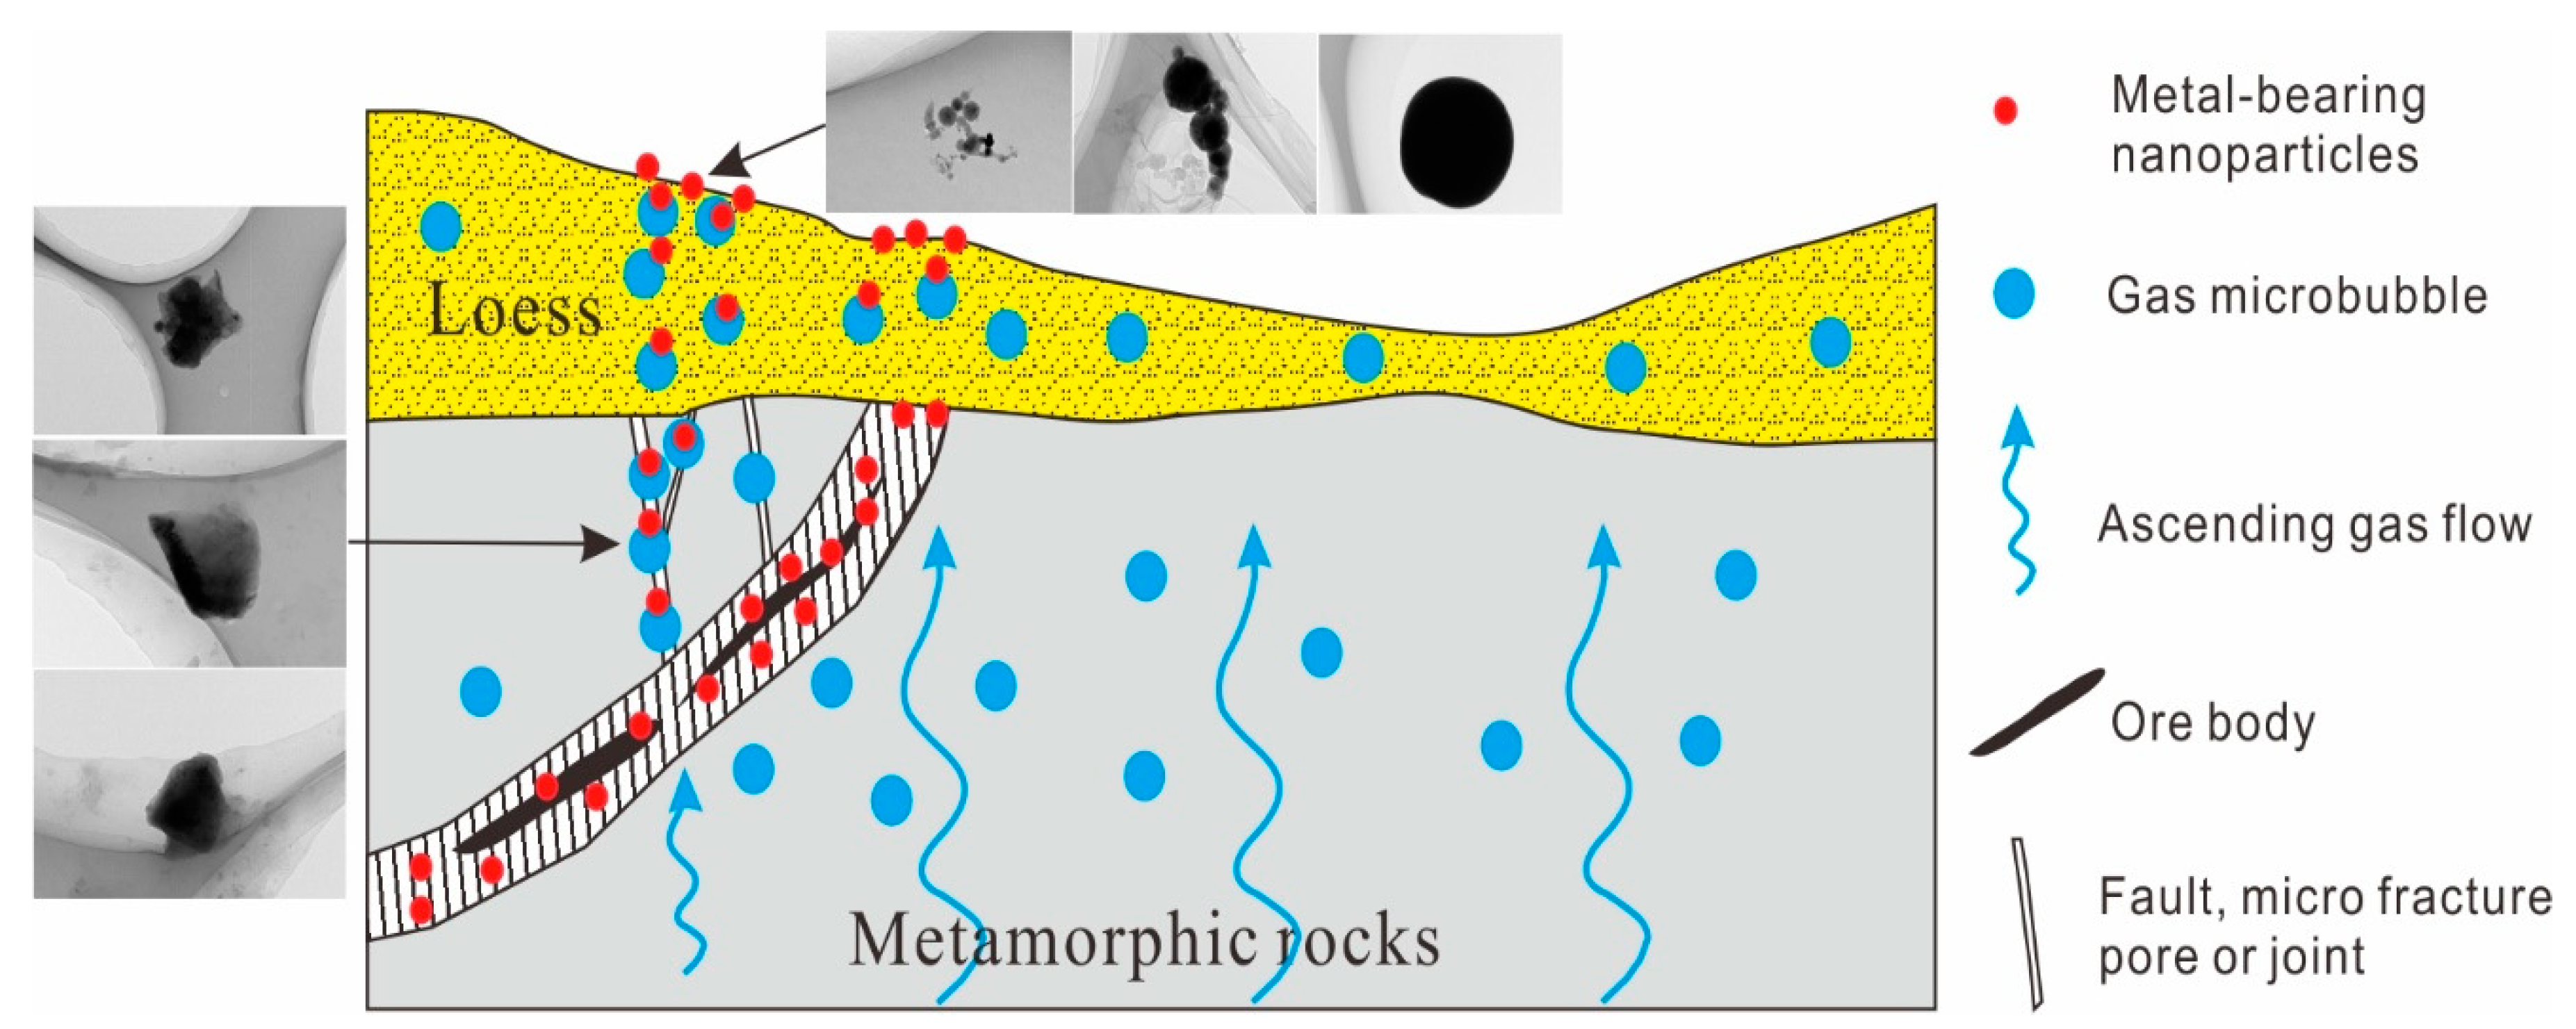
In this study, numerous Cu-, Pb-, and Zn-bearing particles, as well as a small number of particles containing Au, were identified in the soil samples collected in the studied gold mining area. Most of the metal-bearing nanoparticles have internal ordered crystal structure. Only a few particles contain Cu, Pb, and Zn, and the content of these ore-forming elements are very low in the studied nano-particles. The chemical analysis results show that the concentration of ore-forming elements in soils from the mining area are higher than in soils from the geochemical background area. Besides, the concentration of ore-forming elements in ore and fault gouge samples is much higher than in soil samples. It is assumed, therefore, that the higher concentrations of trace elements in soils from the mining area are due to the vertical migration of ore-forming elements with geogas after mineralization processes and very high concentrations of ore-forming elements in the fault gouge are, by contrast, mainly due to the migration of ore-forming elements with ore-forming fluids along the fault or fracture in or after the mineralization processes. Lu et al. [25] carried out a geogas prospecting experiment in the same study area. The experiment showed that clear Au anomalies occur in geogas samples over the concealed ore bodies. Besides, Au, Cu-, and Ag-bearing nanoparticles were also observed in geogas in Lu et al.’s study [25]. Because the soils in the mining area and in the background area are loess which are all from the same source and very homogeneous, the results clearly indicate that the ore-forming elements with high concentration in soils and geogas can only come from deep-seated ore bodies. Besides, the results also lead us to give a speculation that the ore-forming elements with high concentration in soils and geogas actually occur in the form of nanoparticles. At the same time, we can further conclude that geogas is a very important transfer medium for the vertical migration of metal-bearing nanoparticles. In addition, through comparison of the metallic nanoparticles from soils and fault gouges in the mining area, it can be inferred that the studied fault is a migration channel for ore-forming elements. It is assumed that the metallic nanoparticles in the fault gouge will further migrate into surface soils. The sulfides will turn into oxides. The crystal shape will be rounded. The nanoparticles will tend to aggregate in clusters. Based on the discussion above, a migration model of the ore-forming elements is shown in Figure 12. As reported by several studies, mineralization processes and late oxidation in deep orebodies formed metal-bearing nanoparticles [59,60,61,62]. Nanoscale particles have large specific surface areas that enable them to migrate with all kinds of geological fluids and be adsorbed by microbubbles and vertically migrate with air currents [33]. Faults, micro fractures, pores, and joints provide the migration channels for nanoparticles [40,63].When arriving at the surface, some of these metal-bearing particles would be trapped by soil geochemical barriers such as clays, oxide coatings, and colloids [33].
Besides, through this study, we found that many metal-bearing nanoparticles adsorb to the surface of clay minerals. Because clay minerals are very fine and occur in the fine fraction of soils, it provides a theoretical support for us to use fine fraction soil as sampling media to carry out geochemical exploration in covered terrains. Finally, based on the comparison of the nanoparticles from the mining area and the background area, we found that the metal-bearing nanoparticles are very different between these two areas. Many nanoparticles containing ore-forming elements were observed in soils collected in the mining area. It gives us an enlightenment to seek a new geochemical method through microscopic observation for mineral exploration in covered area.
Author Contributions
X.W. and B.Z. conceived and designed the experiments; H.L. and H.W. collected the samples, Z.H. and H.F. performed the TEM experiments, B.Z. and Z.H. analyzed and wrote the paper, Z.H. and H.F. modified the manuscript.
Funding
This research was financially supported by the State Key Research & Development Project (2016YFC0600602), National Natural Science Foundation of China (41573044) and Special Scientific Research Fund of Public Welfare Profession of China (201511034) for the financial support.
Acknowledgments
Special thanks are given to related people and departments involved in this research. Sincere gratitude is extended to the editors and reviewers for the handling and reviewing of the manuscript. We also thank Gyozo Jordan for his comments and language modification. Constructive comments are of great help in improving the manuscript. Assistant Editor Heather Wu is acknowledged for handling the review process.
Conflicts of Interest
The authors declare no conflict of interest.
References
- Anand, R.R.; Aspandiar, M.F.; Noble, R.R.P. A review of metal transfer mechanisms through transported cover with emphasis on the vadose zone within the Australian regolith. Ore. Geol. Rev. 2016, 73, 394–416. [Google Scholar] [CrossRef]
- Wang, X.; Zhang, B.; Lin, X.; Xu, S.; Yao, W.; Ye, R. Geochemical challenges of diverse regolith-covered terrains for mineral exploration in China. Ore. Geol. Rev. 2016, 73, 417–431. [Google Scholar]
- Malmqvist, L.; Kristiansson, K. Microflow of geogas—A possible formation mechanism for deep-sea nodules. Mar. Geol. 1981, 40, M1–M8. [Google Scholar] [CrossRef]
- Malmqvist, L.; Kristiansson, K. Experiment evidence for an ascending micro-flow of geogas in the ground. Earth. Plant. Sc. Lett. 1984, 70, 407–416. [Google Scholar] [CrossRef]
- Bradshaw, P.M.D.; Thomson, I.; Smee, B.W.; Larsson, J.O. The application of different analytical extractions and soil profile sampling in exploration geochemistry. J. Geochem. Explor. 1974, 3, 209–225. [Google Scholar] [CrossRef]
- Clarke, J.R.; Meier, A.L. Enzyme leaching of surficial geochemical samples for defecting hydromorphic trace-element anomalies associated with precious metal mineralized bedrock buried beneath glacial overburden in northern Minneseta. In Proceedings of the Gold ’90 Symposium—Gold ’90, Salt Lake City, UT, USA, 26 February–1 March 1990; pp. 189–207. [Google Scholar]
- Mann, A.W.; Birrell, R.D.; Gay, L.M.; Al, E. Partial extraction and mobile metal ions. In Proceedings of the 17th IGES, Townsville, Australia, 15–19 May 1995; pp. 31–34. [Google Scholar]
- Clark, R.J. Innovative Enzyme Leach Provides. In Proceedings of the Exploration 97: Fourth Decennial International Conference on Mineral Exploration, Toronto, Canada, 14–18 September 1997; pp. 371–374. [Google Scholar]
- Wang, X.; Cheng, Z.; Lu, Y.; Xu, L.; Xie, X. Nanoscale metals in Earthgas and mobile forms of metals in overburden in wide-spaced regional exploration for giant deposits in overburden terrains. J. Geochem. Explor. 1997, 58, 63–72. [Google Scholar] [CrossRef]
- Mann, A.W.; Birrell, R.D.; Mann, A.T.; Humphreys, D.B.; Perdrix, J.L. Application of the mobile metal ion technique to routine geochemical exploration. J. Geochem. Explor. 1998, 61, 87–102. [Google Scholar] [CrossRef]
- Cohen, D.R.; Shen, X.C.; Dunlop, A.C.; Rutherford, N.F. A comparison of selective extraction soil geochemistry and biogeochemistry in the cobar area, new south wales. J. Geochem. Explor. 1998, 61, 173–189. [Google Scholar] [CrossRef]
- Chunhan, O.; Juchu, I.; Liangquan, E.; Fenggen, A. Experimental observation of the nano-scale particles in geogas matters and its geological significance. Sci. China Ser. D Earth Sci. 1998, 4, 325–329. [Google Scholar] [CrossRef]
- Wang, X. Leaching of mobile forms of metals in overburden: Development and application. J. Geochem. Explor. 1998, 61, 39–55. [Google Scholar]
- Kelley, D.L. The use of partial extraction geochemistry for copper exploration in northern Chile. Geochem. Explor. Environ. Anal. 2003, 3, 85–104. [Google Scholar] [CrossRef]
- Cameron, E.M.; Hamilton, S.M.; Leybourne, M.I.; Hall, G.E.M.; McClenaghan, M.B. Finding deeply buried deposits using geochemistry. Geochem. Explor. Environ. Anal. 2004, 4, 7–32. [Google Scholar] [CrossRef]
- Leybourne, M.I.; Cameron, E.M. Groundwater in geochemical exploration. Geochem. Explor. Environ. Anal. 2010, 10, 99–118. [Google Scholar] [CrossRef]
- Lintern, M.; Anand, R.; Ryan, C.; Paterson, D. Natural gold particles in Eucalyptus leaves and their relevance to exploration for buried gold deposits. Nat. Comun. 2013, 4, 2614. [Google Scholar] [CrossRef] [PubMed]
- Kristiansson, K.; Malmqvist, L. Trace elements in the geogas and their relation to bedrock composition. Geoexploration 1987, 24, 517–534. [Google Scholar] [CrossRef]
- Tong, C.; Liang, X.; Li, J. The tentative geogas survey in the Dongji gold deposit. Geophys. Geochem. Explor. 1992, 16, 445–451. [Google Scholar]
- Wang, X.; Xie, X.; Lu, Y. Dynamic collection of geogas and its preliminary application in search for concealed deposits. Geophys. Geochem. Explor. 1995, 19, 161–171. [Google Scholar]
- Wang, M. Progress in the collection of geogas in China. Geochem. Explor. Environ. Anal. 2008, 8, 183–190. [Google Scholar] [CrossRef]
- Wang, M.; Gao, Y.; Zhang, D.; Ren, T.; Liu, Y. Breakthrough in mineral exploration using geogas survey in the basin area of northern Qilian region and its significance. Geophys. Geochem. Explor. 2006, 30, 7–12. [Google Scholar]
- Tong, C.; Li, J. Geogas prospecting and its mechanism in the search for deep-seated or concealed gold deposits. Chin. J. Geophys. 1999, 42, 135–142, 145–146. [Google Scholar]
- Wang, Y.; Ye, R.; Zhang, B.; Yang, R.; Qi, F. The tentative geogas survey in the Jinwozi Concealed V210 gold deposit of Gobi area. Geophys. Geochem. Explor. 2012, 36, 263–266. [Google Scholar]
- Lu, M.; Ye, R.; Wang, Z.; Wang, X. Geogas prospecting for buried deposits under loess overburden: Taking Shenjiayao gold deposit as an example. J. Geochem. Explor. 2019, 197, 122–129. [Google Scholar] [CrossRef]
- Etiope, G.; Lombardi, S. Evidence for radon transport by carrier gas through faulted clays in Italy. J Radioanal. Nucl. Chem. 1995, 193, 291–300. [Google Scholar] [CrossRef]
- Etiope, G.; Lombardi, S. Laboratory simulation of geogas microbubble flow. Environ. Geol. 1996, 27, 226–232. [Google Scholar] [CrossRef]
- Wang, X.; Xie, X.; Cheng, Z.; Liu, D. Delineation of regional geochemical anomalies penetrating through thick cover in concealed terrains—A case history from the Olympic Dam deposit, Australia. J. Geochem. Explor. 1999, 66, 85–97. [Google Scholar] [CrossRef]
- Wang, X. Conceptual model of deep-penetrating geochemical migration. Geol. Bull. China 2005, 24, 18–22. [Google Scholar]
- Cao, J.; Hu, R.; Liang, Z.; Peng, Z. TEM observation of geogas-carried particles from the Changkeng concealed gold deposit, Guangdong Province, South China. J. Geochem. Explor. 2009, 101, 247–253. [Google Scholar] [CrossRef]
- Cao, J. Particles carried by ascending gas flow at the Tongchanghe copper mine, Guizhou Province, China. Sci. China 2010, 53, 1647–1654. [Google Scholar] [CrossRef]
- Cao, J. Simulation of adsorption of gold nanoparticles carried by gas ascending from the Earth’s interior in alluvial cover of the middle lower reaches of the Yangtze River. Geofluides 2010, 10, 438–446. [Google Scholar] [CrossRef]
- Wang, X.; Ye, R. Findings of nanoscale metal particles: Evidence for deep-penetrating geochemistry. Acta Geoscientica Sin. 2011, 32, 7–12. [Google Scholar]
- Wei, X.; Cao, J.; Holub, R.F.; Hopke, P.K.; Zhao, S. TEM study of geogas-transported nanoparticles from the Fankou lead–zinc deposit, Guangdong Province, South China. J. Geochem. Explor. 2013, 128, 124–135. [Google Scholar] [CrossRef]
- Wang, X.; Zhang, B.; Yao, W.; Liu, X. Geochemical exploration: From nanoscale to global-scale patterns. Earth Sci. Front. 2014, 21, 65–74. [Google Scholar]
- Ye, R.; Zhang, B.; Wang, Y. Mechanism of the migration of gold in desert regolith cover over a concealed gold deposit. Geochem. Explor. Env. Anal. 2015, 15, 62–71. [Google Scholar] [CrossRef]
- Zhang, B.; Wang, X.; Ye, R.; Zhou, J.; Liu, H.; Liu, D.; Han, Z.; Lin, X.; Wang, Z. Geochemical exploration for concealed deposits at the periphery of the Zijinshan copper–gold mine, southeastern China. J. Geochem. Explor. 2015, 157, 184–193. [Google Scholar] [CrossRef]
- Wang, X.; Zhang, B.; Ye, R. Nanogeochemistry for mineral exploration through covers. Bull. Miner. Petrol. Geochem. 2016, 35, 43–51. [Google Scholar]
- Cao, J.; Cheng, S.; Luo, S.; Liu, C. Study of particles in the ascending gas of ruptures caused by the 2008 Wenchuan earthquake. Appl. Geochem. 2017, 82, 38–46. [Google Scholar] [CrossRef]
- Wang, X.; Zhang, B.; Ye, R. Nanoparticles observed by TEM from gold, copper-nickel and silver deposits and implications for mineral exploration in covered terrains. J. Nanosci. Nanotechnol. 2017, 17, 6014–6025. [Google Scholar] [CrossRef]
- Jiang, T.; Cao, J.; Wu, Z.; Wu, Y.; Zeng, J.; Wang, Z. A TEM study of particles carried by ascending gas flows from the Bairendaba lead-zinc deposit, Inner Mongolia, China. Ore Geol. Rev. 2019, 105, 18–27. [Google Scholar] [CrossRef]
- Turner, N.; Mills, D.; Fedikow, M.; Prince, P. The evaluation of geological exploration samples using multi-element mobile metal ion selective weak extraction and ICP-MS. In Proceedings of Exploration 07: Fifth Decennial International Conference on Mineral Exploration; Milkereit, B., Ed.; Namex Explorations Inc.: Westmount, QC, Canada, 2007; pp. 973–977. [Google Scholar]
- Fabris, A.J.; Keeling, J.L.; Fidler, R.W. Surface geochemical expression of bedrock beneath thick sediment cover, Curnamona province, South Australia-2009. Geochem. Explor. Environ. Anal. 2009, 9, 237–246. [Google Scholar] [CrossRef]
- Mokhtari, A.R.; Cohen, D.R.; Gatehouse, S.G. Geochemical effects of deeply buried Cu–Au mineralization on transported regolith in an arid terrain-2009. Geochem. Explor. Environ. Anal. 2009, 9, 227–236. [Google Scholar] [CrossRef]
- Noble, R.R.P.; Stanley, C.R. Traditional and novel geochemical extractions applied to a Cu-Zn soil anomaly: A quantitative comparison of exploration accuracy and precision. Geochem. Explor. Environ. Anal. 2009, 9, 159–172. [Google Scholar] [CrossRef]
- Cameron, E.M.; Leybourne, M.I.; Reich, M.; Palacios, C. Geochemical anomalies in northern Chile as a surface expression of the extended supergene metallogenesis of buried copper deposits. Geochem. Explor. Environ. Anal. 2010, 10, 157–169. [Google Scholar] [CrossRef]
- Fedikow, M.A.F. Ligand-based partial extraction of near-surface soil samples. In Proceedings of the GeoCanada 2010–Working with the Earth, Calgary, AB, Canada, 10–14 May 2010; pp. 1–4. [Google Scholar]
- Xie, X.; Lu, Y.; Yao, W.; Bai, J. Further study on deep penetrating geochemistry over the spence porphyry copper deposit, Chile. Geosci. Front. 2011, 2, 303–311. [Google Scholar] [CrossRef]
- Wang, X.; Xu, S.; Zhang, B.; Zhao, S. Deep-penetrating geochemistry for sandstone-type uranium deposits in the Turpan–Hami basin, north-western China. Appl. Geochem. 2011, 26, 2238–2246. [Google Scholar] [CrossRef]
- Morris, P.A. Fine fraction regolith chemistry from the East Wongatha area, Western Australia tracing bedrock and mineralization through thick cover. Geochem. Explor. Environ. Anal. 2013, 13, 21–40. [Google Scholar] [CrossRef]
- Sylvester, G.C.; Mann, A.W.; Rate, A.W.; Wilson, C.A. Application of high-resolution mobile metal ion (MMI) soil geochemistry to archaeological investigations: An example from a Roman metal working site, Somerset, United Kingdom. Geoarchaeology 2017, 32, 563–574. [Google Scholar] [CrossRef]
- Yeager, J.R.; Clark, J.R.; Mitchell, W.; Renshaw, R. Enzyme leach anomalies associated with deep Mississippi valley-type zinc ore bodies at the elmwood mine, Tennessee. J. Geochem. Explor. 1998, 61, 103–112. [Google Scholar] [CrossRef]
- Mao, J.; Goldfarb, R.; Zhang, Z.; Xu, W.; Qiu, Y.; Deng, J. Gold deposits in the Xiaoqinling-Xiong’ershan region, Qinling Mountains, central China. Miner. Deposita. 2002, 37, 306–325. [Google Scholar] [CrossRef]
- Qiu, Y.; Groves, D.I.; McNaughton, N.J.; Wang, L.; Zhou, T. Nature, age, and tectonic setting of granitoid-hosted, orogenic gold deposits of the Jiaodong peninsula, eastern North China craton, China. Miner. Deposita. 2002, 37, 283–305. [Google Scholar] [CrossRef]
- Chen, Y.; Fu, S. Mineralization model and geological-geochemical features of the Shenjiayao gold deposit. Geol. Prospect. 1992, 4, 47–52. [Google Scholar]
- Ren, T.; Liu, Y.; Wang, M. Nanosciences and concealed deposits. Sci. Tech. Hera. 1995, 8, 18–19. [Google Scholar]
- Wang, X.; Xie, X.; Ye, S. Concepts for geochemical gold exploration based on the abundance and distribution of ultrafine gold. J. Geochem. Explor. 1995, 55, 93–101. [Google Scholar] [CrossRef]
- Noble, R.R.P.; Lintern, M.J.; Gray, D.G.; Reid, N.; Anand, R.. Metal migration at the North Miitel Ni sulphide deposit in the southern Yilgarn Craton: Part 1, regolith and groundwater. Geochem. Explor. Environ. Anal. 2013, 13, 67–85. [Google Scholar] [CrossRef]
- Palenik, C.S.; Utsunomiya, S.; Reich, M.; Kesler, S.; Wang, L.; Ewing, R.C. “Invisible” gold revealed: Direct imaging of gold nanoparticles in a Carlin-type deposit. Am. Mineral. 2004, 89, 1359–1366. [Google Scholar] [CrossRef]
- Hochella, M.F., Jr. Nanoscience and technology: The next revolution in the earth sciences. Earth Planet. Sci. Lett. 2002, 203, 593–605. [Google Scholar] [CrossRef]
- Deditius, A.P.; Utsunomiya, S.; Reich, M.; Kesler, S.E.; Ewing, R.C.; Hough, R.; Walshe, J. Trace metal nanoparticles in pyrite. Ore Geol. Rev. 2011, 42, 32–46. [Google Scholar] [CrossRef]
- Hough, R.M.; Noble, R.R.P.; Reich, M. Natural gold nanoparticles. Ore Geol. Rev. 2011, 42, 55–61. [Google Scholar] [CrossRef]
- Ju, Y.; Huang, C.; Sun, Y.; Wan, Q.; Lu, X.; Lu, S.; He, H.; Wang, X.; Zou, C.; Wu, J.; et al. Nanogeosciences: Research history, current status, and development trends. J. Nanosci. Nanotechnol. 2017, 17, 5930–5965. [Google Scholar] [CrossRef]
Figure 1.
Geological map and sampling sites in the Shenjiayao gold deposit (modified after Chen et al. [55]).
Figure 1.
Geological map and sampling sites in the Shenjiayao gold deposit (modified after Chen et al. [55]).

Figure 2.
Schematic drawing of the device for separating nanoparticles for soils.

Figure 3.
A gold-bearing nanoparticle in soil sample over the studied gold deposit; (a) TEM image; (b) TEM image; (c) high-resolution transmission electron microscope (HRTEM) image; (d) selected area electron diffraction (SAED) pattern; (e) scanning transmission electron microscope with high angle annular dark field (STEM-HAADF) image. Note that some small nanoparticles adsorb on the surface of a big particle.

Figure 4.
A Cu–Zr–Au–C–O particle in soils over gold deposit; (a) TEM image; (b) TEM image; (c) HRTEM image; (d) SAED pattern; (e) STEM-HAADF image. Some small nanoparticles adsorb on the surface of a big particle.
Figure 4.
A Cu–Zr–Au–C–O particle in soils over gold deposit; (a) TEM image; (b) TEM image; (c) HRTEM image; (d) SAED pattern; (e) STEM-HAADF image. Some small nanoparticles adsorb on the surface of a big particle.

Figure 5.
Pb-, Zn-, and Cu-bearing particles in soils over gold deposit; (a) TEM image of a Pb- and Zn-bearing particle aggregation; (b) TEM image of a Zn-bearing particle; (c) TEM image of a Cu-bearing particle aggregation; (d) TEM image of a Zn-bearing particle.
Figure 5.
Pb-, Zn-, and Cu-bearing particles in soils over gold deposit; (a) TEM image of a Pb- and Zn-bearing particle aggregation; (b) TEM image of a Zn-bearing particle; (c) TEM image of a Cu-bearing particle aggregation; (d) TEM image of a Zn-bearing particle.

Figure 6.
TEM images of Fe-bearing particles in soils over the studied gold deposit; (a) a Fe-bearing circular particle; (b) irregular Fe-bearing particles; (c) irregular Fe-bearing particles; (d) Fe-bearing particle aggregation; (e) a elliptic Fe-bearing particles; (f) Fe-bearing particle aggregation; (g) irregular Fe-bearing particles; (h) Fe-bearing particle aggregation; (i) Fe-bearing particle aggregation.

Figure 7.
TEM images of Ca-, Ba-, Ti-, and Na-bearing nanoparticles in soils over the studied gold deposit; (a) Ca-bearing particles; (b) Ca-bearing particles; (c) Ba-bearing particles; (d) Ti-bearing particles; (e) Ti-bearing particles; (f) Na-bearing particles.
Figure 7.
TEM images of Ca-, Ba-, Ti-, and Na-bearing nanoparticles in soils over the studied gold deposit; (a) Ca-bearing particles; (b) Ca-bearing particles; (c) Ba-bearing particles; (d) Ti-bearing particles; (e) Ti-bearing particles; (f) Na-bearing particles.

Figure 8.
TEM images of Au-bearing nanoparticles in fault gouges; (a) Au-bearing particle aggregation; (b) a Au-bearing particle.
Figure 8.
TEM images of Au-bearing nanoparticles in fault gouges; (a) Au-bearing particle aggregation; (b) a Au-bearing particle.

Figure 9.
A Cu-bearing particle in the studied fault gouges; (a) TEM image; (b) TEM image; (c) HRTEM image; (d) STEM-HAADF image. Some small nanoparticles adsorb on the surface of a big particle.
Figure 9.
A Cu-bearing particle in the studied fault gouges; (a) TEM image; (b) TEM image; (c) HRTEM image; (d) STEM-HAADF image. Some small nanoparticles adsorb on the surface of a big particle.

Figure 10.
Cu-, Pb-, and Zn-bearing nanoparticles in fault gouges; (a) TEM image of a Cu-bearing particle; (b) TEM image of a Zn-bearing particle; (c) TEM image of a Zn-bearing particle; (d) TEM image of a Pb-bearing particle; (e) TEM image of a Pb-bearing particle; (f) TEM image of a Pb-bearing particle.

Figure 11.
TEM images of Fe-bearing nanoparticles in the studied fault gouge samples. (a) Fe-bearing nanoparticles adsorbed to clay minerals; (b) Fe-bearing nanoparticles adsorbed to clay minerals; (c) a Fe-bearing nanoparticle.
Figure 11.
TEM images of Fe-bearing nanoparticles in the studied fault gouge samples. (a) Fe-bearing nanoparticles adsorbed to clay minerals; (b) Fe-bearing nanoparticles adsorbed to clay minerals; (c) a Fe-bearing nanoparticle.

Figure 12.
Schematic diagram of the migration model of the metal-bearing nanoparticles.


Table 1.
Information about Au-, Pb-, Zn-, Cu-, and Fe-bearing nanoparticles in soils over gold deposits.
Table 1.
Information about Au-, Pb-, Zn-, Cu-, and Fe-bearing nanoparticles in soils over gold deposits.
| Particle ID | Size (nm) | Shape | Element | ||||||||||||||||||
|---|---|---|---|---|---|---|---|---|---|---|---|---|---|---|---|---|---|---|---|---|---|
| C | O | Na | Mg | Al | Si | S | Cl | K | Ca | Fe | Ni | Cu | As | Zn | Zr | Au | Pb | ||||
| 1 | 600 × 900 | irregular | wt % | 9.15 | 7.38 | - | - | 3.07 | 5.34 | - | - | 10.33 | - | 12.91 | 5.54 | 12.16 | - | - | - | 34.11 | - |
| at % | 30.69 | 18.59 | - | - | 4.59 | 7.66 | - | - | 10.65 | - | 9.31 | 3.81 | 7.71 | - | - | - | 6.98 | - | |||
| 2 | 600 × 1000 | irregular | wt % | 36.71 | 10.22 | 2.06 | - | 2.25 | 1.08 | - | - | - | - | 0.11 | - | 24.15 | - | - | 21.44 | 1.36 | - |
| at % | 67.23 | 14.05 | 1.97 | - | 1.83 | 0.85 | - | - | - | - | 0.11 | - | 8.36 | - | - | 5.17 | 0.15 | - | |||
| 3 | unmeasurable | aggregation | wt % | 10.21 | 6.52 | - | - | 5.79 | 0.73 | - | - | 0.43 | - | 0.37 | - | 0.40 | - | 9.62 | - | - | 65.93 |
| at % | 42.77 | 20.51 | - | - | 10.80 | 1.32 | - | - | 0.56 | - | 0.33 | - | 0.31 | - | 7.40 | - | - | 16.01 | |||
| 4 | 150 × 300 | circular | wt % | - | 18.35 | - | - | 3.71 | 4.10 | - | - | 0.75 | - | 6.57 | - | - | - | 64.90 | - | - | - |
| at % | - | 44.10 | - | - | 5.28 | 5.61 | - | - | 0.74 | - | 4.52 | - | - | - | 38.18 | - | - | - | |||
| 5 | unmeasurable | aggregation | wt % | - | 8.46 | - | - | 25.98 | 2.37 | 2.58 | 24.27 | - | - | 0.65 | - | 33.83 | - | 1.86 | - | - | |
| at % | - | 18.15 | - | - | 33.05 | 2.89 | 2.76 | 23.49 | - | - | 0.40 | - | 18.28 | - | 0.98 | - | - | ||||
| 6 | 200 × 400 | irregular | wt % | - | 23.04 | - | - | 7.96 | 15.28 | 0.33 | 0.19 | 2.33 | - | 28.79 | - | 0.52 | - | 17.15 | - | - | - |
| at % | - | 46.58 | - | - | 8.60 | 16.58 | 0.32 | 0.16 | 1.82 | - | 15.70 | - | 0.25 | - | 7.99 | - | - | - | |||
| 7 | 1000 × 1000 | Circular | wt % | - | 21.59 | - | - | 2.10 | - | - | - | - | - | 76.31 | - | - | - | - | - | - | - |
| at % | - | 48.30 | - | - | 2.79 | - | - | - | - | - | 48.91 | - | - | - | - | - | - | - | |||
| 8 | 900 × 900 | irregular | wt % | - | 23.25 | - | - | 2.13 | 1.46 | - | - | - | - | 71.33 | - | 0.28 | - | - | - | - | - |
| at % | - | 50.24 | - | - | 2.73 | 1.80 | - | - | - | - | 44.15 | - | 0.15 | - | - | - | - | - | |||
| 9 | 400 × 600 | irregular | wt % | - | 21.87 | - | - | 3.50 | 1.92 | 0.33 | - | - | - | 67.79 | - | 1.23 | - | - | - | - | - |
| at % | - | 48.43 | - | - | 4.60 | 1.02 | 0.37 | - | - | - | 43.01 | - | 0.69 | - | - | - | - | - | |||
| 10 | unmeasurable | aggregation | wt % | - | 25.38 | - | - | 4.37 | 3.66 | 0.45 | - | - | - | 59.85 | - | 0.22 | - | 2.56 | - | - | - |
| at % | - | 52.30 | - | - | 5.34 | 4.29 | 0.46 | - | - | - | 35.34 | - | 0.11 | - | 1.29 | - | - | - | |||
| 11 | 100 × 200 | irregular | wt % | - | 29.70 | - | - | 4.35 | 11.83 | - | - | 1.45 | 0.25 | 45.08 | - | - | - | 0.59 | - | - | - |
| at % | - | 54.23 | - | - | 4.71 | 12.31 | - | - | 1.08 | 0.18 | 23.58 | - | - | - | 0.26 | - | - | - | |||
| 12 | unmeasurable | aggregation | wt % | - | 26.06 | - | - | 4.25 | 3.78 | - | - | - | - | 65.73 | - | 0.18 | - | - | - | - | - |
| at % | - | 52.53 | - | - | 5.08 | 4.34 | - | - | - | - | 37.96 | - | 0.09 | - | - | - | - | - | |||
| 13 | 400 × 500 | irregular | wt % | - | 30.62 | - | 0.59 | 6.05 | 9.93 | 0.61 | - | - | - | 51.31 | - | - | - | - | - | - | - |
| at % | - | 54.95 | - | 0.70 | 6.44 | 10.15 | 0.55 | - | - | - | 26.38 | - | - | - | - | - | - | - | |||
| 14 | unmeasurable | aggregation | wt % | 14.26 | 22.89 | - | - | 3.91 | 1.24 | 0.15 | - | 0.24 | - | 53.09 | - | - | - | - | - | - | - |
| at % | 31.12 | 37.49 | - | - | 3.80 | 1.16 | 0.12 | - | 0.16 | - | 24.92 | - | - | - | - | - | - | - | |||
| 15 | unmeasurable | aggregation | wt % | 57.01 | 14.29 | - | - | 3.23 | 1.60 | - | - | - | - | 22.17 | - | - | - | - | - | - | - |
| at % | 76.26 | 14.35 | - | - | 1.92 | 0.91 | - | - | - | - | 6.38 | - | - | - | - | - | - | - | |||
Table 2.
Information about Ca-, Ba-, Ti-, and Na-bearing nanoparticles in soils over gold deposits.
| Particle ID | Size (nm) | Shape | Element | |||||||||||||||
|---|---|---|---|---|---|---|---|---|---|---|---|---|---|---|---|---|---|---|
| C | O | Na | Mg | Al | Si | S | Cl | K | Ca | Ti | Ba | Fe | Cu | Zn | ||||
| 16 | 150 × 300 | irregular | wt % | 9.11 | 31.54 | 1.58 | 2.21 | 8.89 | 4.49 | 4.15 | 0.56 | 1.35 | 31.01 | - | - | 4.17 | 0.28 | - |
| at % | 16.20 | 45.10 | 1.68 | 2.21 | 8.02 | 3.89 | 3.15 | 0.38 | 0.84 | 20.71 | - | - | 1.82 | 0.11 | - | |||
| 17 | 1000 × 1000 | irregular | wt % | 18.84 | 17.63 | - | 1.36 | 5.78 | 0.51 | - | - | - | 55.74 | - | - | 0.13 | - | - |
| at % | 35.01 | 24.56 | - | 1.26 | 4.77 | 0.41 | - | - | - | 31.06 | - | - | 0.05 | - | - | |||
| 18 | 200 × 400 | rectangle | wt % | - | - | 1.32 | - | 4.34 | 0.36 | 15.82 | - | - | 0.78 | - | 76.97 | - | - | - |
| at % | - | - | 4.38 | - | 12.26 | 0.98 | 37.63 | - | - | 1.49 | - | 42.74 | - | - | - | |||
| 19 | 200 × 200 | sphere | wt % | - | 24.71 | - | 1.14 | 7.26 | 8.32 | - | - | - | 3.17 | 48.72 | - | 2.54 | 1.06 | 1.10 |
| at % | - | 45.49 | - | 1.38 | 7.93 | 8.72 | - | - | - | 2.33 | 29.96 | - | 1.34 | 0.49 | 0.49 | |||
| 20 | 200 × 200 | hexagon | wt % | - | 21.62 | - | - | 6.67 | - | 0.45 | - | - | - | 70.11 | - | 0.21 | 0.51 | - |
| at % | - | 43.56 | - | - | 7.96 | - | 0.46 | - | - | - | 47.19 | - | 0.12 | 0.26 | - | |||
| 21 | 1000 × 1000 | cube | wt % | - | 2.33 | 76.80 | - | - | - | - | 19.33 | 1.21 | 0.33 | - | - | - | - | - |
| at % | - | 3.58 | 82.07 | - | - | - | - | 13.39 | 0.76 | 0.20 | - | - | - | - | - | |||
Table 3.
Information about Au-, Pb-, Zn-, Cu-, and Fe-bearing nanoparticles in fault gouge over gold deposits.
Table 3.
Information about Au-, Pb-, Zn-, Cu-, and Fe-bearing nanoparticles in fault gouge over gold deposits.
| Particle ID | Size (nm) | Shape | Element | |||||||||||||||
|---|---|---|---|---|---|---|---|---|---|---|---|---|---|---|---|---|---|---|
| C | O | Na | Al | Si | S | Mn | K | Ca | Ti | Fe | Cu | Zn | Au | Pb | ||||
| 22 | 300 × 300 | irregular | wt % | - | 6.92 | - | - | 1.15 | - | 3.06 | - | - | - | 87.44 | 1.10 | - | 0.33 | - |
| at % | - | 20.47 | - | - | 1.94 | - | 2.64 | - | - | - | 74.06 | 0.82 | - | 0.08 | - | |||
| 23 | 300 × 300 | irregular | wt % | - | 23.07 | - | - | 7.38 | - | 54.24 | 5.31 | 2.26 | - | 6.28 | 1.23 | - | 0.23 | - |
| at % | - | 47.80 | - | - | 8.71 | - | 32.72 | 4.50 | 1.87 | - | 3.72 | 0.64 | - | 0.04 | - | |||
| 24 (I) | 1000 × 1000 | irregular | wt % | - | 14.83 | 1.66 | 8.46 | 11.97 | 16.73 | - | - | 1.16 | - | - | 45.19 | - | - | - |
| at % | - | 30.88 | 2.40 | 10.45 | 14.20 | 17.40 | - | - | 0.96 | - | - | 23.70 | - | - | - | |||
| 24 (II) | wt % | - | 42.12 | - | 20.90 | 31.28 | - | - | - | 2.61 | - | - | 3.10 | - | - | - | ||
| at % | - | 56.80 | - | 16.71 | 24.03 | - | - | - | 1.40 | - | - | 1.05 | - | - | - | |||
| 25 | 900 × 900 | irregular | wt % | - | 32.09 | - | 19.68 | 15.41 | 4.14 | - | 1.00 | 2.61 | - | 14.92 | 10.15 | - | - | - |
| at % | - | 51.03 | - | 18.56 | 13.96 | 3.29 | - | 0.65 | 1.65 | - | 6.80 | 4.06 | - | - | - | |||
| 26 | 100 × 100 | irregular | wt % | - | 16.99 | - | 4.29 | 8.50 | 17.56 | - | 0.33 | 0.15 | - | 24.24 | 0.61 | 26.45 | - | - |
| at % | - | 36.08 | - | 5.40 | 10.28 | 18.61 | - | 0.28 | 0.13 | - | 14.75 | 0.33 | 13.75 | - | - | |||
| 27 | 300 × 300 | irregular | wt % | 30.88 | 4.80 | - | - | 1.04 | 22.92 | - | 1.01 | 0.56 | - | 5.18 | 0.39 | 33.21 | - | - |
| at % | 60.22 | 7.03 | - | - | 0.87 | 16.74 | - | 0.61 | 0.33 | - | 2.17 | 0.14 | 11.90 | - | - | |||
| 28 | 400 × 500 | irregular | wt % | - | 16.10 | - | 7.64 | 2.38 | - | - | - | 1.24 | - | 0.55 | 0.62 | 0.60 | - | 70.87 |
| at % | - | 56.66 | - | 15.94 | 4.78 | - | - | - | 1.74 | - | 0.56 | 0.55 | 0.52 | - | 19.26 | |||
| 29 | 300 × 300 | irregular | wt % | - | 30.51 | 3.03 | 4.90 | 2.50 | 8.90 | - | 7.84 | 0.80 | - | 22.76 | 0.24 | - | - | 16.76 |
| at % | - | 56.82 | 3.92 | 5.41 | 2.66 | 8.27 | - | 5.97 | 0.59 | - | 12.14 | 0.11 | - | - | 2.41 | |||
| 30 | 200 × 300 | irregular | wt % | - | 1.99 | - | 5.42 | 0.95 | - | - | 0.96 | - | - | 0.83 | 1.85 | 0.28 | - | 87.71 |
| at % | - | 14.56 | - | 23.50 | 3.97 | - | - | 2.86 | - | - | 1.75 | 3.40 | 0.50 | - | 49.47 | |||
| 31 | 300 × 500 | irregular | wt % | - | 32.12 | - | 10.52 | 11.78 | 0.28 | - | 0.45 | - | - | 42.52 | 0.60 | 1.02 | - | - |
| at % | - | 55.23 | - | 10.73 | 11.54 | 0.24 | - | 0.32 | - | - | 20.95 | 0.26 | 0.43 | - | - | |||
| 32 | 500 × 1500 | irregular | wt % | - | 27.23 | - | 12.35 | 15.50 | 0.45 | - | 5.31 | - | 0.78 | 34.63 | 0.23 | 0.33 | - | - |
| at % | - | 48.33 | - | 13.00 | 15.67 | 0.40 | - | 3.85 | - | 0.46 | 17.61 | 0.10 | 0.14 | - | - | |||
| 33 | 300 × 500 | irregular | wt % | - | - | 1.32 | 3.52 | 0.67 | 38.13 | - | 2.62 | 0.38 | - | 52.25 | - | 0.22 | - | - |
| at % | - | - | 2.36 | 5.37 | 0.98 | 48.98 | - | 2.76 | 0.40 | - | 38.53 | - | 0.14 | - | - | |||
Table 4.
Element content of different solid media from the study area.
| Element | Unit | Soil over Concealed Ore Bodies (n = 10) | Soil from Background Area (n = 3) | Fault Gouge (n = 2) | Ore (n = 3) | ||||||||
|---|---|---|---|---|---|---|---|---|---|---|---|---|---|
| Min | Max | Mean | Min | Max | Mean | Min | Max | Mean | Min | Max | Mean | ||
| Au | ng/g | 3.18 | 35.0 | 14.1 | 1.67 | 3.01 | 2.28 | 137 | 722 | 429 | 1050 | 5760 | 3520 |
| Ag | μg/g | 0.06 | 1.34 | 0.41 | 0.06 | 0.27 | 0.14 | 4.92 | 14.4 | 9.7 | 89 | 439 | 291 |
| Cu | μg/g | 19.0 | 58.6 | 37.1 | 23.5 | 30.7 | 26.8 | 231 | 497 | 364 | 6945 | 10,980 | 8463 |
| Pb | μg/g | 30.3 | 430 | 114 | 25 | 32.7 | 28.6 | 1453 | 2617 | 2035 | 5521 | 8950 | 7231 |
| Zn | μg/g | 87.7 | 455 | 174 | 67.9 | 99.7 | 79.8 | 2776 | 8692 | 5734 | 4131 | 37,820 | 17,977 |
| As | μg/g | 14.2 | 93.6 | 48.3 | 13.5 | 24.7 | 17.3 | 363 | 2329 | 1346 | 7754 | 60,740 | 25,436 |
| Sb | μg/g | 1.27 | 4.00 | 2.03 | 1.02 | 1.24 | 1.12 | 12.2 | 60.5 | 36.3 | 294 | 773 | 610 |
| Hg | μg/g | 37.8 | 896 | 216 | 27.4 | 52.2 | 38.6 | 17.3 | 28.9 | 23.1 | 41,920 | 57,960 | 49,049 |
© 2019 by the authors. Licensee MDPI, Basel, Switzerland. This article is an open access article distributed under the terms and conditions of the Creative Commons Attribution (CC BY) license (http://creativecommons.org/licenses/by/4.0/).
Share and Cite
MDPI and ACS Style
Zhang, B.; Han, Z.; Wang, X.; Liu, H.; Wu, H.; Feng, H. Metal-Bearing Nanoparticles Observed in Soils and Fault Gouges over the Shenjiayao Gold Deposit and Their Significance. Minerals 2019, 9, 414. https://doi.org/10.3390/min9070414
AMA Style
Zhang B, Han Z, Wang X, Liu H, Wu H, Feng H. Metal-Bearing Nanoparticles Observed in Soils and Fault Gouges over the Shenjiayao Gold Deposit and Their Significance. Minerals. 2019; 9(7):414. https://doi.org/10.3390/min9070414
Chicago/Turabian StyleZhang, Bimin, Zhixuan Han, Xueqiu Wang, Hanliang Liu, Hui Wu, and Hui Feng. 2019. "Metal-Bearing Nanoparticles Observed in Soils and Fault Gouges over the Shenjiayao Gold Deposit and Their Significance" Minerals 9, no. 7: 414. https://doi.org/10.3390/min9070414
Note that from the first issue of 2016, this journal uses article numbers instead of page numbers. See further details here.