Article

Study of Thermal Management System Using Composite Phase Change Materials and Thermoelectric Cooling Sheet for Power Battery Pack

College of Mechanical Engineering, Xi’an University of Science and Technology, Xi’an 710054, China
*
Author to whom correspondence should be addressed.
Energies 2019, 12(10), 1937; https://doi.org/10.3390/en12101937
Submission received: 21 April 2019 / Revised: 11 May 2019 / Accepted: 15 May 2019 / Published: 20 May 2019

Abstract

:
Scientific and reasonable battery thermal management systems contribute to improve the performance of a power battery, prolong its life of service, and improve its safety. Based on TAFEL-LAE895 type 100Ah ternary lithium ion power battery, this paper is conducted on charging and discharging experiments at different rates to study the rise of temperature and the uniformity of the battery. Paraffin can be used to reduce the surface temperature of the battery, while expanded graphite (EG) is added to improve the thermal conductivity and viscosity of the composite phase change material (CPCM), and to reduce the fluidity after melting. With the increase of graphite content, the heat storage capacity of phase change material (PCM) decreases, which affects the thermal management effect directly. Therefore, this paper combines heat pipe and semiconductor refrigeration technology to transform heat from the inner CPCM to the thermoelectric cooling sheet for heat dissipation. The results show that the surface temperature of the battery can be kept within a reasonable range when discharging at high rate. The temperature uniformity of the battery is improved and the energy of the battery is saved.

1. Introduction

The lithium ion battery is widely used in electric vehicles due to the advantages of long lifespan, no memory effect, low self-discharge rate, and high energy density. However, during the process of use, the lithium battery capacity, power, safety, cycle life—and so on—can all be influenced by temperature [1]. The best working temperature range of the lithium ion battery is from 20 °C to 45 °C. In the process of lithium battery charge and discharge, complex electrochemical reactions take place and heat is generated, rising the battery temperature [2]. If the heat generated by the battery cannot be released in time, the battery temperature will continue to rise and the battery thermal will be out of control. The main purpose of research on electric vehicle battery thermal management system (BTMS) is to prevent the power battery from overheating or undercooling, so the temperature of the power battery is always maintained in the optimal working range to ensure the best performance of the electric vehicle.
Domestic and foreign scholars have proposed various methods of heat dissipation in BTMS—in particular, the method of air cooling the battery with a fan. According to its arrangement of the battery, air cooling can be divided into two types of serial and parallel ventilation. Xiaoyu Na et al [3,4] constructed a simplified calculation model for reverse-ventilated battery pack cooling, and proved that this method can effectively reduce the maximum inner temperature of the battery pack and decrease the local temperature range. However, in the hot weather, air cooling cannot control the temperature very well. Liquid cooling uses liquid as the medium to cool off the power battery, which is divided into active and passive [5]. Chunrong Zhao et al [6,7] designed a serpentine pipe inside the battery module composed of a cylindrical battery. The numerical simulation shows that the maximum temperature range of the battery is reduced by 2.2 °C under 5C discharge. Bittagopal Mondal et al [8,9] used a flat channel to provide a vortex-generating device inside. The analysis showed that the heat transfer in the cooling channel increased significantly after the eddy current channel was added, and the maximum temperature of the battery pack was reduced by 10%. The above two liquid cooling methods have higher requirements on the design and material selection of the cooling channel, and need further optimization. Phase change material (PCM) is used in an electric vehicle battery thermal management system, which was first proposed and patented by Al-Hallaj et al [10]. When using PCM, the battery cells or modules can be directly immersed in the PCM, controlling the thermal of the battery by absorbing heat during PCM melting [11]. However, the thermal conductivity of paraffin wax (PW) is low, which may cause the temperature of the contact areas between the battery and the PCM to become too high, while other parts have yet to melt, thereby reducing system performance [12,13]. To overcome this defect, many researchers have improved the thermal properties of paraffin by adding high thermal conductivity particles to paraffin. Minqiang Pan et al [14,15] filled around the cylindrical battery with PW and sintered copper fiber for power battery discharge test, and compared with natural air-cooled, pure paraffin, and pure metal foam heat dissipation effect. Experiments have shown that the combination of PCM and copper foam can improve the heat transfer performance of the battery pack and reduce the temperature range. Weixiong Wu et al [5,16,17], using an aged lithium ion phosphate battery as the research object for 5C discharge, proposed future work will include expanding discussion about thermal management characteristics, combining different heat-generating behavior and thermal resistance of the battery and PCM to study its influence. Shang Shi et al [18,19,20] combined PCM and air cooling, PCM and heat pipes, PCM and thermoelectric sheets [21], and PCM and copper mesh [22]. Aiming at the unsteady heat generation characteristics of the power battery, a mathematical model of battery heat generation is proposed [23,24].
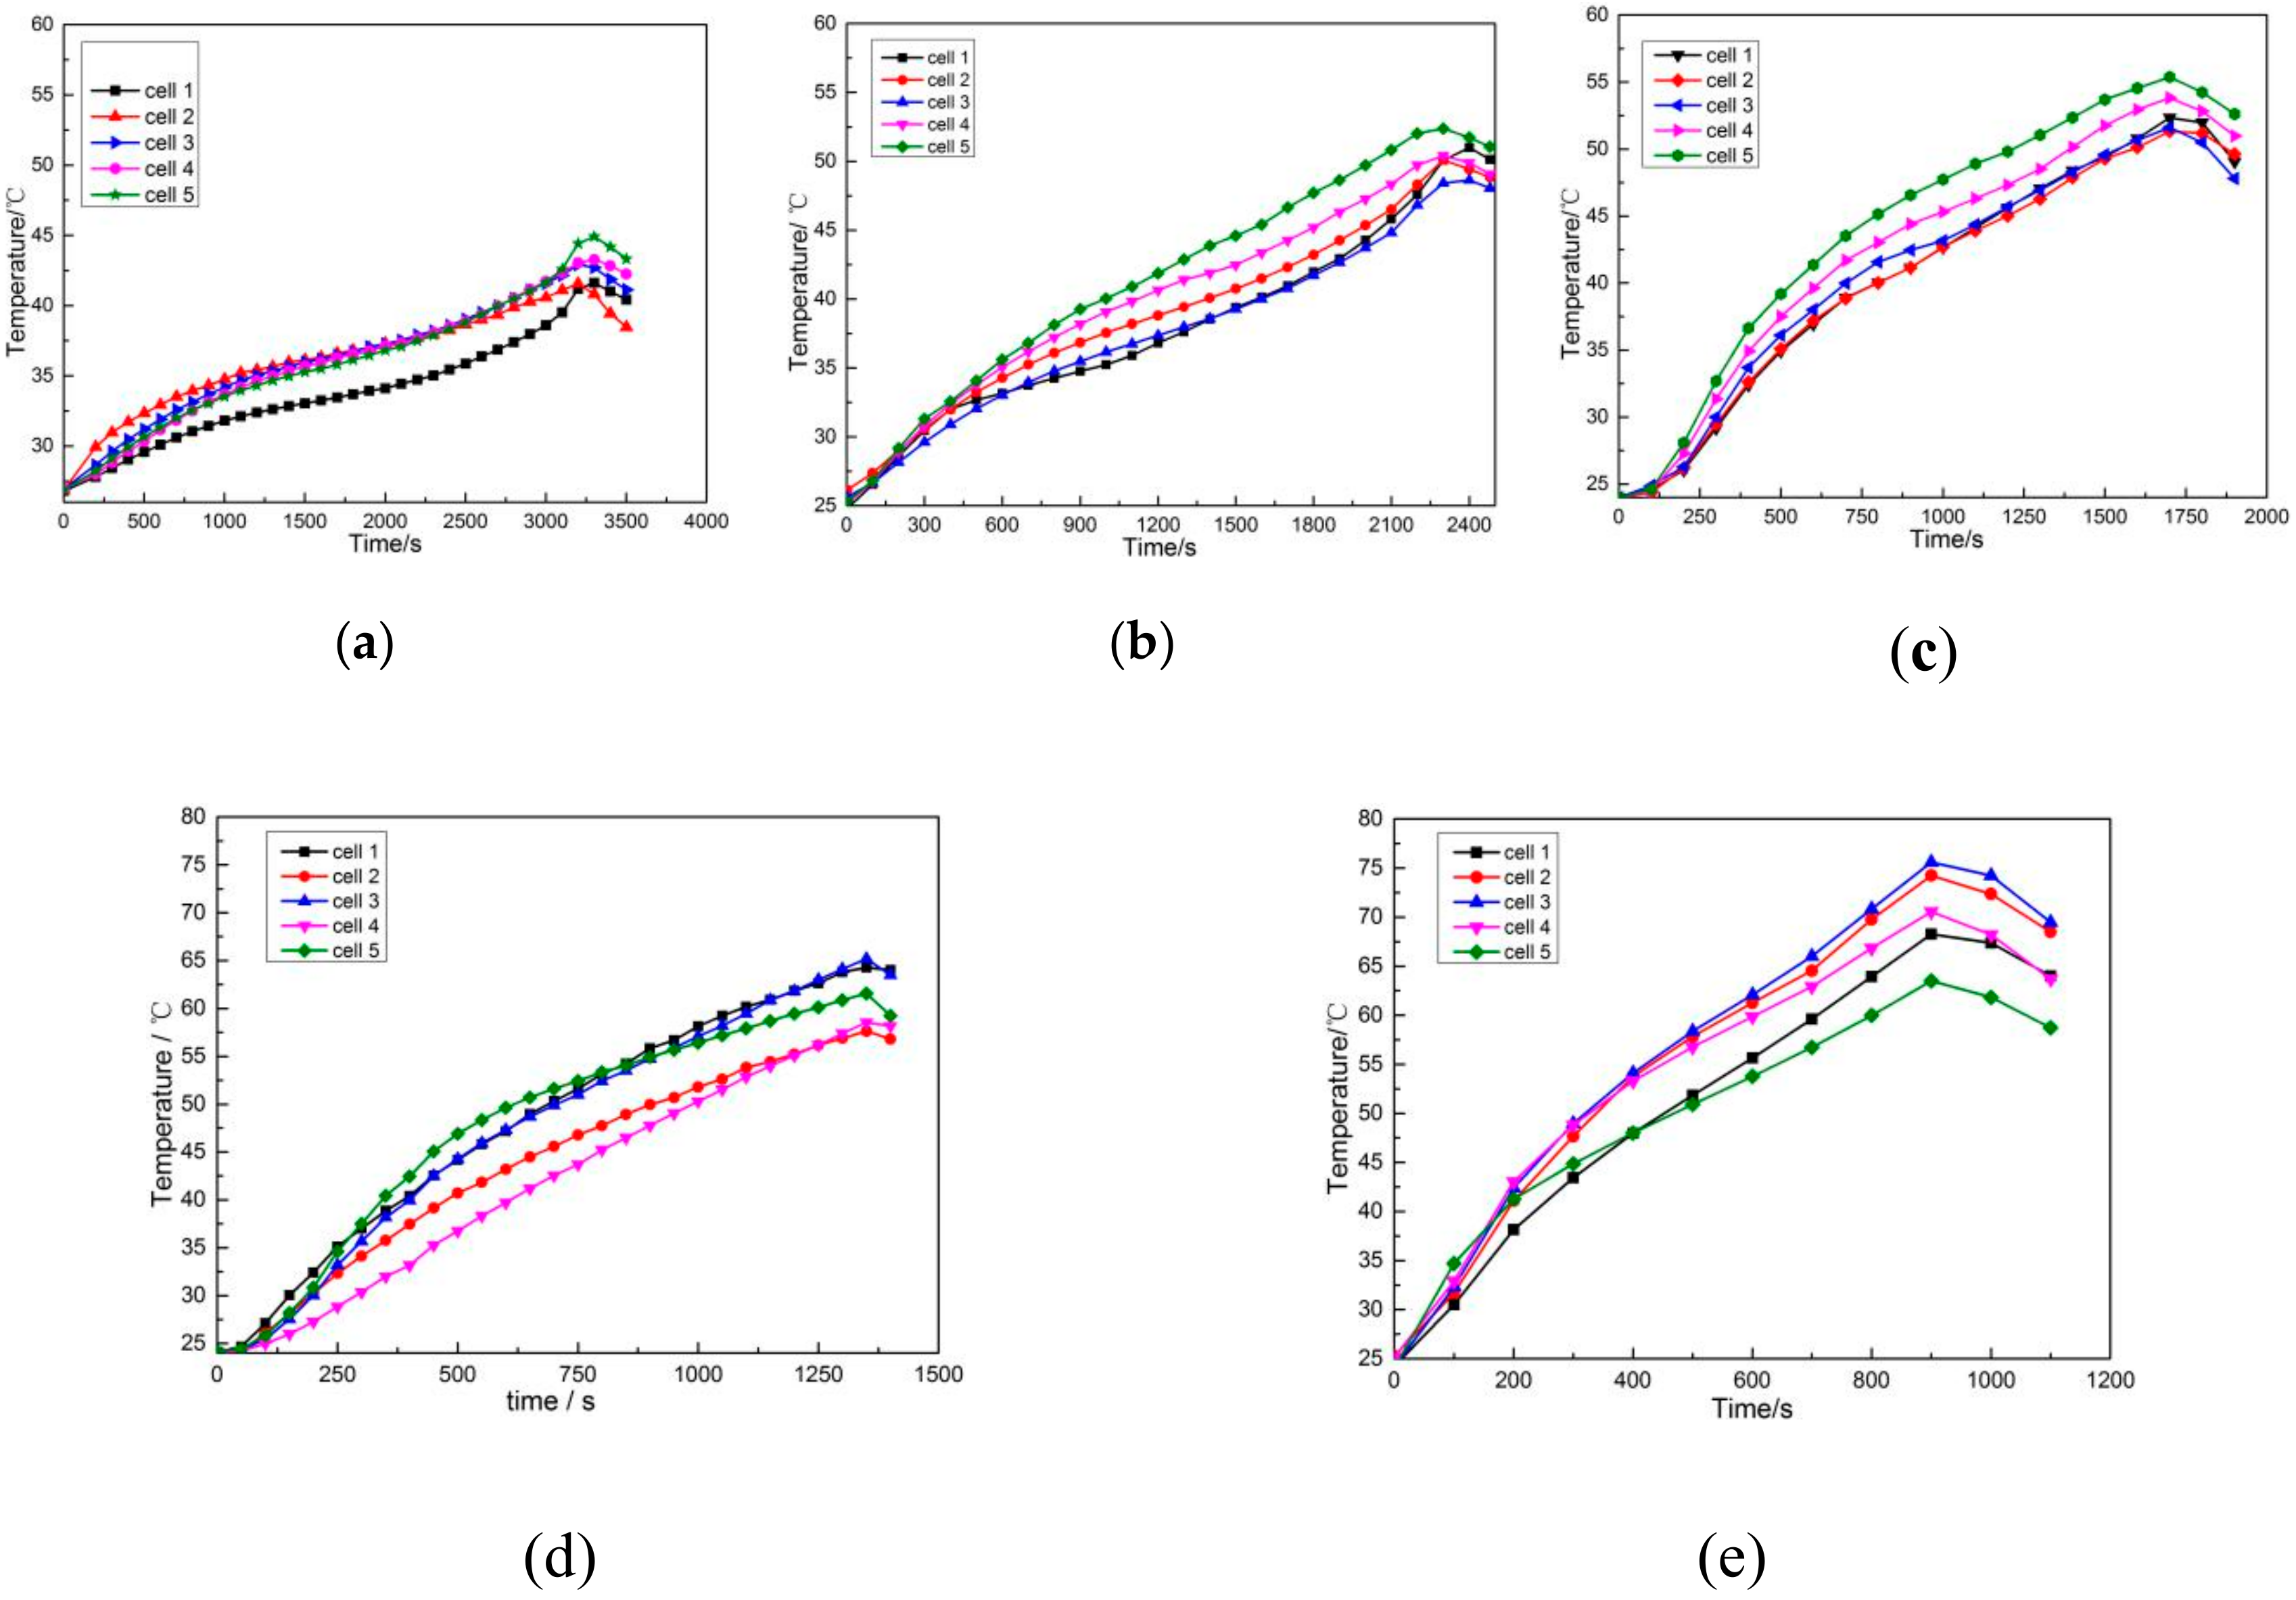
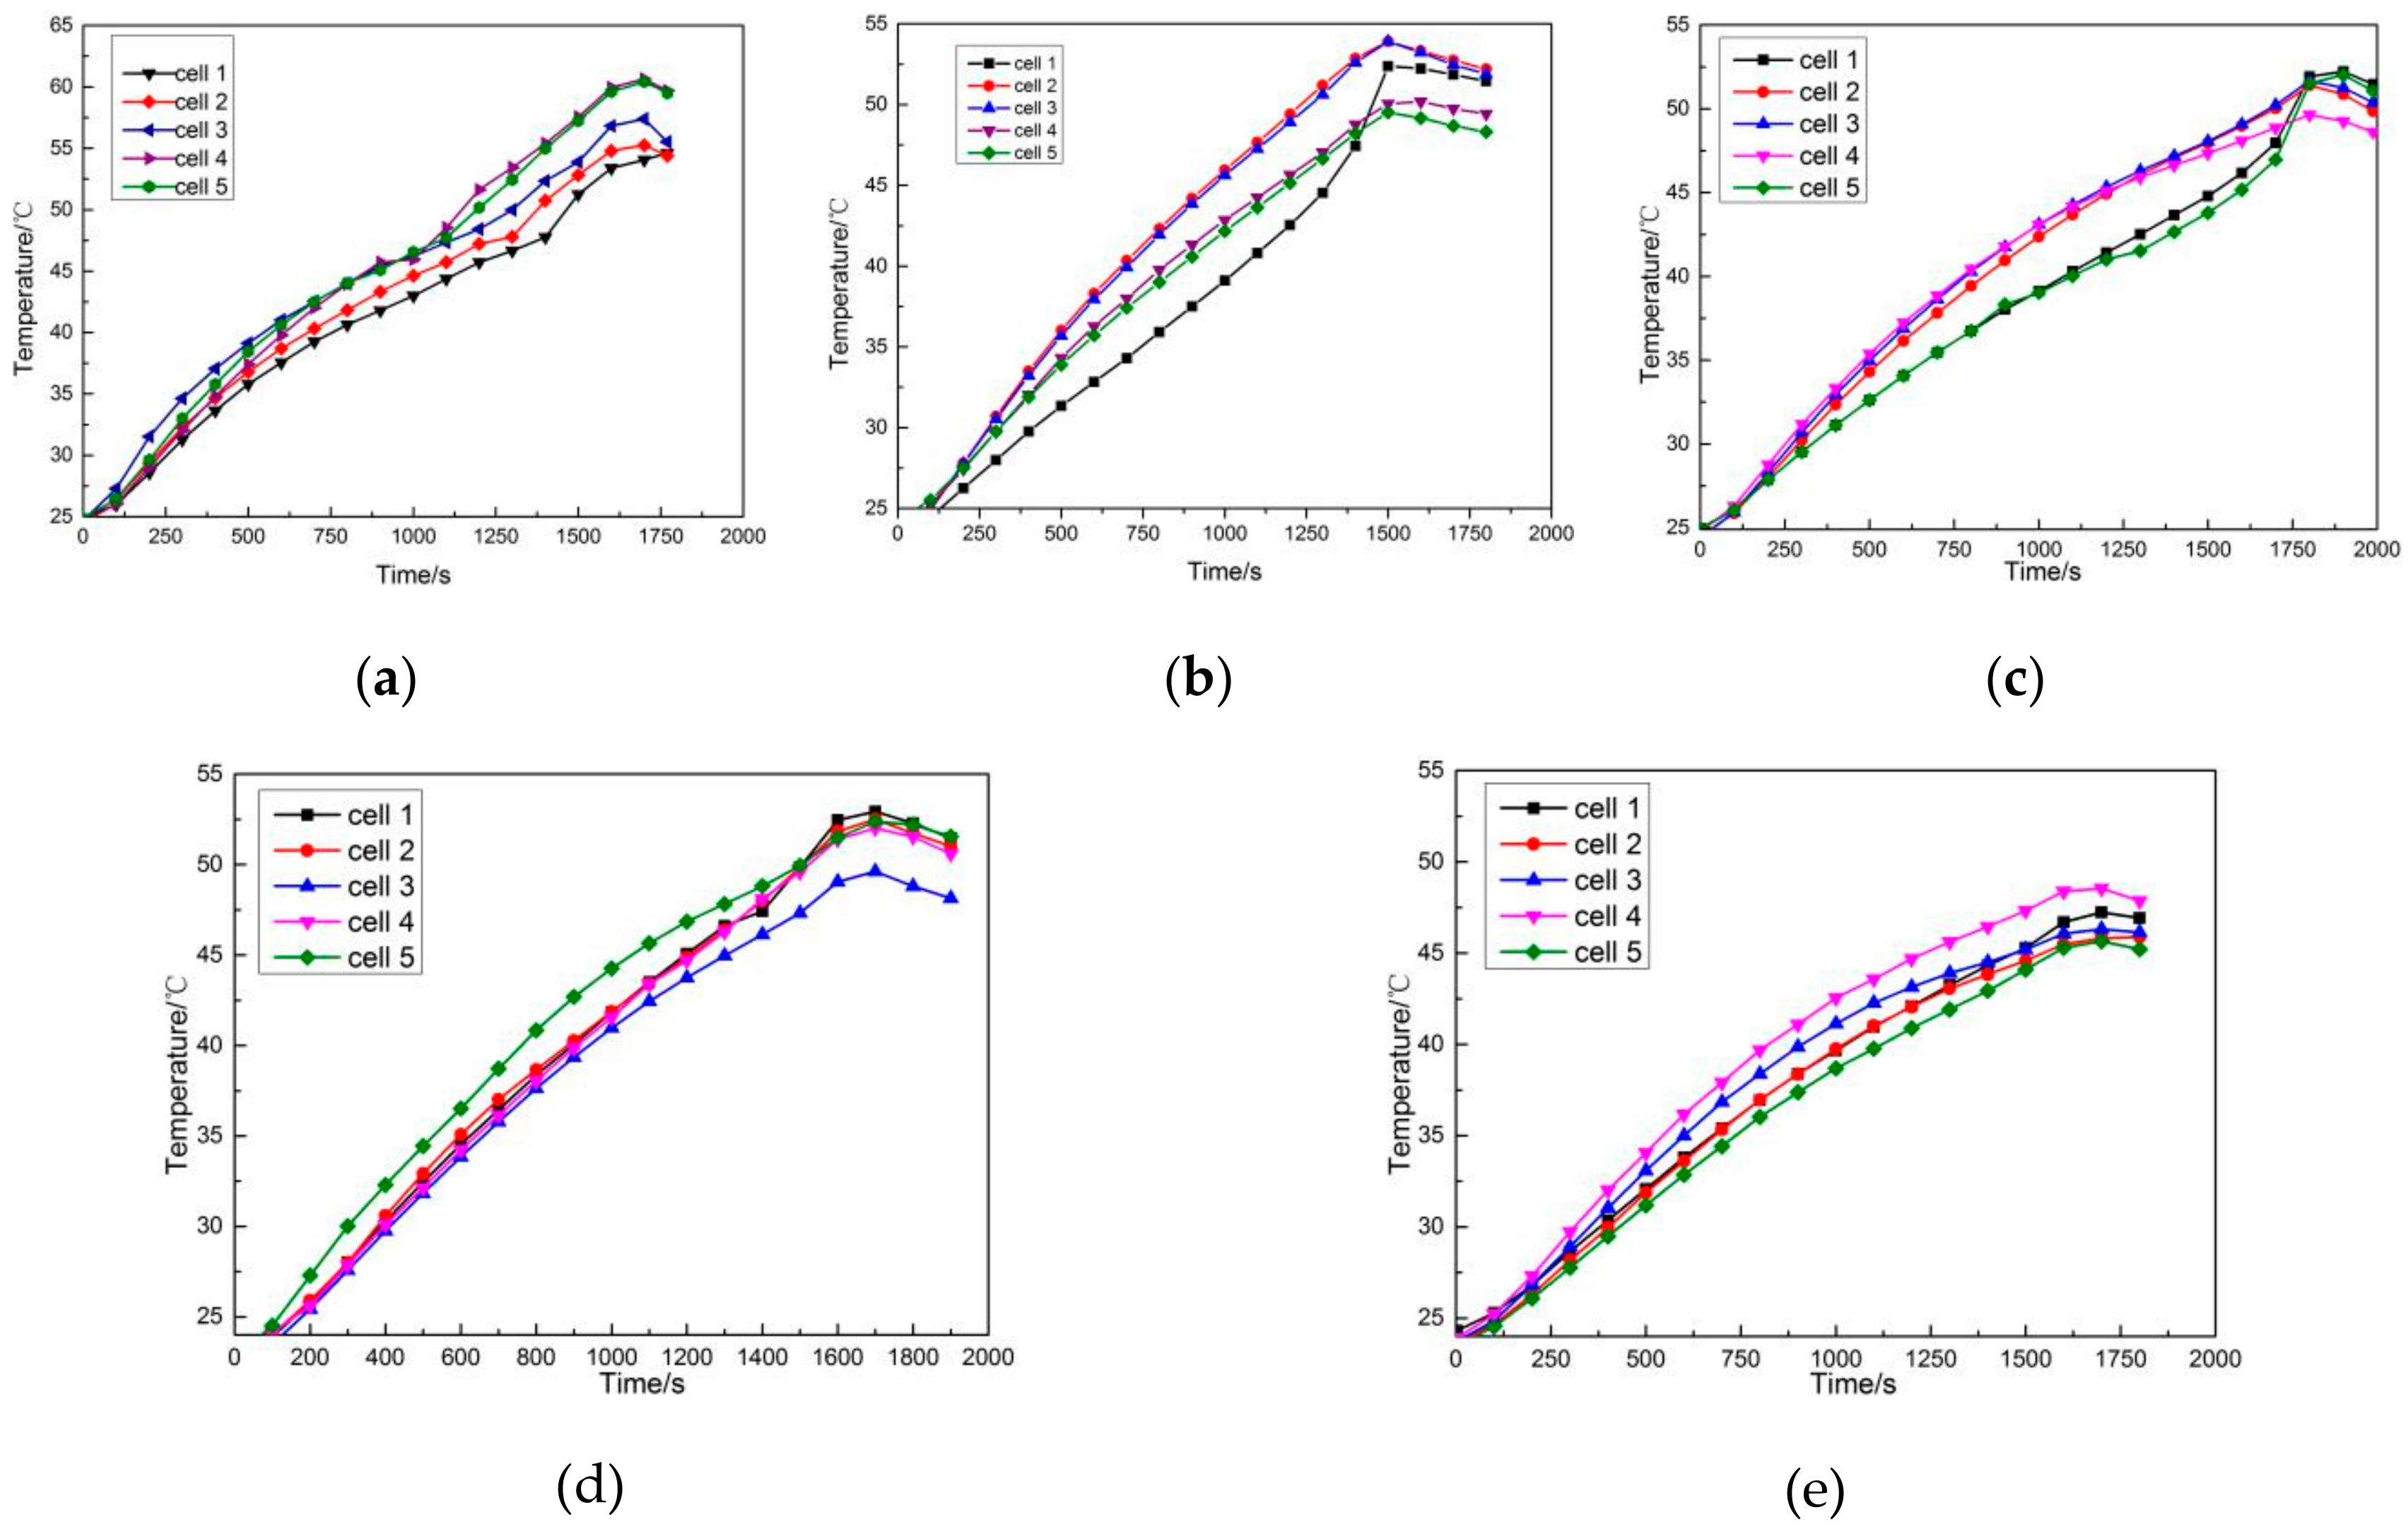
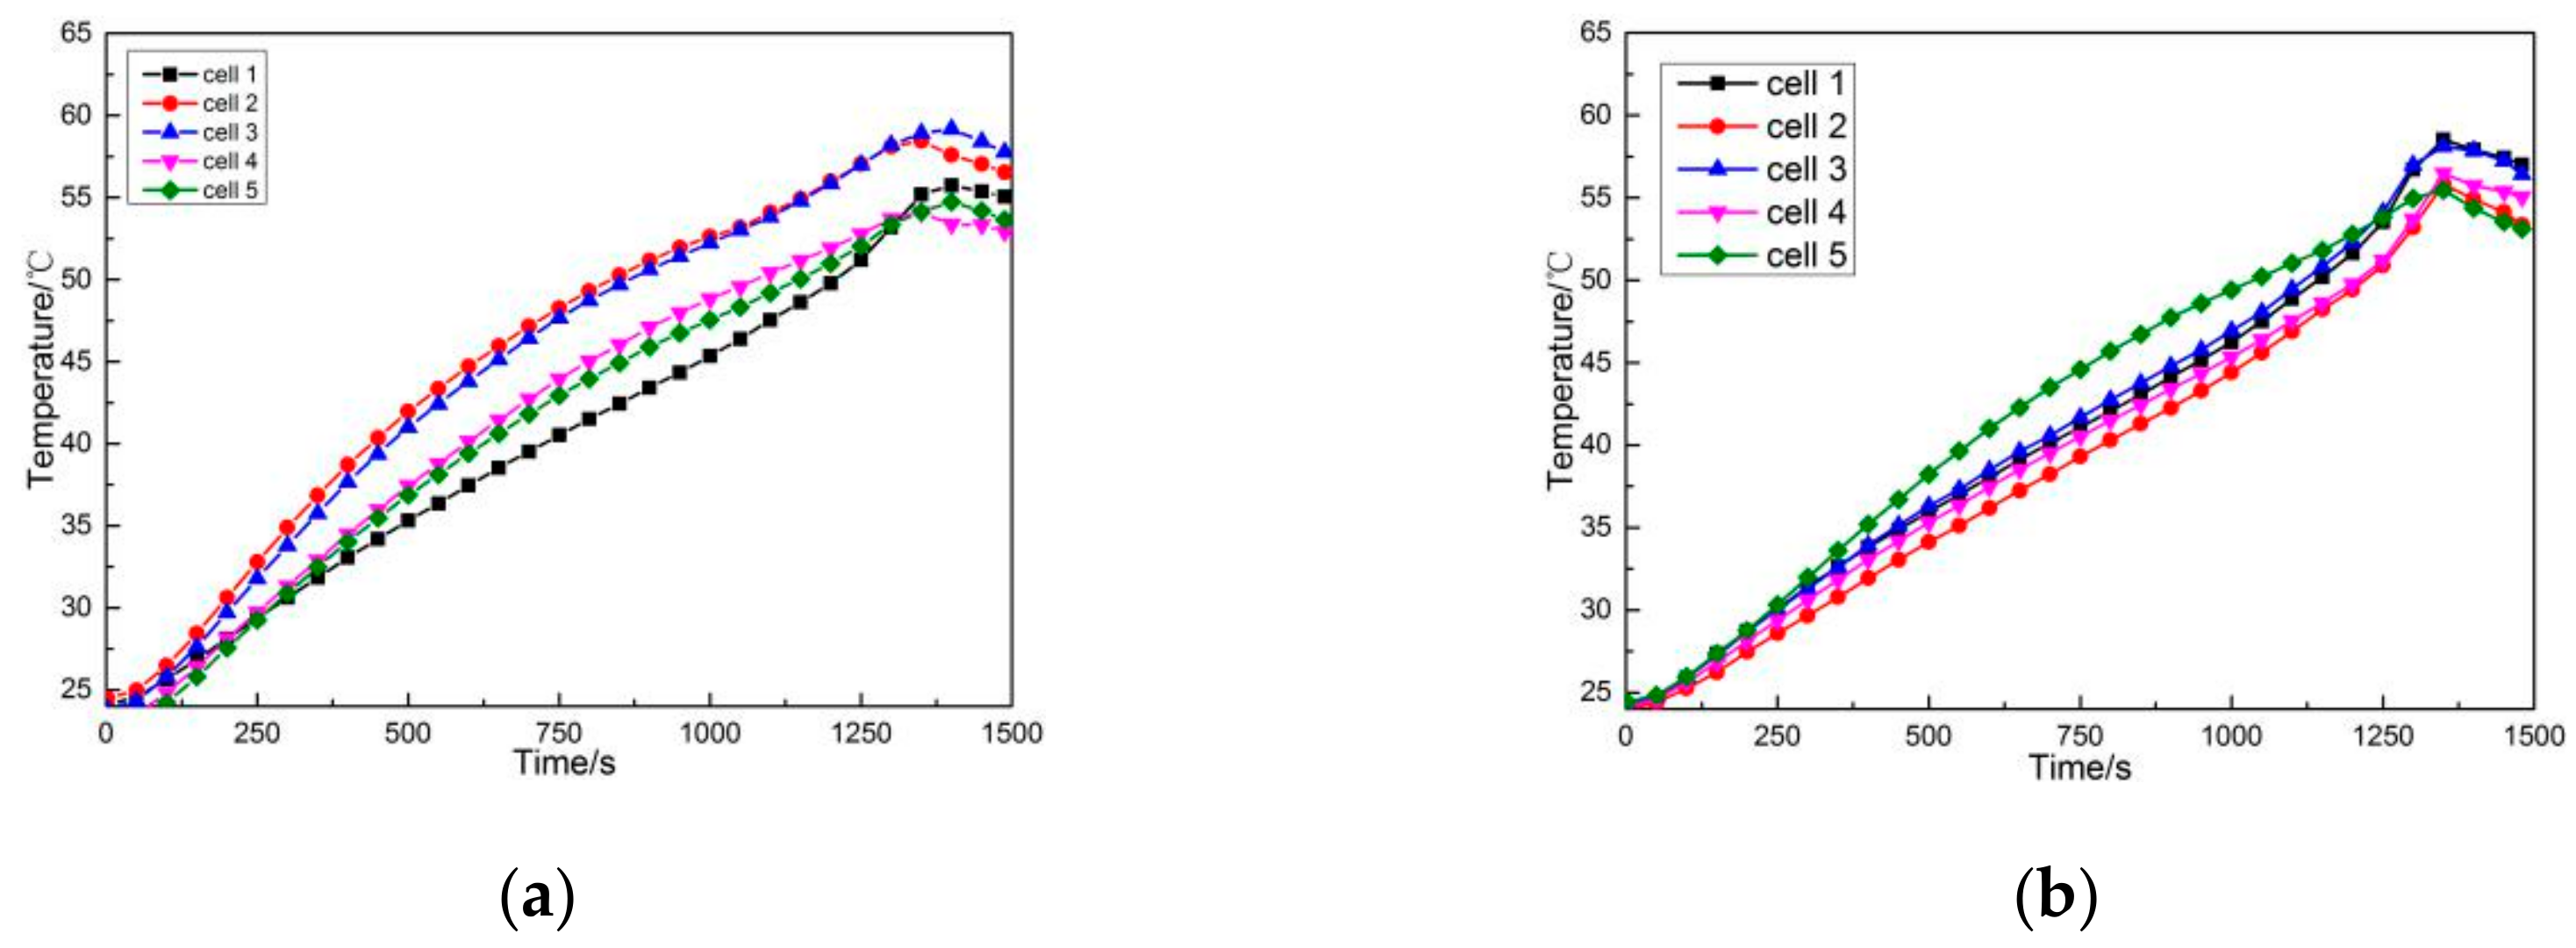
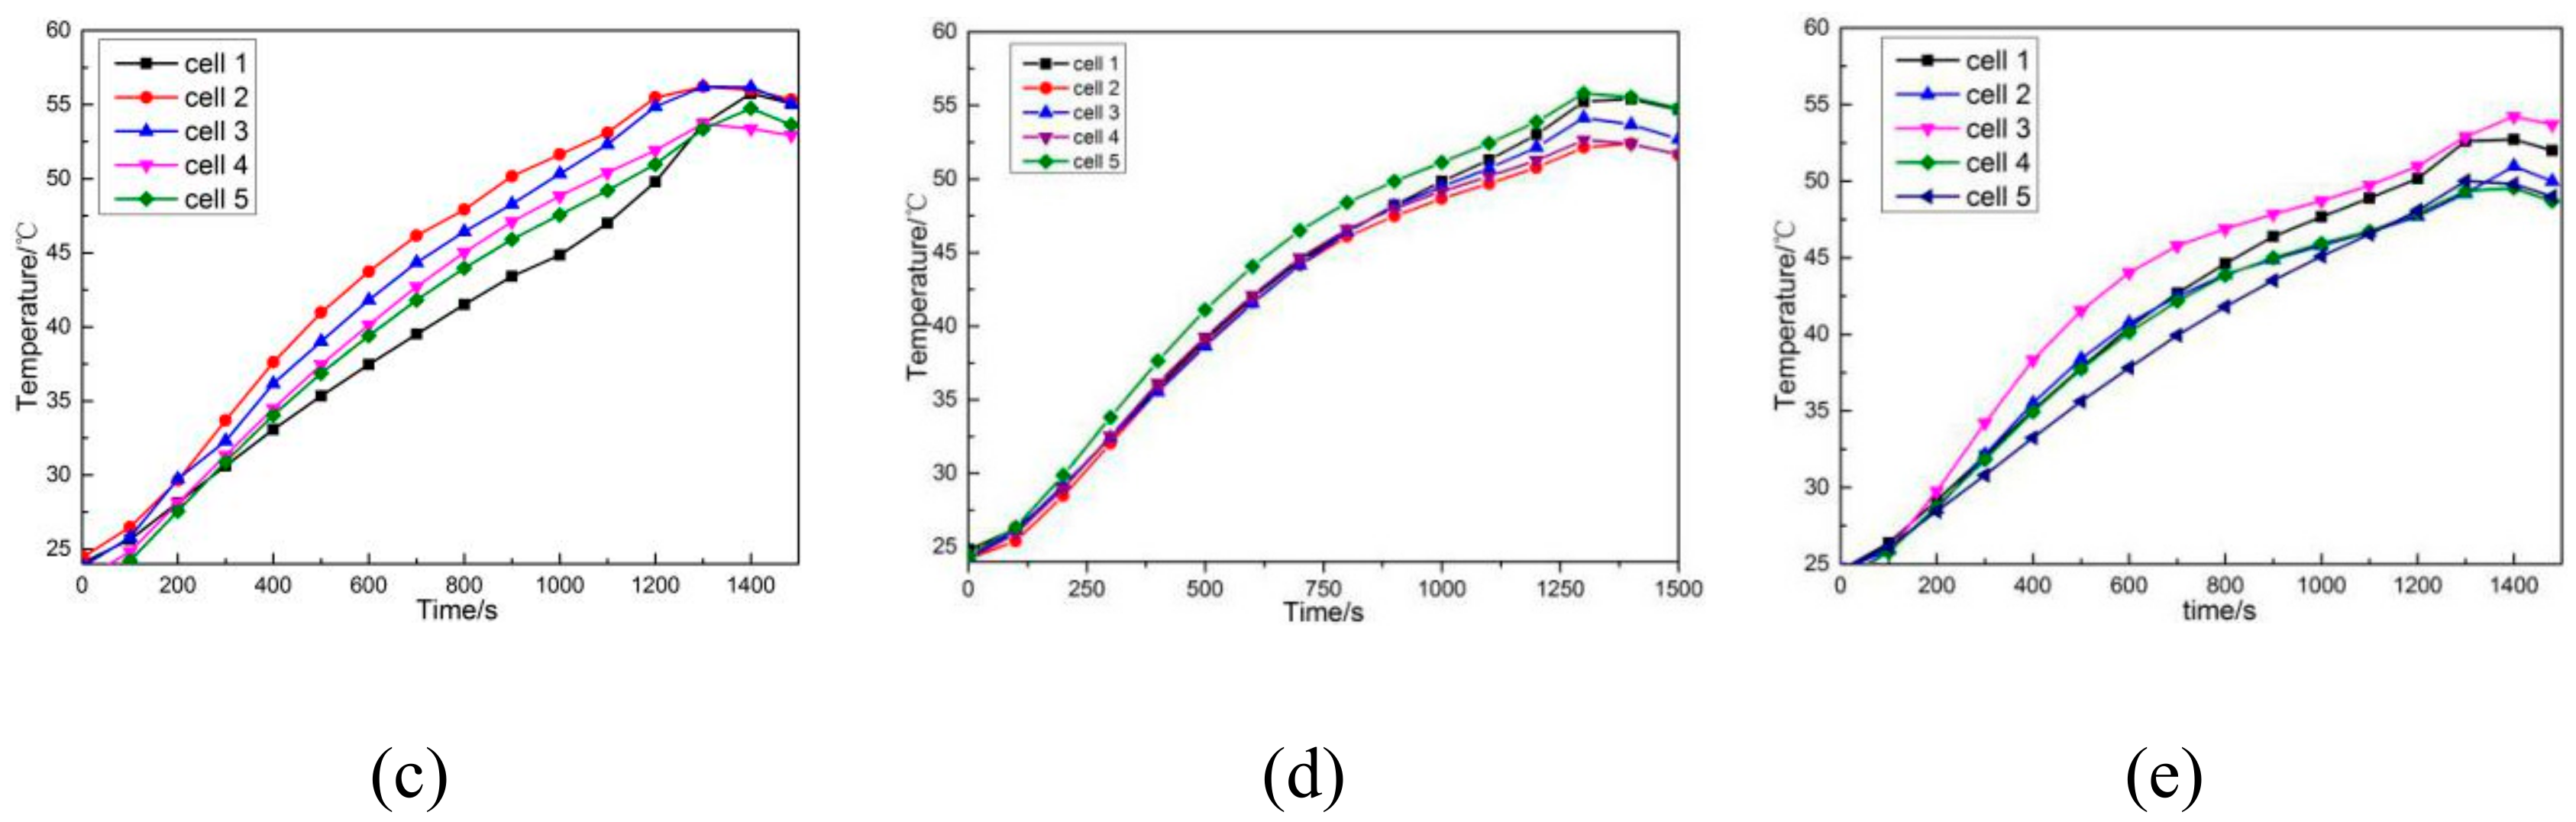
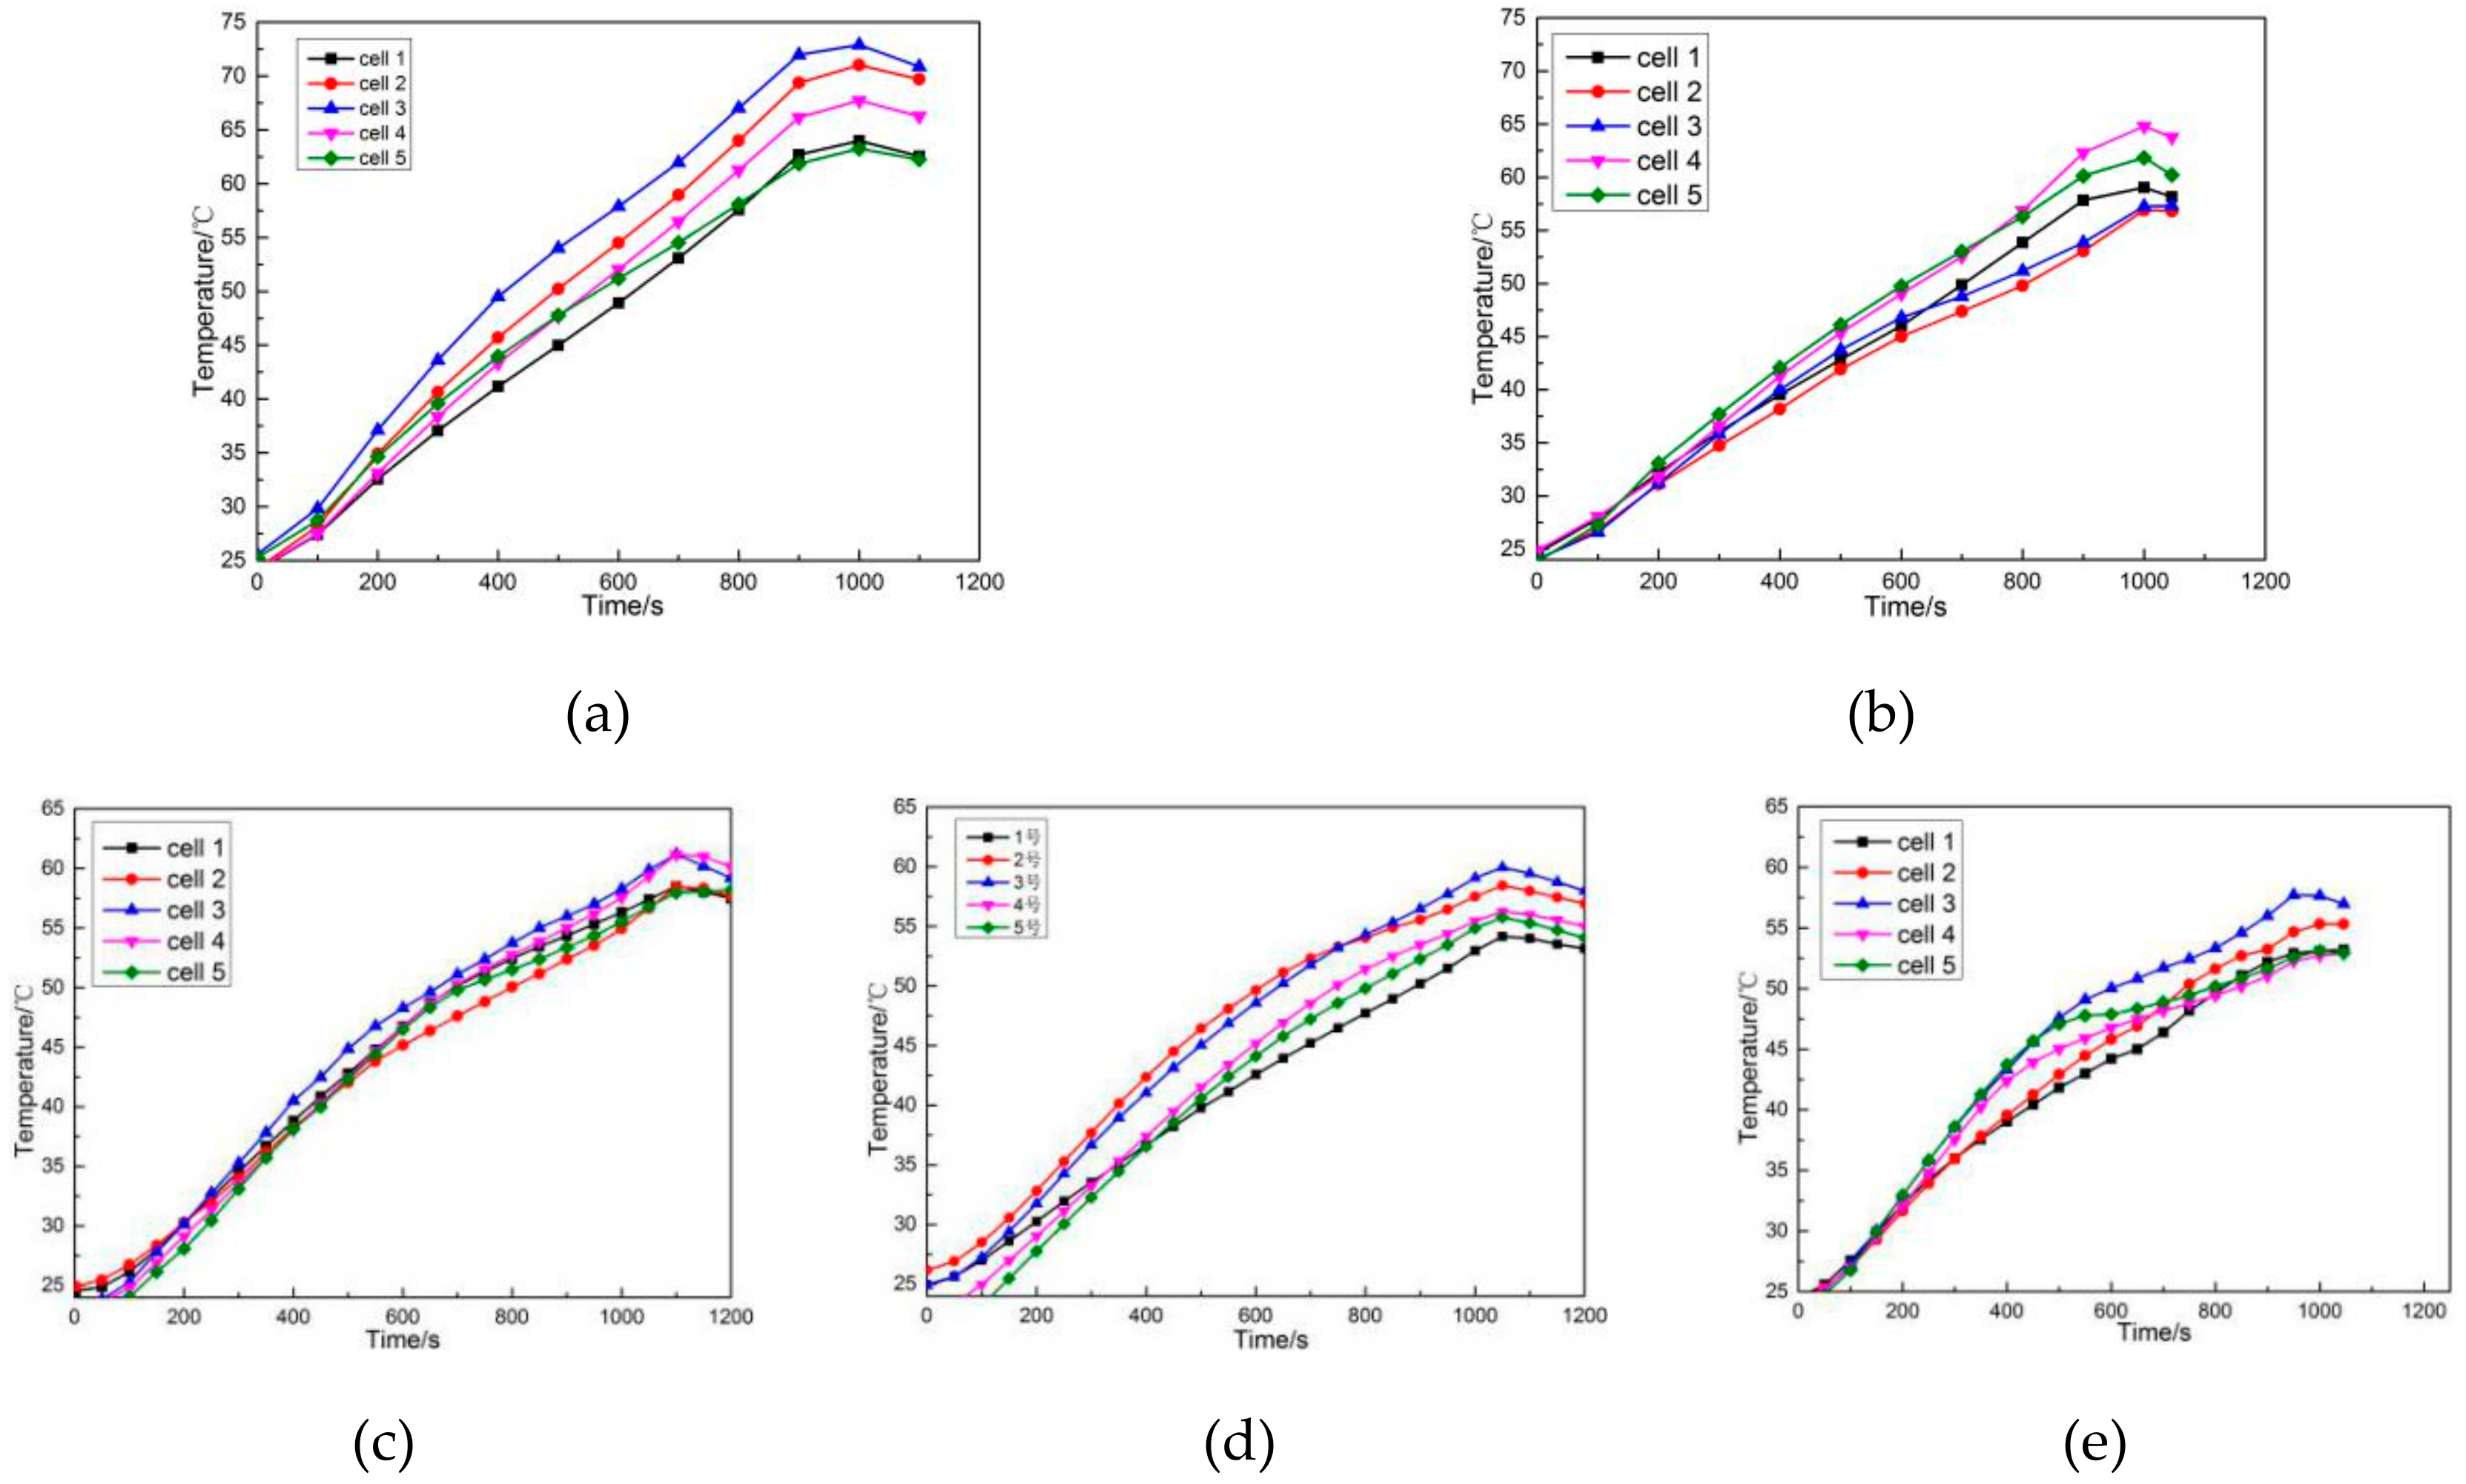
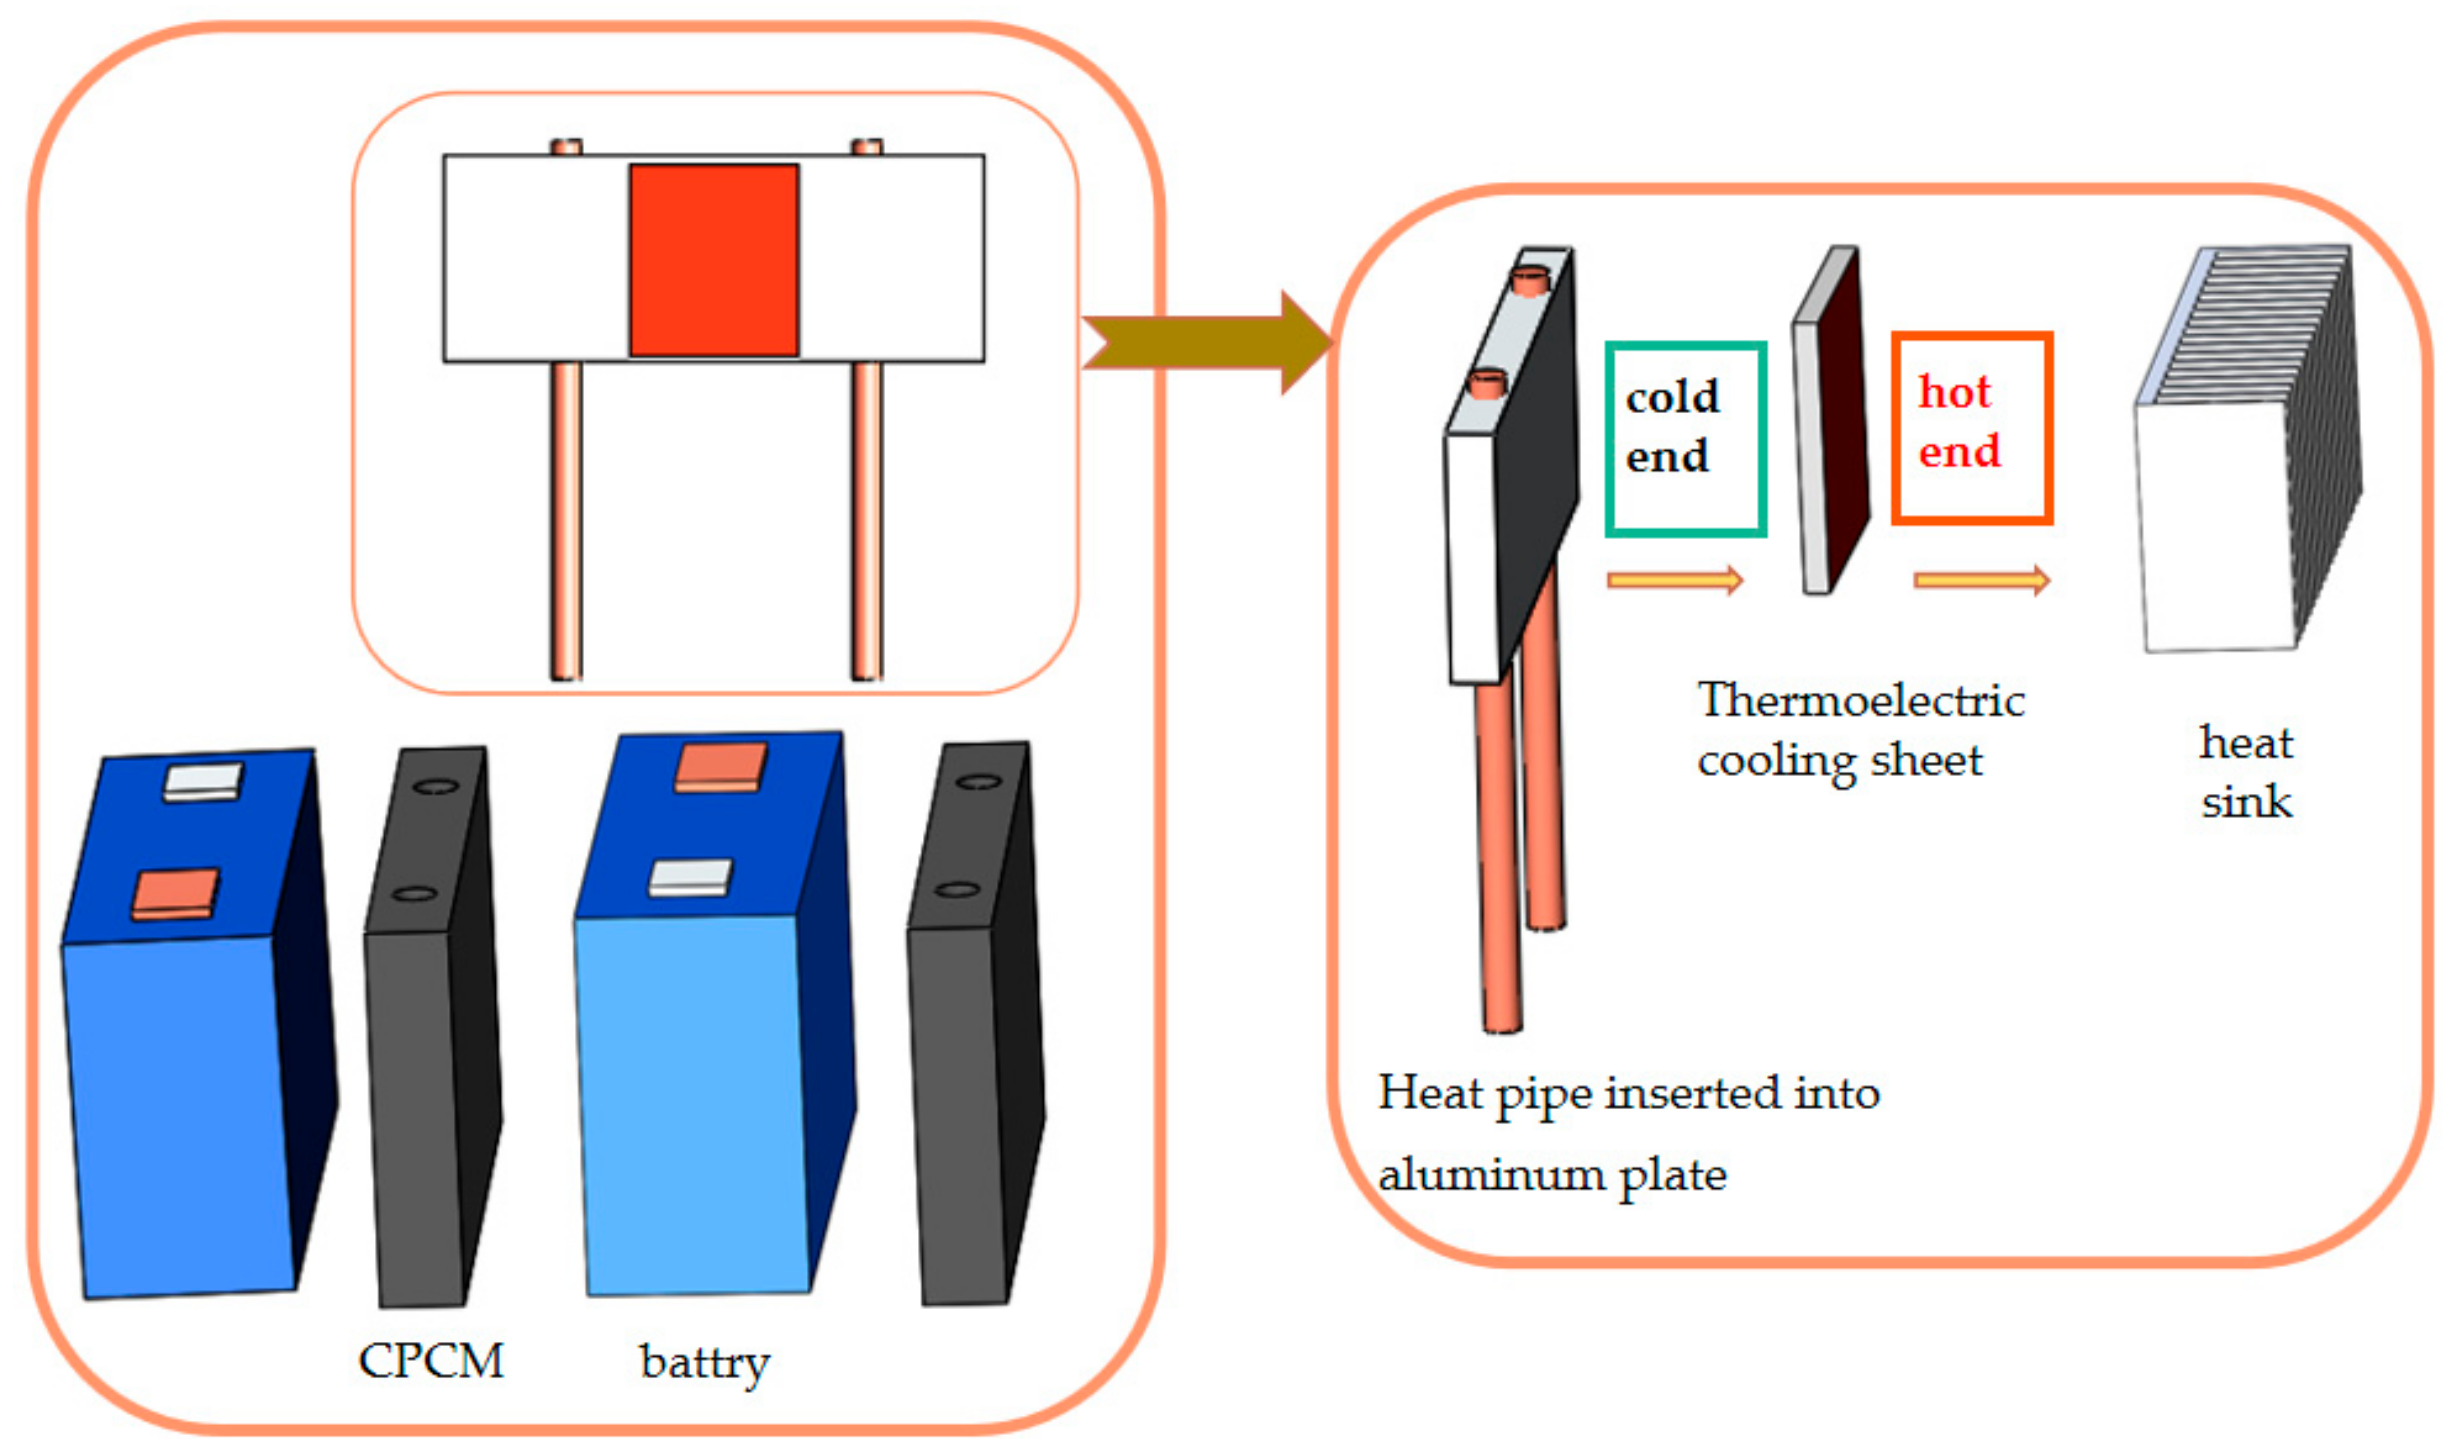
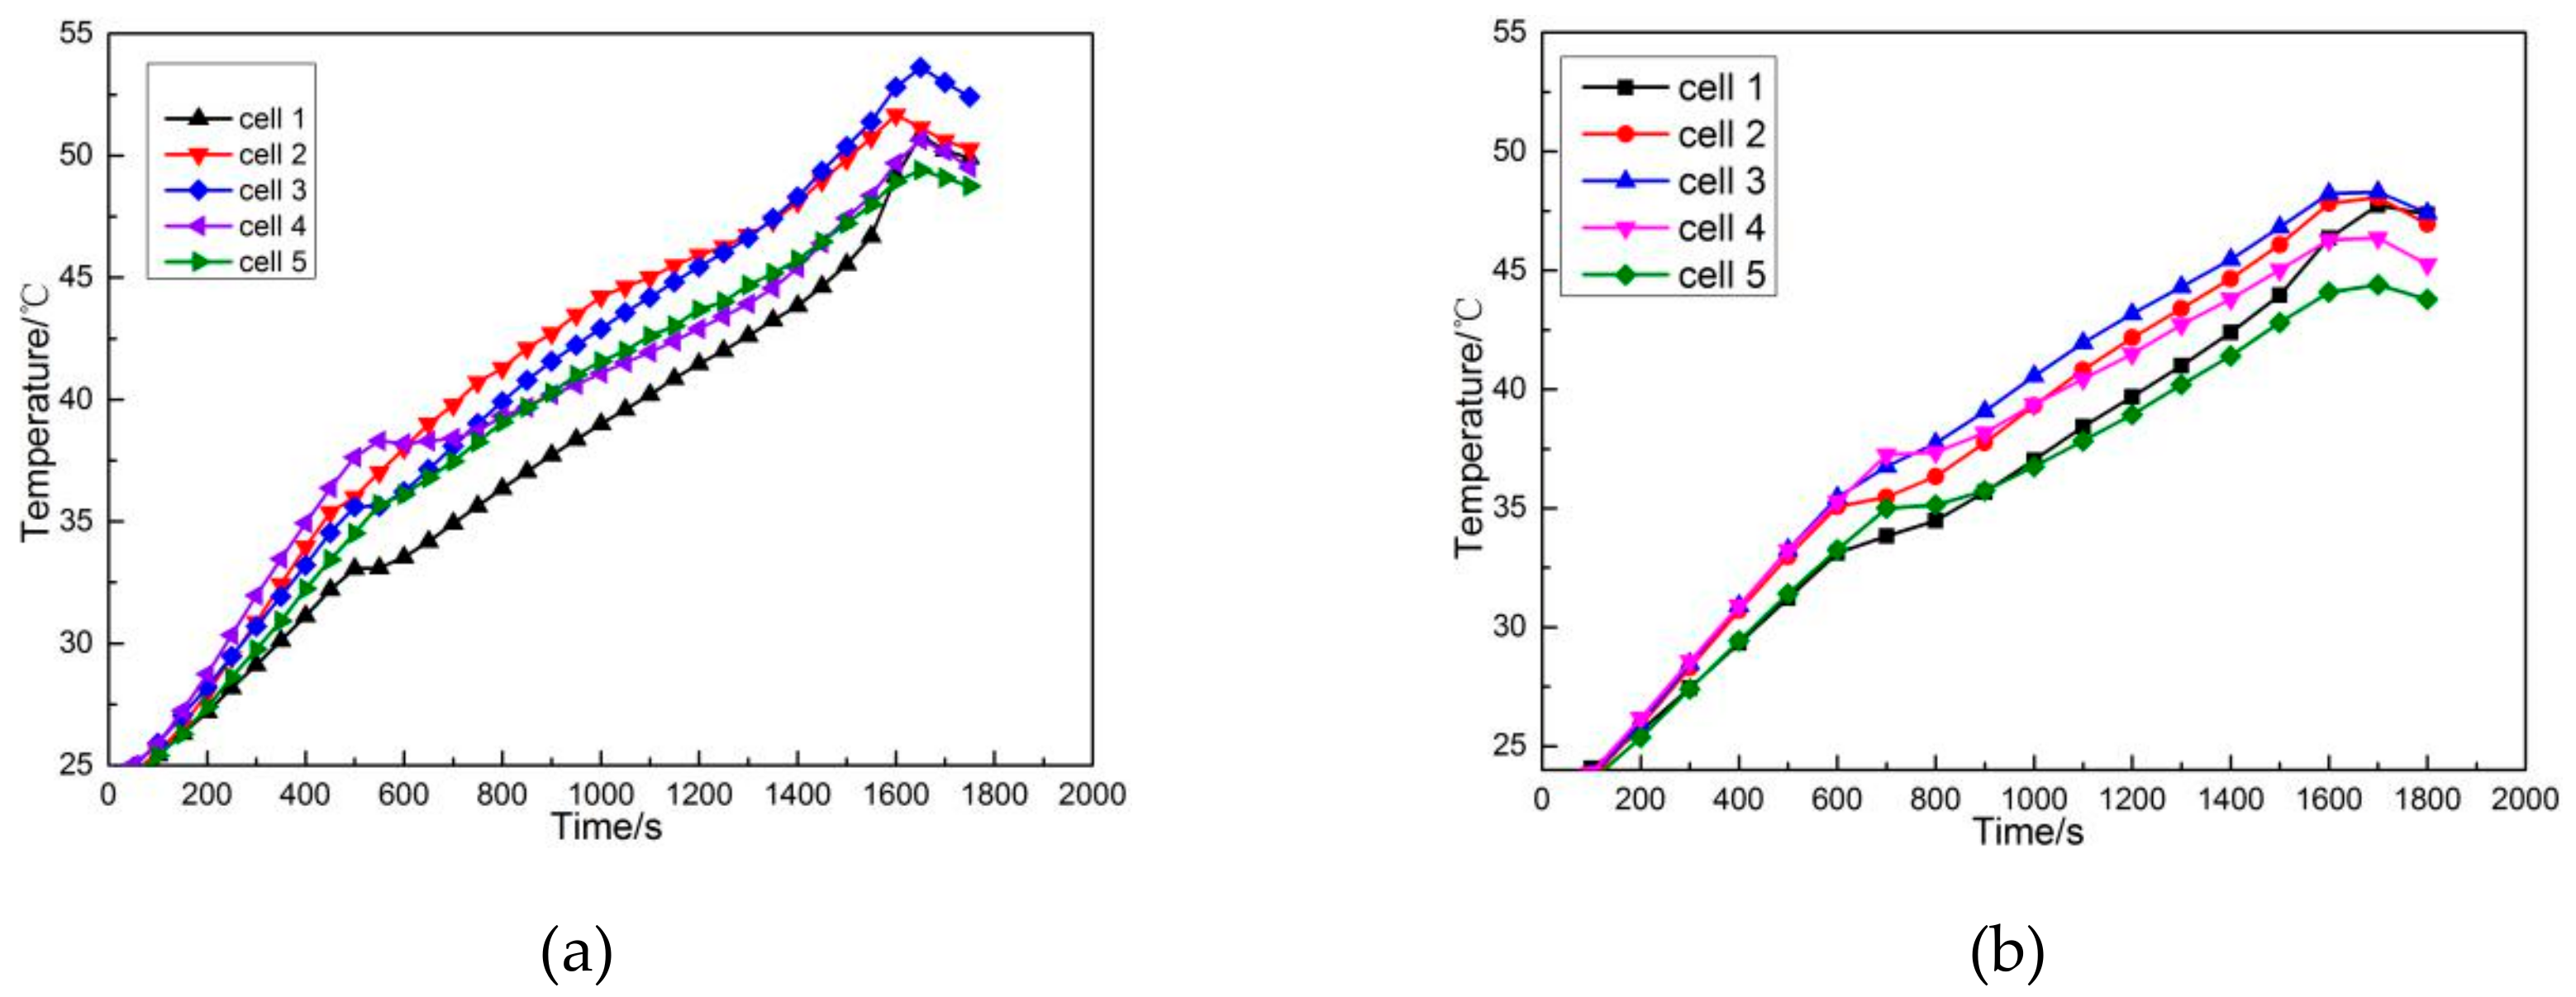
Based on the research above, this paper analyzed the influence of the content of thermally conductive particles (expanded graphite) in the phase change material on the thermal management of the battery. It also compared the effect which composite phase change material (CPCM) made by 0%, 5%, 10%, 15%, and 20% graphite content work in the battery thermal management system at different discharge rates and ambient temperatures, And combined with the thermoelectric cooling sheet to control temperature of the power battery. The best parameters of using composite phase change material and time of turning on the thermoelectric cooling sheet (TEC) in the thermal management system at different environmental temperatures was selected.

2. Theoretical Analysis

2.1. Battery Calorie Calculation

This paper selected a TAFEL-LAE895 100Ah ternary lithium ion power battery for study, and its main parameters are shown in Table 1 below:
Calculation method was used to estimate the heat generated by the ternary lithium battery. At present, the commonly adopted calculation method is that supposing the internal material of the lithium ion battery generates heat uniformly [25,26]. The heat generation mechanism of the lithium ion battery was analyzed from two aspects, internal resistance heat generation and entropy increase reaction heat generation. A theoretical calculation formula for the heat generation rate of the lithium battery is proposed, which is as shown in Equation (1):
Φ = I T d E d T + I ( E V )
In the formula, the first term on the right side of the equation represents the heat generated by the reversible chemical reaction. For lithium ion batteries, this is a constant with a reference value of 0.042. The second term represents irreversible reaction heat generation, such as ohmic internal resistance heat generation. I represents the charging and discharging current of the lithium ion battery; E represents the open circuit voltage of the lithium ion battery; V represents the working voltage of the lithium ion battery; T represents the internal temperature of the lithium ion battery; the E-V is equivalent to the product of the ohmic internal resistance R of the lithium ion battery and the current I. The formula is as shown in Equation (2):
Φ = 0.042 I + I 2 R
According to the method above and the physical parameters Table 2, combined Equations (1) and (2) [27], the heat generation of the lithium ion battery at different discharge rates and the theoretical battery’s surface temperature can be calculated, as shown in Table 3 below.

2.2. PCM Usage Calculation

As an organic PCM, paraffin wax (PW) has the advantages of high latent heat, low degree of subcooling, no chemical corrosion, phase separation, and low price. It has been widely used in PCM for energy storage and temperature control. The PCM selected in this paper is PW and the basic physical parameters are shown in Table 4.
Although paraffin has a high energy storage density, it can store and release heat stably. However, the thermal conductivity is low, which makes it difficult for the heat of the battery generated to quickly conduct to the interior of the paraffin in a short time. As a result, PW cannot fully maximize its latent heat function, reducing the utilization rate of paraffin. Moreover, after the paraffin melting, the stored latent heat of phase change cannot be released into the external environment in a short time, which affects the recycling of the paraffin. On the other hand, PW has a strong fluidity after melting, which is not convenient for packaging. Expanded graphite (EG) is widely used to enhance the thermal conductivity of PCM and to reduce the fluidity of the material after liquefaction, due to its light weight, strong adsorption, high thermal conductivity, and good compatibility with organic PCM. The amount of PCM can be calculated according to Equation (3):
M p c m = Q T Q B C p ( T s T ) + H
In the Formula, M p c m represents the quality of the PCM, Q T represents the total heat output of the battery, Q B represents the amount of heat to raise the battery temperature to the optimum operating temperature, C p represents the specific heat capacity of the PCM, T s represents the phase change temperature of the PCM, T represents the initial temperature of the PCM; H represents the latent heat of the PCM.
According to the analysis above and the battery maximum allowable discharge rate (3C), 0.192 kg of PW was required. The phase change PW thickness used here was 2cm. In order to improve the thermal conductivity of the phase change PW, the number of EG used in this paper was 800 mesh, with carbon content 99%, and expansion ratio of 200 times. According to the different ratio of EG and PW, they were made into CPCM block by 5%, 10%, 15%, and 20% to study its effect on battery thermal management performance.

3. Simulation Analysis

Since the heat generated by the battery is not dispersed equally, accurately analyzing the battery temperature field is a prerequisite to designing a highly efficient BTMS. The analytical and numerical simulation models are relatively simple and practical. There is great significance on the design of battery thermal management by simulating and analyzing the battery with the fluid dynamics, and simulating the surface temperature of the battery under different discharge rates.

3.1. Lithium Ion Battery Heat Generation Simulation Model Design

A three-dimensional (3D) model of single cell was modeled by solidworks (3D design software). The 3D model was introduced into fluid dynamics simulation module (Fluent), and meshed by Meshing. The unit quality of all grids is above 0.3, and 90% of the masses are above 0.8. The meshing results are shown in Figure 1.
The finished mesh model was imported into the fluent module to set the simulation boundary conditions. According to the theory of heat generation calculation, the internal heat generation of the battery was considered to be dispersed equally. When the simulation model was established, assumptions made for the lithium ion battery model were as follows: The internal material of the lithium ion battery is dispersed equally, the density is the same, and the volume and quality of the lithium ion battery remain unchanged during the whole process of heat production. Due to the poor fluidity of the electrolyte inside the lithium battery, we assumed that the electrolyte does not flow and ignored the convective heat transfer and radiation inside the battery in the simulation process. In the process of simulation, the fluent 17.0 3D double-precision solver transient simulation model was adopted, the first-order up-style and laminar flow mode was used, the energy equation and the phase change equation were used, and the environmental temperature was set at 25 °C. What is more, the external boundary conditions of the battery pack and the PCM were set to natural convection, and the convective heat transfer coefficient was set to 5w/(m2·k). According to the physical properties of the lithium ion battery selected here, the battery material was specifically defined. According to the material parameters selected in the experiment, the physical properties of the PW and the CPCM block were defined. The convergence standard was that continuity curve of the flow and energy control equations at 10-4 and 10-6. For the heat generation model of single cell, the iterative time step was set to 1s. For the CPCM and the CPCM combined with the semiconductor refrigeration sheet, due to the PCM being involved in the melting process, the iteration time step was controlled to be less than 0.5s to prevent diverging in the calculation process. The battery was defined as an internal heat source, whose heat production power was defined according to the theoretical heat production rate at different discharge rates calculated in the second section.

3.2. Simulation Results and Analysis

3.2.1. Simulation Results of Surface Temperature under Different Discharge Rates of Natural Heat Dissipation

Natural heat dissipation means that the battery pack works without any additional thermal management measures. The simulation results are shown in Figure 2.
It can be concluded that with the increase of the discharge rate, the surface temperature of the battery increased with an obvious tendency, and the range of the surface temperature became larger. The maximum temperature reached 71.83 °C under the 3C discharge rate. Even under the conditions of low-rate discharging, the surface temperature field distribution of the battery was inconsistent, and the overall temperature exceeded the safe temperature range of the battery (20–45 °C). Especially at 2C–3C discharge rate, the surface temperature of the battery exceeded 60 °C. If the battery is to work in such a high temperature, it will have a serious impact on battery performance and cycle life. What is worse, if working in high temperatures for a long time, heat will be accumulated, which causes thermal out of control, and even causes accidents such as battery fire and explosion. Therefore, conducting thermal management for the power battery pack is essential.

3.2.2. Simulation of PCM Melting Process

In order to make better use of the PCM for battery thermal management, we needed to study the melting process of PCM, learn about the problems in experiments, and analyze the experimental phenomena. This paper designed a two-dimensional paraffin melting model, with the energy equation and the phase change equation opened, the turbulent flow selected, and the heat source given to the right side of the paraffin. The paraffin material parameter definition is based on the paraffin property parameters selected in this paper. Since the paraffin absorbing heat is in line with time, a transient thermal simulation was required and the direction of gravity was selected to be the negative direction of the y-axis. The simulation process of paraffin melting was slow—to prevent the calculation process from diverging, it was necessary to control the initial field and set the time step to 0.01s. As the operation converged, the time step was gradually increased. The other boundary condition parameters remained as system default. After finishing the operation, the liquid phase simulation cloud image shown in Figure 3 was obtained.
It can be seen from Figure 3 that as the PW continued absorbing heat, a small part of the PW on the left side was completely melted into a liquid state. At this time, the liquid PW had strong fluidity and was effected by gravity, in which case the liquid PW began to deposit downward. At this time, the liquid paraffin had a high temperature, and heat conduction with the solid paraffin caused the liquid paraffin to begin to melt. With the entire endothermic process being further, this process converted into other process with liquid paraffin as a heat transfer medium, where the paraffin block gradually melted from the upper left to the lower right. This process shows that the thermal conductivity of PW is low, which led to the result that PW cannot fully exert its ability to absorb heat. Therefore, there are two aspects that need to be improved in practical application: The first is to enhance the thermal conductivity of paraffin itself, and the second is to reduce the fluidity of paraffin.

4. Experimental System and Test

Under the guidance of the theoretical analysis of the second section and the results of the simulation analysis in the third section, this paper designed a natural heat dissipation experiment of the battery pack: Thermal management experiment of PCM and CPCM combined with semiconductor refrigeration sheet battery thermal management experiments.

4.1. Experimental Design

In order to maintain the consistency and reduce the influence of environmental temperature on the experiment, the battery pack was placed in the thermotank during the experiment, and stable ambient temperature was 25 °C. Charged and discharged the battery pack with a charge and discharge tester, and temperature acquisition system used an Agilent data acquisition instrument and T-type thermocouple. Combination of five lithium ion batteries in series formed an experimental battery pack whose working voltage was 14 v–21 v. The experimental work platform is shown in Figure 4.

4.2. Surface Temperature Rise Experiment under Different Discharge Rates of Natural Heat Dissipation

After the temperature of the thermostat was set to 25 °C, 5 cells were connected in groups of 2 centimeters apart, placed in a constant temperature chamber, and kept for 7 hours to make the battery evenly heated. We conducted different rate discharge tests when the battery surface temperature was constant at 25 °C, and selected constant current and constant voltage (CCCV) charging mode. In order to ensure the same discharge capacity in each experiment, and to protect the battery, each discharge was 90Ah. After each charge and discharge, it was kept for 12 hours to make the surface temperature of the battery return to 25 °C. Three temperature measuring points were arranged symmetrically on the front and back sides of each single cell. After the experiment was completed, the temperature data obtained from the six temperature measuring points of each battery were averaged to characterize the temperature characteristics of the battery.
From Figure 5, we can see the temperature rise of the battery surface under natural heat dissipation. As shown in Figure 5a, the surface temperature rise of the battery during 1C discharge is not high—the maximum temperature is 42 °C, and the temperature range between the cells is 2 °C. However, as the discharge rate increases, the temperature rise rate of the battery and the temperature range between the individual cells increases significantly. As shown in Figure 5e, when the discharge rate is increased to 3C, the maximum temperature of the battery reaches 75.5 °C, and the temperature difference between the cells reaches 13 °C. When the battery pack is operated at a high temperature for a long time, the battery capacity between the individual cells may be unbalanced, and the voltage range between the individual cells during charging and discharging becomes larger. Due to the 1C discharge rate not being high and the battery surface temperature being within the optimal performance temperature range, the surface temperature of the 1C discharge rate is not studied below.

4.3. Experiment on Cell Surface Temperature Rise under Different Discharge Rates of CPCM Thermal Management System

4.3.1. Battery Surface Temperature Rise Experiment under 1.5C Discharge Rate

As can be seen from Figure 6a, when a lithium ion battery is at a discharge rate of 1.5 C, and uses pure paraffin for battery thermal management, the surface temperature of the battery is not high and the temperature rise rate is not fast. When the discharge is promising to finish, there is a large temperature range at the surface of battery, because PW attached to the surface of the battery has melted, as shown in Figure 7. After the paraffin has melted, it creates a gap between the surface of the battery and loses its heat absorption capacity, which results in a sudden temperature increase in the surface of battery. After adding the EG by 5% mass ratio, the surface temperature of the battery during 1.5C discharge is significantly reduced and more stable, and the maximum temperature is no more than 47 °C, as shown in Figure 6b. It can be seen that the CPCM with graphite content of 5% has better thermal management effect on the lithium ion battery at 1.5C discharge rate, which can meet its thermal management requirements. Therefore, the thermal management effect of the higher graphite content at 1.5C discharge rate is not further studied below.

4.3.2. Battery Temperature Rise Test under 2C Discharge Rate

From Figure 8, we can see the surface temperature curve of the battery under thermal management using CPCM with different graphite contents at 2C discharge rate. Thermal management system for CPCM with low graphite content during 2C discharge is not effective. As is shown in Figure 8a,b the surface temperatures of the cell are up to 61 °C and 54 °C, respectively. However, as the graphite content increases gradually, the maximum temperature gradually decreases. When the graphite content is increased to 20%, the maximum surface temperature of the battery is between 45 °C and 49 °C, and the temperature difference is 4 °C. Although the maximum temperature is significantly reduced, it exceeds the optimal operating temperature of the battery.

4.3.3. Battery Temperature Rise Test under 2.5C Discharge Rate

From Figure 9, we can see the battery surface temperature curve of CPCM thermal management with different EG content under 2.5C discharge rate. During the 2.5C discharge process, the surface temperature of the battery fluctuates greatly. The overall performance is that the surface temperature is high and the temperature difference reaches 7 °C. It can be seen from Figure 9 that due to low graphite content, the thermal conductivity of CPCM is low, and the heat generated by the battery cannot be transferred into PCM in time, resulting in high battery temperature and large temperature difference. As the graphite content increases gradually, the above phenomenon is improved, and the maximum temperature and temperature difference are both lowered. Under the thermal management of 20% graphite CPCM, the surface temperature of the battery is still raised to about 54.5 °C. This indicates that although the thermal conductivity of the CPCM is increased, the heat storage capacity is limited, which cannot meet the battery thermal management requirements under high-rate discharge conditions.

4.3.4. Battery Temperature Rise Test under 3C Discharge Rate

When the discharge rate was increased to 3C, the surface temperature of the battery under the pure paraffin BTMS increased to 73 °C, as shown in Figure 10a. It shows that the pure paraffin BTMS has almost no effect on the lithium ion battery under high rate discharge. When the graphite content increases to 15%, the battery temperature still rises to 60 °C. When the graphite content increases to 20%, the battery temperature still exceeds optimum operating temperature. As the graphite content increases, the proportion of paraffin in the same volume of PCM gradually decreases, and the overall heat storage capacity of the CPCM is also reduced. Therefore, in the thermal management system, continuously increasing the graphite content cannot meet the thermal management requirements of the battery.

4.4. Thermal Management Experiment with Combined Semiconductor Refrigeration Sheet and CPCM

In order to solve the problem that CPCM has limited thermal management capabilities, this paper introduces semiconductor refrigeration sheets, also known as TEC, using the Peltier effect of semiconductor material to carry heat from the cold terminal to the hot terminal [25,26]. A semiconductor refrigeration sheet is combined with the CPCM through heat pipe, and CPCM is cooled by its refrigeration function, such as is shown in Figure 11.
This management system requires CPCM to have higher thermal conductivity and better heat storage capability. In order to meet the above two requirements, this paper selected CPCM block with graphite content of 15% and 20% for the experiments. A battery thermal management model combining a semiconductor refrigeration chip and CPCM was designed. The whole model has a simple structure and high reliability. Under the condition of low discharge rate, the endothermic energy storage function of the CPCM can be utilized, and a certain temperature control function can be realized without consuming the energy of the battery pack. When the lithium ion battery is discharged at high rate or the surface temperature of the battery is higher than the set threshold, the semiconductor refrigeration sheet is activated to cool the CPCM. The heat that cannot be absorbed by CPCM can be timely exported to the outside, which helps to further improve the temperature control performance of the thermal management system. The following is a combination of 15% and 20% graphite content CPCM combined with a semiconductor refrigeration sheet, and its thermal management performance is verified at high discharge rate.

4.4.1. Battery Surface Temperature Rise Experiment under 2C Discharge Rate

From Figure 12a,b, we can see the surface temperature curve of the battery at 2C discharge rate after the combination of 15% and 20% graphite CPCM and semiconductor refrigeration sheets, respectively. It can be seen from Figure 12a and Figure 8d that the PCM with 15% graphite content increased the surface temperature of the battery to 44.5 °C–48 °C under 2C discharge rate, after the thermoelectric sheet was added. The maximum temperature was reduced by 3.5 °C, and the temperature range was reduced from 6.5 °C to 3.5 °C, thus the cooling effect is obvious. It can be seen from Figure 12a and Figure 8e that after the 20% graphite content CPCM is combined with the thermoelectric sheet, the maximum temperature drops to 42.3 °C–45.5 °C, which achieved the optimal working temperature of the lithium ion battery.

4.4.2. Battery Surface Temperature Rise Experiment under 3C Discharge Rate

It can be seen from Figure 13a and Figure 10d that at the 3C discharge rate, the PCM with 15% graphite content increased the maximum surface temperature of the battery from 60.2 °C to 52.6 °C after the thermoelectric sheet is increased. The maximum temperature is reduced by 7.6°C, and the maximum temperature difference is reduced by 3 °C. It can be seen from Figure 13b and Figure 10e that the maximum temperature and the maximum temperature difference are reduced by 4.7 °C and 0.6 °C, respectively. It can be concluded that the combination of 20% graphite content CPCM and the thermoelectric sheet can control the surface temperature of the battery between 46.5 °C and 49.5 °C under 3C discharge rate. This indicates that proper increasing of graphite content helps to increase the thermal conductivity of the PCM and improve the uniformity of the battery temperature.

5. Conclusions

As the charge and discharge rates increase, the surface temperature of the lithium ion battery also increases, and the temperature uniformity between the battery packs and the individual cells worsen. According to the heating condition of lithium ion battery under different discharge rates and the heat absorption capacity of paraffin, this paper combined EG with thermoelectric refrigeration for battery cooling, and experimentally verified the following results. As shown in Table 5, the maximum temperature and the highest temperature difference of the surface of the battery are obtained when the PCM with different graphite content is used for cooling the battery under different discharge rates. Table 6 shows the maximum temperature and maximum temperature difference of the battery surface when the battery is dissipated with different graphite content phase change materials combined with thermoelectric cooling sheets under different discharge rates. Based on the above research, the following conclusions are drawn:
(1) Pure PW has poor thermal conductivity and strong fluidity after melting, therefore the ability of thermal management is lost under the large-rate discharge condition.
(2) The EG and PW can effectively improve the battery thermal management properties when mixed in a certain ratio. However, it also reduces the heat storage capacity of the CPCM under the same volume.
(3) The thermoelectric sheet can be activated in the high-power discharge process for secondary cooling of the power battery. The combination of semiconductor refrigeration technology and CPCM can control the maximum temperature of the battery surface within 45 °C, and the temperature difference is controlled within 4 °C.

Author Contributions

Conceptualization, C.-W.Z.; Data curation, S.-R.C. and S.-T.L.; Formal analysis, S.-R.C. and Z.X.; Methodology, H.-B.G.; Software, K.-J.X.

Funding

This work was supported by the National Key R&D Program of China (2018YFC0808203). It was also financially supported by the Xi’an University of Science and Technology.

Conflicts of Interest

The authors declare no conflict of interest.

References

  1. Yang, T.-R.; Sun, Q.; Ronald, W.; Chen, L. Review of phase change matericils for cold thermal energy storage. J. Eng. Thermophys. 2018, 39, 567–573. [Google Scholar]
  2. Guo, L. Thermal Analysis and Cooling Optimization of Lithium-Ion Power Battery. Master’s Thesis, Chang’an University, Xi’an, China, 2016. [Google Scholar]
  3. Na, X.; Kang, H.; Wang, T.; Wang, Y. Reverse layered air flow for Li-ion battery thermal management. Appl. Therm. Eng. 2018, 143, 257–262. [Google Scholar] [CrossRef]
  4. Lv, Y.; Yang, X.; Zhang, G.; Li, X. Experimental research on the effective heating strategies for a phase change material based power battery module. Int. J. Heat Mass Transf. 2019, 128, 392–400. [Google Scholar] [CrossRef]
  5. Al-Zareer, M.; Dincer, I.; Rosen, M.A. Novel thermal management system using boiling cooling for high powered lithium-ion battery packs for hybrid electric vehicles. J. Power Sources 2017, 363, 291–303. [Google Scholar] [CrossRef]
  6. Zhao, C.; Sousa, A.C.M.; Jiang, F. Minimization of thermal non-uniformity in lithium-ion battery pack cooled by channeled liquid flow. Int. J. Heat Mass Transf. 2019, 129, 660–670. [Google Scholar] [CrossRef]
  7. Li, K.; Yan, J.; Chen, H.; Wang, Q. Water cooling based strategy for lithium ion battery pack dynamic cycling for thermal management system. Appl. Therm. Eng. 2018, 132, 575–585. [Google Scholar] [CrossRef]
  8. Mondal, B.; Lopez, C.F.; Verma, A.; Mukherjee, P.P. Vortex generators for active thermal management in lithium-ion battery systems. Int. J. Heat Mass Transf. 2018, 124, 800–815. [Google Scholar] [CrossRef]
  9. Lan, C.; Xu, J.; Qiao, Y.; Ma, Y. Thermal management for high power lithium-ion battery by minichannel aluminum tubes. Appl. Therm. Eng. 2016, 101, 284–292. [Google Scholar] [CrossRef]
  10. Al-Hallaj, S.; Selman, J.R. Battery system thermal management. U.S. Patent 2006/0 073 377 A1, 6 April 2006. [Google Scholar]
  11. Saw, L.H.; Poon, H.M.; Thiam, H.S.; Cai, Z.; Chong, W.T.; Pambudi, N.A.; King, Y.J. Novel thermal management system using mist cooling for lithium-ion battery packs. Appl. Energy 2018, 223, 146–158. [Google Scholar] [CrossRef]
  12. Xie, Y.; Tang, J.; Shi, S.; Xing, Y.; Wu, H.; Hu, Z.; Wen, D. Experimental and numerical investigation on integrated thermal management for lithium-ion battery pack with composite phase change materials. Energy Convers. Manag. 2017, 154, 562–575. [Google Scholar] [CrossRef]
  13. Rao, Z.; Wang, Q.; Huang, C. Investigation of the thermal performance of phase change material/mini-channel coupled battery thermal management system. Appl. Energy 2016, 164, 659–669. [Google Scholar] [CrossRef]
  14. Pan, M.; Zhong, Y. Experimental and numerical investigation of a thermal management system for a Li-ion battery pack using cutting copper fiber sintered skeleton/paraffin composite phase change materials. Int. J. Heat Mass Transf. 2018, 126, 531–543. [Google Scholar] [CrossRef]
  15. Zou, D.; Ma, X.; Liu, X.; Zheng, P.; Hu, Y. Thermal performance enhancement of composite phase change materials (PCM) using graphene and carbon nanotubes as additives for the potential application in lithium-ion power battery. Int. J. Heat Mass Transf. 2018, 120, 33–41. [Google Scholar] [CrossRef]
  16. Wu, W.; Yang, X.; Zhang, G.; Ke, X.; Wang, Z.; Situ, W.; Li, X.; Zhang, J. An experimental study of thermal management system using copper mesh-enhanced composite phase change materials for power battery pack. Energy 2016, 113, 909–916. [Google Scholar] [CrossRef]
  17. Rao, Z.; Wang, S.; Zhang, G. Simulation and experiment of thermal energy management with phase change material for ageing LiFePO 4 power battery. Energy Convers. Manag. 2011, 52, 3408–3414. [Google Scholar] [CrossRef]
  18. Huo, Y.; Rao, Z. Investigation of phase change material based battery thermal management at cold temperature using lattice Boltzmann method. Energy Convers. Manag. 2017, 133, 204–215. [Google Scholar] [CrossRef]
  19. Shi, S.; Xie, Y.; Li, M.; Yuan, Y.; Yu, J.; Wu, H.; Liu, B.; Liu, N. Non-steady experimental investigation on an integrated thermal management system for power battery with phase change materials. Energy Convers. Manag. 2017, 138, 84–96. [Google Scholar] [CrossRef]
  20. Wu, W.; Yang, X.; Zhang, G.; Chen, K.; Wang, S. Experimental investigation on the thermal performance of heat pipe-assisted phase change material based battery thermal management system. Energy Convers. Manag. 2017, 138, 486–492. [Google Scholar] [CrossRef]
  21. Ahmadi Atouei, S.; Rezania, A.; Ranjbar, A.A.; Rosendahl, L.A. Protection and thermal management of thermoelectric generator system using phase change materials: An experimental investigation. Energy 2018, 156, 311–318. [Google Scholar] [CrossRef]
  22. Situ, W.; Zhang, G.; Li, X.; Yang, X.; Wei, C.; Rao, M.; Wang, Z.; Wang, C.; Wu, W. A thermal management system for rectangular LiFePO4 battery module using novel double copper mesh-enhanced phase change material plates. Energy 2017, 141, 613–623. [Google Scholar] [CrossRef]
  23. Chen, Y.; Tang, Z.; Lu, X.; Tan, C. Research of Explosion Mechanism of Lithium-Ion Battery. Prog. Chem. 2006, 18, 823–831. [Google Scholar]
  24. Fang, Q.; Wei, X.; Lu, T.; Dai, H.; Zhu, J. A State of Health Estimation Method for Lithium-Ion Batteries Based on Voltage Relaxation Model. Energies 2019, 12, 1349. [Google Scholar] [CrossRef]
  25. Zhang, C.-W.; Xu, K.-J.; Li, L.-Y.; Yang, M.-Z.; Gao, H.-B.; Chen, S.-R. Study on a Battery Thermal Management System Based on a Thermoelectric Effect. Energies 2018, 11, 279. [Google Scholar] [CrossRef]
  26. Worwood, D.; Marco, J.; Kellner, Q.; Hosseinzadeh, E.; McGlen, R.; Mullen, D.; Lynn, K.; Greenwood, D. Experimental Analysis of a Novel Cooling Material for Large Format Automotive Lithium-Ion Cells. Energies 2019, 12, 1251. [Google Scholar] [CrossRef]
  27. Zhang, J. Research on Power Batteries Thermal Management Technology Based on PCM. Master’s Thesis, Guangdong University of Technology, Guangzhou, China, 2013. [Google Scholar]
Figure 1. Single battery grid meshing results.
Energies 12 01937 g001
Figure 2. Battery surface temperature at different discharge rates.
Energies 12 01937 g002
Figure 3. Paraffin melting liquid rate diagram.
Energies 12 01937 g003
Figure 4. Test platform.
Energies 12 01937 g004
Figure 5. Temperature curve under different discharge rates and natural heat dissipation at 25 °C ambient temperature: (a)1C; (b) 1.5C; (c) 2C; (d) 2.5C; (e) 3C.
Energies 12 01937 g005
Figure 6. Temperature curve of battery under different graphite content of 1.5C discharge rate: (a) 0% expanded graphite (EG); (b) 5% EG.
Energies 12 01937 g006
Figure 7. Image of pure paraffin melting under 1.5C discharge rate: (a) Before absorbing heat; (b) After heat absorption.
Energies 12 01937 g007
Figure 8. Surface temperature curve of the battery under different graphite content of 2C discharge rate: (a) 0% EG; (b) 5% EG; (c) 10% EG; (d) 15% EG; (e) 20% EG.
Energies 12 01937 g008
Figure 9. Surface temperature curve of the battery under different EG content of 2.5C discharge rate: (a) 0% EG; (b) 5% EG; (c) 10% EG; (d) 15% EG; (e) 20% EG.
Energies 12 01937 g009aEnergies 12 01937 g009b
Figure 10. Surface temperature curve of the battery under different EG content of 3C discharge rate: (a) 0% EG; (b) 5% EG; (c) 10% EG; (d) 15% EG; (e) 20% EG.
Energies 12 01937 g010
Figure 11. Thermal management schematic diagram of a thermoelectric sheet combined with CPCM.
Energies 12 01937 g011
Figure 12. Surface temperature curve at 2C discharge rate under thermal management of different EG content CPCM combined with thermoelectric refrigeration sheets: (a) 15% EG; (b) 20% EG.
Energies 12 01937 g012
Figure 13. Surface temperature curve at 2C discharge rate under thermal management of different EG content CPCM combined with thermoelectric refrigeration sheets: (a) 15% EG; (b) 20% EG.
Energies 12 01937 g013
Table 1. TAFEL-LAE895 battery specifications.
TitleBattery ModelSize (mm)Capacity (V/Ah)Maximum Discharge RateMaximum Charge RateOptimum Temperature (°C)
ParameterTAFEL—LAE89552*148*96(L*W*H)3.6/1005C3C20–45
Table 2. Battery physical parameter.
Density (kg/m3)Specific Heat Capacity (J/Kg °C)Thermal Conductivity in the x Direction w/(m·k)Thermal Conductivity in the y Direction w/(m·k)Thermal Conductivity in the z Directionw/(m·k)
226699020014.1913.69
Table 3. Lithium ion battery heat production and theoretical temperature.
Discharge Rate1C1.5C2C2.5C3C
Heat generated/W11.522.737.656.180.7
Theoretical temperature/°C 47.254.261.968.276.0
Table 4. Phase change paraffin parameter table.
Density (kg/m3)Specific Heat Capacity (J/Kg·°C)Phase Change Latent Heat (J/Kg)Phase Transition Temperature (°C)Thermal Conductivity (W/m2·°C)
880322020041–430.22
Table 5. The maximum temperature and the highest temperature difference of battery surface when CPCM with different EG contents are used for cooling the battery under different discharge rates.
Discharge Rate (C)Graphite Content (%)Maximum Temperature (°C)Maximum Temperature Difference (°C)
1.5C0536.3
546.55.5
2C060.67.8
1052.75.8
2048.84.7
2.5C0617.7
1052.25.2
2047.34.2
3C0608.2
1056.37
2052.44.3
Table 6. Maximum temperature and maximum temperature difference of the battery surface when the battery is heat dissipated using different graphite content PCM, combined with thermoelectric cooling sheets under different discharge rates.
Discharge Rate (C)Graphite Content (%)Maximum Temperature (°C)Maximum Temperature Difference (°C)
2C15525.4
2045.63.8
3C1552.35.5
2046.34.2

