Article

Anti-Transpirant Effects on Vine Physiology, Berry and Wine Composition of cv. Aglianico (Vitis vinifera L.) Grown in South Italy

1
University of Naples Federico II, Department of Agricultural Sciences, Via Università 100, 80055 Portici, Italy
2
University of Palermo, Department of Agricultural, Food and Forest Sciences, Viale delle Scienze, Ed 4, 90128 Palermo, Italy
*
Author to whom correspondence should be addressed.
Agronomy 2019, 9(5), 244; https://doi.org/10.3390/agronomy9050244
Submission received: 20 February 2019 / Revised: 2 May 2019 / Accepted: 13 May 2019 / Published: 14 May 2019
(This article belongs to the Special Issue Viticulture and Winemaking under Climate Change)

Abstract

:
In viticulture, global warming requires reconsideration of current production models. At the base of this need there are some emerging phenomena: modification of phenological phases; acceleration of the maturation process of grapes, with significant increases in the concentration of sugar musts; decoupling between technological grape maturity and phenolic maturity. The aim of our study was to evaluate the effect of a natural anti-transpirant on grapevine physiology, berry, and wine composition of Aglianico cultivar. For two years, Aglianico vines were treated at veraison with the anti-transpirant Vapor Gard and compared with a control sprayed with only water. A bunch thinning was also applied to both treatments. The effectiveness of Vapor Gard were assessed through measurements of net photosynthesis and transpiration and analyzing the vegetative, productive and qualitative parameters. The results demonstrate that the application of anti-transpirant reduced assimilation and transpiration rate, stomatal conductance, berry sugar accumulation, and wine alcohol content. No significant differences between treatments were observed for other berry and wine compositional parameters. This method may be a useful tool to reduce berry sugar content and to produce wines with a lower alcohol content.

1. Introduction

In the last 20 years, the acceleration of ripening in wine grapes has been extensively documented worldwide. An increase in carbon dioxide emissions and other greenhouse gases is altering the composition of the atmosphere. It is likely that most of the global warming since the mid-20th century has been due to increases in greenhouse gases from human activities [1]. World climate is changing and becoming warmer [2,3], with great effects on agricultural production, whose products are directly impacted by meteorological conditions. For example, by 2050, the projected increase in annual average temperature in grape-growing regions is estimated to range from 0.4 to 2.6 °C. For example, increases in annual average temperature between the present day and the year 2030 are expected to range from 0.2 to 1.1 °C in many of the Australian grape-growing regions [4]. A steady trend of increased warming is pushing traditional areas of grape-growing towards accelerated ripening [1], leading, in turn, to excessive sugar accumulation in the fruit and high alcohol in the wine.
Wine consumer preferences over the last decade are changing [1,5] towards lower-alcohol wines. The growing demand for wines with moderate alcohol content is leading to a reappraisal of current production systems as well as management techniques. Vineyard management practices are able to increase, stabilize, or slow maturation [6,7,8,9,10], and grapevine phenology is predominantly temperature-driven [11,12]. Matching the critical developmental stages of grapevines to a suitable climate is a fundamental factor in the planning of new vineyards where optimizing quality is a priority. McIntyre et al. described the timing of phenology in many grape varieties and the possibility of a “best fit” variety for a particular climate [13]. In a future climate change scenario, rising temperatures may change the timing of grape ripening and consequent harvest date and may affect grape quality and yield [4,14,15,16,17,18]. Therefore, the projected temperature increases could have a major impact on such phenological events in terms of winegrape production and quality across wine regions, especially as grapevine phenology varies with regions and varieties [19]. The impact in question could be positive or negative depending on the present climate of the region [20].
The alcohol content of wines is reported to be increasing worldwide. In Australia, during the period 1984–2004, the alcohol content rose from 12.3% to 13.9% in red wines and from 12.2% to 13.2% in whites [21]. Dokoozlian reported that the average sugar content of Cabernet Sauvignon musts increased from 21–22 °Brix in 1990 to 24–25 °Brix in 2008 in the Napa Valley [22]. This finding was supported by Vierra, who found that the average alcohol content of Napa Valley wine increased from 12.5% to 14.8% during the period 1971 to 2001 [23]. Duchene and Schneider also reported that the alcohol potential of Riesling produced in Alsace had increased by 2.5% over the previous 30 years due to higher temperatures during ripening [24]. Although all changes in phenological development have been well documented, perhaps the most striking is the advance of harvest time by more than a month. Ganichot compared harvest dates from 1945 to 2005 in Chateauneuf du Pape (France) and found that harvest time was getting earlier, advancing from early October in 1945 to early September in 2000 [25]. In recent years, the harvest date of Montepulciano, grown in Abruzzo, advanced by 14–15 days in the central part of the region and by 10 days when grown closer to the coast [26,27].
As a means to reduce sugar accumulation, numerous studies have considered agronomic practices that limit photosynthetic activity and increase competition between sink and source. The use of commercial products that reduce the transpiration rate, and hence photosynthesis, induces a variation in the metabolism of carbohydrate compounds and their translocation in the berries [6,28,29,30].

2. Materials and Methods

2.1. Experimental Site, Design, and Treatments

The trial was carried out in Benevento province (in Southern Italy) (lat. 41°15′32″ N, long. 14°35′54″ E) at an altitude of 300 m above sea level (a.s.l.). The experimental trial was conducted on a uniform clay-loamy soil type. The study was carried out over the 2013 and 2014 growing seasons in an Aglianico/110 Richter vineyard that is more than 10 years old. Vines were spaced with 2.40 m between rows and 1.40 m within a row, trained to a Vertical Shoot Position (VSP) system and pruned to a bilateral guyot with 30 nodes per vine (15 for each cane). The vineyard was in a dry condition during the two growing seasons. Pest management was carried out according to local standard practice. Daily minimum, maximum, and average air temperature (°C) and monthly rainfall (mm) data were recorded in both years and were taken from a weather station located in Guardia Sanframondi (BN), close to the vineyard. In total, 40 vines of Aglianico were selected: 20 vines were assigned to Vapor Gard® anti-transpirant treatment (VG), and 20 vines were used as an unsprayed control (C). At VG application time, in half of the vines of treatments VG and C, manual bunch-thinning (±BT) was applied at BBCH stage 81, decreasing the total bunches to 50%. Ten vines for each treatment were assigned in a completely randomized design throughout the vineyard.
Four treatments, finally, were compared: C ± BT for control vines, with and without bunch-thinning; and VG ± BT for vines treated with the anti-transpirant, with and without bunch-thinning. The anti-transpirant product used was Vapor Gard® (Intrachem Bio Italia, Grassobbio, Italy), a water-emulsifiable organic concentrate for use on plants, designed to reduce transpiration by forming a clear, soft, and flexible film that retards normal transpiration loss. Its active ingredient is di-1-p-menthene (C20H34), a terpenic polymer also known as pinolene. VG was prepared as a 2% solution in water and stirred slowly to form an emulsion before treatment. All the leaves of the canopy located above the cluster area were sprayed at 0.336 L/vine rate using a portable pump. The abaxial surfaces of the leaves were wetted well in order to cover the stomatal pores [31]. The entire canopy of all VG vines was sprayed with Vapor Gard until run-off. The VG treatments were applied at veraison (BBCH stage 83–85), approximately one month before harvest.

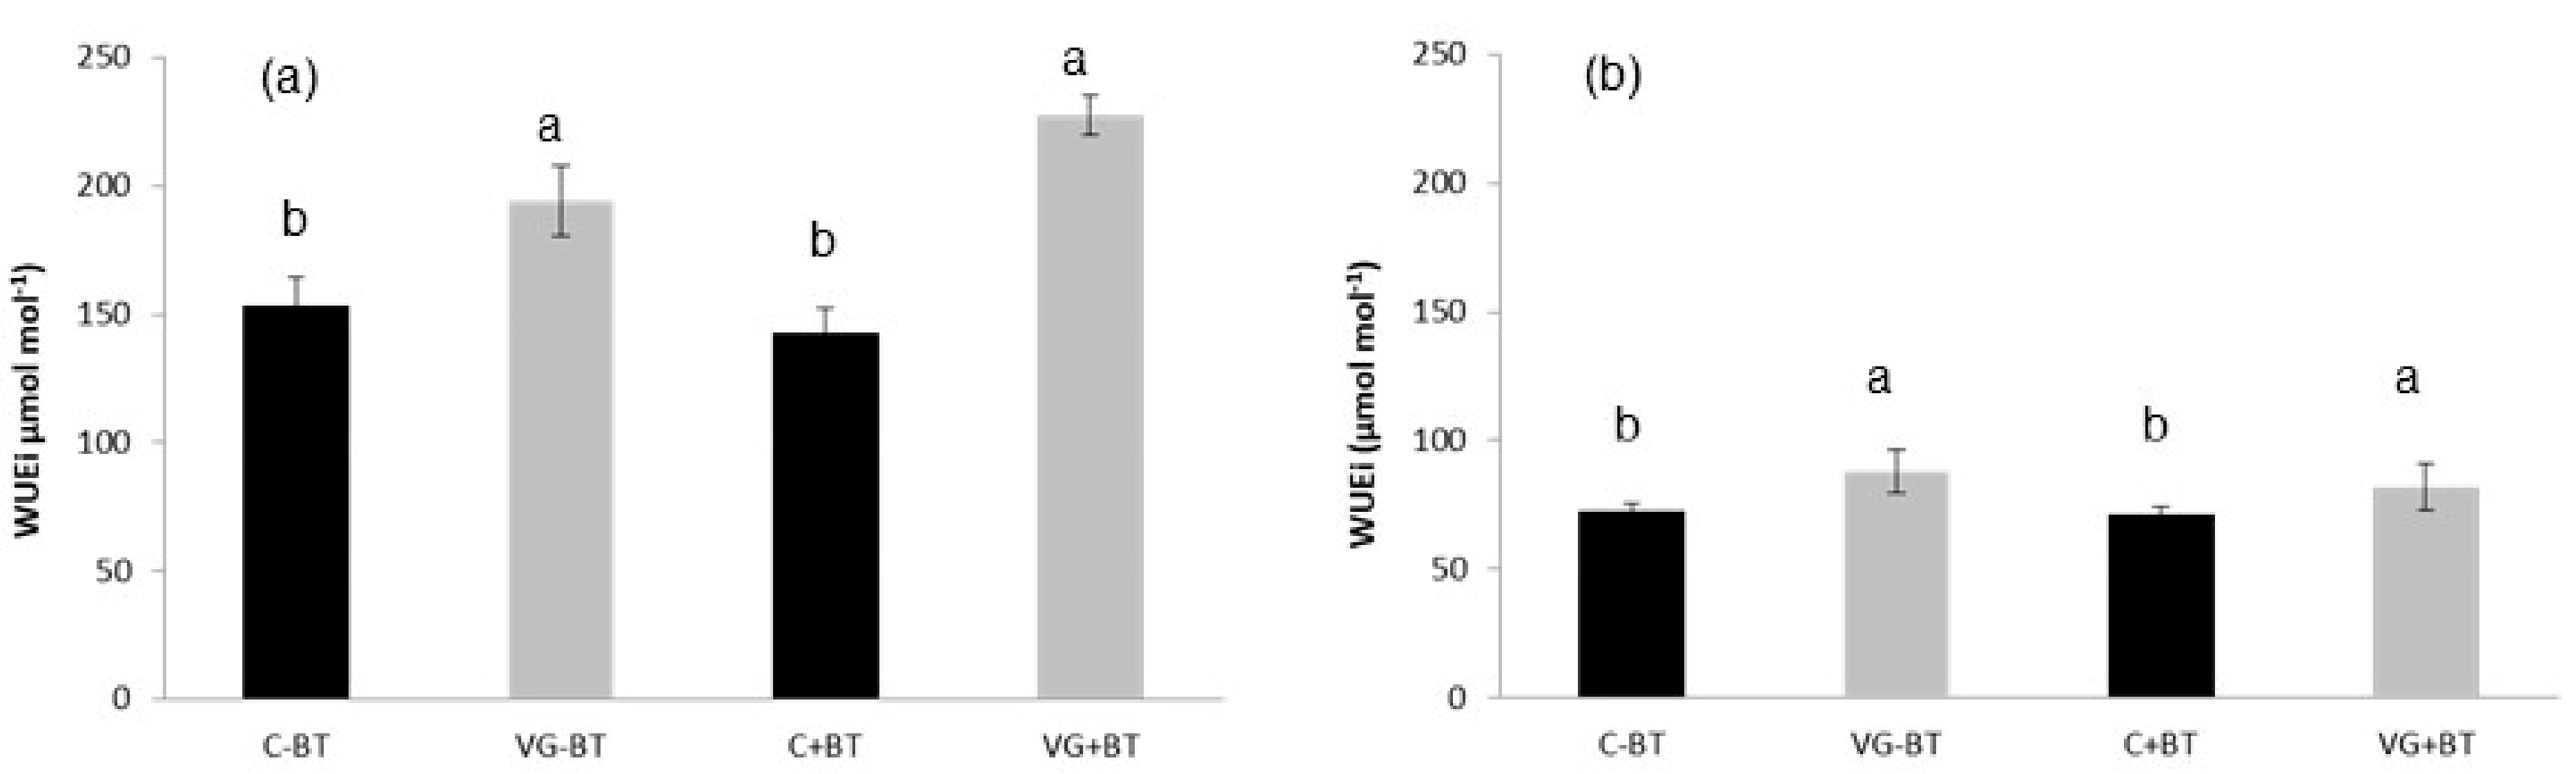
2.2. Physiological Measurements

Measures of gas exchanges were carried out three days after anti-transpirant was sprayed, onto 10 mature (10–12 node position of the main shoot) and fully expanded leaves (in 10 vines, 1 per vine). Single-leaf gas exchange readings were taken at midday of clear days using a portable photosynthetic open-system (Li-6400, LICOR, Lincoln, NB, USA) featuring a broad leaf chamber (6.0 cm2). PPFD incident on the leaves was always greater than 1 000 μmol m−2 s−1. The CO2 inside leaf chamber was supplied by an external tank to obtain a flow rate of 360 μmol mol−1 air.
Assimilation rate (A), transpiration rate (E), and stomatal conductance (gs) were calculated from inlet and outlet CO2 and H2O relative concentrations. Intrinsic water-use efficiency (WUEi) was then derived as the A to gs ratio. Measurements were taken. gs was measured at midday using a non-steady state porometer (AP4, Delta-T Devices, Cambridge, UK). Measuring was done four times after VG application, until harvest.

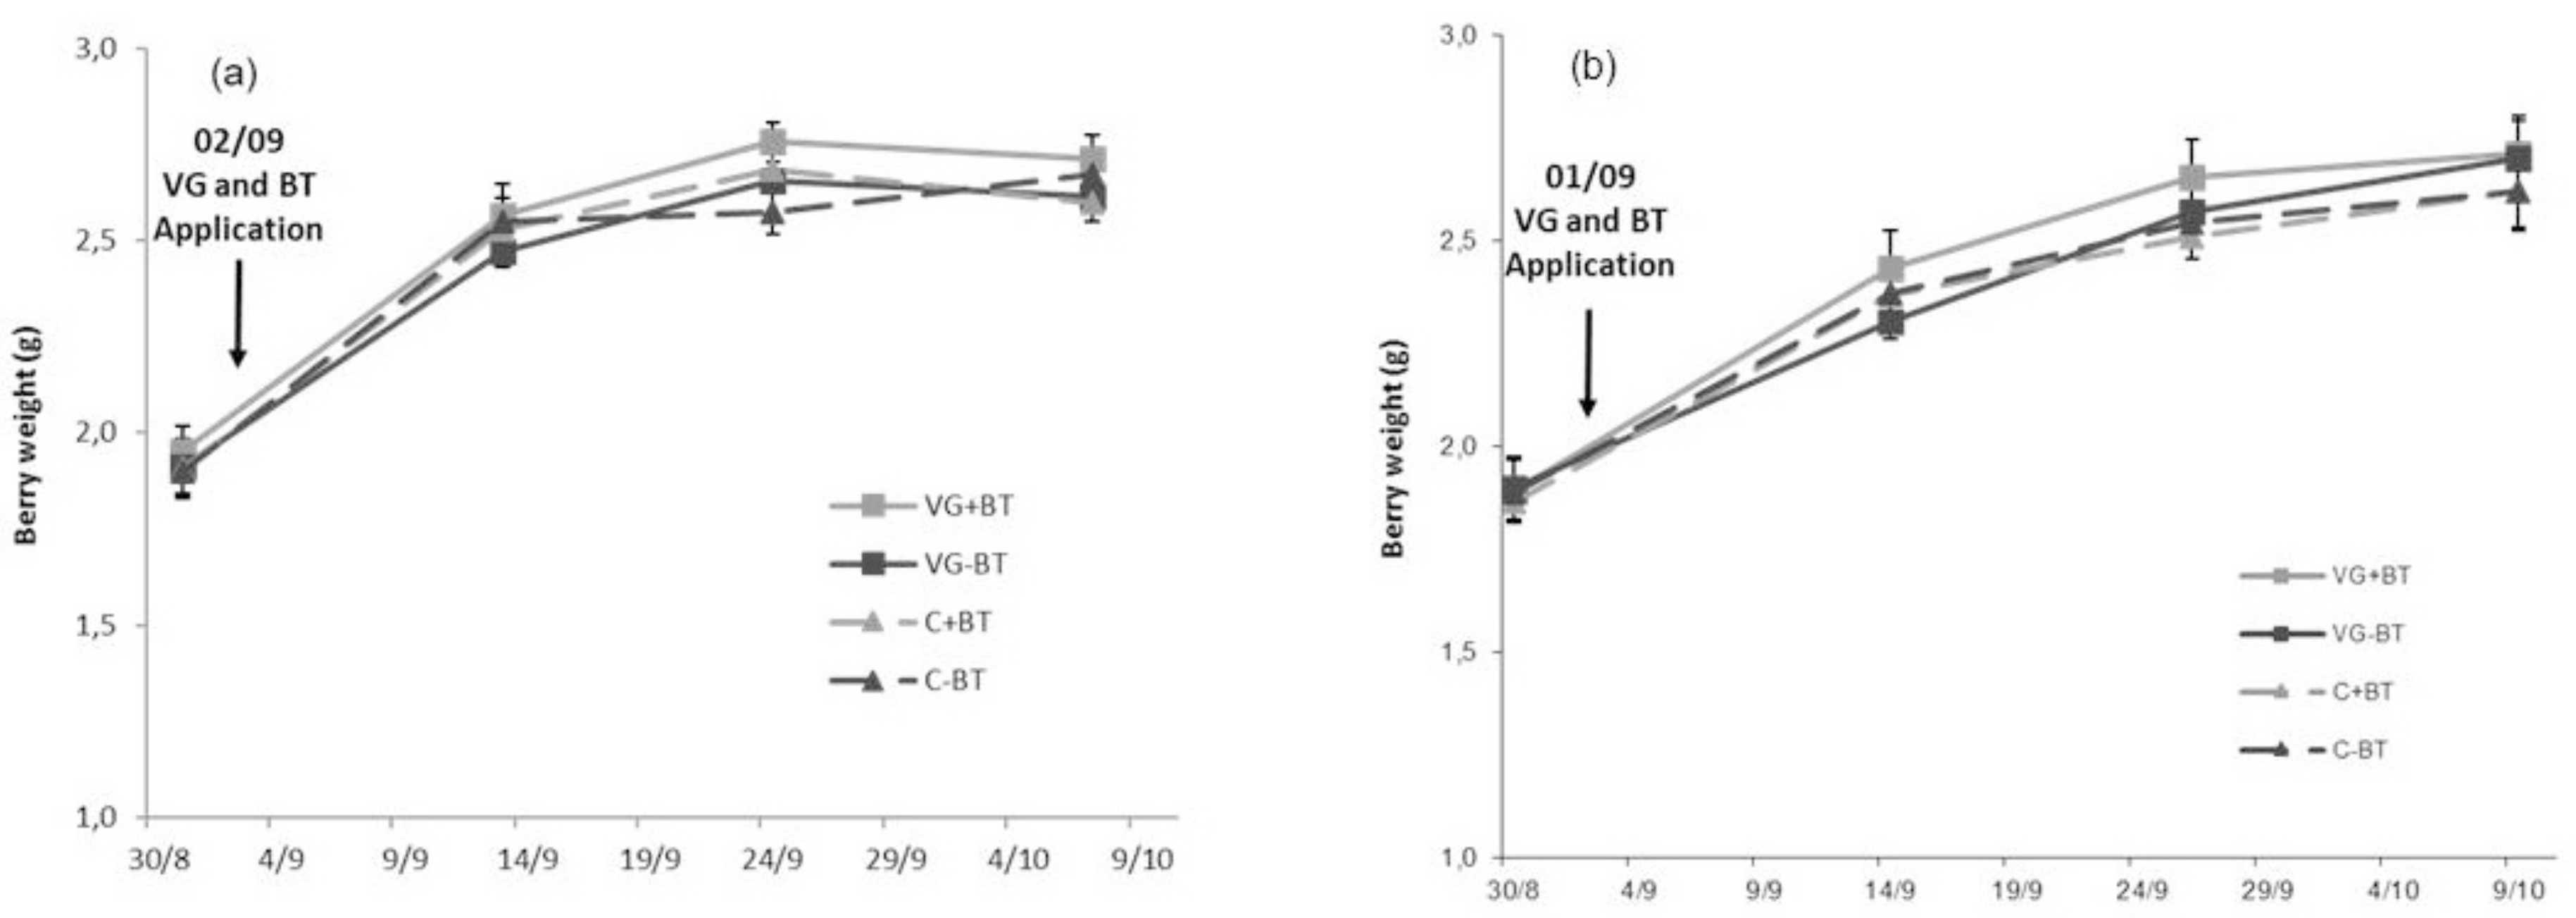
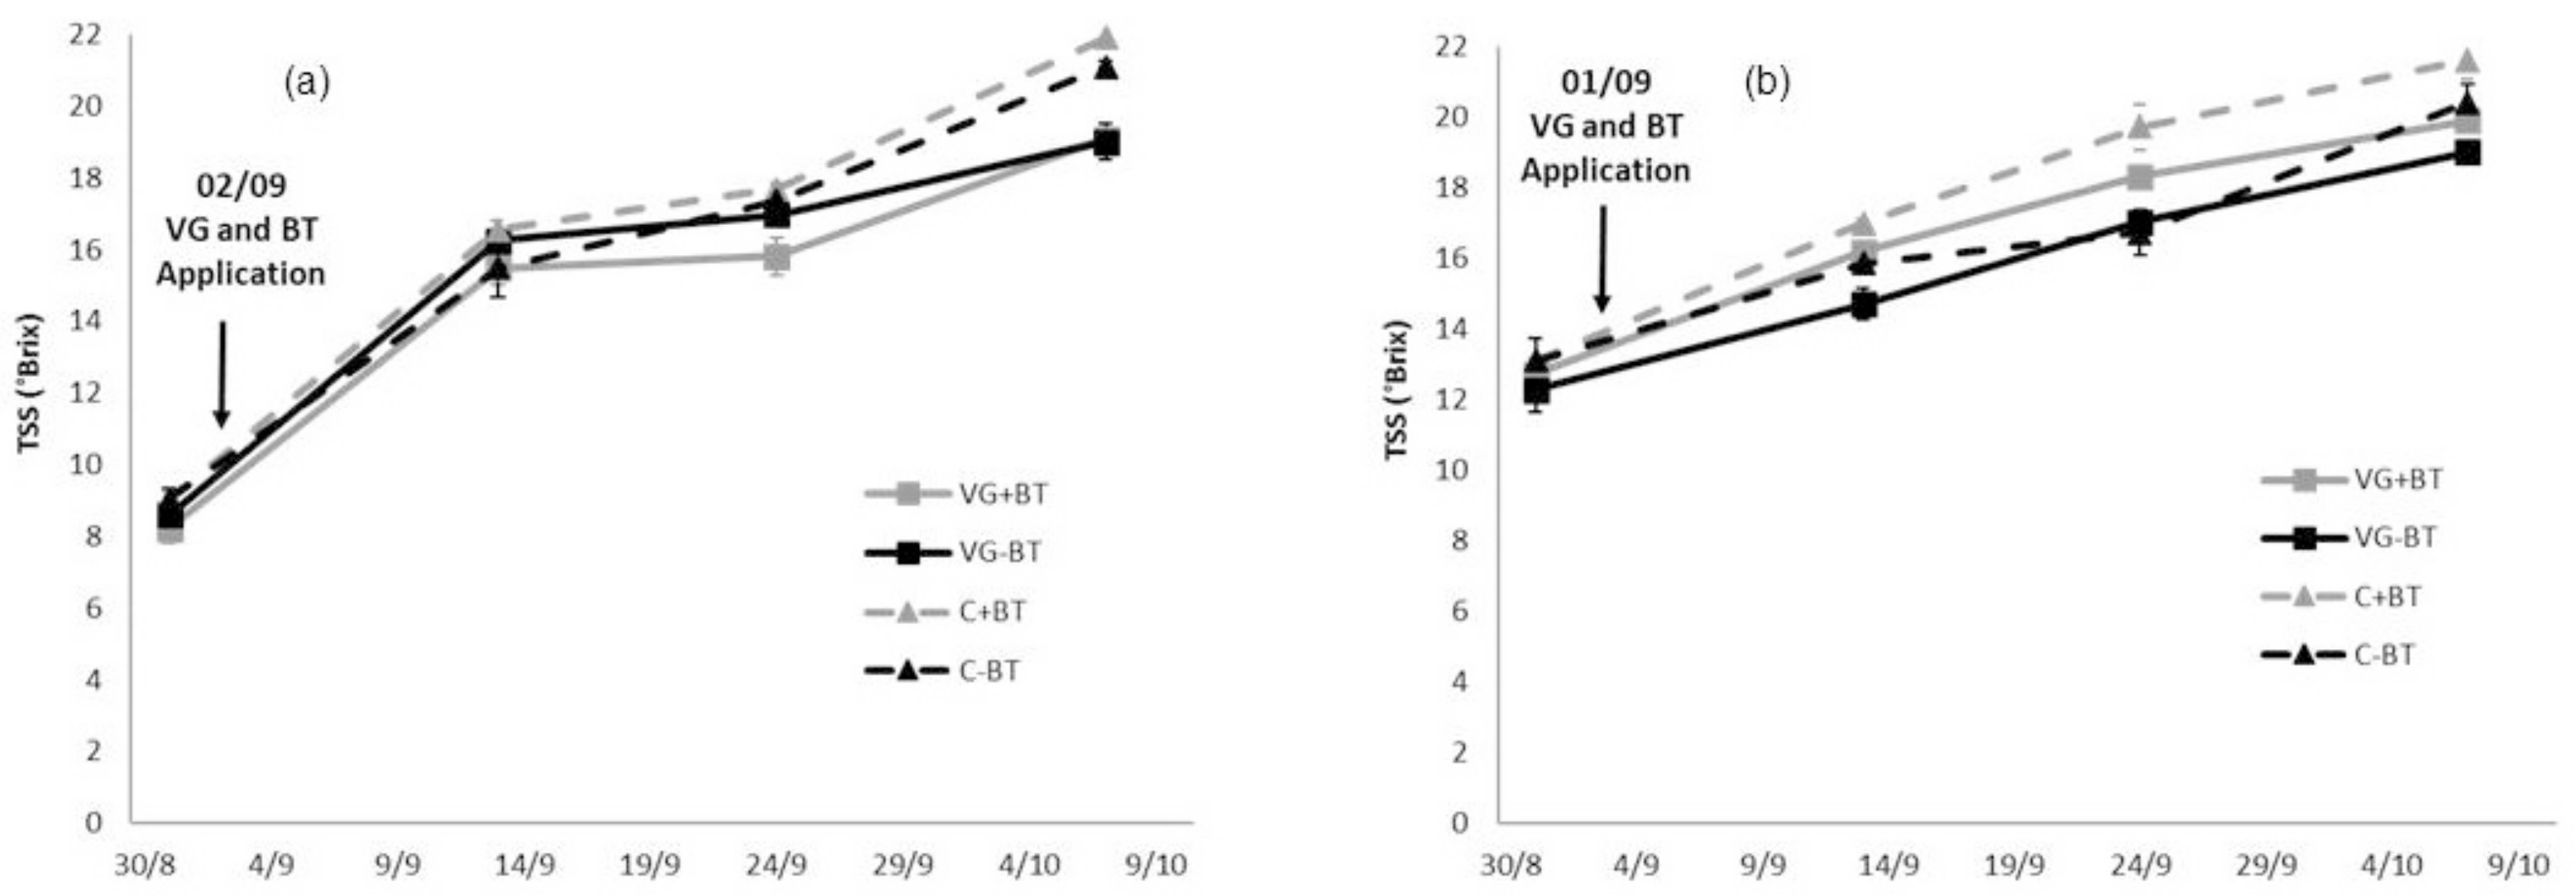
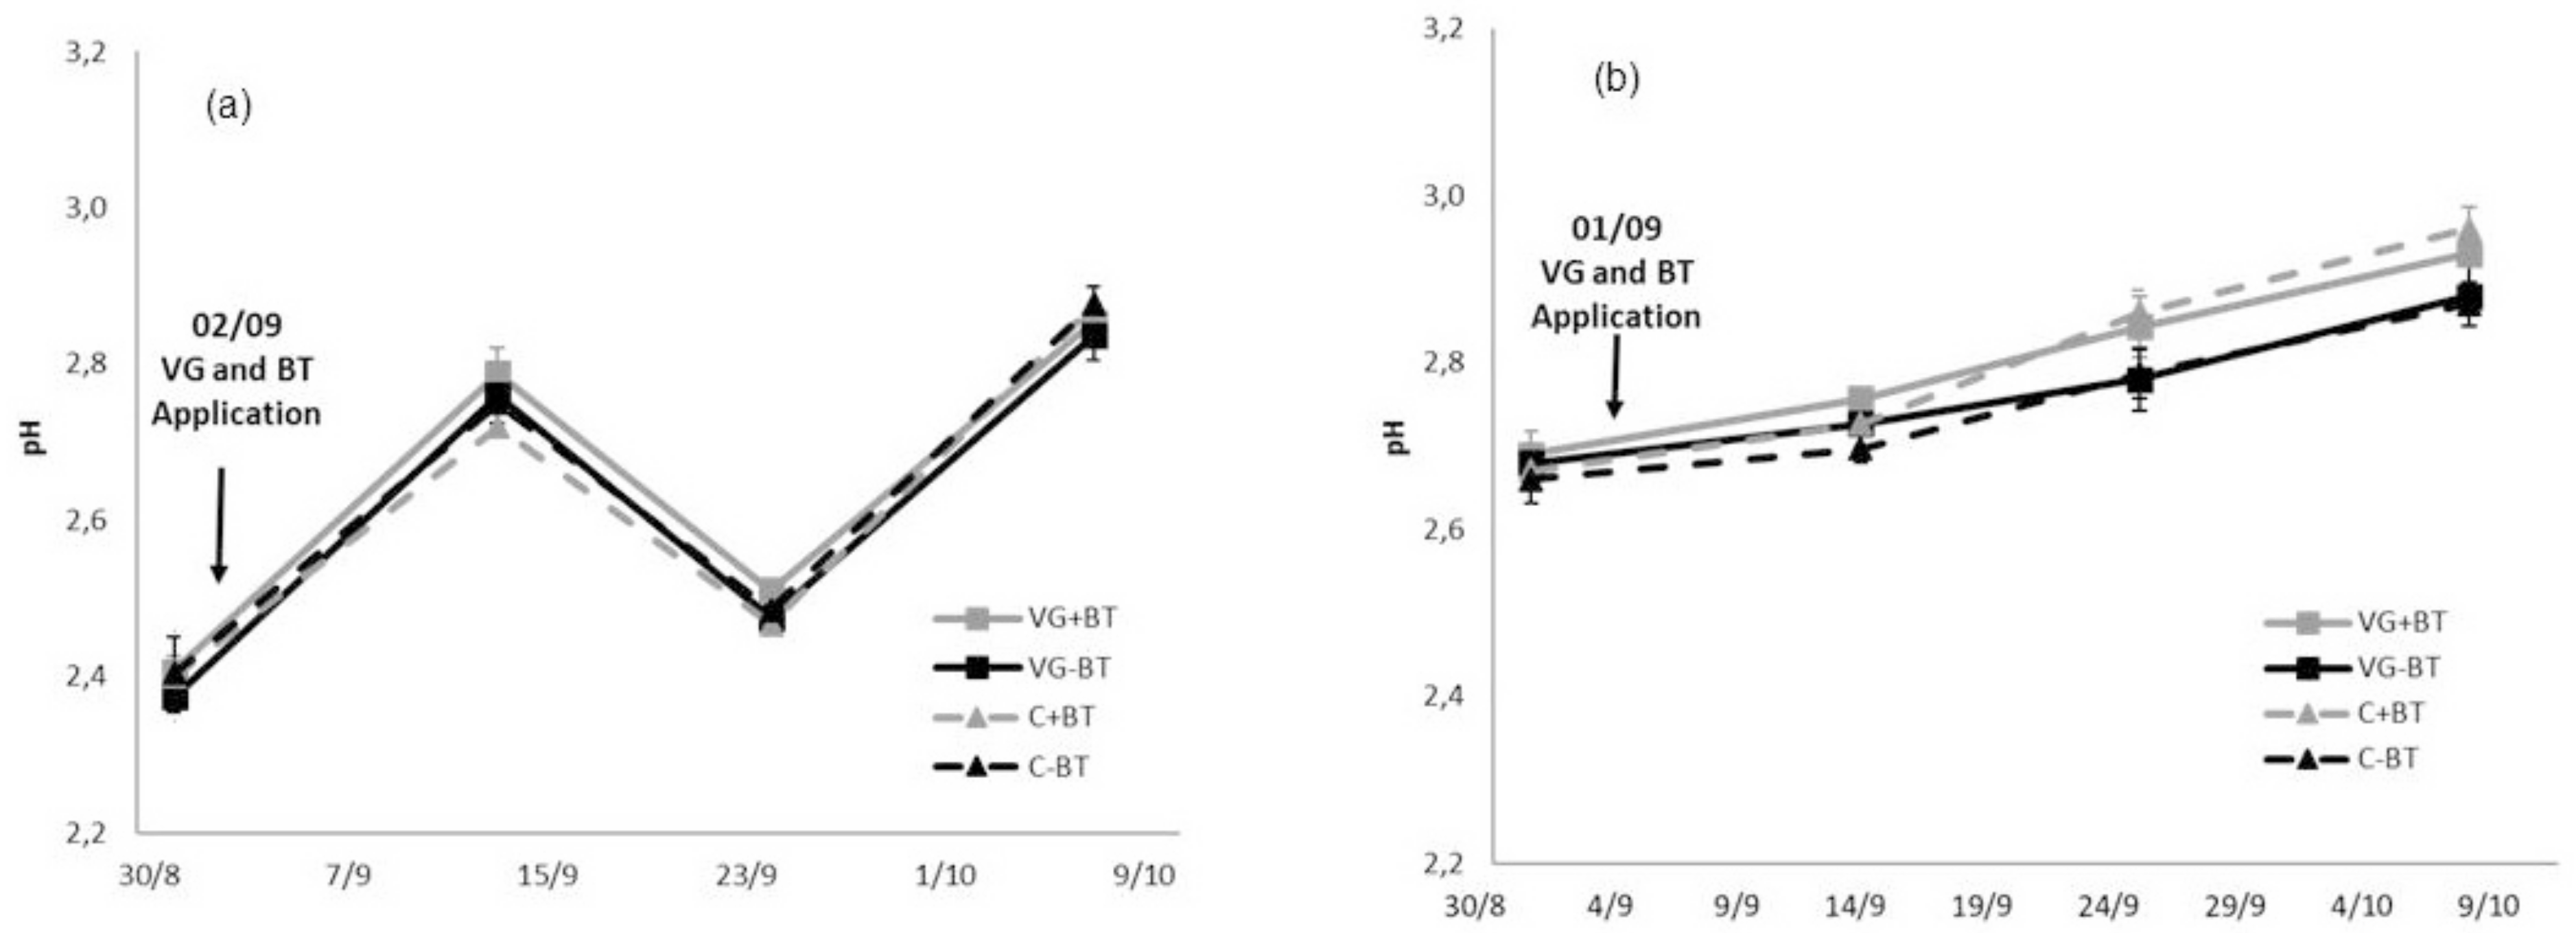
2.3. Growth, Yield, and Grape Composition

Each year four repetitions of 50 berries (5 berries × 10 vines) were randomly collected on four calendar dates, from veraison to harvest (one before and three after VG and BT applications). The berries were randomly collected from different sections of the bunch (top, middle and bottom) and from sun exposed and non-sun-exposed bunch sides, to obtain grape maturity data and to determine the optimal harvest date. The berries were also weighed with a digital precision weighing scale (Acculab Sartorius Group ECON EC-411).
The 50 berries of the four different repetitions were manually crushed, and their juice was used to determine: soluble solids (°Brix), pH, and titratable acidity (TA). Total soluble solids (TSS) concentration was determined with a digital refractometer (Model L-R 01 Digital Refractometer, Maselli Misure S.p.a., 43100 Parma, Italy) on 2 mL of juice at 20 °C. Samples of 10 mL of juice were used for pH and TA measurements. pH was measured by a digital pH meter (Crison Instrument GLP 21 pH); TA was determined using the official method for TA determination, with 0.1 N NaOH to a pH 8.2 end-point, and was expressed as g L−1 of tartaric acid, phenolic maturity was determined according to Glories’ method [32] and (expressed as mg L−1).
Yield and bunch number per vine were determined at harvest time. At harvest, 100 kg of fruit per treatment was randomly harvested and transported to the laboratory. The bunches were collected from both sides of the vines and from shaded and non-shaded vine sections to avoid bias.
During winter, for each year of the trial, pruning weight per vine was also determined.

2.4. Microvinification and Wine Analysis

In 2013 and 2014, wines were made using microvinification techniques. At harvest, 100 kg of fruit per treatment were manually harvested in plastic boxes of 20 kg and transported to the experimental cellar to be microvinified.
For each treatment, two microvinifications were carried out. Grapes from each treatment were mechanically crushed, destemmed, transferred to fermentation containers. potassium metabisulphite was added to obtain a total SO2 level of about 35 mg L−1 and 20 g hL−1 of a commercial yeast strain (BCS 103 Springer Oenologie) was inoculated. Musts were fermented for 16 to 18 days on the skin and punched down twice daily, with the fermentation temperature ranging from 20 to 23 °C. After alcoholic fermentation, the wines were pressed at 0 °Brix and inoculated with 30 g hL−1 Oenococcus oeni (Lalvin Elios 1 MBR; Lallemand). After completion of malolactic fermentation, the samples were racked and transferred to glass bottles, and 50 mg L−1 of potassium metabisulphite was added. Two months later, the wines were racked again, bottled into 750 mL bottles, and then closed with cork stoppers. The wines were analyzed for alcohol, TA, pH, total phenol, and anthocyanin concentrations were determined with Foss (Wine Scan™ Auto, Hillerod, Denmark). All determinations on wines were carried out in duplicate yielding four repetitions per treatment.

2.5. Sensory Analysis

A quantitative sensory analysis (QDA) of the experimental wines was performed. Sensory analysis was carried out on wine products using the official method of the International Union of Oenologues, to describe the sensory profiles of wines. A panel of 12 judges composed of agri-food experts (seven males and five females between the ages of 22 and 55 years) were selected. All of the judges were experienced wine tasters, they were previously selected on the basis of their sensory abilities, trained in recognize and describe odors (chemical standards), and several wine typologies.
Samples of 30 mL of each wine were served at 10 °C in black tulip-shaped glasses, coded with random three-digit codes. Samples were evaluated in duplicate (two duplicate sessions). Each judge evaluated all the wines in each session and the wines were served according to a randomized service design. The judges were asked to focus on the perceived odor descriptors and rate the corresponding intensities ranging to 8–11 point scale. They were provided with a list of 27 taste/odor descriptors (the order was randomized among the judges).

2.6. Statistical Analysis

Analysis of variance (ANOVA) and mean separation by Duncan’s multiple range test (p < 0.05) were performed using the statistical package XL-Stat Version, 2013 (New York, NY, USA).

3. Results and Discussion

From the trend of average monthly temperatures recorded at the farm in Guardia Sanframondi and the monthly rainfalls for the same area in 2013 and 2014 (Figure 1a), it was observed that minimum temperatures were 6.1, 5.1, and 5.9 °C, respectively during January, February, and December in the year 2013. Peak maximum temperatures were recorded during August (22.4 °C). The same trend was shown for the temperatures measured in the second year of study; however, the minimum temperatures in this year were higher, 7.7 and 9.3 °C in January and February, respectively, except for December (−1.5 °C), while the maximum temperatures seemed to remain quite similar to the prior year (21.3 °C, once again during August) (Figure 1b). In 2013 and 2014 at Guardia Sanframondi, there was a total rainfall of 2,037.2 and 1,734.8 mm, respectively.
The rainiest months were March and November for the year 2013 (422.8 and 303 mm, respectively), and January and February (278 and 223.6 mm, respectively) for the year 2014.
The VG treatments were applied at veraison (BBCH stage 83–85), on 2 September 2013 and on 1 September 2014. In both years, from VGapplication to harvest time, we monitored gs. As reported in Figure 2, it is possible to see how these parameters evolved during the season from VG application to harvest time and to appreciate the significant differences in gs between treatments. The gs for the VG treatment was lower for VG-treated vines in the first 20 days after application (Figure 2).
Stomatal conductance (gs) was significantly reduced each year in the sprayed Aglianico vines as compared with C vines (Figure 2). In 2013, Aglianico vines showed less leaf conductance, amounting to 0.47 vs. 0.72 mol m−2 s−1 for VG -BTand C-BT vines, respectively, and 0.21 vs. 0.73 mol m−2 s−1 for VG+BT and C+BT vines, respectively, after 3 days of application (Figure 2a). We can observe the same trend for VG Aglianico vines in the year 2014 (Figure 2b). It is interesting also to describe the same trend between VG-BT vines and VG+BT- vines; VG+BT vine had less leaf conductance in both years.
A few days after VG treatment, the sprayed leaves showed a great reduction in A and E and an increase of WUEi (Figure 3, Figure 4 and Figure 5) in both years (2013 and 2014). Leaf assimilation values in 2013 were: 17.4 and 26.6 µmol m−2 s−1 for VG and C, respectively (Figure 3a). Palliotti et al. and Brillante et al., reported similar observations [31,33]. There was more reduction in leaf assimilation for the BT treatment: 25.4 vs. 10.8 µmol m−2 s−1 for VG+ BT and C+ BT, respectively, during 2013 (Figure 3A). The same behavior was observed in 2014. When BT was combined with VG treatment, a reduction in leaf assimilation was recorded. In fact, the reduction was 34.7% and 57.6%, respectively, in VG -BT and VG+ BT in 2013, while in 2014 it was 62.4% and 45.3%, respectively (Figure 3b).
No statistical difference was found in the C treatment when combined with BT.
There were significant differences in E between VG and C vines in 2013 and 2014. VG caused a 66.6% reduction in E after application in 2013, and a 42.2% reduction in 2014 compared to the control vines. These effects were the same when BT was also applied (Figure 4a). In 2013, E values were 5.70 mmol H2O m−2 s−1 in the control and 2.91 mmol H2O m−2 s−1 in the VG vines. The BT treatment also showed major differences in E: for the control with BT it was 5.92 mmol H2O m−2 s−1, and for the sprayed treatment it was 0.92 mmol H2O m−2 s−1 (Figure 4A). The same results, with statistically significant differences between treated and control vines, were recorded in the year 2014 (Figure 4b). Independently of BT, the treated vines showed a lower E with respect to control vines (Figure 4).
These findings are in agreement with those of several researchers [31,33]. In fact, they described that the reduction of gs, A and E following VG spraying was accompanied by a marked reduction (from 60% to 70% compared to leaves of control vines) of substomatal CO2 concentration (182 to 218 ppm in control leaves versus 112 to 165 ppm in VG-treated leaves); it is apparent that this behavior was linked to some physical impairment of stomatal opening and function.
The reverse trend was instead shown for WUEi, derived as the A to gs ratio. In 2013, WUEi measured 3 days after VG application was 153.46 µmol mol−1 in C and 193.97 µmol mol−1 in VG vines (Figure 5a). The BT treatment also showed the same trend for WUEi: for the control it was 142.51 µmol mol−1, and for the sprayed treatment 227.57 µmol mol−1. The same results, with statistically significant differences between treated and control vines, were recorded in 2014 for Aglianico: 72.51 vs. 87.92 µmol mol−1 for VG-BT vines, and 71.23 vs. 81.91 µmol mol−1 for VG+ BT vines (Figure 5b). After VG application, A and E rates again decreased, demonstrating the effectiveness of VG in rapidly reducing stomatal opening upon treatment. Thereafter, the capacity for carbon gain of VG-treated leaves remained limited for a period of 4 weeks until harvest, when gs again converged towards levels seen in C leaves. Conversely, at harvest, sprayed leaves still had lower E than control leaves. The depression of E after VG application resulted in a significant increase of WUEi in VG relative to C vines and was of similar duration, suggesting a lower amount of water consumed per carbon assimilated in VG relative to C vines, while both achieved a similar carbon gain to that reported in the literature [28,31].
These findings are comparable with those reported in the literature [30,33,34]. As reported by Palliotti et al., the decrease in E can be attributed to an increase in resistance to water transport related to the film-forming anti-transpirant [34]. Our study showed that after application, Aglianico plants were able to recover, although a reduced A compared to the control was still observed After treatment in the VG-sprayed leaves, a large reduction in leaf A and gs was observed, which continued over the following 60 days with peak reductions compared with C [30,33,34]. Post-veraison, the effect on stomatal closure was reduced in part, although E was lower than in the control even late in the season, in agreement with Palliotti et al. [34]. The depression of transpiration after VG application resulted in a significant increase in WUEi in VG- relative to C vines. Our results are confirmed by other studies: Sangiovese and Ciliegiolo leaves showed a smaller decrease in WUEi during the season in response to application of VG [31,33,34].
The significant improvement of intrinsic WUEi, from VG application until the final stage of ripening, indicates less water loss through stomata for a similar carbon gain. This behavior occurred because the limitation in gs of H2O was proportionally higher than the depression of A [31].
The fact that the film-forming VG exerts a physical barrier to gas exchange, thus hampering the CO2 entering the stomata and the water vapor leaving the stomata, was found almost 40 years ago on Vicia faba by Davenport et al., who also noted that under the transparent film the stomata were more open [35]. Scanning electron micrographs on bean plants confirmed these results [36]. Moreover, in peach, midday leaf water potential increased after anti-transpirant application as compared to unsprayed plants [35]. Thus, maintenance of a high moisture level of the leaf tissue in conjunction with possible effects of light reflectance might explain why treated leaves did not heat up significantly, in agreement with findings in a tropical plant using the same compound [37]. In terms of light reflectance, VG behaves differently than kaolin-based foliar reflectants, which have been proven to cause a significant reduction of leaf and/or berry temperature, especially under limiting water supply [37,38,39]. The significant improvement of intrinsic WUEi, extending from the time of VG application until the final stage of ripening, indicates less water loss through stomata for a similar carbon gain. This behavior occurred because the limitation in gs of H2O was proportionally higher than the depression of A.
A significant source limitation following Vapor Gard spraying has been previously assessed in different species [34,40], including grapevine [34], and, quite remarkably, this source limitation is reached without modifying the vine leaf-to-fruit ratio or the cluster microclimate during ripening. The product, applied late in the season, has been effective in reducing the pace of sugar accumulation in the berry, as compared to control vines, scoring −1.2 °Brix at harvest and lowering the alcohol content in the resulting wines by −1% vol. It can be recommended as a valuable cultural practice in viticultural areas where berry ripening takes place early during the hottest part of the season [31,34].
From veraison to harvest, we monitored average berry weight (g), TSS, pH and TA for both years, 2013 and 2014. The experimental vines were individually and manually picked, in 2013 on 7 October, and in 2014 on 9 October. In Figure 6, Figure 7, Figure 8 and Figure 9, it is possible to see how these parameters evolve during the season. In both years, despite some changes between the theses after the applications with VG, at harvest time no significant differences in Aglianico berry weight were observed (Figure 6 and Table 1) according to other authors [33,34].
Sugar accumulation in the berry showed that, after VG treatment, the accumulation is slower according to other authors (Figure 7a,b) [33,34]. In both years, we observed less sugar accumulation at harvest time, 19.1 vs. 21.9 °Brix in VG+BT and C+BT, in 2013 and 19.9 vs. 21.6 °Brix, in 2014. We can observe the same trend for treatment without BT: 19.0 vs. 21.1 °Brix for VG-BT and C-BT, respectively (Table 1). After VG application, we found a difference of 2.8 °Brix for VG+BT vines, and 2.1 °Brix for VG-BT vines (Figure 7). These values are in agreement with those found in other works; the reduction in TSS in VG-treated vines may be linked to a reduction in canopy photosynthetic capacity and/or limitation in sugar translocation from leaves to berries [30,31,33,34,41].
As shown in Figure 8a,b and Table 1, during the growing season and at harvest, there were no significant differences between treatments in pH values. VG applications did not show significant changes in values of titratable acidity during the vegetative season, while BT, in particular at harvest, showed, in both years, a significantly lower titratable acidity (Figure 9a,b and Table 1).
In both years, as expected, BT vines had a lower yield and lower bunch number per vine than controls. VG applied at veraison did not affect yield per vine or average bunch weight (Table 1) [31].
Extractable anthocyanins (pH 1) differed significantly between the two treatments (VG and C vines): VG vines had more (1044 mg L−1) than C vines (996 mg L−1) in 2013 without BT treatment (Table 2); 1124 vs. 1224 mg L−1 was recorded for C and VG, respectively, in 2014. We observed the same results in both years for treatments with BT, while extractable anthocyanins (pH 3.2) and total phenolics (D.O.280) were similar between control and VG vines ±BT (Table 2) in both years, without statistically-significant differences.
In the wines, a lower alcohol percentage was observed for both VG treatments (±BT)) (Table 3), particularly in 2013: 11% and 12.3% were recorded in VG-BT and C-BT, respectively, while 10.9% and 12.9% were recorded in VG+ BT and C+ BT, respectively. Similarly, statistical difference was found in the second year of study (2014): 11.0% vs. 12.5% (VG and C vines, respectively) for treatment - BT, and 10.6% vs. 12.7% (VG and C vines, respectively) for treatment + BT. Total phenolics and total anthocyanins did not show any statistical difference among treatments [31].
Phenol composition is an important aspect of high-quality red wines. Phenols are responsible for astringency and bitterness [42] and play a role in color stability [43]. The phenolic profile of wine has been shown to be influenced by different viticultural practices [44,45,46,47] and different oenological techniques [47,48,49]. The variety [50], vintage [46,51] and region where the grapes are grown [47,48] all affect the phenolic composition of the wine. Anti-transpirant effects did not affect the total phenolic composition, demonstrating in this way that it is possible to conceive this method as a better way for reducing sugar and alcohol content without influencing the quality of the wine product.
The amounts of wine aroma components can be influenced by various factors, among others the environment (climate, soil), grape variety, degree of ripeness, fermentation conditions (pH, temperature, yeast flora), wine production (oenological methods, treatment substances), and ageing (bottle maturation) of the wine.
After sensory analysis of the wines produced in two years of study, it was possible to detect the typical notes of Aglianico in both 2013 and 2014. The wine products present a good intensity and persistency and also good body and harmony; we observed the same results for the second year of study (Figure 10). In Aglianico wine, we found notes of: phenol leather, good structure, acidity, and typicality. Red fruit notes were presented during the wine tasting in both 2013 and 2014 (Figure 11). No significant difference was shown between the wines produced by grapes treated with anti-transpirant and untreated grapes.
The aroma of wine consists of 600 to 800 aroma compounds, of which especially those typical for the variety are already present in the grapes. There are significant varietal differences between the aromagrams (‘fingerprint patterns’). Thus, the amount of some flavor compounds (‘key substances’) shows typical dependence on the variety. In particular, monoterpene compounds play an important role in the differentiation of wine varieties. We can show after this sensory analysis and wine tasting that the anti-transpirant product does not affect the wine notes and their characteristic structure.
Pruning weight was significantly reduced in each year in the VG-sprayed vines as compared with C vines (Figure 12). In 2013, pruning weight measured in VG-treated vines was 2.9 kg while in the control it was 3.8 kg. The BT treatment also showed differences in pruning weight: the control vine + BT reached values of 3.2 kg, and the sprayed vines 2.5 kg (Figure 12a). The same results, with statistically significant differences between VG and control vines, were recorded in 2014 (Figure 12b). Independently of BT, the VG vines showed a lower pruning weight with respect to control vines. Notably, lower pruning weight emphasizes that vine ‘vigor’ was restrained by VG to the benefit of the ripening process, suggesting that this compound could be considered for applications aimed at controlling vigor while avoiding or limiting the counteracting effect of a smaller source potential, according to Palliotti et al. [31,34].

4. Conclusions

The application in post-veraison of the organic film-forming anti-transpirant is a suitable strategy to delay grape ripening. The method proved to be effective and easy to apply in order to hinder the sugaring of berries and to obtain wines with a lower alcohol percentage. Concurrently, this method had no other negative impact on phenolic compounds, organic acids, or pH in grapes and wines. Moreover, the anti-transpirant does not show adverse effects on the production per plant or on berry size for each vintage examined. The application of anti-transpirant leads to a reduction in stomatal conductance and A and an increase in WUEi in Mediterranean climatic conditions. To be effective in reducing the accumulation of TSS in the berries, the VG emulsion should be applied at the time of veraison and should completely wet the lower leaf surface where stomata are located. The effectivity of the product depends also on the concentration of preparation; in our case, the concentration of 2% has been shown to be very efficient. Another important aspect to consider is that applying the anti-transpirant product does not produce any differences in the notes and in the wine characteristics produced in both years of trial.
After the sensory analysis and wine tasting, no negative notes or unpleasant characteristics were detected in the wines produced. Finally, the reduction of sugar content in the berries and the reduction of alcohol content in the wines did not result in any negative qualitative or quantitative characteristics that could affect the final product.

Author Contributions

N.M. wrote the first draft of the manuscript and followed the agronomical and physiological measurements. R.D.L. and A.P. were involved in data analysis, data interpretation and writing. C.D.V. coordinated the whole project, provided the intellectual input, set up the experiment and corrected the manuscript.

Funding

This research received no external funding.

Acknowledgments

The authors wish to thank their colleague Stefano Barone (Associate Professor of Statistics at University of Palermo, Department of Agricultural, Food and Forest Sciences) for his review of the statistical aspects in the presentation of the manuscript.

Conflicts of Interest

The authors declare no conflict of interest.

References

  1. Jones, G.V.; White, M.A.; Cooper, O.R.; Storchmann, K. Climate change and global wine quality. Clim. Chang. 2005, 73, 319–343. [Google Scholar] [CrossRef]
  2. Hansen, J.; Sato, M.; Ruedy, R.; Lo, K.; Lea, D.W.; Medina-Elizade, M. Global temperature change. Proc. Natl. Acad. Sci. USA 2006, 103, 14288–14293. [Google Scholar] [CrossRef] [PubMed]
  3. Tomasi, D.; Jones, G.V.; Giust, M.; Lovat, L.; Gaiotti, F. Grapevine phenology and climate change: Relationships and trends in the Veneto region of Italy for 1964–2009. Am. J. Enol. Vitic. 2011, 62, 329–339. [Google Scholar] [CrossRef]
  4. Webb, L. The Impact of Greenhouse Gas-Induced Climate Change on the Australian Wine Industry. Ph.D. Thesis, School of Agriculture and Food Systems, University of Melbourne, Parkville, VIC, Australia, 2006; p. 277. [Google Scholar]
  5. Schultz, H. Climate change and viticulture: A European perspective on climatology, carbon dioxide and UV-B effects. Aust. J. Grape Wine Res. 2000, 6, 2–12. [Google Scholar] [CrossRef]
  6. Palliotti, A.; Silvestroni, O.; Leoni, F.; Poni, S. Maturazione dell’uva e gestione della chioma in Vitis vinifera: Processi e tecniche da riconsiderare in funzione del cambiamento del clima e delle nuove esigenze di mercato. Italus Hortus 2012, 19, 1–15. [Google Scholar]
  7. Scafidi, P.; Barbagallo, M.G.; Pisciotta, A.; Mazza, M.; Downey, M.O. Defoliation of two-wire vertical trellis: Effect on grape quality. New Zeal. J. Crop Hort. Sci. 2017, 46, 18–38. [Google Scholar] [CrossRef]
  8. Pisciotta, A.; Scafidi, P.; Di Lorenzo, R.; Barbagallo, M.G. Manual and mechanical leaf removal in the bunch zone (Vitis vinifera L. ‘Nero d’Avola’): Effects on plant physiology, vegetative parameters, yield and grape quality in a warm area. Acta Hortic. 2013, 978, 285–292. [Google Scholar] [CrossRef]
  9. Hunter, J.J.; Volschenk, C.G.; Novello, V.; Pisciotta, A.; Booyse, M.; Fouché, G.W. Integrative effects of vine water relations and grape ripeness level of Vitis vinifera L. cv. Shiraz/Richter 99. II. grape composition and wine quality. S. Afr. J. Enol. Vitic. 2014, 35, 359–374. [Google Scholar] [CrossRef]
  10. Pisciotta, A.; Di Lorenzo, R.; Santalucia, G.; Barbagallo, M.G. Response of grapevine (Cabernet Sauvignon cv) to above ground and subsurface drip irrigation under arid conditions. Agric. Water Manag. 2018, 197, 122–131. [Google Scholar] [CrossRef]
  11. Jones, G.V.; Davis, R.E. Climate influences on grapevine phenology, grape composition, and wine production and quality for Bordeaux, France. Am. J. Enol. Vitic. 2000, 51, 249–261. [Google Scholar]
  12. Pearce, I.; Coombe, B.G. Grapevine Phenology. In Viticulture Volume 1—Resources; Dry, P., Coombe, B.G., Eds.; Winetitles: Adelaide, South Australia, 2004; pp. 150–166. [Google Scholar]
  13. McIntyre, G.N.; Lider, L.A.; Ferrari, N.L. The chronological classification of grapevine phenology. Am. J. Enol. Vitic. 1982, 33, 80–85. [Google Scholar]
  14. Haselgrove, L.; Botting, D.; Heeswijck, R.V.; Høj, P.B.; Dry, P.R.; Ford, C.; Land, P.G.I. Canopy microclimate and berry composition: The effect of bunch exposure on the phenolic composition of Vitis vinifera L cv. Shiraz grape berries. Aust. J. Grape Wine Res. 2000, 6, 141–149. [Google Scholar] [CrossRef]
  15. Marais, J. Effect of grape temperature and yeast strain on Sauvignon blanc wine aroma composition and quality. S. Afr. J. Enol. Vitic. 2001, 22, 47–51. [Google Scholar] [CrossRef]
  16. Marais, J.; Calitz, F.; Haasbroek, P.D. Relationship between microclimatic data, aroma component concentrations and wine quality parameters in the prediction of Sauvignon blanc wine quality. S. Afr. J. Enol. Vitic. 2001, 22, 22–26. [Google Scholar] [CrossRef]
  17. Spayd, S.E.; Tarara, J.M.; Mee, D.L.; Ferguson, J.C. Separation of sunlight and temperature effects on the composition of Vitis vinifera cv. Merlot berries. Am. J. Enol. Vitic. 2002, 53, 171–182. [Google Scholar]
  18. Walker, R.P.; Famiani, F. Organic acids in fruits: Metabolism, functions and contents. Hort. Rev. 2018, 45, 371–430. [Google Scholar]
  19. Smart, R.E.; Alcorso, C.; Hornsby, D.A. A comparison of winegrape performance at the present limits of Australian viticultural climates Alice Springs and Hobart. Aust. Grapegrow. Winemak. 1980, 184, 28–30. [Google Scholar]
  20. Dry, P.R. Climate change and the Australian grape and wine industry. Aust. Grapegrow. Winemak. 1988, 300, 14–15. [Google Scholar]
  21. Godden, P.; Gishen, M. The trends in the composition of Australian wine from vintages 1984 to 2004. Austral. New Zealand Wine Ind. J. 2005, 20, 21. [Google Scholar]
  22. Dokoozlian, N. Integrated canopy management: A twenty year evolution in California. In Recent Advances in Grapevine Canopy Management; University of California: Davis, CA, USA, 16 July 2009; pp. 43–52. [Google Scholar]
  23. Vierra, G. Pretenders at the table—Are table wines no longer food friendly? Wine Business Monthly 2004, 11, 17–21. [Google Scholar]
  24. Duchêne, E.; Schneider, C. Grapevine and climatic changes: A glance at the situation in Alsace. Agron. Sustain. Dev. 2005, 25, 93–99. [Google Scholar] [CrossRef]
  25. Ganichot, B. Evolution de la date des vendanges dans les Côtes du Rhône méridionales. In Actes des 6e Rencontres Rhodaniennes; Institut Rhodanien: Orange, France, 2002; pp. 38–41. [Google Scholar]
  26. Di Lena, B.; Silvestroni, O.; Mariani, L.; Parisi, S.; Antenucci, F. European climate variability effects on grapevine harvest date time series in the Abruzzi (Italy). Acta Hortic. 2012, 931, 63–69. [Google Scholar] [CrossRef]
  27. Scaglione, G.; Graziani, G.; Federico, R.; Di Vaio, C.; Nadal, M.; Formato, A.; Di Lorenzo, R.; Ritieni, A. Effect of canopy managment techniques on the nutritional quality of the Montepulciano grapewine in Puglia (southern Italy). OENO One 2012, 46, 253–261. [Google Scholar] [CrossRef]
  28. Carnevali, P.; Falcetti, M. Utilizzo di Antitraspiranti a Base di Pinolene per la Modulazione della Maturità Glucidica. In Proceedings of the ‘IV Convegno Nazionale di Viticoltura Asti, Asti, Italy, 10–12 July 2012. [Google Scholar]
  29. Mattii, G.; Lazzini, F.; Binda, C. Effetto di trattamenti con antitraspiranti sulla maturazione di uve Merlot. In Proceedings of the ‘IV Convegno Nazionale di Viticoltura Asti, Asti, Italy, 10–12 July 2012. [Google Scholar]
  30. Tittmann, S.; Stöber, V.; Bischoff-Schaefer, M.; Stoll, M. Application of anti-transpirant under greenhouse conditions of grapevines (Vitis vinifera cv. Riesling and cv. Müller-thurgau) reduce photosynthesis under greenhouse conditions. In Proceedings of the 18th International Symposium GiESCO, Porto, Portugal, 7–11 July 2013; Ciência e Técnica Vitivinícola, 28. pp. 276–282. [Google Scholar]
  31. Palliotti, A.; Panara, F.; Famiani, F.; Sabbatini, P.; Howell, G.S.; Silvestroni, O.; Poni, S. Postveraison application of antitranspirant di-1-p-menthene to control sugar accumulation in Sangiovese grapevines. Am. J. Enol. Vitic. 2013, 64, 378–385. [Google Scholar] [CrossRef]
  32. Glories, Y.; Agustin, M. Maturité phénolique du raisin, conséquences technologiques: Application aux millésimes 1991 et 1992. In Actes du Colloque Journée Technique du CIVB; CIVB: Bordeaux, France, 21 January 1993; pp. 56–61. [Google Scholar]
  33. Brillante, L.; Belfiore, N.; Gaiotti, F.; Lovat, L.; Sansone, L.; Poni, S.; Tomasi, D. Comparing Kaolin and Pinolene to Improve Sustainable Grapevine Production during Drought. PLoS ONE 2016, 11, e0156631. [Google Scholar] [CrossRef]
  34. Palliotti, A.; Poni, S.; Berrios, J.G.; Bernizzoni, F. Vine performance and grape composition as affected by early-season source limitation induced with anti-transpirants in two red Vitis vinifera L. cultivars. Aust. J. Grape Wine Res. 2010, 16, 426–433. [Google Scholar] [CrossRef]
  35. Davenport, D.C.; Fisher, M.A.; Hagan, R.M. Some counteractive effects of antitranspirants. Plant Physiol. 1972, 49, 722–724. [Google Scholar] [CrossRef] [PubMed]
  36. Iriti, M.; Picchi, V.; Rossoni, M.; Gomarasca, S.; Ludwig, N.; Gargano, M.; Faoro, F. Chitosan antitranspirant activity is due to abscisic acid-dependent stomatal closure. Environ. Exp. Bot. 2009, 66, 493–500. [Google Scholar] [CrossRef]
  37. Moftah, A.E.; Al-Humaid, A.R.I. Effects of antitranspirants on water relations and photosynthetic rate of cultivated tropical plant (Polianthes tuberosa L.). Pol. J. Ecol. 2005, 53, 165–175. [Google Scholar]
  38. Rosati, A. Physiological effects of kaolin particle film technology: A review. Funct. Plant Sci. Biotech. 2007, 1, 100–105. [Google Scholar]
  39. Shellie, K.C.; King, B.A. Kaolin-based foliar reflectant and water deficit influence Malbec leaf and berry temperature, pigments, and photosynthesis. Am. J. Enol. Vitic. 2013, 64, 223–230. [Google Scholar] [CrossRef]
  40. Francini, A.; Lorenzini, G.; Nali, C. The antitranspirant di-1-p-menthene, a potential chemical protectant of ozone damage to plants. Water Air Soil Poll. 2011, 219, 459–472. [Google Scholar] [CrossRef]
  41. Palliotti, A.; Poni, S.; Petoumenou, D.; Vignaroli, S. Effects of modulated limitation of canopy photoassimilation using anti-traspirant on yield and grape composition. In Proceedings of the ‘II Convegno Nazionale di Viticoltura’, Marsala, Italia, 14–19 luglio 2008. Italus Hortus 2010, 17, 21–26. [Google Scholar]
  42. Fischer, U.; Noble, A.C. The effect of ethanol, catechin concentration, and pH on sourness and bitterness of wine. Am. J. Enol. Vitic. 1994, 45, 6–10. [Google Scholar]
  43. Robinson, W.B.; Weirs, L.D.; Bertino, J.J.; Mattick, L.R. The relation of anthocyanin composition to color stability of New York State wines. Am. J. Enol. Vitic. 1966, 17, 178–184. [Google Scholar]
  44. Price, S.F.; Breen, P.J.; Valladao, M.; Watson, B.T. Cluster sun exposure and quercetin in Pinot noir grapes and wine. Am. J. Enol. Vitic. 1995, 46, 187–194. [Google Scholar]
  45. Reynolds, A.G.; Price, S.F.; Wardle, D.A.; Watson, B.T. Fruit environment and crop level effects on Pinot noir. I. Vine performance and fruit composition in British Columbia. Am. J. Enol. Vitic. 1994, 45, 452–459. [Google Scholar]
  46. Yokotsuka, K.; Nagao, A.; Nakazawa, K.; Sato, M. Changes in anthocyanins in berry skins of Merlot and Cabernet Sauvignon grapes grown in two soils modified with limestone or oyster shell versus a native soil over two years. Am. J. Enol. Vitic. 1999, 50, 1–12. [Google Scholar]
  47. Zoecklein, B.W.; Fugelsang, K.C.; Gump, B.H.; Nury, F.S. Wine Analysis and Production; Chapman & Hall: New York, NY, USA, 1995; pp. 407–409. [Google Scholar]
  48. Sims, C.A.; Bates, R.P. Effects of skin fermentation time on the phenols, anthocyanins, ellagic acid sediment, and sensory characteristics of a red Vitis rotundifolia wine. Am. J. Enol. Vitic. 1994, 45, 56–62. [Google Scholar]
  49. Wightman, J.D.; Price, S.F.; Watson, B.T.; Wrolstad, R.E. Some effects of processing enzymes on anthocyanins and phenolics in Pinot noir and Cabernet Sauvignon wines. Am. J. Enol. Vitic. 1997, 48, 39–48. [Google Scholar]
  50. Goldberg, D.M.; Karumanchiri, A.; Tsang, E.; Soleas, G.J. Catechin and epicatechin concentrations of red wines: Regional and cultivar-related differences. Am. J. Enol. Vitic. 1998, 49, 23–34. [Google Scholar]
  51. Brossaud, F.; Cheynier, V.; Asselin, C.; Moutounet, M. Flavonoid compositional differences of grapes among site test plantings of Cabernet franc. Am. J. Enol. Vitic. 1999, 50, 277–284. [Google Scholar]
Figure 1. Monthly averages air temperature and monthly rainfall recorded in 2013 (a) and 2014 (b). The line indicates average monthly temperature, and the bars the monthly rain.
Agronomy 09 00244 g001
Figure 2. Stomatal conductance (gs) measured by porometry in control (C) and treated (VG = Vapor Gard anti-transpirant application; BT = 50% bunch-thinning) Aglianico vines in (a) 2013 and (b) 2014. Data are averages of 10 replicates ± SE.
Agronomy 09 00244 g002
Figure 3. Assimilation rate (A) measured on fully expanded leaves in control (C) and treated (VG = Vapor Gard anti-transpirant application; BT = 50% bunch-thinning) Aglianico vines in (a) 2013 and (b) 2014. Data are averages of 10 replicates ± SE. The same letter indicates non-significant differences by Duncan’s post hoc test (p < 0.05).
Agronomy 09 00244 g003
Figure 4. Transpiration rate (E) measured on fully expanded leaves in control (C) and treated (VG = Vapor Gard anti-transpirant application; BT = 50% bunch-thinning) Aglianico vines in (a) 2013 and (b) 2014. Data are averages of 10 replicates ± SE. The same letter indicates non-significant differences by Duncan’s post hoc test (p < 0.05).
Agronomy 09 00244 g004
Figure 5. Intrinsic water-use efficiency (WUEi) calculated as A/gs measured on fully expanded leaves in control (C) and treated (VG = Vapor Gard anti-transpirant application; BT = 50% bunch-thinning) Aglianico vines in (a) 2013 and (b) 2014. Data are averages of 10 replicates ± SE. The same letter indicates non-significant differences by Duncan’s post hoc test (p < 0.05).
Agronomy 09 00244 g005
Figure 6. Berry weight measured in control (C) and treated (VG = Vapor Gard anti-transpirant application; BT = 50% bunch-thinning) Aglianico vines in (a) 2013 and (b) 2014. Data are averages of 4 repetitions ± SE.
Agronomy 09 00244 g006
Figure 7. Total soluble solids (TSS) measured in control (C) and treated (VG = Vapor Gard anti-transpirant application; BT = 50% bunch-thinning) Aglianico vines in (a) 2013 and (b) 2014. Data are averages of 4 repetitions ± SE.
Agronomy 09 00244 g007
Figure 8. pH measured in control (C) and treated (VG = Vapor Gard anti-transpirant application; BT = 50% bunch-thinning) Aglianico vines in (a) 2013 and (b) 2014. Data are averages of 4 repetitions ± SE.
Agronomy 09 00244 g008
Figure 9. Titratable acidity (TA) measured in control (C) and treated (VG = Vapor Gard anti-transpirant application; BT = 50% bunch-thinning) Aglianico vines in (a) 2013 and (b) 2014. Data are averages of 4 repetitions ± SE.
Agronomy 09 00244 g009
Figure 10. Attributes view, smell and taste scores of Aglianico wines obtained by microvinifications in 2013 (a) and 2014 (b).
Agronomy 09 00244 g010aAgronomy 09 00244 g010b
Figure 11. Sensory scores of Aglianico wines obtained by microvinifications in 2013 (a) and 2014 (b).
Agronomy 09 00244 g011
Figure 12. Pruning weight per vine measured in control (C) and treated (VG = Vapor Gard anti-transpirant application; BT = 50% bunch-thinning) Aglianico vines in 2013 (a) and 2014 (b). Data are averages of 10 replicates ± SE. The same letter indicates non-significant differences by Duncan’s post hoc test (p < 0.05).
Agronomy 09 00244 g012
Table 1. Yield components, bunch morphology and grape composition recorded in control (C) and treated (VG = Vapor Gard anti-transpirant application; BT = 50% bunch-thinning) Aglianico cultivar in 2013 and 2014 Data are averages of 10 replicates for yield and number of bunches per vine and averages of 4 repetitions for other parameters. For each parameter and for each year, row values with the same letter are not significantly different by Duncan’s post hoc test (p < 0.05).
20132014
ParameterC-BTV G-BTC+ BTVG+ BTC-BTVG-BTC+BTVG+BT
Yield/vine (kg)7.6 b8.5 b6.2 a5.4 a7.6 b7.1 b4.8 a4.6 a
Bunches/vine24.8 b27.3 b14.9 a11.6 a21.3 b20.0 b11.5 a11.9 a
Berry weight (g)2.67 a2.61 a2.60 a2.71 a2.52 a2.70 a2.52 a2.71 a
°Brix berry21.1 a19.0 b21.9 a19.1 b20.4 bc19.0 a21.6 c19.9 ab
Juice pH2.88 a2.84 a2.87 a2.85 a2.85 a2.84 a2.96 a2.93 a
Juice TA (g L−1 of tartaric acid)11.17 ab11.37 a10.23 c10.93 b11.61 b11.40 b9.67 a9.53 a
Table 2. Total and extractable anthocyanins and total phenolics recorded in control (C) and treated (VG = Vapor Gard anti-transpirant application; BT = 50% bunch-thinning) Aglianico cultivar in 2013 and 2014. Data are averages of four repetitions. For each parameter and for each year, row values with the same letter are not significantly different by Duncan’s post hoc test (p < 0.05).
20132014
ParameterC-BTV G-BTC+ BTV G+ BTC-BTV G-BTC+BTVG+ BT
Total anthocyanins (mg L−1) 996 a1044 b992 a1108 b1124 a1224 b1228 b1476 c
Extractable anthocyanins (mg L−1) 902 a912 a910 a923 a928 a952 a964 a904 a
Total phenolics OD75.0 a64.5 a69.0 a75.3 a60.8 a65.9 a62.0 a64.3 a
Table 3. Wine composition recorded in control (C) and treated (VG = Vapor Gard anti-transpirant application; BT = 50% bunch-thinning) Aglianico vines in 2013 and 2014. Data are averages of four repetitions. For each parameter and for each year, row values with the same letter are not significantly different by Duncan’s post hoc test (p < 0.05).
20132014
ParameterC-BTV G-BTC+ BTVG+ BTC-BTV G-BTC+ BTVG+ BT
Alcohol (%)12.3 b11.0 a12.9 b10.9 a12.5 b11.0 a12.7 b10.6 a
Total anthocyanins (mg kg−1)510 a490 a526 a520 a181 a163 a166 a197 a
Total phenolics (mg kg−1)1555 a1467 a1720 a1601 a1719 a1779 a1797 a1814 a

