Residents’ Satisfaction with Tourism and the European Tourism Indicator System in South Sardinia


1
Department of Statistics and Quantitative Methods, University of Milano-Bicocca, 20126 Milano, Italy
2
Department of Economics and Business, University of Cagliari, 09123 Cagliari, Italy
*
Author to whom correspondence should be addressed.
Sustainability 2019, 11(8), 2243; https://doi.org/10.3390/su11082243
Submission received: 31 January 2019
/
Revised: 5 April 2019
/
Accepted: 12 April 2019
/
Published: 15 April 2019
(This article belongs to the Special Issue Stakeholder Management in Tourism Destinations)
Abstract
:To make sustainable tourism a more concrete and operational concept, many sets of indicators have been proposed by both academics and policy makers. Among the latter, the European Tourism Indicator System (ETIS) was launched by the European Commission to monitor tourist destinations at a subnational level. To evaluate the social impact of tourism, the ETIS recommended the administration of a proposed questionnaire to the local residents. We conducted the survey administration of the ETIS questionnaire in an Italian seaside resort. In this paper, we report the main outcomes of the survey and propose their interpretation within the context of some of the theoretical frameworks described in the academic literature referring to the relationship between tourism and host communities.
1. Introduction
The consideration of sustainable tourism has grown in the agendas of national and international governments [1,2,3,4,5]. The involvement of local stakeholders in the realization of sustainable tourism has been increasingly acknowledged and recommended by academia and practitioners [1,2,6,7,8,9,10,11]. In particular, residents are key stakeholders in local tourism [12,13,14,15,16,17,18]: first, because to be sustainable, tourism must not have a negative impact on host communities, and second, because the attitudes of residents toward tourism are crucial for its successful development [19,20].
To make sustainable tourism a more concrete and operational concept [21], many indicator systems have been proposed. There are two main approaches to developing sustainability indicators: the scientific approach and the policy approach [21,22,23,24]. According to Tanguay et al.:
One of the most important examples of a policy approach is the European Tourism Indicator System for Sustainable Management at the Destination Level (ETIS) [25,26,27,28,29]. The ETIS was developed as a measurement instrument for the European Commission’s Study on the Feasibility of a European Tourism Indicator System for Sustainable Management at the Destination Level [30]. Its aim was to provide “a tourism system of indicators for destinations to use on a voluntary basis”, and a “guide to policy makers and other destination stakeholders for the improved management of tourism destinations across Europe” ([27] p. 3). This system includes a set of 27 core and 40 optional indicators grouped into four main analysis areas: destination management, economic value, social and cultural impact, and environmental impact.There are two main approaches to developing sustainability indicators. The scientific approach generally seeks to obtain a large amount of information, while the policy-maker approach can tend to encourage a condensing of the initially available data into synthetic indicators that may reflect and help to support political decisions and that can be simplified for public understanding ([22] p. 3).
The European Commission, following the strategies focused on tourism sustainability [31], piloted the implementation of the ETIS across Europe. Approximately 200 destinations were involved in the project. Internalizing the concept that the involvement of local stakeholders is one of the significant aspects in the development of sustainable tourism, the ETIS project envisaged the administration of a questionnaire to the residents of the destination to acquire information useful for the construction of the indicators relative to the host community.
In this paper, we present the results of the survey that we conducted between 2013–2015, administrating the ETIS questionnaire to a sample of 588 people living in the territory of the Visit South Sardinia destination management organization (DMO) in Italy. The first aim of our research was the evaluation of the impact of tourism on the resident population of a mature destination located on the Mediterranean Sea by means of the European Commission’s indicators. This result can be particularly significant since, as Sharpley [16] stated, the Mediterranean is a geographical area that has been, until now, scarcely investigated. Our second aim was to interpret the European Commission’s indicators in the context of the tourism literature. To do so, we analyzed the outcomes of the survey to verify the validity of some of the principal conceptual models developed in the academic theories. With our approach, we contribute to bridging the gap between the scientific approach and the policy approach in developing indicator systems. In particular, we show that these indicators can be used to verify the validity for the destination, considering some of the statements supported in the scientific literature. Finally, to quantify the satisfaction of residents with tourism, we aggregated the indicators in a global index and identified the determinants that might explain the differences in the levels of satisfaction among those residents.
The remainder of the paper is structured as follows. In Section 2, we synthesize and review some concepts from the literature on indicator systems for tourism sustainability and residents’ perception of tourism development. In Section 3, we illustrate the specifics of the destination where we conducted our survey. In Section 4, we describe the sample considered and the methodology used to administer the survey. We discuss the results of our investigation in Section 5. Some conclusions and some final remarks are provided in Section 6.
2. Background and Literature Review
Tourism development has economic, sociocultural, and environmental impacts on the local level. The monitoring of these effects is necessary on a continuous basis, “not only for purposes of protecting the community’s well-being, but also to ensure that the quality and long-term viability of the tourism product at individual destinations is not undermined by adverse reactions of the resident population” [32]. Tourism indicator systems are considered a method to operationalize sustainable tourism through the use of qualitative and quantitative measures that detect tourism impacts over time [25,33,34,35]. While the academia was developing an intense debate and proposing scientifically sound indicator systems, private and local tourism as well as international organizations and local tourism destinations asked for easy-to-implement and practical indicators. As previously outlined [21,22,23,24], two different approaches to developing indicator systems can be identified based on the audience that demands these practical tools: indicators for scientists and indicators for policy makers and the public. These approaches reveal divergent interests and do not frequently gain legitimacy outside their own audience. As sustainability is regarded as a complex subject, its practical expression, i.e., indicator systems, requires complicated technical and scientific methods. Often, local tourism stakeholders are not familiar with these tools, and as a consequence, as Tanguay et al. [22] highlighted, they lack social legitimacy and public consensus. As the result of a compromise between scientific and policy interests, since its launch in 2013, the ETIS had been recognized by experts and legitimized by two pilot phases coordinated by the European Commission. The ETIS was designed to be flexible [27] for effectiveness and usefulness in different destination settings. The flexible characteristic of the ETIS implies that it can be simplified for better public understanding, simultaneously helping to support political decisions. As reported in Section 1, with the aim of more deeply evidencing the scientific connotation of the ETIS, we interpret the results from the ETIS survey administered to tourism-area residents in the context of some of the theories that have been developed in the tourism literature.
Many researchers investigated the attitudes of residents toward tourism development [14,15,16,36]. Several different theoretical models were used as frameworks for the research. In the following, we briefly mention a list of theories that, in our opinion, provide guidance for the interpretation of the results we obtained. Previous studies [14,15,16,37] provide exhaustive discussions on this topic. One of the most corroborated theories used in the tourism literature is the social exchange theory (SET), according to which individuals tend to support tourism development when the tradeoff between costs and benefits is perceived as positive [34]. The SET model explains that any adverse socio-cultural impact may be accepted if it is balanced by the realization of economic benefits to the individual [38]. A large amount of evidence supports the assertion that residents with a higher personal economic reliance on tourism are more favorable toward it [14]. Some theorists noticed that individuals may tolerate personal costs of tourism development if broader collective benefits are provided to the host community. This is primarily the reason why some authors proposed the altruistic surplus phenomenon (ASP) concept, which envisages that costs might be tolerated in the interests of broader community benefits [39]. Thus, a positive reaction to tourism development was observed among individuals regardless of the extent of their involvement in the tourism industry [38].
SET and ASP frameworks offer two keys for the interpretation of the relationship between the host community and tourism, which mitigate the claims of two other theories: the Tourist Area Life Cycle (TALC) [37] and the Irridex model [40,41]. These two models suggest that local residents are initially inclined to have positive attitudes toward tourism, but their perception of its impact and their level of its acceptance tend to evolve as tourism increases [42]. In addition to the factors that we have described, the literature proposes other factors that may explain the attitudes of residents toward tourism. According to the definition adopted by Faulkner and Tideswell [32], these factors can be classified as extrinsic and intrinsic, with the former referring to the characteristics of the destination, whereas the latter refers to the characteristics of the residents. The extrinsic factors that authors found relevant included the density of tourist/tourism development [39,40], the seasonality [16,37,43,44,45], the degree or stage of tourism development [41,46], and the level of economic activity in the host area [47]. Among the intrinsic factors, the most mentioned are: the perceived impact of tourism [14,48], the geographical proximity to concentrations of business [49], the area of residence [50], the length of residency [51], the level of contact with tourists, the economic reliance on tourism [12,14,16,52,53,54,55,56], and the sociodemographic characteristics of the residents [14,16,37,50]. In Table 1, we list the extrinsic and intrinsic factors that were considered in our study.
In summary, we formulated some statements about the relationship between tourism and the host community in Visit South Sardinia that we evaluated in the first part of our study on the basis of the answers to the ETIS questionnaire that we gathered. The statements are:
- Statement 1a: There is a relationship between the satisfaction with tourism and the seasonality.
- Statement 1b: In line with the TALC and Irridex models, heavy tourism concentration in a destination leads to negative resident attitudes and resident behavior toward the tourism.
- Statement 2a: The overall attitude of residents toward tourism could be a function of certain sociodemographic characteristics.
- Statement 2b: The attitude of residents toward tourism is a function of the economic dependency of the residents on tourism.
- Statement 2c: In the context of tourism, the ASP theory suggests that individuals tolerate any downside effects of tourism that they might experience personally because they recognize the broader community-wide benefits of this activity.
- Statement 2d: The attitudes of residents toward tourism are a function of the perceived benefit of the residents (e.g., personal benefits and community benefits).
Following the literature, we noticed that the first two statements refer to variables that can be classified as extrinsic factors, whereas the remaining ones are intrinsic factors.
To verify the validity of the statements, we first elaborated upon each of the indicators suggested in the ETIS toolkit; then, we aggregated the indicators to construct an index measuring residents’ global tourism satisfaction with tourism.
3. Case Study Destination
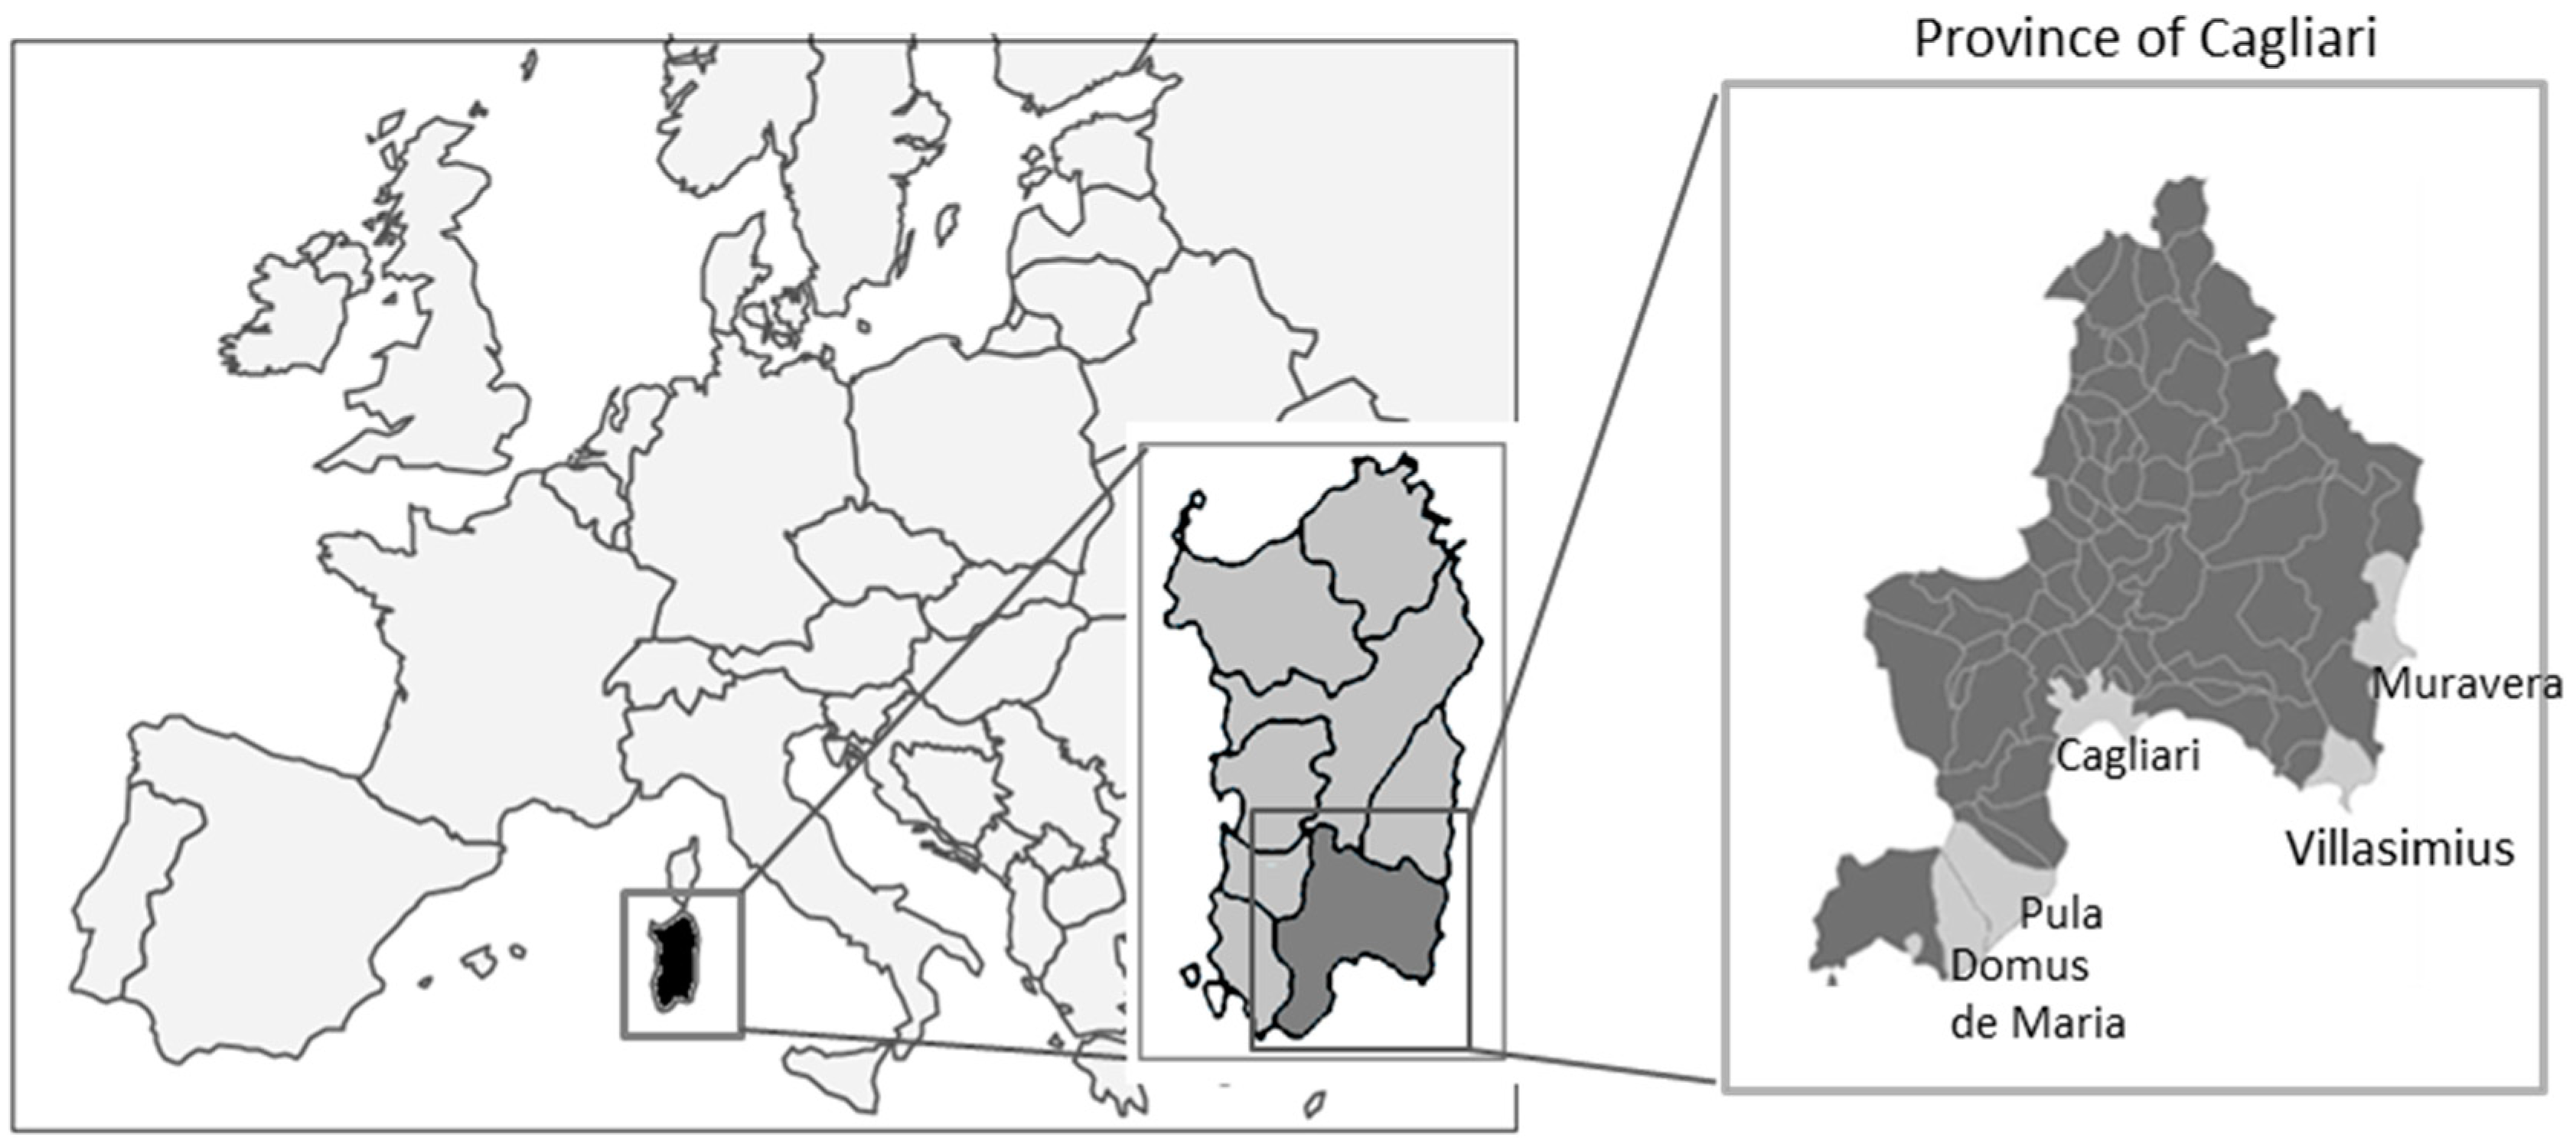
The Visit South Sardinia DMO has a total area of 473 km2, which is delimitated by coastline spotted with sandy and rocky beaches. The sea and many famous beaches are central to its strong international image. Tourism is a key economic driver for the destination, which is home to significant tourism infrastructure, such as hotels and other tourism-related businesses. Important roadways, railways, ports, and an international airport provide access to the destination.
The Visit South Sardinia DMO includes five municipalities (Figure 1): Cagliari (population 154,460), Domus De Maria (population 1675), Pula (population 7422), Villasimius (population 3420), and Muravera (population 5162). Often bypassed by arriving tourists heading for the beaches, Cagliari is the capital of Sardinia and the city with the largest population. Even if the city offers many tourist attractions, such as the old city center, museums, the marine terminal, and a long beach, Cagliari is an urban area where most residents do not rely on tourism because its economy is well diversified. Conversely, tourism has a dominant position in the local economy of the remaining towns in the DMO. Given their natural positions and their high-quality tourism services, the other municipalities are viewed as exclusive seaside resorts serving mainly upper-middle and upper-class vacationers. Among the famous and valued tourist destinations on the Mediterranean Sea coast, Villasimius, Pula, Muravera, and Domus De Maria experience a strong seasonality phenomenon with overcrowded summers.
The differences between Cagliari and the other towns suggest that residents of the DMO may have two dissimilar experiences with tourism. Therefore, in our analysis, we decided to classify the respondents into two categories. In the first category, we included the inhabitants of Cagliari only; in the second, we aggregated the inhabitants of the remaining towns (labeled “other towns”).
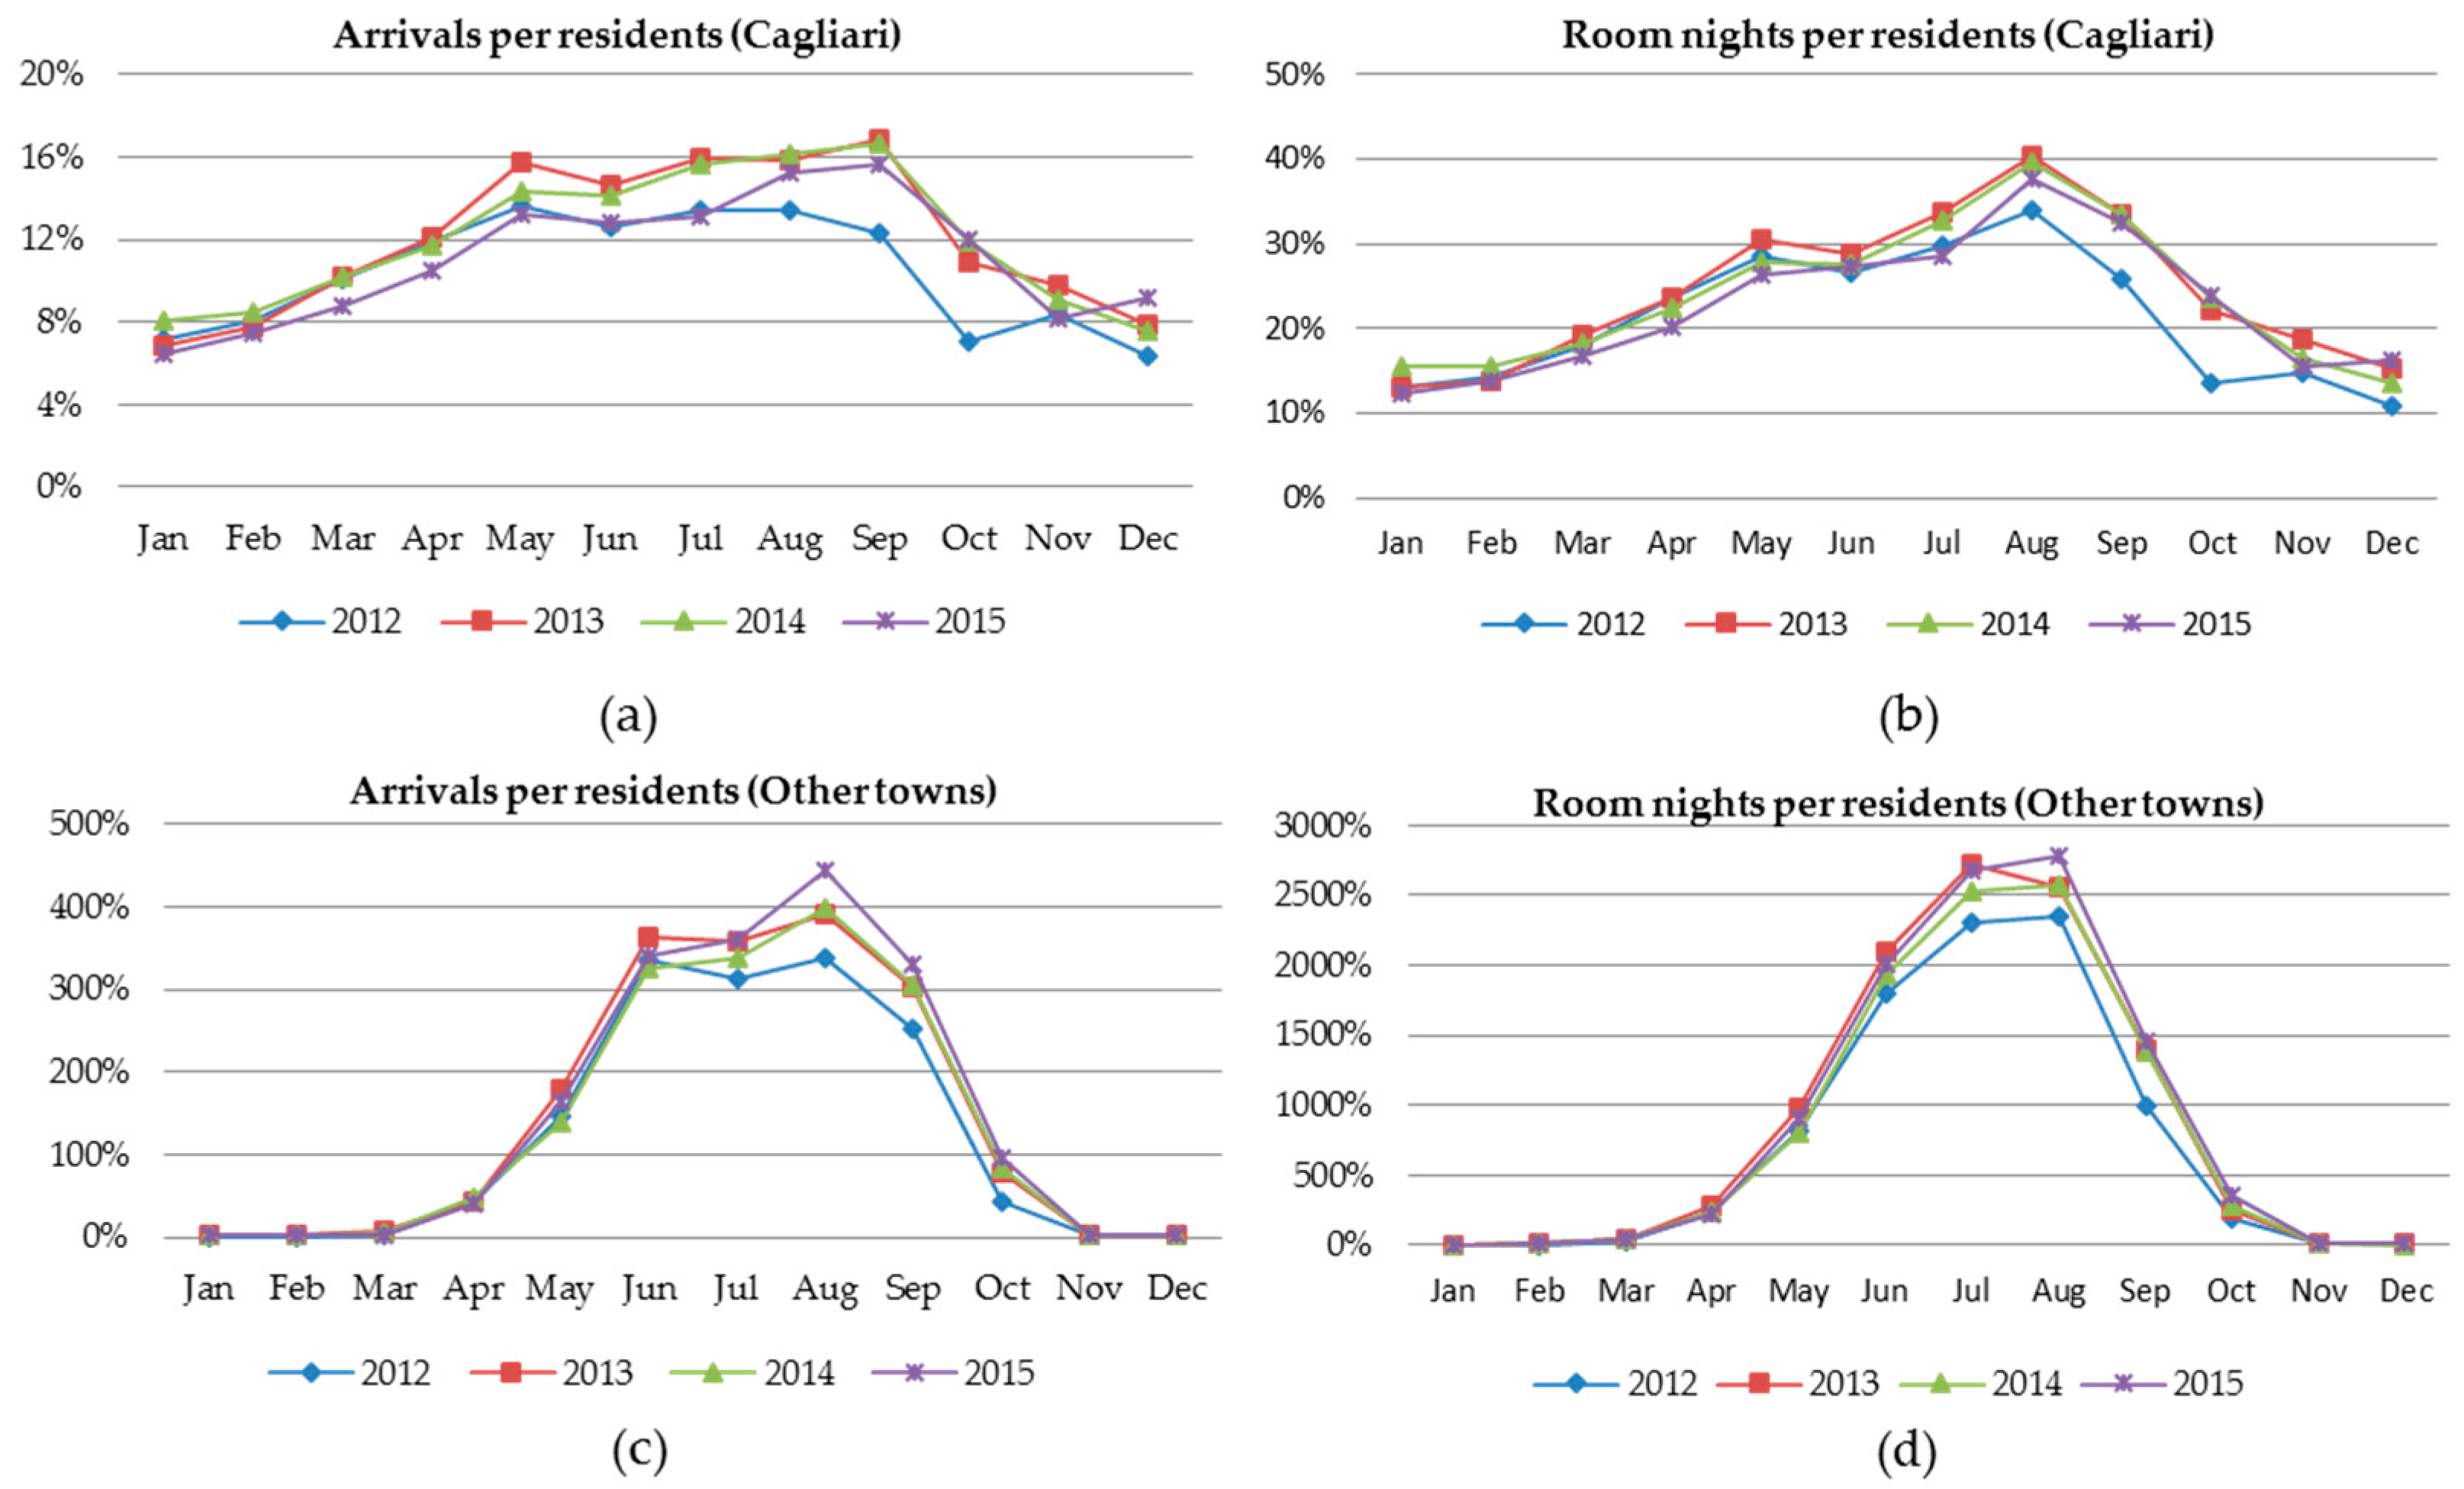
The dichotomy that characterizes the DMO is evident when considering the tourism pressure measured as “number of tourist arrivals per resident” and “number of room nights per resident”. As shown by comparing the graphs depicted in Figure 2, the tourism pressure in other towns is about 35 times the pressure in Cagliari. Another notable difference is the seasonality in the two areas. In Cagliari, the high season for tourists is from May to October (when Cagliari receives about 60% of its annual arrivals), but tourists visit the city year round. The other towns have a high season around the peak summer months, which accounts for 90% of their arrivals.
4. Materials and Methods
In this section, we introduce the indicators investigated using the ETIS questionnaire that interviewers administered to the residents of the Visit South Sardinia DMO. The ETIS suggested asking a very limited number of questions, the rationale being to provide the destinations with basic information on the host community through the repeated evaluation of a set of core indicators over the years.
As a starting point, the ETIS considers the social impact of tourism on the host community by measuring “the percentage of residents who are satisfied with tourism in the destination”. To track changes in levels of satisfaction during the year and compare these to the levels of tourist flow, the ETIS proposes the evaluation of this percentage in each season. Thus, four different indicators were constructed to calculate the level of satisfaction in autumn (Ind1), winter (Ind2), spring (Ind3), and summer (Ind4). The engagement of the residents in tourism planning was also investigated through the following indicator: “the percentage of residents satisfied with their involvement and their influence in the planning and development of tourism” (Ind5).
As a second aspect, the ETIS evaluates the cultural impact of tourism on the host community. To be sustainable, tourism should not threaten the cultural heritage or the local identity. Therefore, the sixth indicator proposed is: “the percentage of residents who have positive or negative views on the impact of tourism on destination identity” (Ind6). Finally, the ETIS examines the perceptions of the residents on personal and common benefits brought by tourism with the following indicators: “The percentage of residents who think that there are benefits for the community from tourism and tourists visiting the destination” (Ind7), “The percentage of residents who think they receive personal benefits from tourism and tourists visiting the destination” (Ind8), and “The percentage of residents who think that tourism has a positive effect on their quality of life” (Ind9).
The questionnaire was split into three sections. In the first, the seven items corresponding to the indicators from Ind1 to Ind7 were investigated using a five-point Likert scale ranging from one (completely disagree) to five (completely agree). For these cases, we constructed the indicators by summing the number of respondents who answered “agree” or “strongly agree” with the assertion. The second section included the last two items, referring to indicators Ind8 and Ind9, which were measured on an ordinal scale (1 = tourism damages, 2 = tourism has no effects, 3 = tourism helps to maintain, 4 = tourism helps to improve). We calculated these last two indicators, including the number of respondents who selected “tourism helps to improve”. For clarity, the items included in the first two sections of the ETIS questionnaire are listed in Table 2.
The last section of the questionnaire focused on the sociodemographic characteristics of respondents (gender, age, education, and employment status).
We collected data through face-to-face interviews. We used LimeSurvey software version 2.55.2 (LimeSurvey GmbH, Hamburg, Germany) to gather the questionnaires and IBM SPSS software version 25 (IBM, Armonk, NY, USA) for the data analysis. The survey was based on a representative random sample of the resident population. The respondents were selected using a quota system of random sampling by gender, age, and the population of the five towns. The sample size represented the population of the five towns of Visit South Sardinia at a level of 1% based on the information retrieved from the Italian National Institute of Statistics in 2014. The final sample size was determined to have a 95% confidence level with a 3% error. A total of 588 completed questionnaires were collected in face-to-face interviews administrated in public places (streets, common areas, etc.) from May to September 2015. The sociodemographic profile of the sample is reported in Table 3.
5. Results
5.1. Extrinsic and Intrinsic Factors Affecting Host Community’s Satisfaction Toward Tourism in Visit South Sardinia DMO
We report the outcomes for the ETIS indicators based on the answers gathered from the sample. Table 4 and Table 5 show the values of each indicator together with the distribution of the answers for the different items.
From the results reported in Table 4, “the percentage of residents who are satisfied with tourism in the destination” varies substantially in the different seasons of the year. The values of the indicators increase from winter to summer and diminish again in autumn. The t-test computations in Table 6 show that, with the exception of autumn and winter, there is strong evidence against the hypothesis that the percentages are equal in pairs of seasons.
The outcomes show that in the Visit South Sardinia DMO, the seasonality phenomenon is an extrinsic factor that considerably affects the level of satisfaction of the residents with tourism. Specifically, respondents were very satisfied with the highest season (Ind4 = 75.5) and very disappointed in the lowest season (Ind2 = 25.9). Therefore, even if the long-term presence of tourism as a major industry in the area and the manifestations of mass tourism suggest that Visit South Sardinia has reached an advanced stage in Butlers’ model, tourism pressure does not disturb the host community, which, on the contrary, is unsatisfied when tourism is nearly absent. Similar results in contrast with the Doxey scenario have been evidenced in other studies [16]. Thus, the results for the first four indicators support statement 1a and confute statement 1b.
Referring to how tourism benefits the territory, there was consensus in affirming that tourism is beneficial for the community (Ind9 = 78.7), even if only 44.6% of the respondents acknowledged the existence of personal benefits (Ind6). We plausibly affirm that the concept expressed in ASP theory is reliable for the Visit South Sardinia DMO (statement 2c). In addition, 60.8% and 68.5% of the interviewees recognized a positive impact of tourism on the preservation of cultural heritage and local identity, and the quality of life, respectively (Ind8 and Ind9, respectively). As a downside, the survey highlights that the majority of interviewees had complaints about engagement in tourism development planning; only 35.6% were satisfied or strongly satisfied (Ind7).
To further investigate the effect of the extrinsic factors on the relationship between tourism and residents, we compared the distribution of the indicators in Cagliari and the other towns. The results in Table 7 show that the place of residence, at least in part, influenced the answers of the respondents. In particular, less disparity was observed among the seasonal level of satisfaction in Cagliari than in the other towns. We conjecture that this is principally due to two aspects: firstly, the season affects tourist flows in Cagliari to a lesser extent, and secondly, the negative impact of the seasonality on the economy is less detrimental in the capital, since most of its inhabitants do not rely on tourism for their economic well-being. Thus, the results corroborate the statement that seasonality creates disappointment in the host community [37,45]. Almeida-García et al. [37] interpreted seasonality as being one of the least valued aspects in tourism as “on the one hand, tourism creates employment opportunities but, on the other, it forces residents to deal with an intra-annual irregularity as to the needs of labor,” seems plausible. The tradeoff is clear: if there is no business, there is no compensation, so tourism workers need to find another job or be unemployed during the months of downtime [45].
Concerning Ind8, most residents (60.8%) felt that tourism helps to improve the distinctiveness and local identity, culture, and heritage of the Visit South Sardinia DMO. The comparison of the percentages that Ind8 attained in Cagliari and the other towns clearly indicates that in the latter, the host community feels the existence of a strong commitment between tourism and its cultural identity.
Even if in both places the vast majority affirmed that tourism has a positive impact on the quality of life (Ind9), Cagliari’s residents felt less positive compared to those in the other towns.
To verify statement 2a, we analyzed the effects of some intrinsic variables on the satisfaction of residents with tourism [32]. In Table 8, we list the results obtained for the indicators by residents’ sociodemographic characteristics. We note that both gender and education did not seem to affect the levels of satisfaction expressed in Ind1, Ind2, Ind3, and Ind4. Differently, a significant association exists among the level of satisfaction recorded in autumn, winter, and spring, and the age and work force variables. Referring to age, in line with previous studies [57,58,59], the elderly residents in the DMO were the most satisfied with tourism. With regard to the work force variable, we observed that the unemployed and retired residents showed greater levels of satisfaction compared with the others.
For statement 2d, the statistical test of independence suggests that the residents with an occupation relying on tourism were in general the least satisfied.
As noted in the first part of this section, the vast majority of the respondents recognized that tourism benefits the community (Ind5 = 78.8%). In this case, the chi-squared association test results are significant only for educational level (χ2 = 7.633, p-value = 0.022). The higher the educational level, the higher the percentage of residents who acknowledge that tourism benefits their community.
The intrinsic variables remarkably influence the perception of personal benefits. For indicator Ind6, we found a significant association with respect to age (χ2 = 10.846, p-value = 0.004), education (χ2 = 27.7, p-value < 0.0001), work force (χ2 = 31.132, p-value < 0.0001), and occupational reliance on tourism (χ2 = 15.937, p-value < 0.0001). In particular, the adult residents felt more benefits compared to the young, the elderly, and the less educated residents, who produced a lower value for this indicator. As for the work force variable, retired residents showed the lowest values for this indicator, whereas employed residents showed the highest percentage of agreement. Residents working in the tourism sector had the highest values for this indicator.
Agreement was expressed by only 35.6% of the respondents for Ind7, meaning that the residents felt only slightly involved in planning and development of tourism. As for the sociodemographic characteristics, the statistical test of independence suggests that a significant association existed between the indicator and education and work force. In particular, the greater the educational level, the lower the satisfaction with involvement in the planning and development of tourism (χ2 = 5.763, p-value < 0.001). The unemployed and retired residents showed the highest percentage of satisfaction.
The positive relationship between tourism and cultural identity was felt more in the other towns than in Cagliari. As for the sociodemographic variables, the statistical test of independence suggests the existence of an association between the educational level and the work force indicators. The higher the educational level, the higher the percentage of residents who have positive views on the impact of tourism on the identity of the destination. Students reported more positive views of the impact of tourism on the identity of the destination compared to the other residents.
Among the intrinsic characteristics, educational level (χ2 = 9.329, p-value = 0.009) influences Ind9, which indicates that the greater the educational level, the greater the percentage of the residents who think that tourism helps improve their quality of life.
5.2. Global Satisfaction with Tourism
Following the European Commission guidelines, we synthetized four items (“Satisfaction in autumn”, “Satisfaction in winter”, “Satisfaction in spring”, and “Satisfaction in summer”) into a single index using the factor analysis (FA) method [60]. We interpreted the proposed index as a measure of the global level of satisfaction with tourism expressed by the residents of the DMO. We applied maximum likelihood estimation to extract the first factor, and we obtained the results reported in Table 9.
The Cronbach’s α [61] is above 0.85. This outcome highlights that a good internal consistency was detected among the four items. The Bartlett’s sphericity test (χ2 = 1661.712 with six degrees of freedom and p-value < 0.001) indicates that the correlation matrix for the four items is significantly different from the identity matrix, signaling that it was appropriate to conduct a FA. The first factor, which, as shown in Table 9, is associated with an eigenvalue greater than one and explains 61.584% of the total variance, was considered a measure of global satisfaction (GS), summarizing the attitude of the residents toward tourism over the entire year. The score of the index ranged from −1.626 to 1.96, with lower values corresponding to low levels of satisfaction and greater values corresponding to higher levels of satisfaction. To detect the effects of the respondents’ characteristics on the value of the GS index, we conducted an ANOVA test. The results obtained showed that differences in means appeared with respect to the place of residence (ANOVA: 14.271, p-value < 0.0001), age (ANOVA: 4.61, p-value = 0.01), work force (ANOVA: 8.843, p-value < 0.0001), and the occupational reliance on tourism (ANOVA: 7.657, p-value = 0.006). The statistical evidence outlines that people who are less committed to tourism, i.e., Cagliari’s inhabitants and persons who are retired or not employed in the tourism sector are associated with the highest levels of the GS index.
As a final analysis, we applied a multiple linear regression model, using the GS index as a dependent variable, to further evaluate the variables influencing the satisfaction of residents. Table 10 provides the stepwise multiple linear regression results for the estimates of the influence of the covariates on the GS index. The value of the Durbin–Watson test was 1.749, meaning that the autocorrelation problems of the residual sequence can be omitted. The F test (F = 19.34 with six degrees of freedom, Sig < 0.0001) revealed that the explaining variables have a notable influence on the explained variable, and the relationship between them can be described with a linear model. Examining the results, the variables that had a significant effect on the GS index were: place of residence, work force, benefits of tourism on the community, and satisfaction with involvement in tourism planning and development. In particular, keeping the other variables constant, residents living in Cagliari reported higher values of GS compared with residents who live in other towns of Visit South Sardinia. Instead, employed residents and students were less satisfied compared to the retired and the unemployed.
From the standpoint of the perception of tourism, the residents who recognized the positive benefits of tourism on the community were more satisfied with tourism. Residents who were more satisfied with the involvement and influence in the planning and development of tourism were also more satisfied with tourism.
6. Discussion
Academics and government agencies agree in considering host community wellness as essential to achieving the sustainable development of local tourism destinations. Controversies start deciding how to measure residents’ perception of tourism impacts, so several systems of indicators have been developed and implemented in tourism destinations. As a major drawback, this heterogeneity complicates or prevents comparisons among destinations. To reconcile, even if to a small extent, the academic and policy approach to the measurement of residents’ attitude toward tourism, in this paper, we interpreted the European Commissions’ indicators within the context of the scientific literature. The principal results that we found are reported in Table 11. In general, the results regarding the ETIS confirmed those in the academic literature [15,16]. In accordance with previous studies [16,37,45], our research outlines the existence of a relationship between residents’ satisfaction with tourism and seasonality. The approval of the host community is more evident in the high season, especially in the other towns where tourism represents the main industry in the area.
With respect to the relationship of residents’ attitudes toward tourism and sociodemographic characteristics, we found no effects of gender and education on residents’ perceptions of tourism’s impact. Referring to age [57,58,59], the elderly residents in the DMO were the most satisfied with tourism. This result can be explained by older people’s perceptions of tourism as a factor in creating new public facilities, preserving traditions, and having opportunities to interact with foreigners [37]. With regard to the work force variable, we observed that the unemployed and retired residents showed greater levels of satisfaction compared to the others, which is coherent with the results related to age [57,58,59].
In general, the residents acknowledge benefits for the community from tourism having a positive impact on the preservation of their cultural heritage and local identity, but they do not feel actively involved in tourism development planning. Even if they have a low level of satisfaction with the personal benefit of tourism, they think tourism helps improve their quality of life. These findings confirm the results reported in previous studies [62,63] and could represent a starting point for the Visit South Sardinia community to ensure a local debate on the development of sustainable tourism. Sustainability and the support for tourism are influenced by the host communities that have played an important role in the future of tourism in the area. Residents can directly affect tourists’ experiences at each respective destination.
In addition to the separated analysis of each indicator, we proposed the construction of an index measuring the global satisfaction with tourism. This index allowed us to determine the seasonal satisfactions investigated in the ETIS in a unitary trait (given by Ind1 to Ind4). From an overall point of view, Cagliari’s residents were the most satisfied with tourism in the Visit South Sardinia DMO. This result seems to confirm that, as described in the TALC and the Irridex models [38,40], the residents that live in the less concentrated tourism areas have more positive attitudes toward tourism. In light of the outcomes previously discussed, we think that a different interpretation may be suggested. As we observed in the first part of our analysis, in other towns, in the municipalities where tourism has a dominant position, residents are disappointed during the low season (Ind1, Ind2), and complain of their lack of involvement and influence in the planning and development of tourism (Ind7). Thus, we conjecture that dissatisfaction in the other towns may be interpreted as the residents’ request for a more rational tourism development. Residents who are more satisfied with the planning and development of tourism have a more positive attitude toward tourism. Tourism managers and planners need to consider these aspects as a basis for obtaining citizens’ cooperation. Concerning the intrinsic factors as sociodemographic variables, the analysis indicates that being retired has a positive effect on global satisfaction [61,62,63]. This underlines the direct relationship between the positive benefit on the community and the attitude of residents toward tourism [37,40,52].
7. Conclusions
Community planners and destination management organizations need to be concerned with all stakeholders in a destination, rather than only with the visitors [7]. Involving stakeholders in sustainable tourism initiatives is acknowledged within both academia and practice. In particular, many efforts have been made to build indicators for the evaluation of tourism impacts on the host communities. In this paper, we presented the results of the survey that we conducted in the DMO Visit South Sardinia by administering the ETIS questionnaire to a sample of 588 residents. One of the main aspects that emerged from our research indicated that almost all residents have a positive perception of tourism development, and consider tourism beneficial to their quality of life. Nonetheless, local people denounce their lack of involvement in the decision planning, pointing out that stakeholder inclusion in the tourism development process has not been realized. However, as Byrd observed, “educating and informing the local community will strengthen the tourism industry” ([7], p. 12). Therefore, it is necessary that community planners and destination management organizations make an effort to accomplish stakeholder involvement.
Our research has some limitations. The first is sample size, even though the sample correctly represents the population strata of the five towns. This limitation is common to several studies on attitudes toward tourism [16]. The ETIS questionnaire could benefit from other sociodemographic information (e.g., years of residency in the town, nationality, or whether the residents think they live in a tourist area), which would explain the satisfaction of the residents in regressions. In our opinion, the methodologies used in this research may provide a guide for other destinations involved in the ETIS project. If, as in the intentions of the European Commission, all the European countries adopt this set of indicators, it would be possible to compare the results and understand differences and similarities among destinations regarding the opinions of both residents and travelers toward tourism.
Author Contributions
The authors have contributed equally to research design and development, data analysis and writing the paper. The authors have read and approved the final manuscript.
Funding
This research received no external funding.
Acknowledgments
The project presented in this paper has been supported by the municipalities of VSS, Area Marina Protetta Capo Carbonara, Università di Cagliari and Fondazione Banco di Sardegna.
Conflicts of Interest
The authors declare no conflict of interest
References
- UNEP; UNWTO. Making Tourism More Sustainable: A Guide for Policy Makers; UNEP: Madrid, Spain, 2005. [Google Scholar]
- UNWTO. UNWTO’s Declaration on Tourism and the Millennium Development Goals: Harnessing Tourism for the Millennium Development Goals; UNWTO: Madrid, Spain, 2006. [Google Scholar]
- UNWTO. World Charter for Sustainable Tourism+20. Available online: http://sustainabletourismcharter2015.com/wp-content/uploads/2016/04/ST-20CharterMR.pdf (accessed on 31 January 2019).
- European Commission. Agenda for a Sustainable and Competitive European Tourism; COM/2007/0621 Final; European Commission: Brussels, Belgium, 2007. [Google Scholar]
- European Commission. Communication from the Commission to the European Parliament, the Council, the European Economic and Social Committee and the Committee of the Regions—Europe, the world’s No 1 Tourist Destination—A new Political Framework for Tourism in Europe; COM/2010/0352; European Commission: Brussels, Belgium, 2010. [Google Scholar]
- European Commission. The European Tourism Indicator System. Toolkit for Sustainable Destinations; European Union: Luxembourg, 2013. [Google Scholar]
- Byrd, E.T. Stakeholders in sustainable tourism development and their roles: Applying stakeholder theory to sustainable tourism development. Tour. Rev. 2007, 62, 6–13. [Google Scholar] [CrossRef]
- D’Angella, F.; Go, F.M. Tale of two cities’ collaborative tourism marketing: Towards a theory of destination stakeholder assessment. Tour. Manag. 2009, 30, 429–440. [Google Scholar] [CrossRef]
- Kennedy, V.; Augustyn, M.M. Stakeholder power and engagement in an English seaside context: Implications for destination leadership. Tour. Rev. 2014, 69, 187–201. [Google Scholar] [CrossRef]
- Pérez, V.E.; Santoyo, A.H.; Guerrero, F.; León, M.A.; Silva, C.L.; Caballero, R. Measuring the sustainability of Cuban tourism destinations considering stakeholders’ perceptions. Int. J. Tour. Res. 2017, 19, 318–332. [Google Scholar]
- Waligo, V.; Clarke, J.; Hawkins, R. Embedding stakeholders in sustainable tourism strategies. Ann. Tour. Res. 2015, 55, 90–93. [Google Scholar] [CrossRef] [Green Version]
- Choi, H.; Murray, I. Resident attitudes toward sustainable community tourism. J. Sustain. Tour. 2010, 18, 575–594. [Google Scholar] [CrossRef]
- Lu, J.; Nepal, S.K. Sustainable tourism research: An analysis of papers published in the Journal of Sustainable Tourism. J. Sustain. Tour. 2009, 17, 5–16. [Google Scholar] [CrossRef]
- Martínez-Garcia, E.; Raya, J.M.; Majó, J. Differences in residents’ attitudes towards tourism among mass tourism destinations. Int. J. Tour. Res. 2017, 19, 535–545. [Google Scholar] [CrossRef]
- Nunkoo, R.; Smith, S.L.; Ramkissoon, H. Residents’ attitudes to tourism: A longitudinal study of 140 articles from 1984 to 2010. J. Sustain. Tour. 2013, 21, 5–25. [Google Scholar] [CrossRef]
- Sharpley, R. Host perceptions of tourism: A review of the research. Tour. Manag. 2014, 42, 37–49. [Google Scholar] [CrossRef]
- Zhang, H.Q.; Fan, D.X.F.; Tse, T.S.M.; King, B. Creating a scale for assessing socially sustainable tourism. J. Sustain. Tour. 2017, 25, 61–78. [Google Scholar] [CrossRef]
- Lundberg, E. The importance of tourism impacts for different local resident groups: A case study of a Swedish seaside destination. J. Destin. Mark. Manag. 2017, 6, 46–55. [Google Scholar] [CrossRef]
- Snyman, S. Strategic community participation in sustainable tourism. In Reframing Sustainable Tourism; McCool, S.F., Bosak, K., Eds.; Springer: New York, NY, USA, 2016; pp. 65–80. [Google Scholar]
- Yu, C.-P.; Chancellor, H.C.; Cole, S.T. Measuring residents’ attitudes toward sustainable tourism: A re-examination of the sustainable tourism attitude scale. J. Travel Res. 2011, 50, 57–63. [Google Scholar] [CrossRef]
- Manning, T. Indicators of tourism sustainability. Tour. Manag. 1999, 20, 179–182. [Google Scholar]
- Tanguay, G.A.; Rajaonson, J.; Therrien, M.C. Sustainable tourism indicators: Selection criteria for policy implementation and scientific recognition. J. Sustain. Tour. 2013, 21, 862–879. [Google Scholar] [CrossRef]
- Rametsteiner, E.; Pülzl, H.; Alkan-Olsson, J.; Frederiksen, P. Sustainability indicator development—Science or political negotiation? Ecol. Indic. 2011, 11, 61–70. [Google Scholar] [CrossRef]
- Shields, D.J.; Solar, S.V.; Martin, W.E. The role of values and objectives in communication indicators of sustainability. Ecol. Indic. 2002, 2, 146–160. [Google Scholar] [CrossRef]
- Torres-Delgado, A.; Palomeque, F.L. Measuring sustainable tourism at the municipal level. Ann. Tour. Res. 2014, 49, 122–137. [Google Scholar] [CrossRef]
- Fernández-Tabales, A.; Foronda-Robles, C.; Galindo-Pérez-de-Azpillaga, L.; García-López, A. Developing a system of territorial governance indicators for tourism destinations. J. Sustain. Tour. 2017, 25, 1275–1305. [Google Scholar] [CrossRef]
- Cardia, G.; Jones, A. PM4SD as a Methodological Framework for Sustainable Tourism. In Tourism, Culture and Heritage in a Smart Economy; Springer: Cham, Switzerland, 2017; pp. 275–292. [Google Scholar]
- Modica, P.; Capocchi, A.; Foroni, I.; Zenga, M. An Assessment of the Implementation of the European Tourism Indicator System for Sustainable Destinations in Italy. Sustainability 2018, 10, 3160. [Google Scholar] [CrossRef]
- Tudorache, D.M.; Simon, T.; Frenț, C.; Musteaţă-Pavel, M. Difficulties and Challenges in Applying the European Tourism Indicators System (ETIS) for Sustainable Tourist Destinations: The Case of Braşov County in the Romanian Carpathians. Sustainability 2017, 9, 1879. [Google Scholar] [CrossRef]
- Miller, G.; Simpson, M.; Twinning-Ward, L. Study on the Feasibility of a European Tourism Indicator System for Sustainable Management at Destination Level. University of Surrey (U.K). Available online: https://www.surrey.ac.uk/shtm/Files/Task%201c)%20Final%20Case%20Study%20Review.pdf (accessed on 31 January 2019).
- Tourism Sustainability Group. Report of the Tourism Sustainability Group—Action for More Sustainable European Tourism; Ref. Ares 78493-15/01/2014.; European Commission: Brussels, Belgium, 2014. [Google Scholar]
- Faulkner, B.; Tideswell, C.A. Framework for Monitoring Community Impacts of Tourism. J. Sustain. Tour. 1997, 5, 3–28. [Google Scholar] [CrossRef]
- Butler, R.W. Sustainable tourism—A state of the art review. Tour. Geogr. 1999, 1, 7–25. [Google Scholar] [CrossRef]
- Miller, G. The development of indicators for sustainable tourism: Results of a Delphi survey of tourism researchers. Tour. Manag. 2001, 22, 351–362. [Google Scholar] [CrossRef]
- Torres-Delgado, A.; Saarinen, J. Using indicators to assess sustainable tourism development: A review. Tour. Geogr. 2014, 16, 31–47. [Google Scholar] [CrossRef]
- Ap, J. Residents’ perceptions on tourism impacts. Ann. Tour. Res. 1992, 19, 665–690. [Google Scholar] [CrossRef]
- Almeida-García, F.; Peláez-Fernández, M.A.; Balbuena-Vázquez, A.; Cortés-Macias, R. Resident’s perceptions of tourism development in Benalmádena (Spain). Tour. Manag. 2016, 54, 259–274. [Google Scholar] [CrossRef]
- Clifton, J.; Benson, A. Planning for Sustainable Ecotourism: The Case for Research Ecotourism in Developing Country Destinations. J. Sustain. Tour. 2006, 14, 238–254. [Google Scholar] [CrossRef]
- Paraskevaidis, P.; Andriotis, K. Altruism in tourism: Social Exchange Theory vs. Altruistic Surplus Phenomenon in host volunteering. Ann. Tour. Res. 2017, 62, 26–37. [Google Scholar] [CrossRef]
- Butler, R.W. The concept of a tourism area cycle of evolution: Implications for the management of resources. Can. Geogr. 1980, 24, 5–12. [Google Scholar] [CrossRef]
- Doxey, G.V. A causation theory of visitor-resident irritants: Methodology and research inferences. In Proceedings of the Sixth Annual Conference Proceedings, of the Travel Research Association, San Diego, CA, USA, 8–11 September 1975; pp. 195–198. [Google Scholar]
- Teye, V.; Sonmez, S.F.; Sirakaya, E. Residents’ attitudes toward tourism development. Ann. Tour. Res. 2002, 29, 668–688. [Google Scholar] [CrossRef]
- Vargas-Sánchez, A.; Plaza-Mejía, M.A.; Porras-Bueno, N. Understanding residents’ attitudes toward the development of industrial tourism in a former mining community. J. Travel Res. 2009, 47, 373–387. [Google Scholar] [CrossRef]
- Bestard, B.; Nadal, R. Attitudes toward tourism and tourism congestion. Région et Développement 2007, 25, 193–207. [Google Scholar]
- Cerezo, J.M. Lara de Vicente, F. El turismo como Industria de España y de la Unión Europea. In Turismo Sostenible: Un enfoque Multidisciplinar e Internacional; López, G.E., Tomás, J.Y., de Vicente, F.L., Eds.; Universidad de Córdoba: Córdoba, Spain, 2005; pp. 255–287. [Google Scholar]
- Gursoy, D.; Rutherford, D. Host attitudes toward tourism: An improved structural model. Ann. Tour. Res. 2004, 31, 495–516. [Google Scholar] [CrossRef]
- Johnson, J.; Snepenger, D.; Akis, S. Residents’ perceptions of tourism development. Ann. Tour. Res. 1994, 21, 629–642. [Google Scholar] [CrossRef]
- Dyer, P.; Gursoy, D.; Sharma, B.; Carter, J. Structural modelling of resident perceptions of tourism and associated development on the Sunshine Coast, Australia. Tour. Manag. 2007, 28, 409–422. [Google Scholar] [CrossRef]
- Fredline, E.; Faulkner, B. Host community reactions: A cluster analysis. Ann. Tour. Res. 2000, 27, 763–784. [Google Scholar] [CrossRef]
- Nunkoo, R.; Ramkissoon, H. Modeling community support for a proposed integrated resort project. J. Sustain. Tour. 2010, 18, 257–277. [Google Scholar] [CrossRef]
- Gu, H.; Ryan, C. Place attachment, identity and community impacts of tourism—The case of a Beijing Hutong. Tour. Manag. 2008, 29, 637–647. [Google Scholar] [CrossRef]
- Andereck, K.L.; Valentine, K.M.; Knopf, R.C.; Vogt, C.A. Residents’ perceptions of community tourism impacts. Ann. Tour. Res. 2005, 32, 1056–1076. [Google Scholar] [CrossRef]
- Andriotis, K.; Vaughan, R.D. Urban residents’ attitudes toward tourism development: The case of Crete. J. Travel Res. 2003, 42, 172–185. [Google Scholar] [CrossRef]
- Easterling, D.S. The residents’ perspective in tourism research: A review and synthesis. J. Travel Tour. Mark. 2004, 17, 45–62. [Google Scholar] [CrossRef]
- Oviedo-Garcia, M.A.; Castellanos-Verdugo, M.; Martin-Ruiz, D. Gaining residents’ support for tourism and planning. Int. J. Tour. Res. 2008, 10, 95–109. [Google Scholar] [CrossRef]
- Andriotis, K. Seasonality in Crete. Problem or a Way of Life? Tour. Econ. 2005, 11, 207–227. [Google Scholar] [CrossRef]
- Harrill, R.; Potts, T. Tourism planning in historic districts: Attitudes toward tourism development in Charleston. J. Am. Plann. Assoc. 2003, 69, 233–244. [Google Scholar] [CrossRef]
- Mason, P.; Cheyne, J. Residents’ attitudes to proposed tourism development. Ann. Tour. Res. 2000, 27, 391–411. [Google Scholar] [CrossRef]
- Tomljenovic, R.; Faulkner, B. Tourism and older residents in a sunbelt resort. Ann. Tour. Res. 2000, 27, 93–114. [Google Scholar] [CrossRef]
- Nardo, M.; Saisana, M.; Saltelli, A.; Tarantola, S. Tools for Composite Indicators Building. 2005. Available online: http://publications.jrc.ec.europa.eu/repository/bitstream/JRC31473/EUR%2021682%20EN.pdf (accessed on 10 November 2018).
- Cronbach, L.J. Coefficient alpha and the internal structure of tests. Psychometrika 1951, 16, 297–334. [Google Scholar] [CrossRef] [Green Version]
- Garrod, B.; Fyall, A.; Leask, A.; Reid, E. Engaging residents as stakeholders of the visitor attraction. Tour. Manag. 2012, 33, 1159–1173. [Google Scholar] [CrossRef]
- Lawton, L.; Weaver, D.W. Using residents’ perceptions research to inform planning and management for sustainable tourism: A study of Gold Coast Schoolies Week, a contentious tourism event. J. Sustain. Tour. 2015, 23, 660–682. [Google Scholar] [CrossRef]
Figure 1.
Map of the Province of Cagliari (Sardinia), including the five municipalities of Visit South Sardinia.
Figure 1.
Map of the Province of Cagliari (Sardinia), including the five municipalities of Visit South Sardinia.

Figure 2.
(a) Monthly arrivals per residents in Cagliari from 2012 to 2015; (b) monthly room nights per residents in Cagliari from 2012 to 2015; (c) monthly arrivals per residents in the “other towns” from 2012 to 2015; (d) monthly room nights per residents in the “other towns” from 2012 to 2015. Source: ISTAT-(Istituto Nazionale di Statistica) census survey “Occupancy of tourist accommodation establishments”.


Table 1.
Extrinsic and intrinsic factors affecting the perception of tourism in the host community. In the last column, we report a list of references where an extensive description of the corresponding factors can be found.
Table 1.
Extrinsic and intrinsic factors affecting the perception of tourism in the host community. In the last column, we report a list of references where an extensive description of the corresponding factors can be found.
| Factor | Influence on Perception | Literature |
|---|---|---|
| Seasons | High and low seasons change the perceptions of tourism | [16,37,42] |
| Density of tourists/tourism development | In general, in destinations with a high density of tourism/tourists, the perception of tourism is more negative. This needs to be counterweighed by positive aspects (e.g., economic benefits). | [16,39,45] |
| Demographic profile: age, gender, educational level | The influence of demographic variables is controversial, so they may be considered irrelevant. | [14,16,37,50] |
| Economic reliance and dependence on tourism | Many studies suggest that residents who work in the tourism sector or depend on tourism as a source of income are more positively disposed toward tourism than others. | [12,14,16,52,54,55,56] |
| Impacts (benefits or costs) | More positive impacts (benefits) tend to generate more positive perceptions of tourism. | [14,48] |
Table 2.
Description of the items investigated in the first and second sections of the European Tourism Indicator System (ETIS) questionnaire.
Table 2.
Description of the items investigated in the first and second sections of the European Tourism Indicator System (ETIS) questionnaire.
| Item | Question | Score | Indicator |
|---|---|---|---|
| Satisfaction in autumn | Overall, I am very satisfied with tourism in my destination in autumn. | 1 = Strongly disagree 2 = Disagree 3 = Neutral 4 = Agree 5 = Strongly agree | Ind1: Percentage of residents who are satisfied with tourism in the destination in autumn. |
| Satisfaction in winter | Overall, I am very satisfied with tourism in my destination in winter. | 1 = Strongly disagree 2 = Disagree 3 = Neutral 4 = Agree 5 = Strongly agree | Ind2: Percentage of residents who are satisfied with tourism in the destination in winter. |
| Satisfaction in spring | Overall, I am very satisfied with tourism in my destination in spring. | 1 = Strongly disagree 2 = Disagree 3 = Neutral 4 = Agree 5 = Strongly agree | Ind3: Percentage of residents who are satisfied with tourism in the destination in spring. |
| Satisfaction in summer | Overall, I am very satisfied with tourism in my destination in summer. | 1 = Strongly disagree 2 = Disagree 3 = Neutral 4 = Agree 5 = Strongly agree | Ind4: Percentage of residents who are satisfied with tourism in the destination in summer. |
| Benefit for the community | There are benefits for the community from tourism and tourists visiting my destination. | 1 = Strongly disagree 2 = Disagree 3 = Neutral 4 = Agree 5 = Strongly agree | Ind5: Percentage of residents who consider that tourism and tourists visiting the destination bring benefits for the community. |
| Benefit for myself | There are benefits for myself from tourism and tourists visiting my destination. | 1 = Strongly disagree 2 = Disagree 3 = Neutral 4 = Agree 5 = Strongly agree | Ind6: Percentage of residents who consider that tourism and tourists visiting the destination bring benefits for themselves. |
| Satisfaction in the planning and development of tourism | Overall, I am very satisfied with residents’ involvement and influence in the planning and development of tourism. | 1 = Strongly disagree 2 = Disagree 3 = Neutral 4 = Agree 5 = Strongly agree | Ind7: Percentage of residents satisfied with their involvement and their influence in the planning and development of tourism. |
| Effect of tourism on the distinctiveness and local identity, culture, and heritage | In your opinion, what kind of effect does tourism have on the distinctiveness and local identity, culture, and heritage of your destination? | 1 = It damages 2 = It helps to maintain 3 = It helps to improve 4 = It has no effect | Ind8: Percentage of residents who have positive views on the impact of tourism on destination identity. |
| Effect of tourism on the quality of life | In your opinion, what kind of effect does tourism have on the quality of your life in your destination? | 1 = It damages 2 = It helps to maintain 3 = It helps to improve 4 = It has no effect | Ind9: Percentage of residents who have positive views on the impact of tourism on the quality of life. |
Table 3.
Sociodemographic characteristics of sampled Visit South Sardinia residents.
| Characteristic | Frequency | Percentage |
|---|---|---|
| Gender | ||
| Female | 346 | 58.8 |
| Male | 242 | 41.2 |
| Residence | ||
| “Other towns” | 91 | 15.5 |
| Cagliari | 497 | 84.5 |
| Age | ||
| Young (15–24 years old) | 89 | 15.1 |
| Adult (25–64 years old) | 408 | 69.4 |
| Elderly (>64 years old) | 91 | 15.5 |
| Education | ||
| Lower secondary school or less | 186 | 31.6 |
| Upper secondary school | 274 | 46.6 |
| High school or more | 128 | 21.8 |
| Employment status | ||
| Unemployed | 100 | 16.9 |
| Student | 83 | 14.1 |
| Retired | 86 | 14.6 |
| Employed | 319 | 54.1 |
| Occupational reliance on tourism | ||
| Yes | 446 | 75.9 |
| No | 142 | 21.1 |
| Total | 588 | 100.0 |
Table 4.
Percentage distribution of the indicators (first section of the questionnaire).
| Indicator | N | Strongly Disagree (%) | Disagree (%) | Neutral (%) | Agree (%) | Strongly Agree (%) | Indicator Value (%) |
|---|---|---|---|---|---|---|---|
| Overall, I am very satisfied with tourism in my destination in autumn. | 588 | 10.0 | 39.8 | 19.4 | 22.4 | 8.3 | Ind1 = 30.7 |
| Overall, I am very satisfied with tourism in my destination in winter. | 588 | 14.5 | 41.5 | 18.2 | 18.4 | 7.5 | Ind2 = 25.9 |
| Overall, I am very satisfied with tourism in my destination in spring. | 588 | 6.5 | 16.8 | 15.8 | 41.7 | 19.2 | Ind3 = 60.9 |
| Overall, I am very satisfied with tourism in my destination in summer. | 588 | 4.9 | 11.7 | 7.8 | 41.7 | 33.8 | Ind4 = 75.5 |
| There are benefits for the community from tourism and tourists visiting my destination. | 587 | 1.2 | 8.2 | 11.9 | 39.7 | 39.0 | Ind5 = 78.7 |
| There are benefits for myself from tourism and tourists visiting my destination. | 582 | 5.8 | 27.1 | 22.3 | 29.7 | 14.9 | Ind6 = 44.6 |
| Overall, I am very satisfied with residents’ involvement and influence in the planning and development of tourism. | 587 | 17.0 | 32.5 | 14.8 | 25.4 | 10.2 | Ind7 = 35.6 |
Table 5.
Percentage distribution of the indicators (second section of the questionnaire).
| Indicator | N | It Damages (%) | It Has No Effect (%) | It Helps to Maintain (%) | It Helps to Improve (%) | Indicator Value (%) |
|---|---|---|---|---|---|---|
| In your opinion, what kind of effect does tourism have on the distinctiveness and local identity, culture, and heritage of your destination? | 585 | 1.4 | 10.4 | 27.4 | 60.8 | Ind8 = 60.8 |
| In your opinion, what kind of effect does tourism have on the quality of your life in your destination? | 585 | 2.2 | 9.7 | 19.5 | 68.5 | Ind9 = 68.5 |
Table 6.
Results obtained for the t-test for paired comparisons of Ind1–Ind4.
| Autumn/Winter | Autumn/Spring | Autumn/Summer | Winter/Spring | Winter/Summer | Spring/Summer | |
|---|---|---|---|---|---|---|
| t-statistic | 1.5868 | 8.0523 | 11.7508 | 9.8595 | 13.8211 | 3.1031 |
| Degrees of freedom (df) | 588 | 588 | 588 | 588 | 588 | 588 |
| p-value | 0.0567 | <0.0001 | <0.0001 | <0.0001 | <0.0001 | 0.00125 |
Table 7.
Indicators by the sociodemographic characteristics of the residents (extrinsic factor).
| Indicator | Ind1 | Ind2 | Ind3 | Ind4 | Ind5 | Ind6 | Ind7 | Ind8 | Ind9 |
|---|---|---|---|---|---|---|---|---|---|
| Place of residence | |||||||||
| Other towns | 14.3% | 11.0% | 62.6% | 84.6% | 80.2% | 56.7% | 36.3% | 74.7% | 80.2% |
| Cagliari | 33.7% | 28.5% | 60.5% | 73.9% | 78.5% | 42.3% | 35.5% | 58.3% | 66.3% |
| χ2 test | 13.595 | 12.279 | 0.145 | 4.747 | 0.14 | 6.355 | 0.021 | 8.698 | 6.876 |
| p-value | 0.000 | 0.000 | 0.704 | 0.029 | 0.714 | 0.012 | 0.885 | 0.003 | 0.009 |
Table 8.
Indicators by the sociodemographic characteristics of the residents (intrinsic factors).
| Characteristic | Ind1 | Ind2 | Ind3 | Ind4 | Ind7 | Ind8 | Ind5 | Ind6 | Ind9 |
|---|---|---|---|---|---|---|---|---|---|
| Gender | |||||||||
| Female | 32.0% | 28.2% | 62.5% | 76.9% | 37.2% | 60.2% | 81.2% | 44.3% | 70.6% |
| Male | 28.8% | 22.2% | 58.4% | 73.7% | 33.3% | 61.7% | 75.3% | 44.8% | 65.4% |
| χ2 test | 0.68 | 2.708 | 1.008 | 0.835 | 0.92 | 0.135 | 2.977 | 0.01 | 1.772 |
| p-value | 0.409 | 0.100 | 0.315 | 0.361 | 0.337 | 0.714 | 0.084 | 0.92 | 0.183 |
| Age | |||||||||
| Young | 11.2% | 9.0% | 51.7% | 76.4% | 25.8% | 55.1% | 75.3% | 40.7% | 61.8% |
| Adult | 30.5% | 25.9% | 60.5% | 76.3% | 37.3% | 62.2% | 80.2% | 48.5% | 70.7% |
| Elderly | 50.5% | 41.8% | 71.4% | 71.4% | 37.4% | 60.4% | 75.8% | 30,0% | 64.8% |
| χ2 test | 32.723 | 25.269 | 7.435 | 1.012 | 4.347 | 1.572 | 1.618 | 10.846 | 3.364 |
| p-value | 0.000 | 0.000 | 0.024 | 0.603 | 0.114 | 0.456 | 0.445 | 0.004 | 0.186 |
| Educational level | |||||||||
| Lower secondary school or less | 32.8% | 28.5% | 55.4% | 71.0% | 43.5% | 53.8% | 72.6% | 28.8% | 61.8% |
| Upper secondary school | 27.2% | 21.7% | 62.7% | 79.0% | 36.6% | 59.8% | 80.0% | 53.3% | 68.5% |
| High school or more | 35.2% | 30.5% | 64.8% | 75.0% | 21.9% | 73.4% | 85.2% | 48.4% | 78.1% |
| χ2 test | 3.193 | 4.544 | 3.585 | 3.903 | 15.763 | 12.566 | 7.633 | 27.7 | 9.329 |
| p-value | 0.203 | 0.103 | 0.167 | 0.142 | 0.000 | 0.002 | 0.022 | 0.000 | 0.009 |
| Work force | |||||||||
| Unemployed | 43.0% | 38.0% | 66.0% | 78.0% | 46.0% | 55.6% | 78,0% | 42,0% | 67.7% |
| Student | 12.0% | 6.0% | 56.6% | 77.1% | 25.3% | 65.8% | 79.5% | 45,0% | 71.8% |
| Retired | 55.8% | 46.5% | 76.7% | 75.6% | 41.9% | 54.8% | 74.4% | 27.1% | 64.3% |
| Employed | 25.1% | 21.6% | 56.1% | 74.3% | 33.1% | 53.5% | 79.9% | 50.2% | 61.6% |
| χ2 test | 49.773 | 45.107 | 13.668 | 1.339 | 11.648 | 7.736 | 1.853 | 16.353 | 4.204 |
| p-value | 0.000 | 0.000 | 0.008 | 0.855 | 0.020 | 0.052 | 0.763 | 0.003 | 0.240 |
| Occupational reliance on tourism | |||||||||
| No | 33.2% | 28.3% | 62.8% | 76.0% | 37.1% | 61.0% | 79.1% | 40.0% | 69.9% |
| Yes | 23.2% | 18.3% | 54.9% | 73.9% | 31.0% | 60.2% | 77.5% | 59.2% | 67.1% |
| χ2 test | 4.999 | 5.553 | 2.787 | 0.248 | 1.743 | 0.008 | 0.172 | 15.937 | 0.114 |
| p-value | 0.025 | 0.018 | 0.095 | 0.616 | 0.187 | 0.931 | 0.678 | 0.000 | 0.735 |
| Total | 30.7% | 25.8% | 60.8% | 75.6% | 35.6% | 60.8% | 78.8% | 44.5% | 68.5% |
Table 9.
Results of the factor analysis of the four items of the seasonal satisfaction referring to the first factor (Global Satisfaction).
Table 9.
Results of the factor analysis of the four items of the seasonal satisfaction referring to the first factor (Global Satisfaction).
| Mean | Standard Deviation | Factor Loading | Eigenvalue | Variance (%) | Cronbach’s alpha | |
|---|---|---|---|---|---|---|
| First factor | 2.816 | 61.584 | 0.858 | |||
| Satisfaction in autumn | 2.79 | 1.147 | 0.964 | |||
| Satisfaction in winter | 2.63 | 1.158 | 0.921 | |||
| Satisfaction in spring | 3.50 | 1.167 | 0.654 | |||
| Satisfaction in summer | 3.88 | 1.148 | 0.447 |
Table 10.
Results of stepwise multiple linear regression model for the global satisfaction (GS) index.
Table 10.
Results of stepwise multiple linear regression model for the global satisfaction (GS) index.
| Variable | Beta | SE | p-Value | Standardized Beta | |
|---|---|---|---|---|---|
| Constant | −0.678 | 0.151 | <0.001 | ||
| Place of residence (reference: other towns) | |||||
| Cagliari | 0.373 | 0.103 | 0.0003 | 0.121 | |
| Work force (reference category: unemployed) | |||||
| Employed | −0.258 | 0.104 | 0.013 | −0.132 | |
| Student | −0.324 | 0.134 | 0.015 | −0.116 | |
| Retired | 0.144 | 0.132 | 0.276 | 0.052 | |
| Benefit for the community (reference category: negative or neutral) | |||||
| Positive | 0.433 | 0.091 | <0.001 | 0.182 | |
| Satisfaction with involvement and influence on the planning and development of tourism (reference category: negative or neutral) | |||||
| Positive | 0.525 | 0.078 | <0.001 | 0.258 | |
| R = 0.409 R2 = 0.167 | D-W = 1.749 | F = 19.34 (df = 6, Sig < 0.001) | |||
Table 11.
Results about the formulated statements.
| Label | Statement | Analysis | Results |
|---|---|---|---|
| Statement 1a | There is a relationship between satisfaction with the effects of tourism and the seasonality | ETIS indicators Ind1–Ind4 | The tourism satisfaction is higher in the high season |
| Global satisfaction index | - | ||
| Statement 1b | The heavy tourism concentration in a destination leads to negative resident attitudes and resident behavior toward tourism. | ETIS indicators Ind1–Ind4 | Cagliari’s tourism satisfaction is higher in autumn and in winter, but the satisfaction with tourism in “other towns” is greater in summer |
| Global satisfaction index (GSI) | The GSI results are significantly higher for Cagliari | ||
| Statement 2a | The overall attitude of residents toward tourism could be a function of certain sociodemographic characteristics. | ETIS indicators Ind1–Ind4 | Age: Elderly people are more satisfied (from autumn to spring) |
| Work force: Retired and unemployed residents’ are more satisfied (from autumn to spring) | |||
| Global satisfaction index | Work force: Retired residents’ are more satisfied | ||
| Statement 2b | The attitude of residents toward tourism is a function of the economic dependency of the residents on tourism. | ETIS indicators Ind1–Ind4 | Occupational reliance on tourism: residents without occupational reliance on tourism are more satisfied |
| Global satisfaction index | Occupational reliance on tourism: no significant difference | ||
| Statement 2c | Individuals tolerate any downside effects of tourism they might experience personally because they recognize the broader community-wide benefits of this activity. | ETIS indicators Ind1–Ind4 | - |
| Global satisfaction index | Satisfaction with the planning and development of tourism: residents more satisfied in the planning and development of tourism are the more satisfied with tourism | ||
| Statement 2d | The attitudes of residents toward tourism is a function of the perceived benefit of the residents (e.g., personal benefits and community benefits). | ETIS indicators Ind1–Ind4 | - |
| Global satisfaction index | Benefit to the community: residents recognizing benefits are more satisfied |
© 2019 by the authors. Licensee MDPI, Basel, Switzerland. This article is an open access article distributed under the terms and conditions of the Creative Commons Attribution (CC BY) license (http://creativecommons.org/licenses/by/4.0/).
Share and Cite
MDPI and ACS Style
Foroni, I.; Modica, P.; Zenga, M. Residents’ Satisfaction with Tourism and the European Tourism Indicator System in South Sardinia. Sustainability 2019, 11, 2243. https://doi.org/10.3390/su11082243
AMA Style
Foroni I, Modica P, Zenga M. Residents’ Satisfaction with Tourism and the European Tourism Indicator System in South Sardinia. Sustainability. 2019; 11(8):2243. https://doi.org/10.3390/su11082243
Chicago/Turabian StyleForoni, Ilaria, Patrizia Modica, and Mariangela Zenga. 2019. "Residents’ Satisfaction with Tourism and the European Tourism Indicator System in South Sardinia" Sustainability 11, no. 8: 2243. https://doi.org/10.3390/su11082243
Note that from the first issue of 2016, this journal uses article numbers instead of page numbers. See further details here.