Article

Economic Evaluation and Simulation for the Hasselt Case Study: Thermochemical District Network Technology vs. Alternative Technologies for Heating

Architectural Engineering, Katholieke Universiteit Leuven, Kasteelpark Arenberg 1-box 2431, 3001 Leuven, Belgium
*
Author to whom correspondence should be addressed.
These authors contributed equally to this work.
Energies 2019, 12(7), 1260; https://doi.org/10.3390/en12071260
Submission received: 31 January 2019 / Revised: 26 March 2019 / Accepted: 28 March 2019 / Published: 2 April 2019

Abstract

:
Thermochemical-technology has high potential for utilizing surplus heat from industrial processes and renewables. This paper examines the economic potential and thermochemical-technology behavior at a network level. The city of Hasselt (Belgium), was chosen as a case study for technology application due to its typical mid-European urban structure. An integrated heating system was proposed which transports energy potential from available surplus-heat sources to the demand side over long distances by a thermochemical-district-heating network, which serves for building heating with heat-pump assistance. A dynamic simulation model of the thermochemical-technology was developed using the experiments and Hasselt data to determine the technology’s energy performance. To examine the technology’s feasibility in the context of a large district energy network, an economic and environmental evaluation of the thermochemical-technology was performed. To compare key economic parameters between our integrated technology and other heating systems a sensitivity analysis to identify favorable market-conditions for wider deployment of the proposed technology was performed. The simulations indicated a 72% reduction of heat-pump heating energy usage as a benefit of the thermochemical system. Network pumping-energy and thermochemical-fluid mass were found via simulation to be 80 kWh and 300 tons, respectively. In comparison to domestic-gas-boilers, the proposed technology shows 95% lower carbon emissions, however at 37% higher annualized cost.

1. Introduction

Nowadays, there are many ways to heat buildings, such as boiler systems or heat pump systems. On the other hand, conventional water-based district heating networks (DH) are also used for heating, using combined heat and power (CHP) plants or nearby available excess heat sources around the city to heat the water and transport it over short distances to the demand side for space heating in buildings [1]. One benefit of using DH is the reduction of pollutant and thermal emissions in the city area by removing the combustion heating systems on the demand side, as presented by Ancons [2]. Furthermore, DH allows the reduction of primary energy consumption at a lower cost [3].
Desiccant solutions have thermochemical (TC) hygroscopic properties that store heat in the form of latent heat potential [4], which is then released once it absorbs the air humidity. Thus, our research proposes to use a thermochemical fluid (TCF) as a heat potential carrier in district heating networks in order to store the latent heat or transport it over long distances without experiencing heat losses [5]. In such a manner, limitations concerning long-distance transport of excess heat potential from supply to demand centers through district networks can be overcome. In this study, we propose to use an integrated heating system by transporting available low-temperature excess heat, below 60 °C to temperatures lower than 40 °C, by means of a TC district heating network to the demand side for space heating in buildings with the assistance of an existing heating system such as a heat pump.
A case study in the Belgian city of Hasselt is performed using the integrated TC district heating network. The objectives of this case study are as follows:
(1)
To explore the technical potential and economic feasibility of the proposed integrated TCF system in a real-life scenario; meaning that we need to investigate a theoretical system rollout in a city/district for heating purposes using actual information about heat demand, city layout, and building characteristics.
(2)
To present potential economic and environmental benefits from the rollout of our integrated TCF system in comparison with other alternative heating technologies.
(3)
To investigate under which scenario(s) or market conditions sustainable technologies (such as integrated TCF systems) can be economically viable.
To perform the study, a coupled approach using simulation tools and economic analyses is employed. Exchange of results and information between the two distinctive approaches (simulations and economics) was inevitable in order to achieve a full analysis of the case study. Section 2 introduces a large-scale multi-level simulation approach, using the object-oriented language “Modelica” [6], of the integrated TC district heating network for a district of Hasselt to assess the supplied heat energy of both the TC heating system and the heat-pump heating system. Moreover, the total TCF mass for the integrated TC district network and pumping energy are determined, as presented in Section 4, where simulation results are shown. Section 3 introduces data collection and manipulation, which is then used to evaluate economic and environmental potential of the integrated TC district heating network against alternative heating systems. Results of the economic study are presented in Section 5. Exchange of results between the two sub-studies was essential in that information about buildings characteristics (as a result of data collection manipulation) was passed to the Modelica simulation part, whereas information about the integrated TCF system description in terms of components and sizing was passed to the economic evaluation part; leading to closely coupled sub-studies that can achieve the main objectives of the case study as a whole.

2. Thermochemical (TC) District Network Simulation

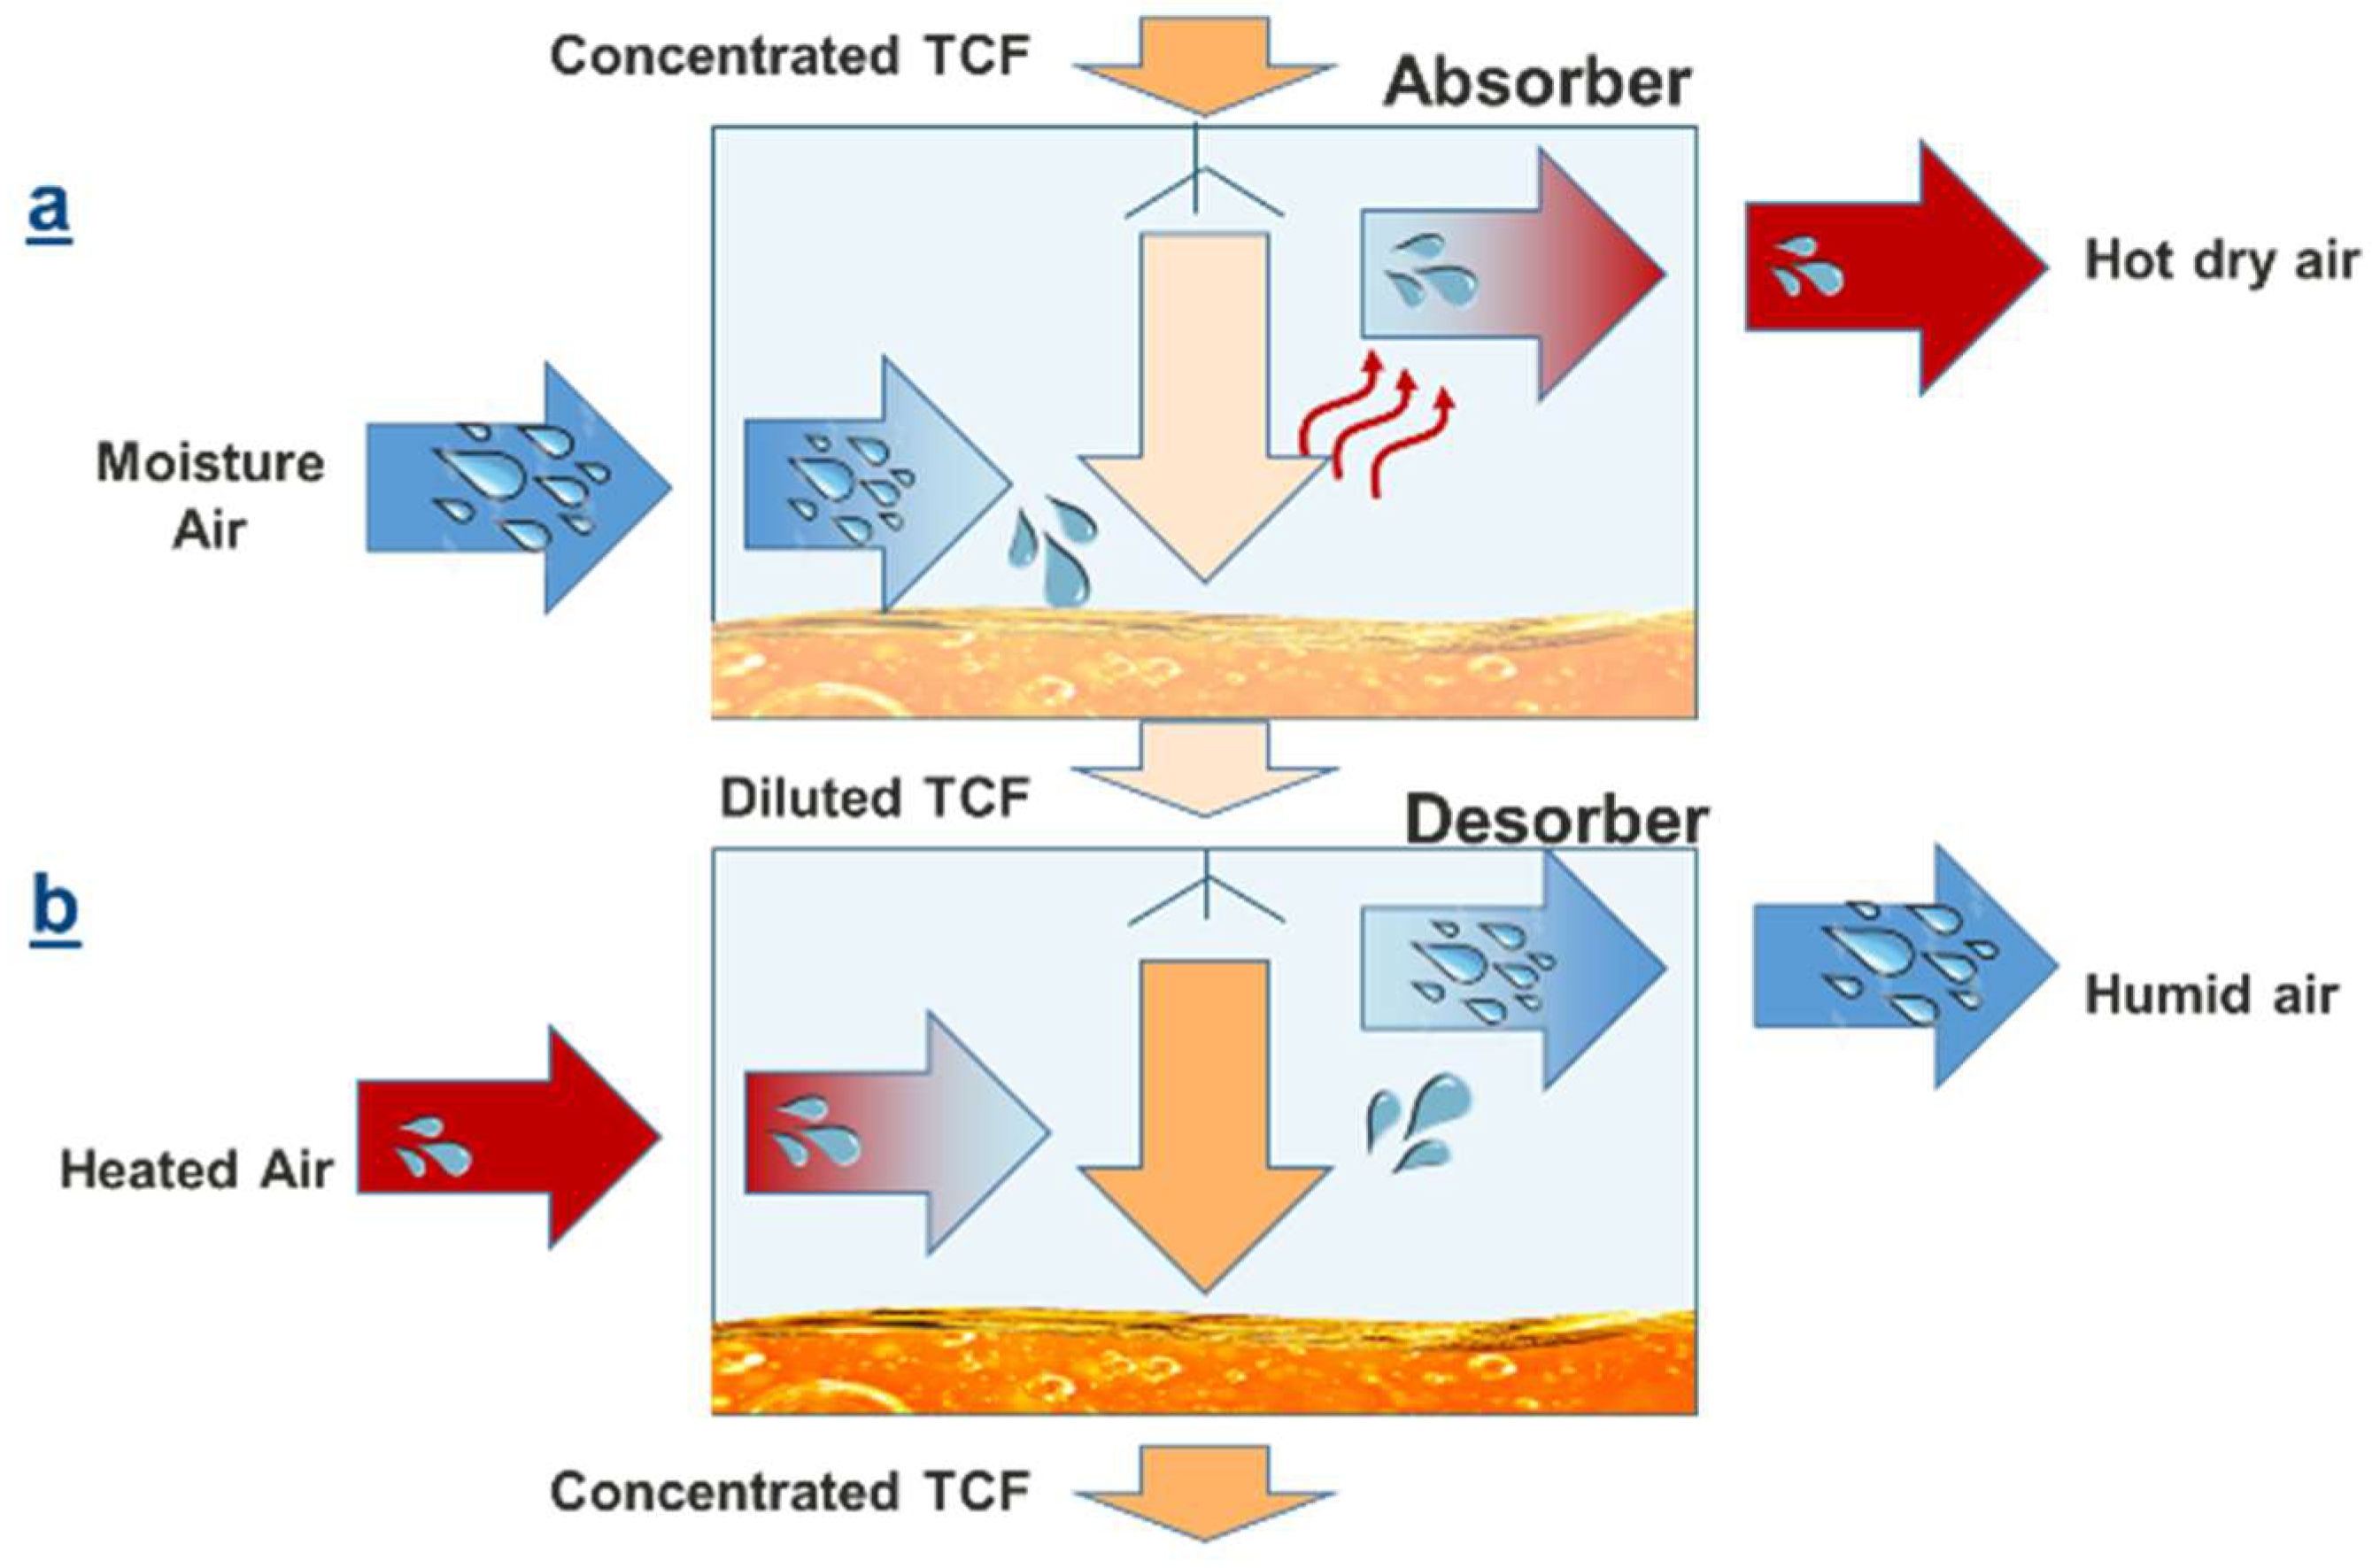
2.1. Integrated TC Technology and Process

TCFs are desiccant salt solutions that have physical and thermochemical properties such as concentration and equilibrium humidity. Furthermore, they also have the properties of normal fluids, such as density, viscosity, enthalpy, i.e., thermal capacity. These latter fluid properties are written as functions of temperature and concentration. LiCl and MgCl2 are used as candidates in TC district heating and cooling networks. Both TCFs have similar equilibrium characteristics, therefore, both of them can be used for the simulation model given by [7] (Figure 1). In Modelica, however, the LiCl model used has a similar heat capacity to MgCl2 albeit at a lower concentration.
The main TC process consists of two processes—the absorption and desorption processes—as shown in Figure 2a [8]. The absorption process takes place once the humid air comes into contact with the concentrated hygroscopic TCF, if the air humidity is higher than the equilibrium level. As a result, the TCF absorbs the humidity to reach the equilibrium level in the ideal case. The phase change from water vapor to water releases latent heat of about 2300 kJ per kg water. The outcomes of this process are hot dried air and diluted TCF. The heat transfer between the air and TCF depends on the flows, conductivities, thermal capacities, and initial conditions of both the air and TCF.
As shown in Figure 2b, the desorption process takes place once the dry air comes into contact with the diluted TCF, when the relative air humidity is lower than the equilibrium level. As a result, the TCF desorbs the humidity to reach the equilibrium state and takes in the heat during the phase change from water to water vapor. The products of this process are humid warm air and concentrated TCF.

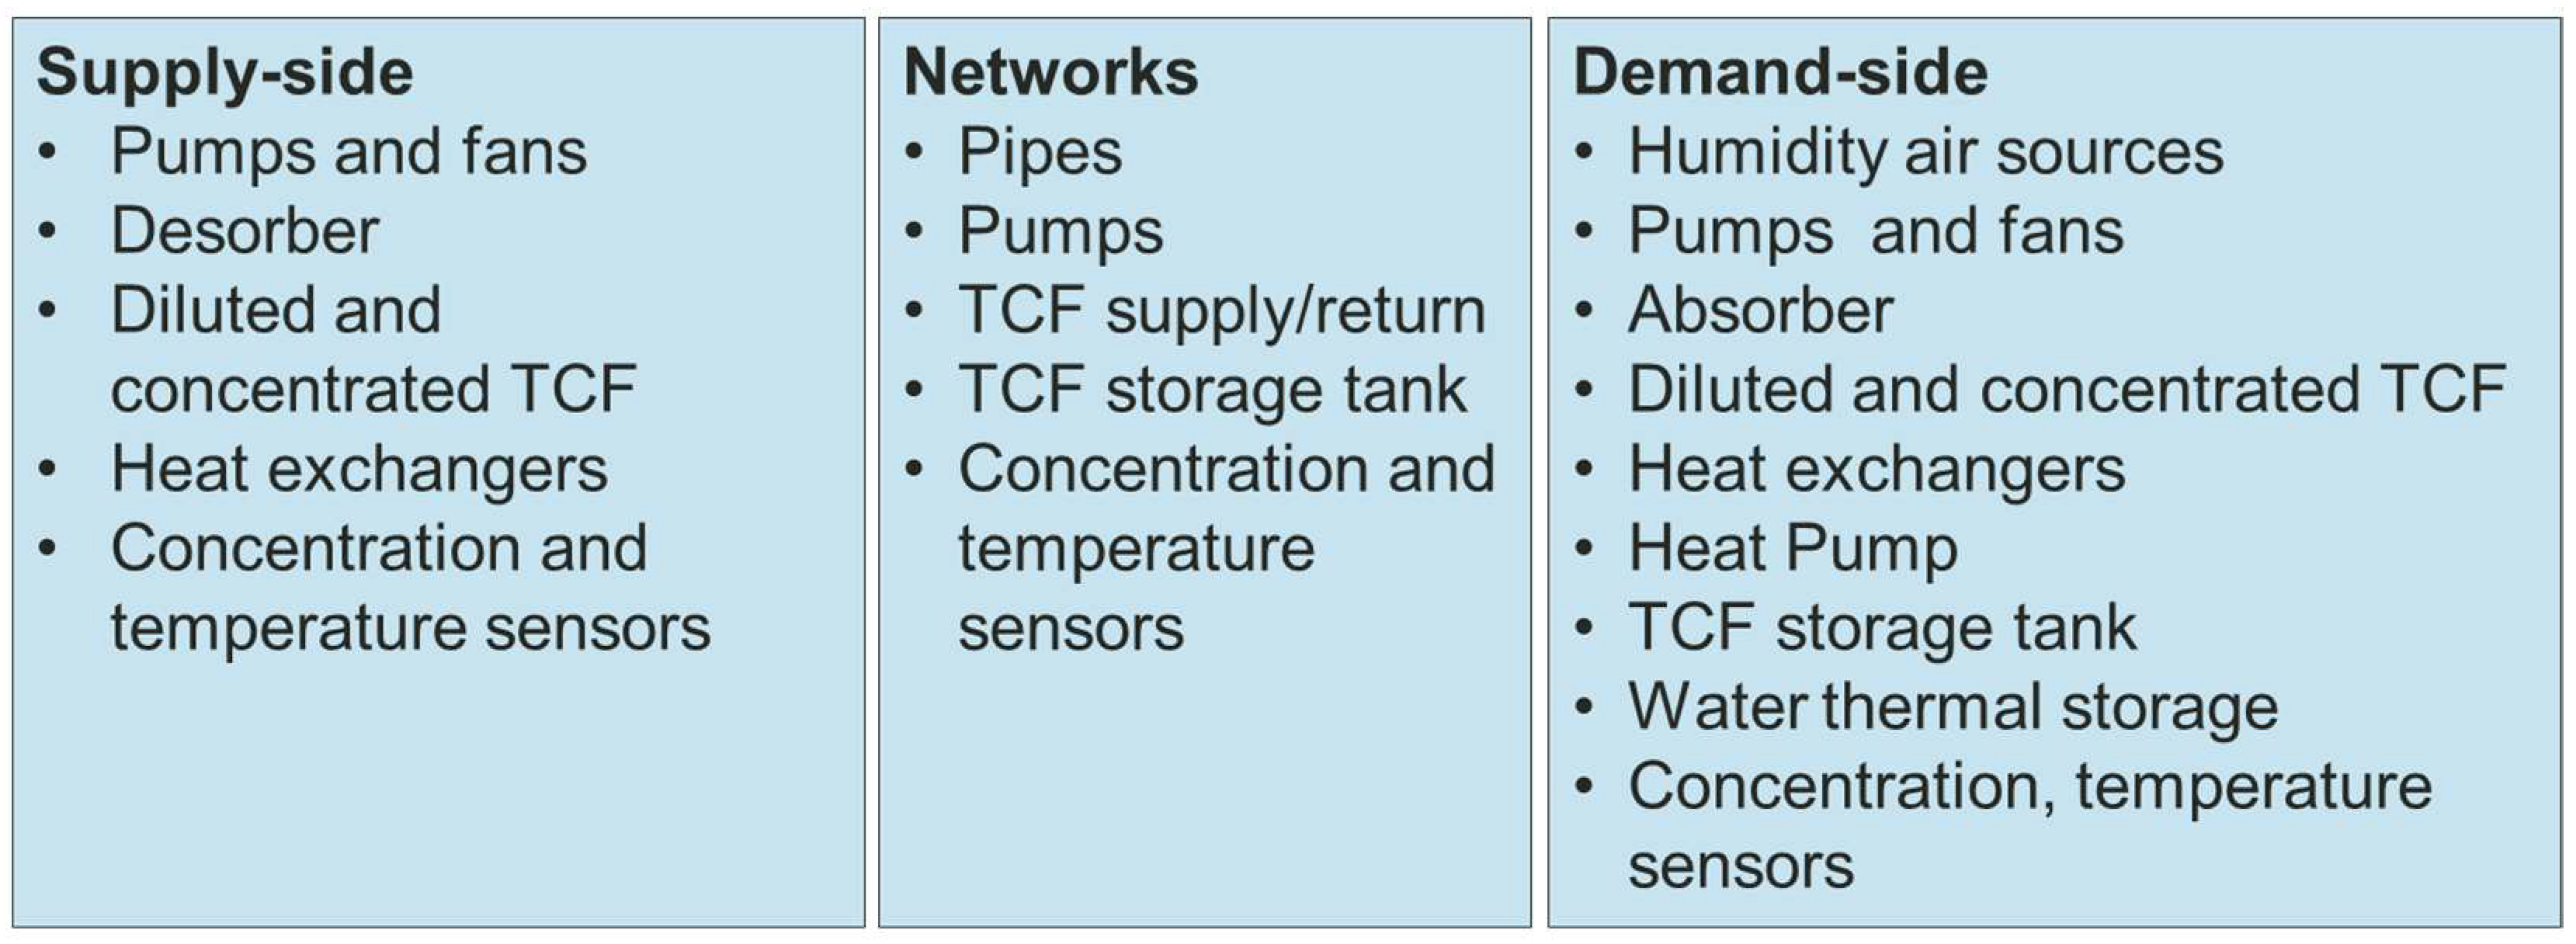
2.2. System Description

The system consists of several components that ensure the provision of heat to the buildings. The main components of the system are as follows:
Absorber: A device that provides an exchange surface between the TCF and the air to perform the absorption process [9].
Concentrated/Diluted TCF: The TCFs exploit the hygroscopic properties of a salt solution as a function of temperature and concentration for the absorption of the humidity from the air to reach the equilibrium of its vapor pressure with the incoming air.
TCF tank: A small tank that can resist corrosion. It is about 0.5 m3 in volume. The aim of using this tank is to ensure the reuse of the TCF until the concentration becomes diluted and useless. Moreover, it can be used as direct heat exchanger as it forms a closed cycle with the absorber.
Heat pump: A device that transfers heat energy from a low-temperature zone to a higher-temperature zone by absorbing heat from a cold space and releasing it to a warmer one. In this case, the main interaction between the heat pump and the building is by the water thermal storage tank.
Water thermal storage: This storage acts as buffer. It is a tank of water, which is well insulated to keep the water warm for as long as possible.
Fan/pump: Both fan and pump are required to move the TCF and air, respectively, though the absorber, and afterward to the pipe network or ducts. The maximum pump power in this case is around 0.55 kW, flow 1.5 kg/s, total head is 23 m.
Water-TCF/Water-Air/Air-Air Heat exchangers: In this study, an air-air heat exchanger is used to recover the warm air from the building outlet to preheat the outdoor incoming air before entering the absorber. The water-TCF and water-air heat exchangers are used to preheat the TCF or to heat up the fresh air entering the building.
Humid air source: This source provides humid air for the absorption process at the demand side. As the absorption process transports heat from this source to the building, this source is also the local heat source. It can be a greenhouse, a humid-air solar collector, or another device that evaporates water based on low-temperature local heat.
Concentration, thermostat sensors: These sensors are used to monitor the concentration or the temperature of the fluid to give a feedback to the controller.
Pipes: The pipes are not insulated, as the heat is stored in the TCF as latent heat. Therefore, there are no heat losses. The diameter of the pipes is small because the amount of TCF transported is relatively small.

2.2.1. Integrated Space Heating System

The initial design of the TC space heating system was presented by Geyer et al. [8]. In this work, the integrated TC heating system was developed as a dynamic system. Some components were added to the system to increase its efficiency. The main reason is that, for severe conditions, the TC heating system is not sufficient to meet the building’s heat demand—for example, when the heating system is initiated after a long rest or when there is a need to pre-heat the incoming TCF from the network to reach the running conditions of the TC heating system, especially during peak periods. Therefore, to overcome this problem, an integrated heating system is proposed which combines the thermochemical absorption process with storage and heat pump. The system mostly aims to exploit the thermochemical process and reduce heat pump usage as much as possible.
As show in Figure 3, the integrated system has three streams. First, the TCF stream (TCF cycle) contains Supply and Return TCF from the network, TCF Storage tank, and Water–TCF heat exchanger. The TCF comes from the network to the TCF local tank, where it will be used by the absorption process until it becomes diluted. Then, it is evacuated to the network to reconcentrate it in the heat source side. Second, the air stream (air cycle) contains Humid air source, Air–Air heat exchanger, Water–Air heat exchanger, and Building. Both streams meet in the absorber. The humid air comes from a constant humid air source to the absorber, where it releases the heat to be used with the fresh air to heat the building. Then, the warm humid air is recovered to preheat the incoming humid air. Third, the water stream (water cycle) contains Water–Water heat pump, Water thermal storage tank, and Heat exchangers. The water is heated by the heat pump and is stored in the thermal storage to be used to preheat the incoming TCF from the network and the fresh air if it is needed. An example of the component variable values of the simulation results at time t are presented in Figure 3.

2.2.2. Integrated TC District Heating Network

The integrated TC district heating network system contains three parts, which have several components. As shown in Figure 4, the left side is the supply side, the right side is the demand side, and in the middle is the pipe network and TCF storage, which transports TCF from a heat source to TCF storage and then to the buildings. The main advantage of using a TC district pipe network is the possibility of transporting the excess heat and hygroscopic properties for long distances from the supply to demand sides without heat losses, where a large amount of excess heat is available far away from the demand side and is not invested at a low temperature below 50 °C.

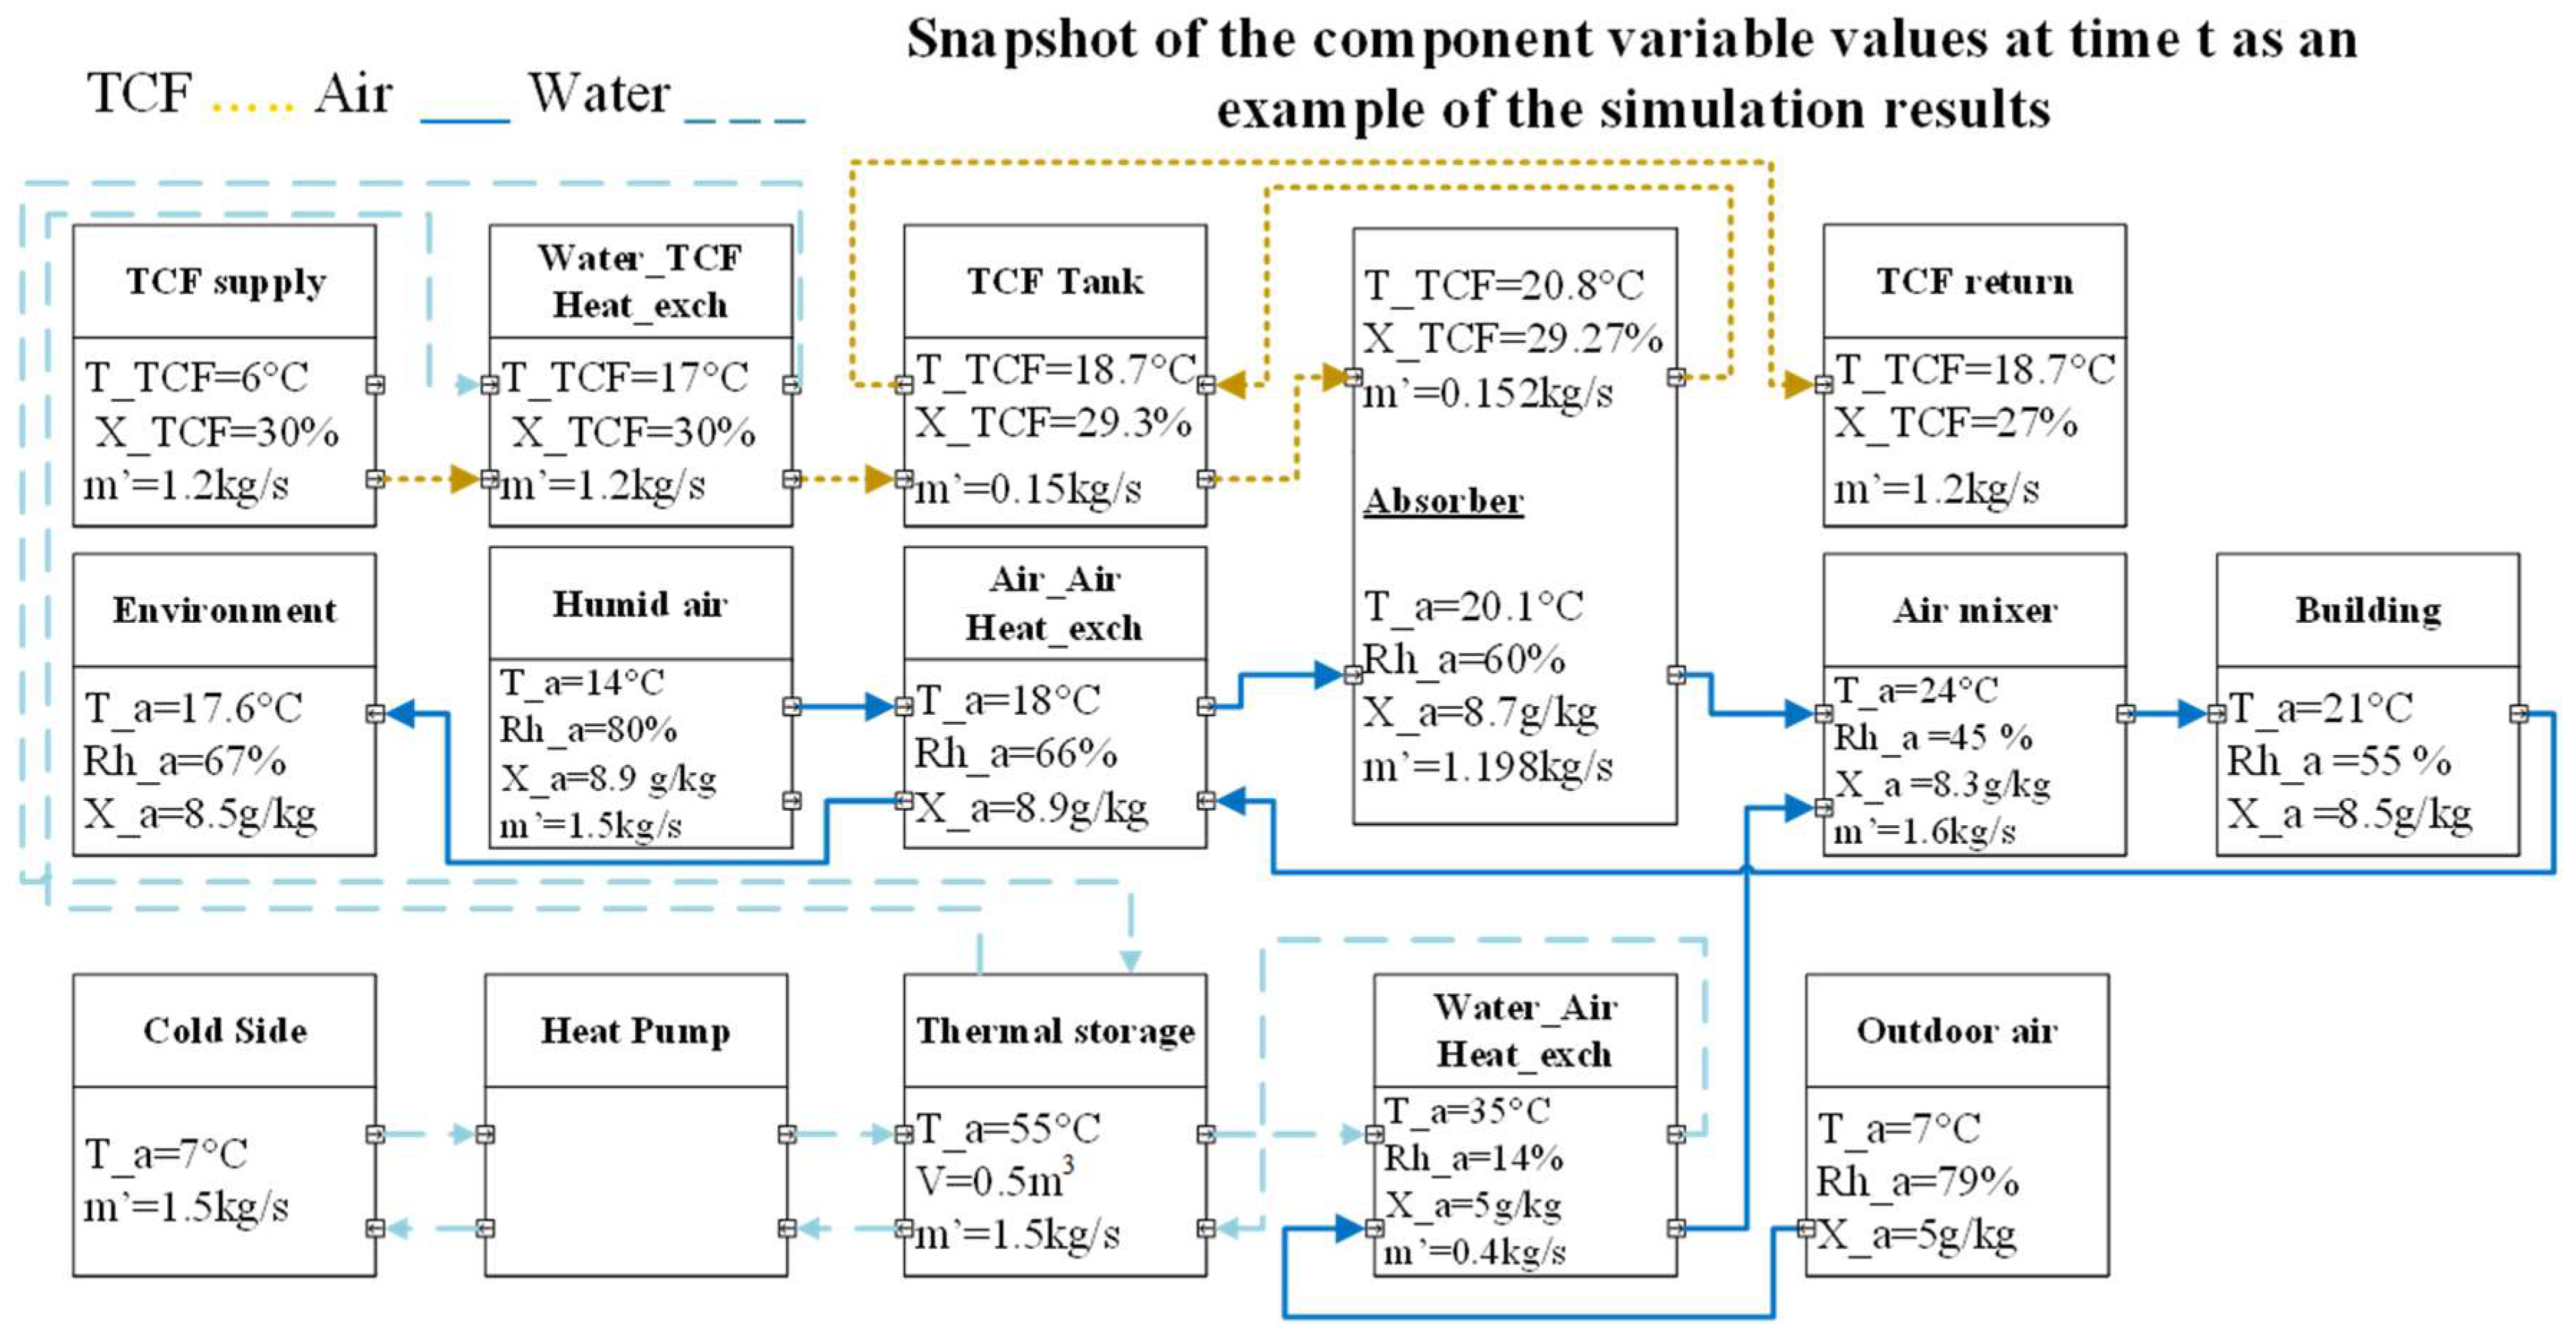
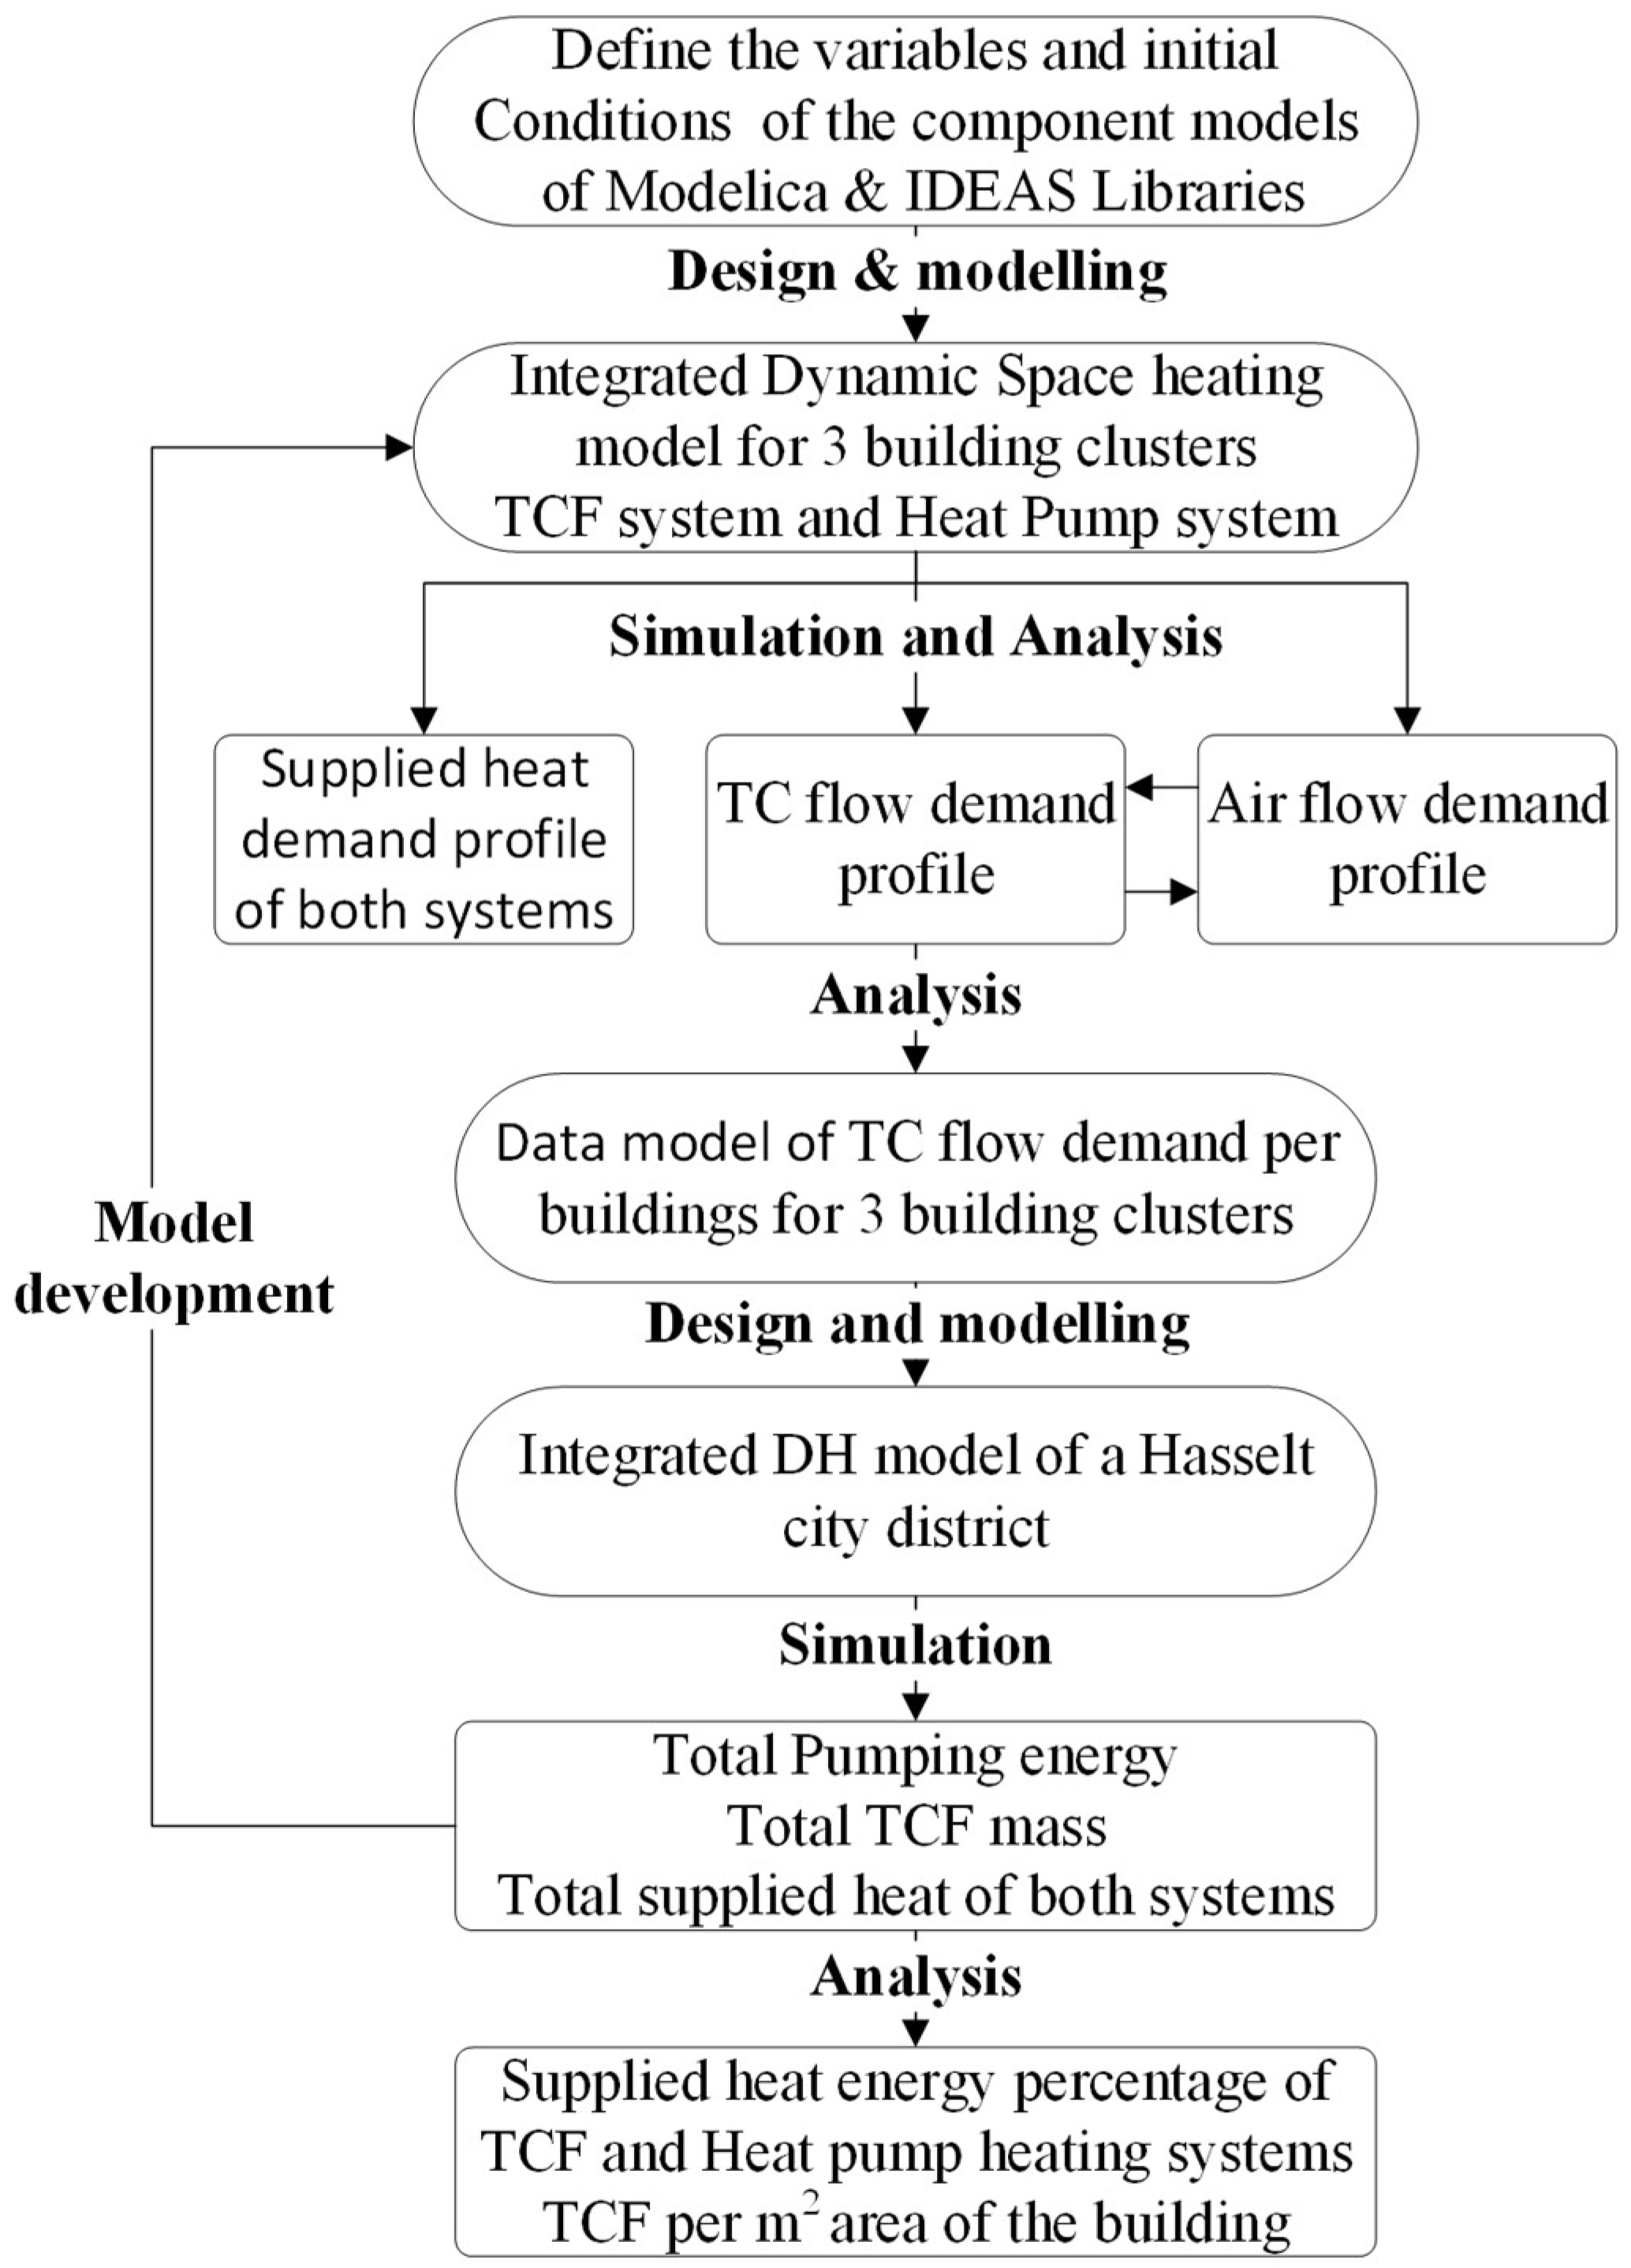
2.3. Modeling and Simulation of the Integrated Heating System

The simulation model is based on integrating both the TC heating system and heat-pump heating system into one model. The heat pump works as an auxiliary heating system of the TC heating system in case of peak heating load and pre-heating of the incoming TCF from the network. The models and sub-models are developed using Modelica [6] and the IDEAS library [10], which are used for dynamic simulations as they are flexible and able to use multi-domain modeling. Figure 5 shows the integrated heating system. The TC heating system consists of both air and TCF cycle operation modes, as shown in the yellow box in Figure 5.

2.4. Network Simulation Approach

The Hasselt district in this work contains 12 buildings. This district was chosen for the simulation as it represents a typical urban structure setting with different buildings. These buildings are clustered according to typical building performance. The clusters represent the whole city’s building stock. This avoids modeling and simulating the whole building stocks, which might take a few days.

Identified Representative Clusters

The clustering approach aimed at identifying clusters of buildings based on their specific heat demand, which is the heat demand per square meter during the heating period. This clustering focused on reflecting three levels of heat demand, low, medium, and high. Clustering results are explained in detail in Section 5.1. By using the provided Geographic Information System (GIS) data on Hasselt buildings, the insulation types of these buildings were predicted using the Modelica integrated TC heating system model simulation
Figure 6 presents the modeling and simulation approach steps of the integrated TC district heating network of the Hasselt district based on these clustering results. The first step is modeling and simulating the integrated TC heating system of the three building clusters using Modelica; the outcome of this simulation is the heat supplied to the buildings. As a result, the TCF mass flow profiles of these three building clusters can be defined. Finally, a data model of the mass flow profile of these three building clusters is extracted from simulation results of the integrated TC heating system of the three building clusters to be used in the integrated TC district network buildings model to obtain the total TCF demand and total pumping energy.

3. Economic Evaluation for the Hasselt Case Study

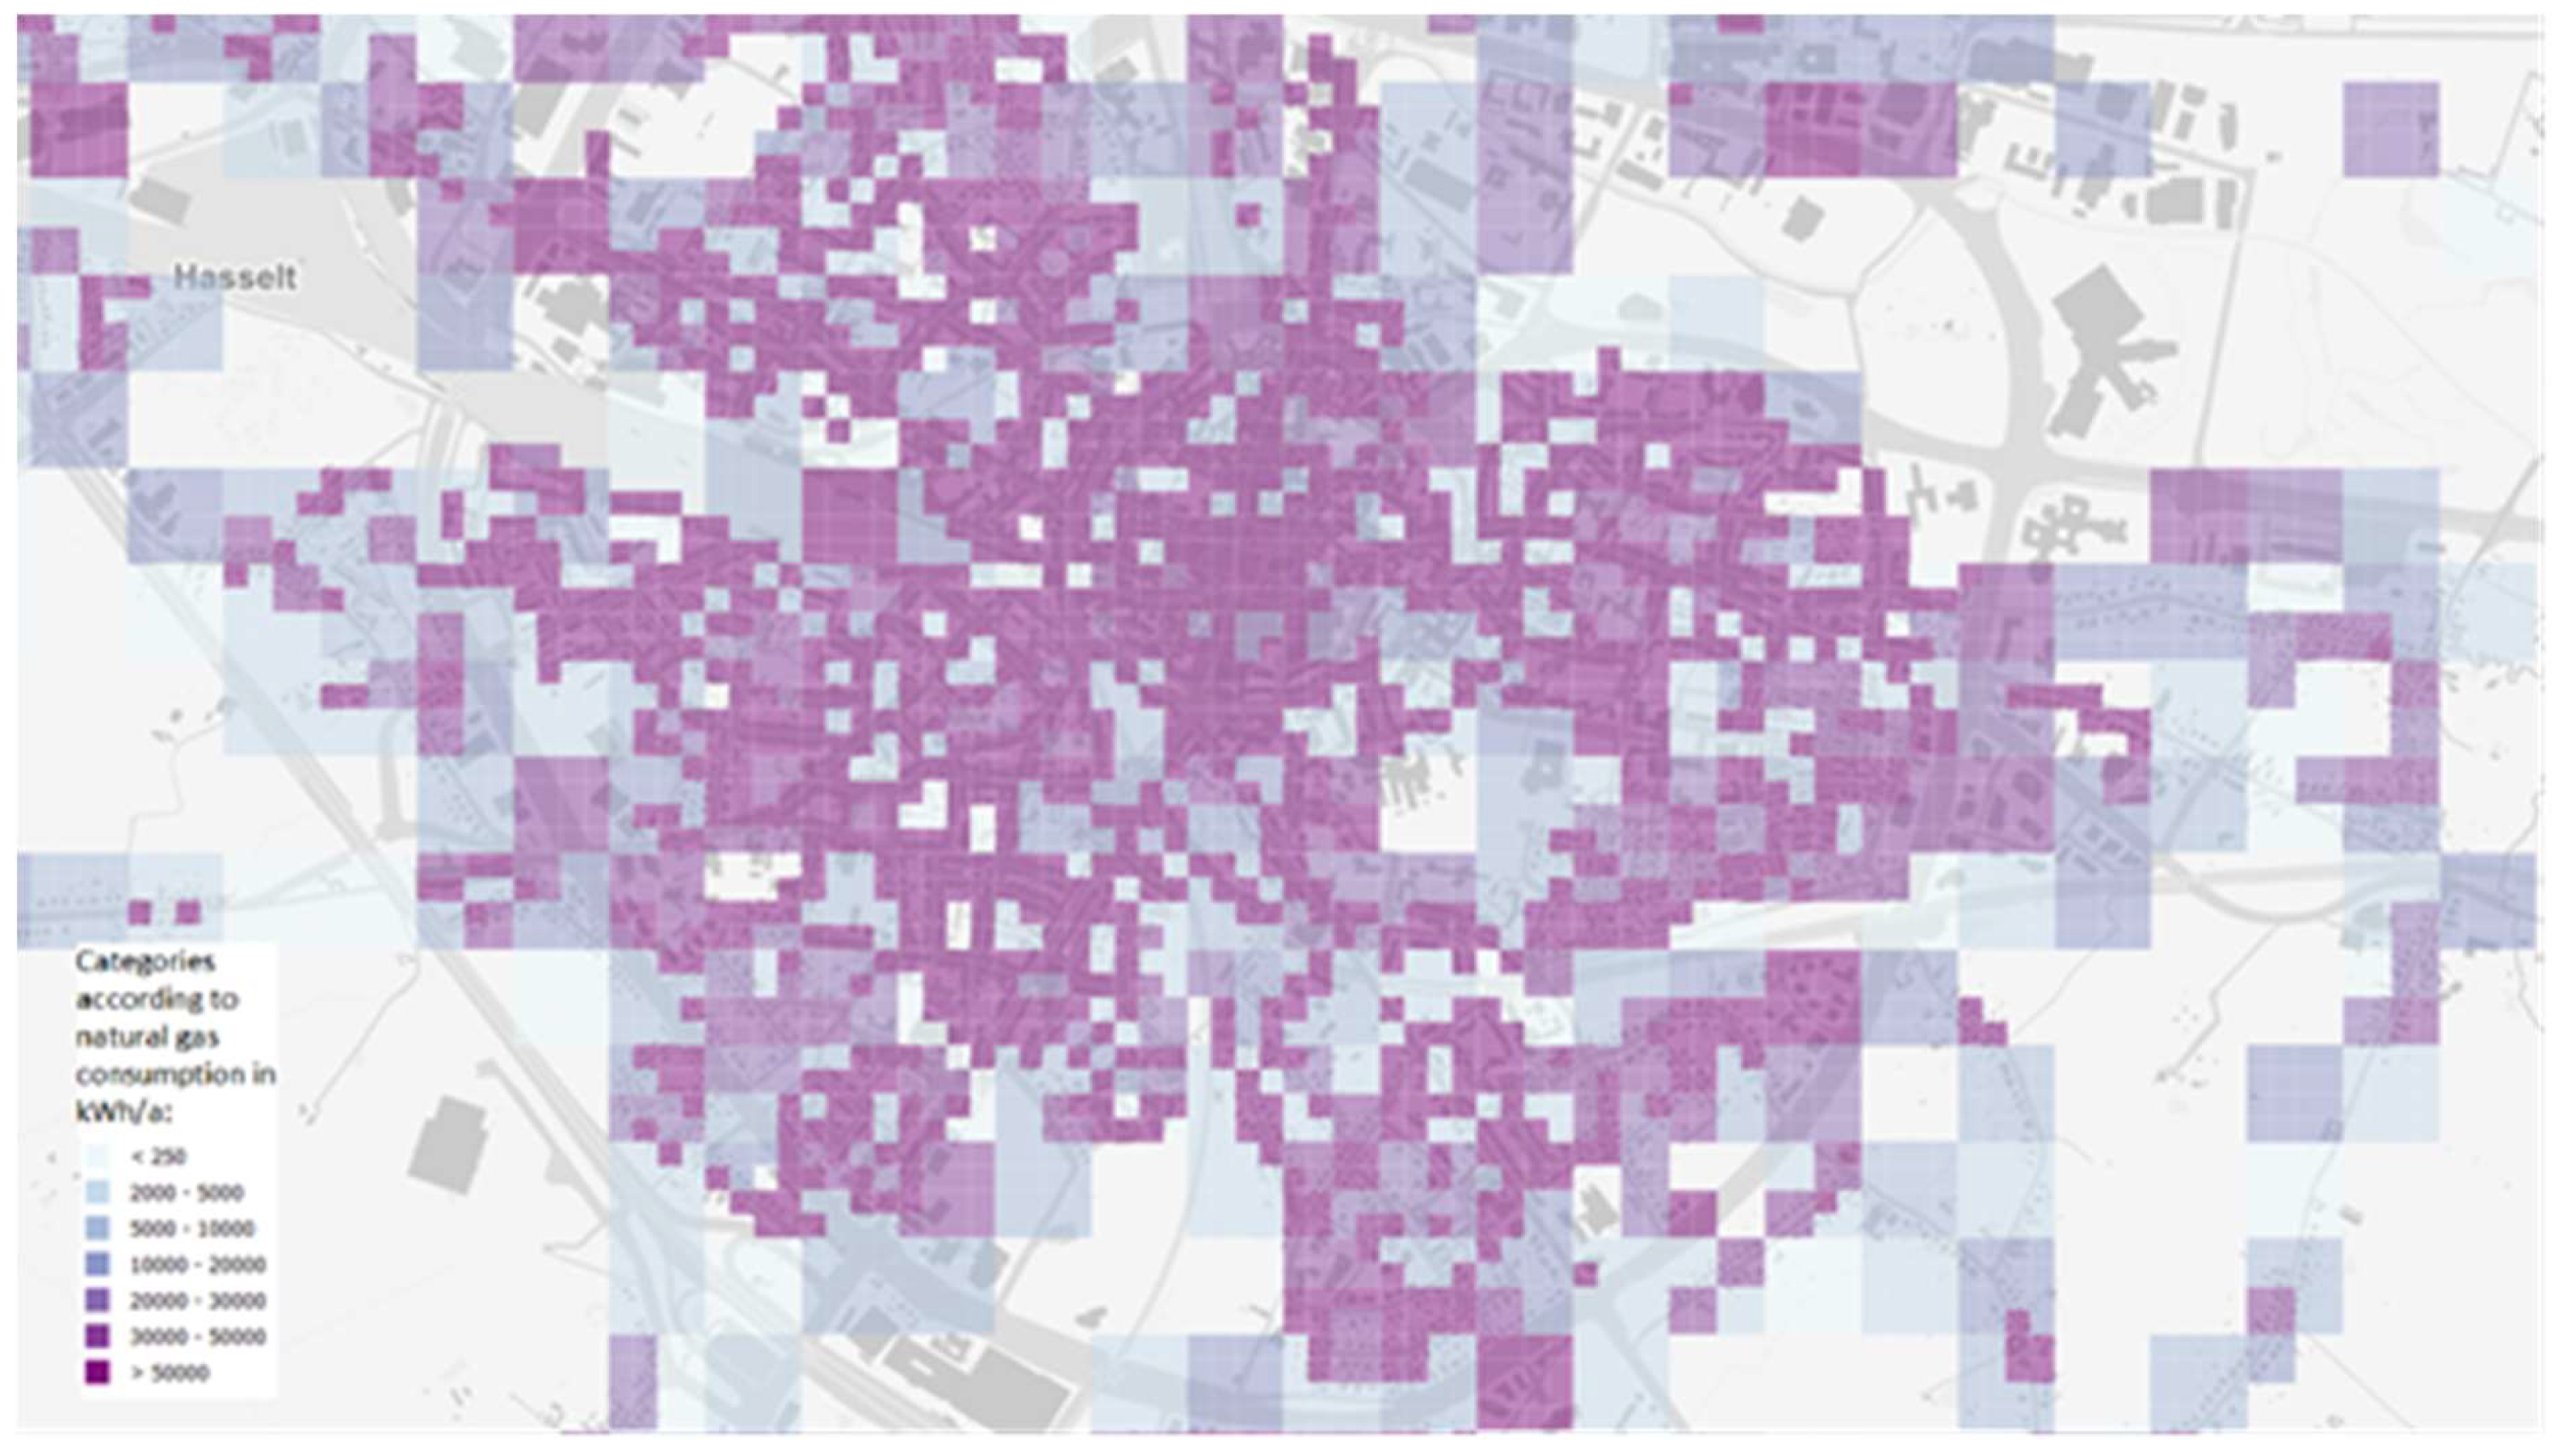
3.1. Introduction to the Case Study

In order to construct an economic evaluation of the TCF integrated system and compare it to other alternative heating technologies, the Belgian city of Hasselt, located in Southeastern Flanders, was chosen as the location for a case study. With a population of around 70,000 inhabitants, Hasselt can be categorized as a medium-sized town [11]. According to the atlas of the Heat Roadmap Europe Project, PETA 4.3 [12], the Hasselt region is classified as a ‘high energy-synergy region’, indicating high levels of both excess heat and heat demand. More specifically, PETA 4.3 estimates a combined excess heat and heat demand potential of higher than 10 PJ/a (4.2 TWh/a) [13]. Excess heat sources in the vicinity of Hasselt vary between industrial, power plant, and waste-to-energy heat sources, located within 20 km of the city center.
Another interesting excess heat source for TCF technology implementation in Hasselt is the Aurubis plant in Olen, a copper manufacturer and recycler. Located approximately 50 km from Hasselt, near the Albert waterway canal (which also runs through the municipality of Hasselt), Aurubis represents a low-grade excess heat source that can be exploited in a district heating network. Excess heat results from either copper slag pots at 1400 °C [14] or from cooling towers where heat rejection from anodes to cooling water occurs. By installing new technical solutions in the plant, this excess heat can be recuperated and transferred to the TCF for regeneration purposes. The realization of this process should prove the potential of TCF technology for the long-distance transport of excess heat.
Naturally, linking those excess heat sources to the demand in Hasselt within this study requires further information about heat demand in the city, as well as characteristics of buildings. For determining the heat demand, data about natural gas (NG) consumption in the municipality of Hasselt was obtained from Infrax, the distribution system operator (DSO) for NG in the municipality. The data obtained are for NG consumption by buildings on a yearly basis, but are aggregated to 50 × 50 m cells; i.e., the ‘kWh/a’ figures represent the aggregated consumption for all buildings within each cell. Figure 7 shows a snapshot of the provided GIS data by Infrax for NG consumption over 50 × 50 m grid cells in Hasselt.
Furthermore, datasets about building characteristics were obtained from the Agency for Geographical Information Flanders. These GIS datasets provided attribute data about building characteristics were obtained from the Agency for Geographical Information Flanders [15]. These GIS datasets provided attribute data about:
(1)
Buildings footprints;
(2)
Roof structure height;
(3)
Building type according to its typology (main structure, side- or annex-building, cooling tower, silo, etc.).
The datasets included a total of 53,885 buildings of all types. In order to realize the objectives of the case study as stipulated in Section 1, and looking at the available datasets for the study, it becomes clear that some data manipulations along with a few assumptions are necessary. In particular, heat demand information for individual buildings is not directly available. Furthermore, datasets about building characteristics do not give a full description of each building. Hence, some assumptions are required to approximate the characteristics of buildings in order to estimate their behavior in terms of heat and TCF demand (at least on average).

3.2. Methodology for the Economic Evaluation

This section details the methods employed to conduct economic evaluation and comparisons between different heating technologies as well as favorable market conditions for TCF system rollout. The chosen heating technologies for economic and environmental comparison are:
(1)
Water-based conventional district heating technology;
(2)
Standalone air-source heat-pump systems;
(3)
Individual domestic gas boilers.
To perform the assessment and comparison between these systems, the following key performance indicators (KPIs) were considered:
(1)
Annualized project cost (in M€/a), based on calculations of upfront capital expenditures (CAPEX) and operating expenditures (OPEX);
(2)
Energy consumption (in GWh/a), which is either direct primary energy consumption in the case of domestic gas boilers, or electrical energy consumption for the other technologies considered;
(3)
CO2 emissions (in tCO2/a), another variable for environmental impact assessment;
(4)
Long-distance transport of excess heat capability, as a comparison parameter between TC and conventional water-based networks, quantified in the form of maximum distance (in km) a transmission pipeline of the heat carrier can travel.
Further details about the KPIs, their relevance to the evaluation, and their calculations methods will follow in the next subsections. Firstly, the general assumptions used to perform the economic evaluation and KPIs are displayed in Section 3.2.1. This is followed by three subsections (Section 3.2.2, Section 3.2.3 and Section 3.2.4), each addressing one part of the proposed TCF heating network in Hasselt—namely, demand side, supply side, and distribution network. Finally, Section 3.2.5 briefly discusses the building data clustering (data covering the demand side) that was performed to facilitate the modeling of different building stocks in Modelica and illustrate the technical feasibility of our TCF technology proposal to satisfy different buildings types and heat demand levels.

3.2.1. General Assumptions

This subsection describes the general assumptions and simplifications used to perform the economic analysis and comparisons between heating technologies, including our proposed TCF integrated system. Lifetime estimations for each technology were assumed as follows [3,16]:
(1)
Water-based district heating technology: 25 years for system life;
(2)
Individual domestic gas boilers: 20 years, with an overall system efficiency of 80%;
(3)
Standalone heat pumps: 18 years (as an average between different sources indicating 15 to 20 years lifetime), with the requirement to replace the compressor once during its lifetime, adding a capital cost of 40%. The chosen model had an average COP of 3.3;
(4)
TCF integrated system: 25 years of lifetime, with the requirement to replace the absorber after 10 to 15 years, along with distribution network pumps (stainless steel) due to corrosion limitations following recommendations from specialized project partners.
In order to obtain a meaningful comparison between different technologies having different lifetime expectations, an annualized project costing approach was applied; using CAPEX and OPEX. Annualized costs encompassed all incurred costs on the consumer side, distribution network, and supply side. The following assumptions and input data were used:
(1)
A discount rate of 5% was used in order to calculate the capital recovery factor that applies to the initial capital investment.
(2)
CAPEX as well as OPEX were calculated for each technology using current market conditions. One exception to this was assuming that the Emissions Trading System (ETS) in the European Union (EU) also applied to the residential district. This meant that household emissions from space heating activities as well as those from district networks pumping were internalized in the cost calculations, using current ETS allowance price. CAPEX and OPEX were regarded as important factors that both investors and consumers alike pay attention to when considering new technologies to adopt. The focus in this study was more from an investor point of view, and thus the costs for systems covering the building stock in the city as a whole were evaluated.
(3)
Yearly CO2 emissions and primary and electrical energy consumption – where applicable – were all identified for the evaluation. Yearly CO2 emissions (in tCO2/a) produced from electrical energy use in integrated heating network, conventional water-based DH, and standalone heat pump systems were calculated per each according to statistics published by the European Environment Agency regarding CO2 emissions from each member state’s energy mix (in gCO2/kWh) [17]. Domestic gas boilers on the other hand were represented through primary energy consumption of NG and the related CO2 emissions related to the combustion process. Calculations for emissions and energy consumption as KPIs form the basis upon which the different systems are assessed regarding their environmental impact [17]. Domestic gas boilers on the other hand were represented through primary energy consumption of NG and the related CO2 emissions related to the combustion process. Calculations for emissions and energy consumption as KPIs form the basis upon which the different systems are assessed regarding their environmental impact.
(4)
CAPEX calculations for the heating technologies incorporated the demand side’s in-house integrated system components’ prices and installation costs. For TC systems this included piping and fittings, air ducts, fans, absorbers, greenhouses or solar thermal collectors that serve as humid air sources, heat pumps, and insulated water storage. For the three other systems this comprised piping and fittings, radiators, and where applicable gas boilers, heat pumps, or substations. For district heating systems, transmission costs either through transmission pipelines or shipping transportation were also calculated, as well as desorbers (for TC system) or heat exchangers (for water DH) costs installed at the supply source. More details on excess heat transmission from supply side follow in Section 3.2.3. CAPEX also incorporated network costs for the district heating systems, including distribution piping and pumps, for which the methodology is elaborated on in Section 3.2.4.
(5)
OPEX calculations comprised running costs for electrical energy consumption for heat pumps, fans and pumping power within buildings, as well as the NG price for boiler systems. Running costs also incorporated pumping power costs for the district networks, and the excess heat price (in €c/kWh) for the heat supplier. Additionally, the hypothetical CO2 price was applied to all electrical energy consumed through heating systems components, or that associated with NG consumption for domestic boilers. Finally, maintenance activities for the in-house heating systems as well as distribution networks maintenance requirements were considered, and their specific estimations can be consulted in Appendix A.
(6)
A 100% market reach within the specified sample of 13,864 buildings identified for all the technologies was assumed.
As will be further illustrated in Section 3.2.5, cluster groups of buildings were identified from the building datasets. These clusters were fed into Modelica models which in turn identified the optimal sizing of the TCF integrated system, including optimal heat load distribution between heat pump and TCF heating system within the integrated system, for each building cluster. Values describing system components and their sizing from Modelica models were fed back into the economic study for calculation of capital cost of these components and their operating costs when applicable.
Finally, a sensitivity analysis was performed to identify favorable market conditions for better economic competitiveness of the integrated heating networks against the established domestic gas boiler systems. The analysis used NG price and electricity tariff for households as the variables to determine associated changes on the annualized cost as an outcome. This was done to recognize necessary market and/or regulatory shifts needed for larger deployment of less-carbon intensive space heating technologies.

3.2.2. Demand Side

As mentioned previously, GIS data was obtained for aggregated gas consumption (in kWh/a) over 50 × 50 m cells. In order to obtain individual gas consumption for each building, gas consumption data was combined with building characteristics data that describe individual footprints, roof structure height, and building type. Each cell’s aggregate consumption value was distributed among buildings within that cell. Using a MATLAB code, this distribution was done in proportion to the share of each building’s footprint to the total building footprint within the cell.
Since the datasets did not give a detailed description of building types and characteristics, some assumptions were made. The dataset differentiated between four building types: main building, side building/annex, water tower, and silo. Gas consumption values were distributed only within buildings of the type ‘Main’, since other building types were considered to consume no NG for heating purposes (e.g., detached garages, storage areas, annex-buildings, etc.). Subsequently, analysis focused only on buildings within footprint thresholds of 40 m2 and 140 m2. This corresponded to the average surface area values for residential buildings reported in the energy consumption survey for Belgian households [18]. The selected sample within footprint thresholds satisfied two goals: to limit the analysis to typical residential buildings in Flanders (corresponding to values found in EU’s statistical office EUROSTAT report over Belgian households [18]), and to eliminate possible errors in buildings dataset (many buildings of the type ‘Main’ were reported to have footprints as small as 20 m2). Eventually, a total of 13,864 buildings were identified as the focus of the economic study.

3.2.3. Supply Side and Excess Heat Transmission

TCF Integrated System

Since a navigable waterway exists between the excess heat source in Olen and the demand center in Hasselt, it is suggested to use container shipping transport between these two points instead of a transmission pipeline. In such a manner, a transmission pipeline would be limited to only 2 km between Aurubis and the shipping loading point, as opposed to a 50 km pipeline between Aurubis and Hasselt.

Water-based District Heating

Conventional thermal district heating technology is an important alternative for utilizing excess heat for space heating. An important parameter in comparing between the two different district heating technologies is the possibility for the long-distance transport of excess heat from supply to demand centers. Since the TCF technology depends on heat transport in the form of latent heat there is almost no technological limitation on the transport distance of the TCF. However, this is not the case for water-based systems with thermal losses. Hence, it is important to examine the maximum critical distance for heat transport using water to reach the inlet of distribution network within the city at a minimum threshold temperature of 70 °C. Assuming an above-ground polyurethane-foam-insulated pipeline, the following formula was used to calculate critical distance (Lcr) for heat transport [3]: Assuming an above-ground polyurethane-foam-insulated pipeline, the following formula was used to calculate critical distance (Lcr) for heat transport:
L c r = P h l ln ( D d ) 2   λ i   π   ( t t a )
where Phl (in W) is the total heat loss for Lcr (in m), D and d are the insulation outer diameter and insulation inner diameter (in m), respectively, λi is insulation heat conductivity (in W/m·K), t and ta are warm fluid temperature inside the pipe and ambient cold temperature (in °C), respectively. The diameters D and d and temperatures t and ta were given, and thus solving for Lcr requires knowledge of the heat loss Phl, which was calculated from the equation:
P h l = C p   w ( t i t f )
where Cp is water specific heat (in J/kg·K), w is the required mass flow rate of warm water (in kg/s) to satisfy the network’s heat demand, ti is the warm water temperature (in K) at the exit of surplus heat source, i.e., at the start of transmission pipeline from heat source, while tf is the same as ta, being the water temperature at the beginning of the distribution network (end of transmission pipeline, in K). Designing for worst-case scenario, a peak factor of 67% was applied to the seasonally-averaged heat demand of an average Hasselt household within the city, while also assuming simultaneous occurrence of this demand from all the buildings considered. The required water flow rate from these calculations was found to be 120 L/h, and thus the total flow rate w required for the whole city was found by multiplying this number by the total number of buildings considered. This design choice allowed for proper selection of pipelines diameters and pumps, that can satisfy the worst-case flow rate without excessive flow pressure losses. Finally, Lcr was found by combining Equations (1) and (2).

3.2.4. Distribution Network

This subsection covers the network design employed for calculating the costs and environmental impact of TCF technology. Differences between TC network and water-based DH network can be summarized as in two main points:
  • All pipelines and piping of TC networks were non-insulated polyvinyl chloride (PVC) pipes, while water networks utilized carbon steel pipes with polyurethane foam insulation. Cost estimations of piping and pipelines in €/m-trench (i.e., including material and installing costs) were provided by our project partner ThermaFlex.
  • TC networks required stainless pumps for corrosion concerns as recommended by project partner ThermaFlex, while this was not a requirement for water-based networks.
  • Due to the penetration of heat pump operation within TC integrated heating systems, as well as the higher heat density of TCF compared to water as an energy carrier, higher flow rates were encountered in water-based networks. This entailed utilizing larger piping diameters, pumps of higher capacity and higher pumping energy in water-based networks in comparison to TC networks.
The distribution network was broadly classified into two categories: primary network and secondary network. The primary network encompassed the main pipelines starting from the port of Hasselt (where TCF shipments are delivered through the waterway) and laid around the city’s ring in what can be called a ‘ring structure’ [11]. From this ring structure were branched other pipelines delivering TCF to neighborhoods and suburbs surrounding the city ring. Volume flow rates were calculated for each pipeline serving a neighborhood based on the required heat demand and TCF energy density (transported heat potential). For pipeline sizing, diameters were chosen in a manner to limit flow velocity below 1.4 m/s, thus minimizing operation costs for pumping, while concurrently suiting the pump choice that can deliver the required flow rate without introducing large energy losses in the form of unexploited flow head.
The secondary network encompassed all the piping within smaller neighborhoods for sub-distribution to and between individual buildings. Due to the complex nature required for such a design, especially with the large number of buildings considered and the urban sprawl, a detailed design was not carried out. Instead, two districts were chosen from the city and a detailed piping design was performed for each. One district represented a high-demand area, with a specific annual heat demand of 42 GWh/km2. The other represented the low-demand areas, with a specific demand of 1.7 GWh/km2. After estimating costs for each district, the secondary distribution network’s capital expenditures (CAPEX) and operating expenditures (OPEX) for the whole city were calculated as a scaled-up value from the two cost estimations. From the high-demand district estimations we obtained a scaled-up figure for high-demand areas in Hasselt. The scaling-up parameter was the heat demand share of the chosen district as a percentage of the total demand of high-demand areas in Hasselt. The same was performed for the areas with low energy density, with the scaling parameter as the ground footprint of the chosen district as a percentage of this area in Hasselt. The threshold for distinguishing between high- and low-demand dense areas was assumed as 2 GWh/km2.
The distinction between high-demand and low-demand areas also served the sub-objective of exploring TC integrated system economic potential in relation to heat demand density. In conventional water-based DH, a typical range of 40–50 GWh/km2 is set as the threshold for economic feasibility of new projects [3,11]. It would be interesting to explore if TC networks abide by such threshold range and if there exists areas for economic advantage in this regard.

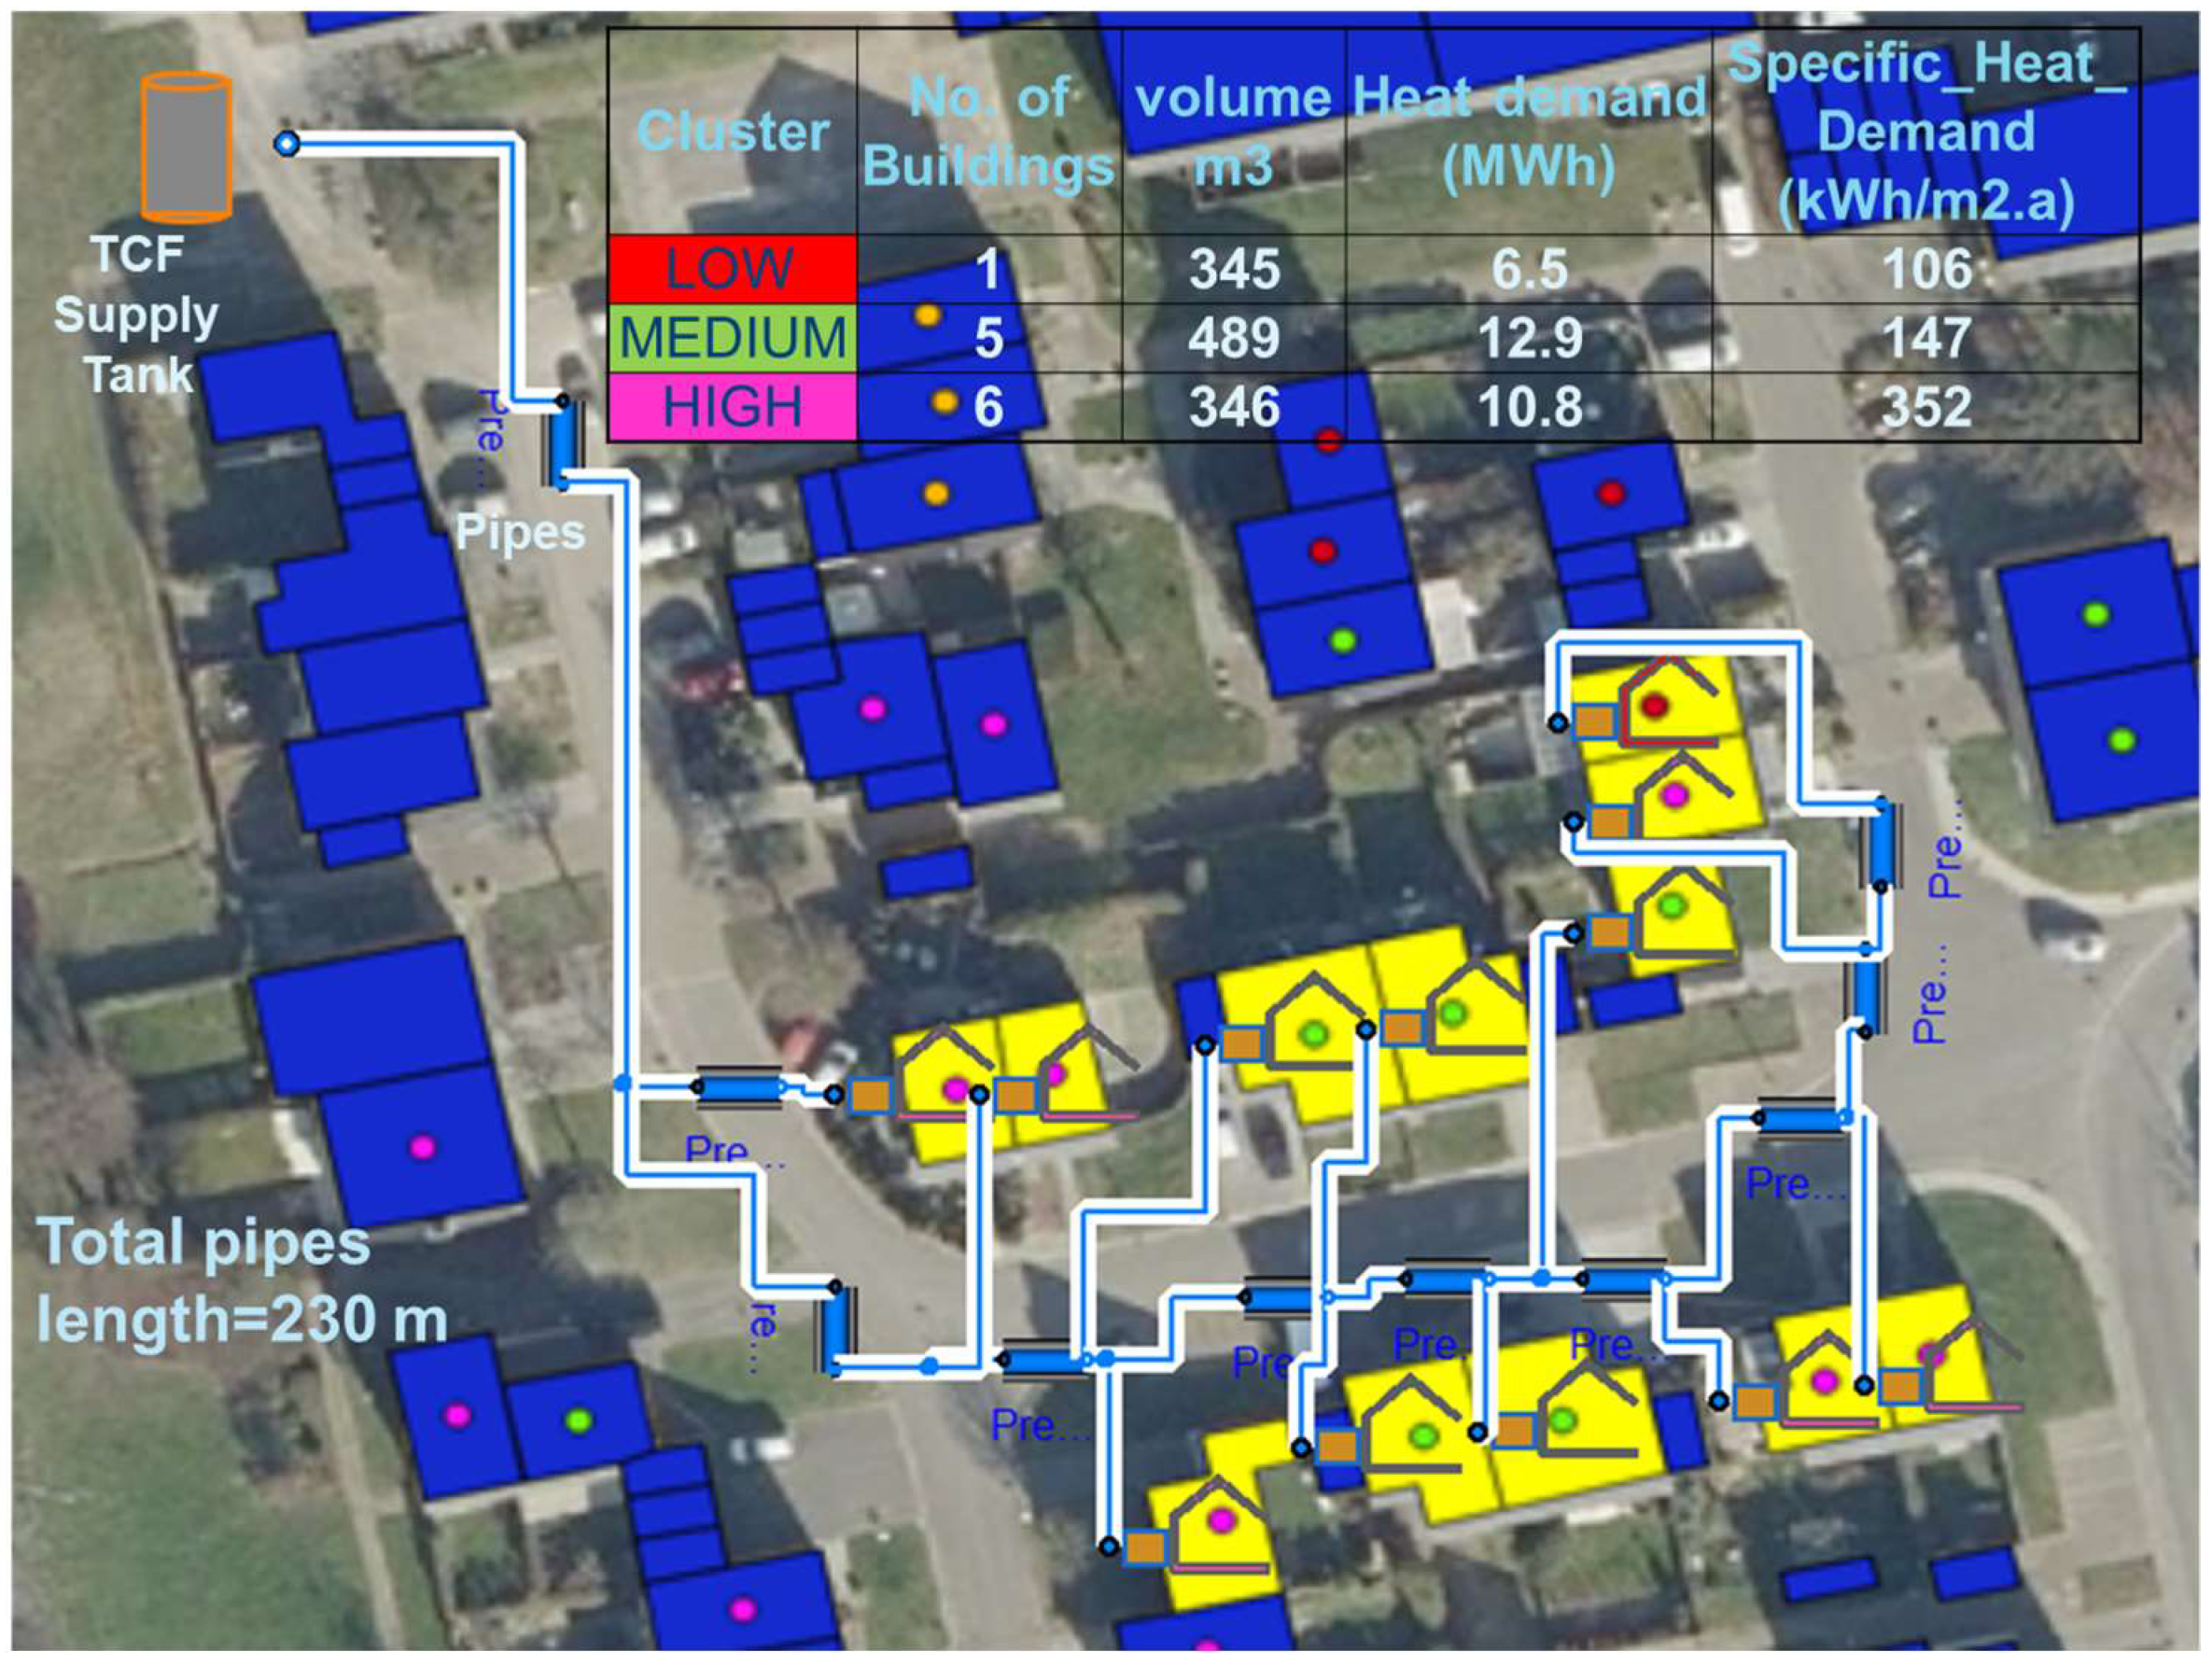
3.2.5. Building Clustering

As mentioned earlier, another objective of the case study was to examine the technical feasibility of our TCF integrated system for different building configurations and heat demand levels. This investigation was achieved through Modelica simulations to estimate sizing for system components and prove the technical viability of the system as a whole. Since the identified 13,864 buildings had significantly varying characteristics and demand levels, grouping of these buildings was a necessary step. A k-means clustering process was performed on the building datasets to identify main building clusters that each represent at least 5% of the 13,864 buildings sample. To achieve this, we identified the energy performance rating (EPR) in kWh/m2a as the grouping parameter, since it encompassed both building heat demand and size, reflecting how well a building is insulated and its occupants’ behaviour. It should be noted that the effectively heated surface area of each building was assumed to be half of the building’s total surface area. This 50% reduction follows the findings of a survey of the energy consumption of Belgian households in [18].
Three clusters of buildings were identified, reflecting three levels of heat demand: low, medium, and high. Buildings characteristic data were fed into Modelica to construct the most representative building model for each cluster, including suitable system sizing that optimizes absorber and heat pump operation within the integrated system. Subsequently, when Modelica models for each cluster were built, in-house system components sizing (affecting CAPEX) and performance parameters (affecting OPEX) were imported from Modelica into the economic study. The factors that were crucial in differentiating the building clusters were TCF heat density (in kWh/t), heat load distribution between heat pump and absorber within the integrated system (in percentage), and heat pump maximum capacity (in kW).
Such factors were also necessary for distribution network design, as the TCF heat density, combined with heat load distribution between the heat pump and absorber, defined the TCF flow rate required for each building within each cluster. As the city was divided into sectors for designing primary distribution network, the required total TCF flow rate for each sector was calculated following the number of buildings of each cluster within the sector. For example, one sector’s heat demand was 49.8 GWh/a, divided between 1,297 building of the low, 2,030 of the medium-, and 785 of the high-demand cluster, all of which were spread over the whole sector. The clustering approach in combination with Modelica models for each cluster group helped determine the flow rates required for each building group, which were then summed to determine total TCF flow rate required for the whole sector. Subsequently, an optimized choice for the main pipeline diameter and pump model was done in relation to CAPEX cost for the pipe material and installation cost and flow pressure losses. An example of buildings clusters will follow in Section 4, where simulation results for a chosen district are displayed, while the main results of clustering will follow in Subsection.

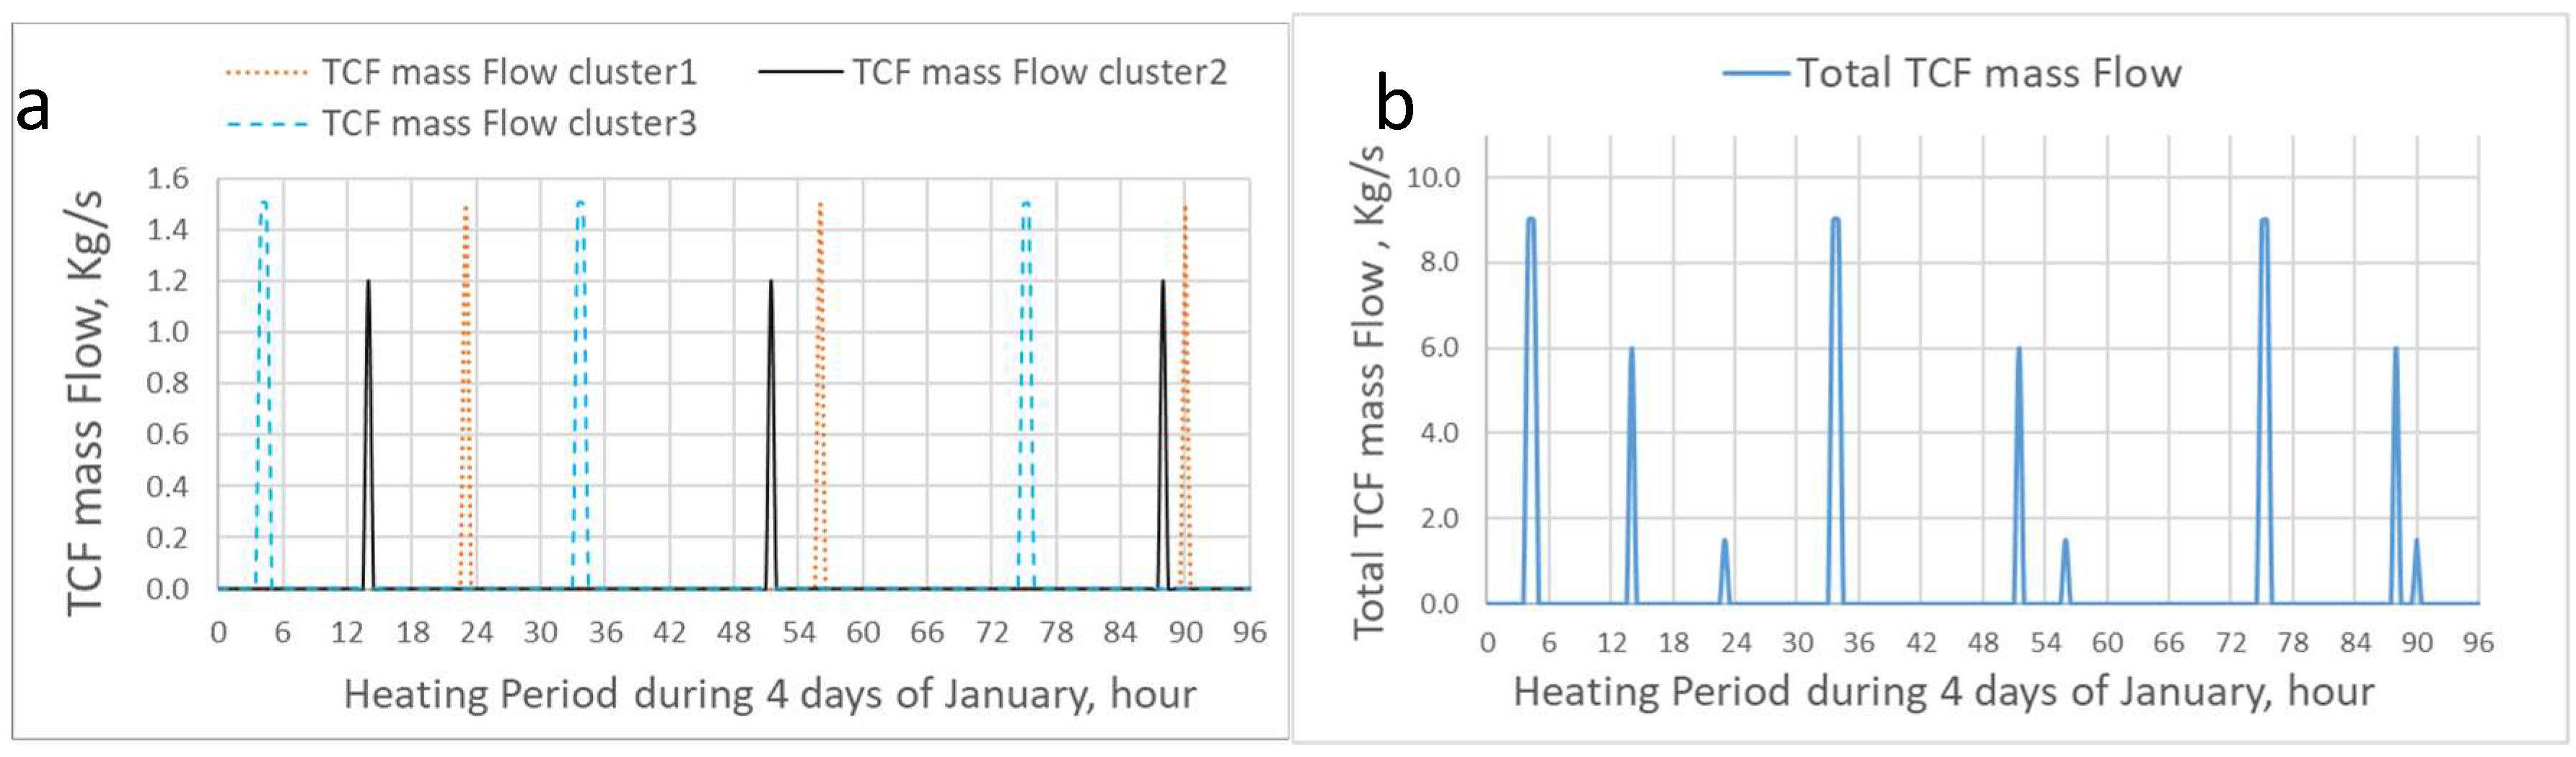
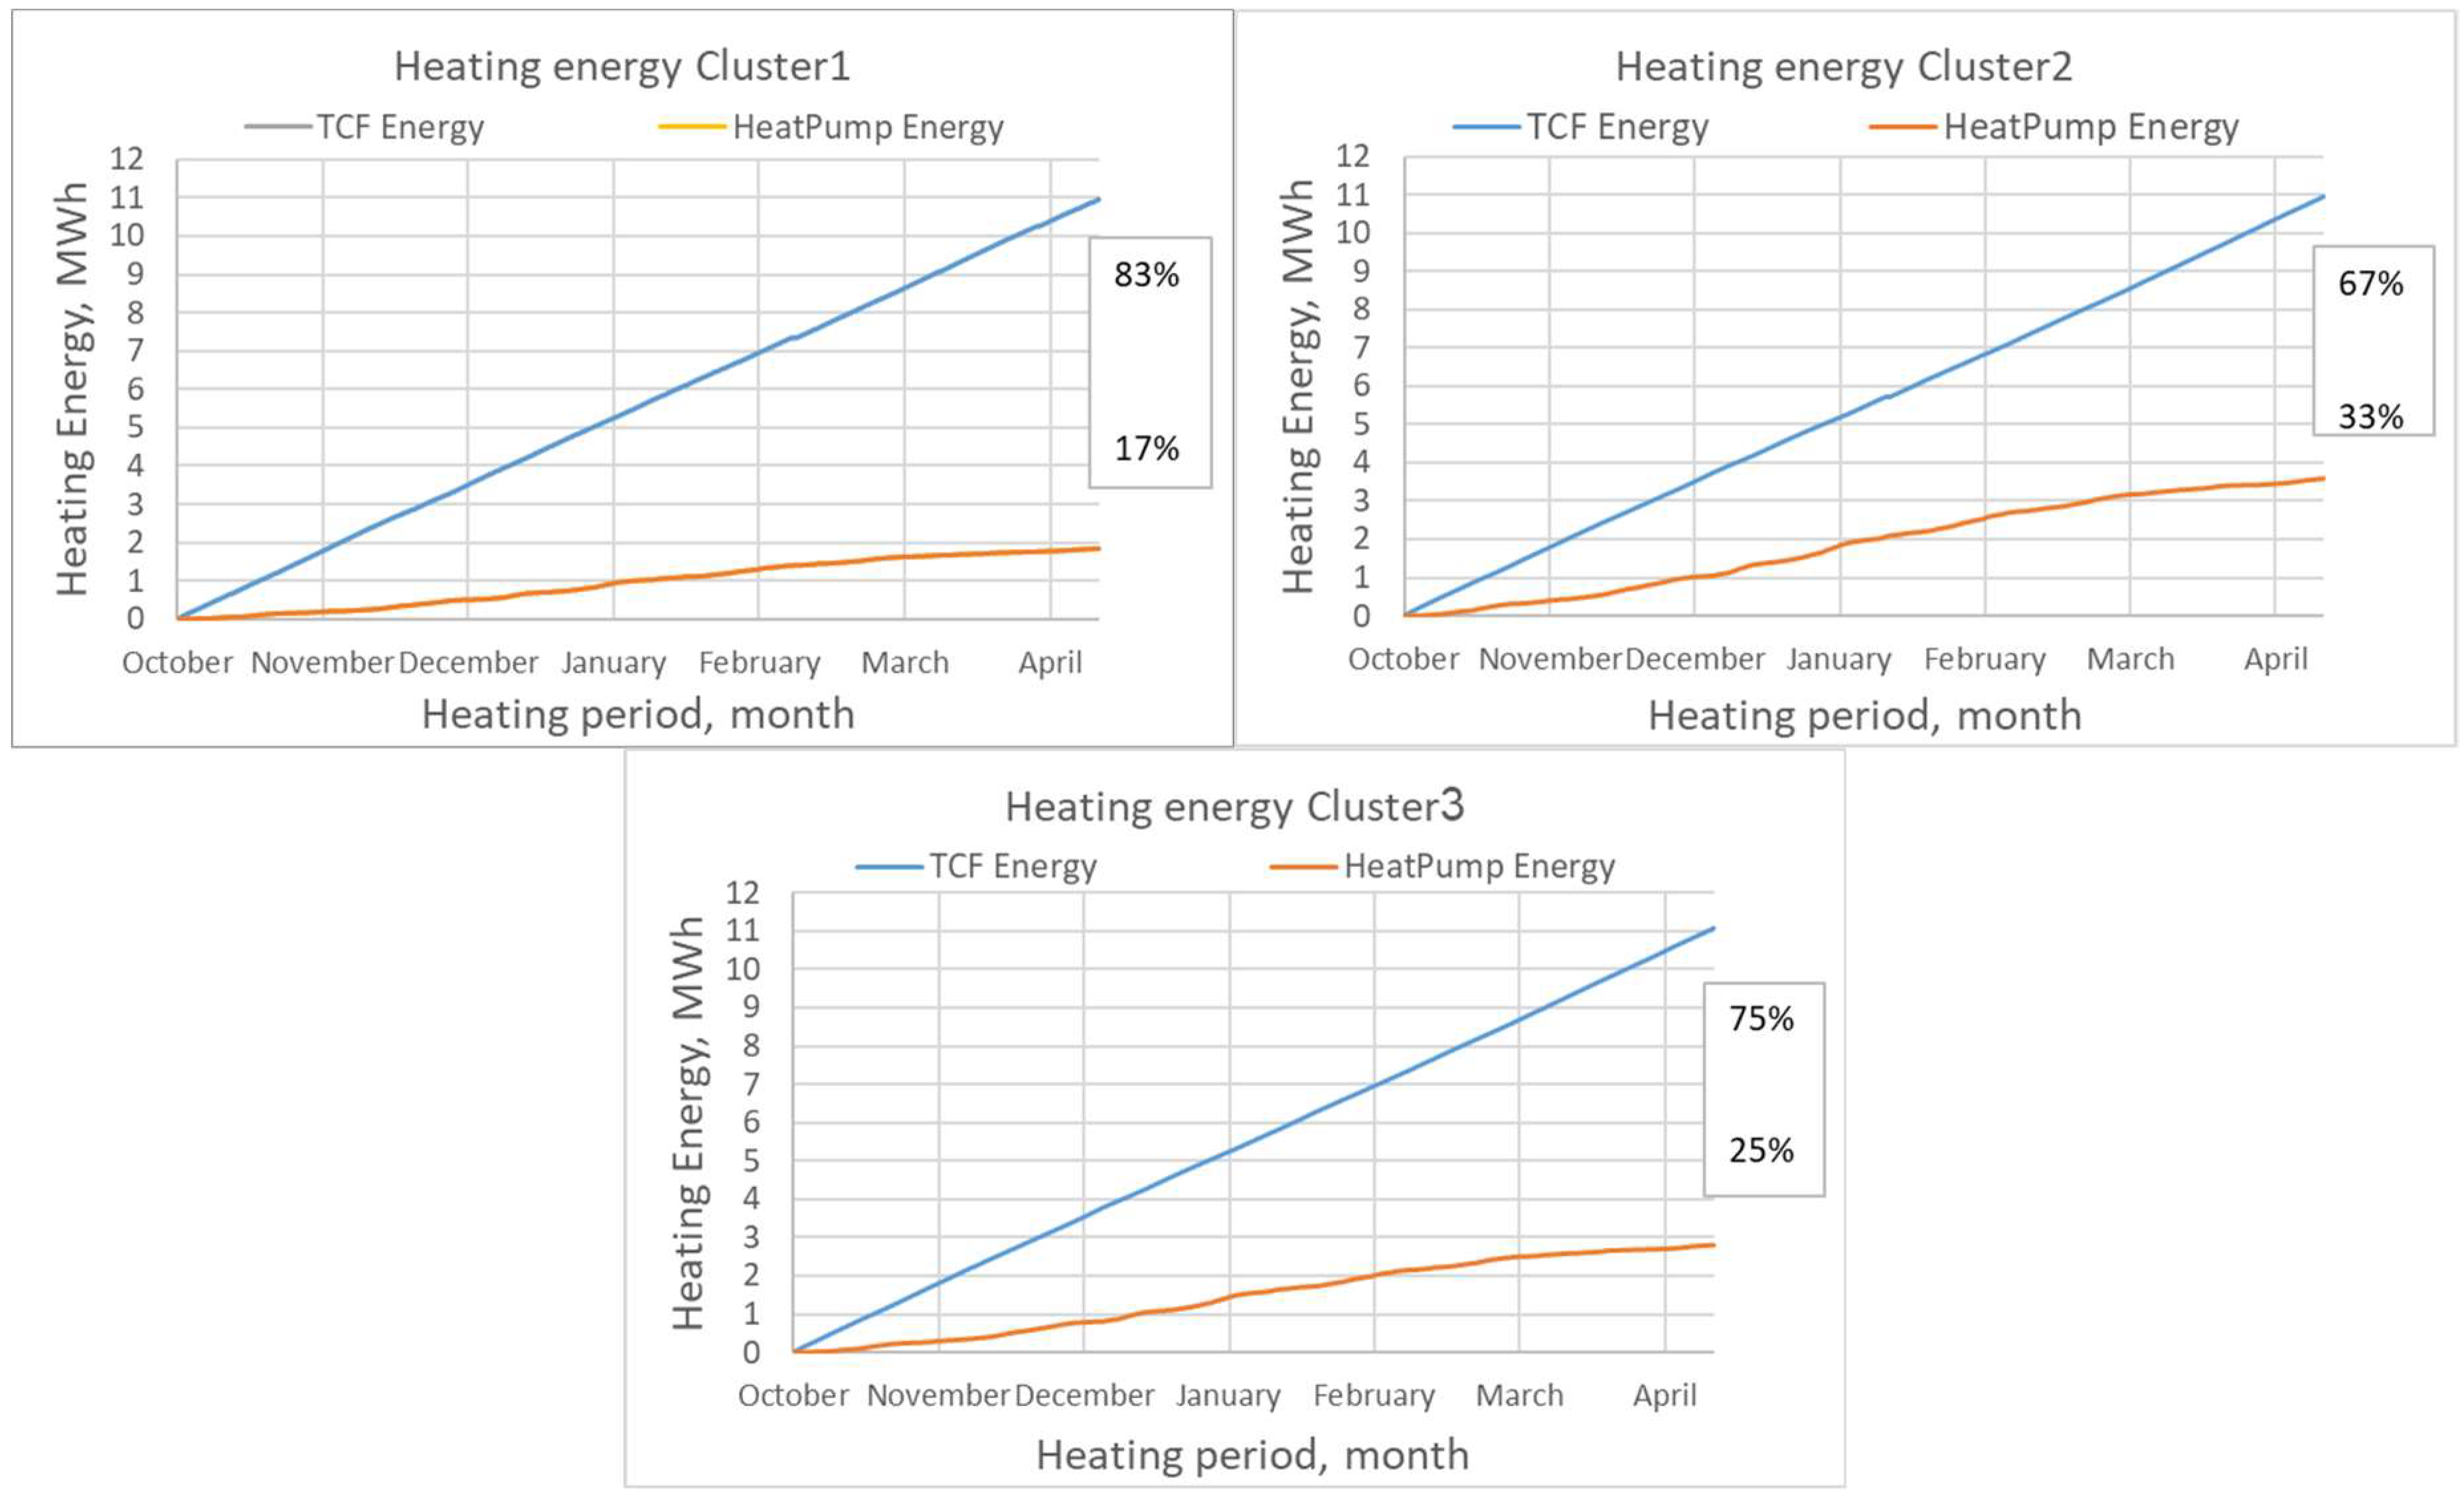
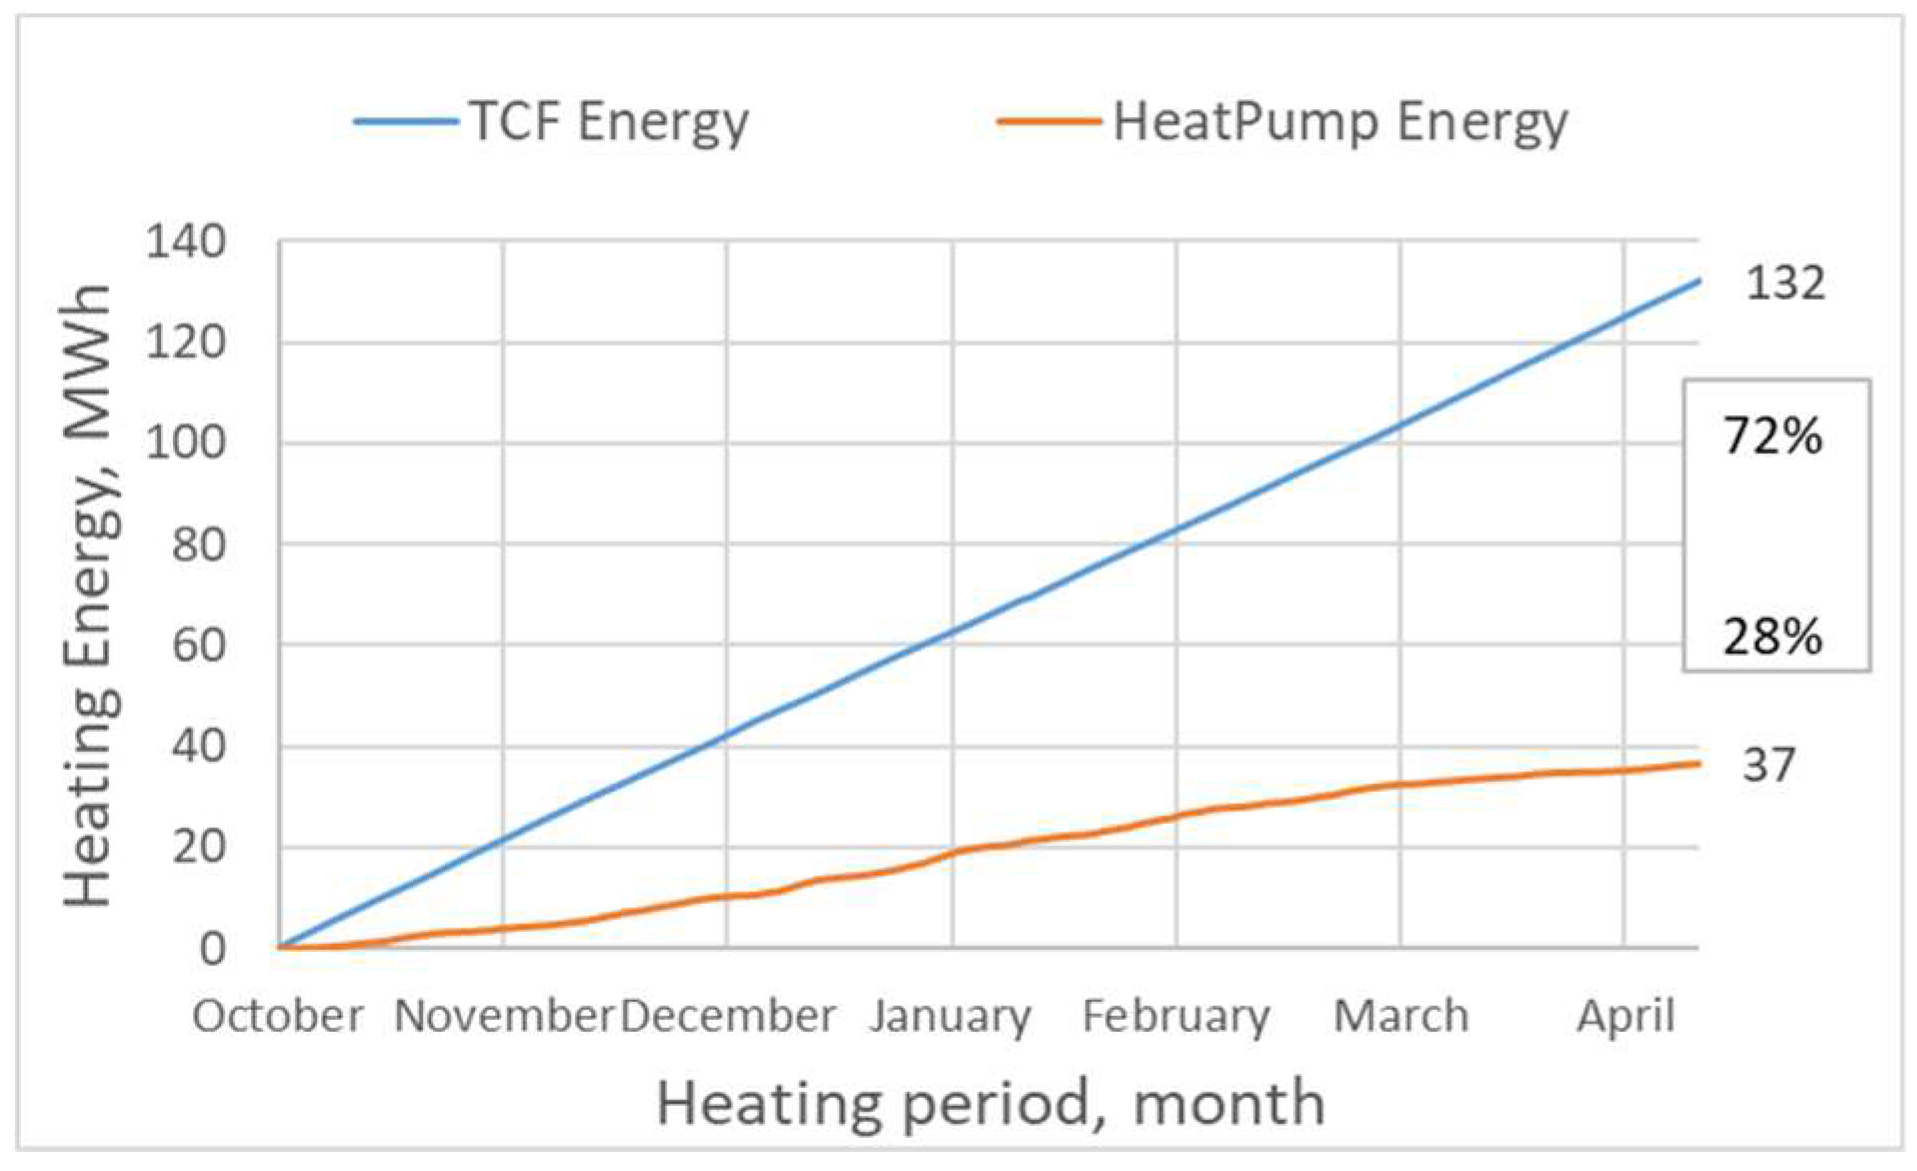
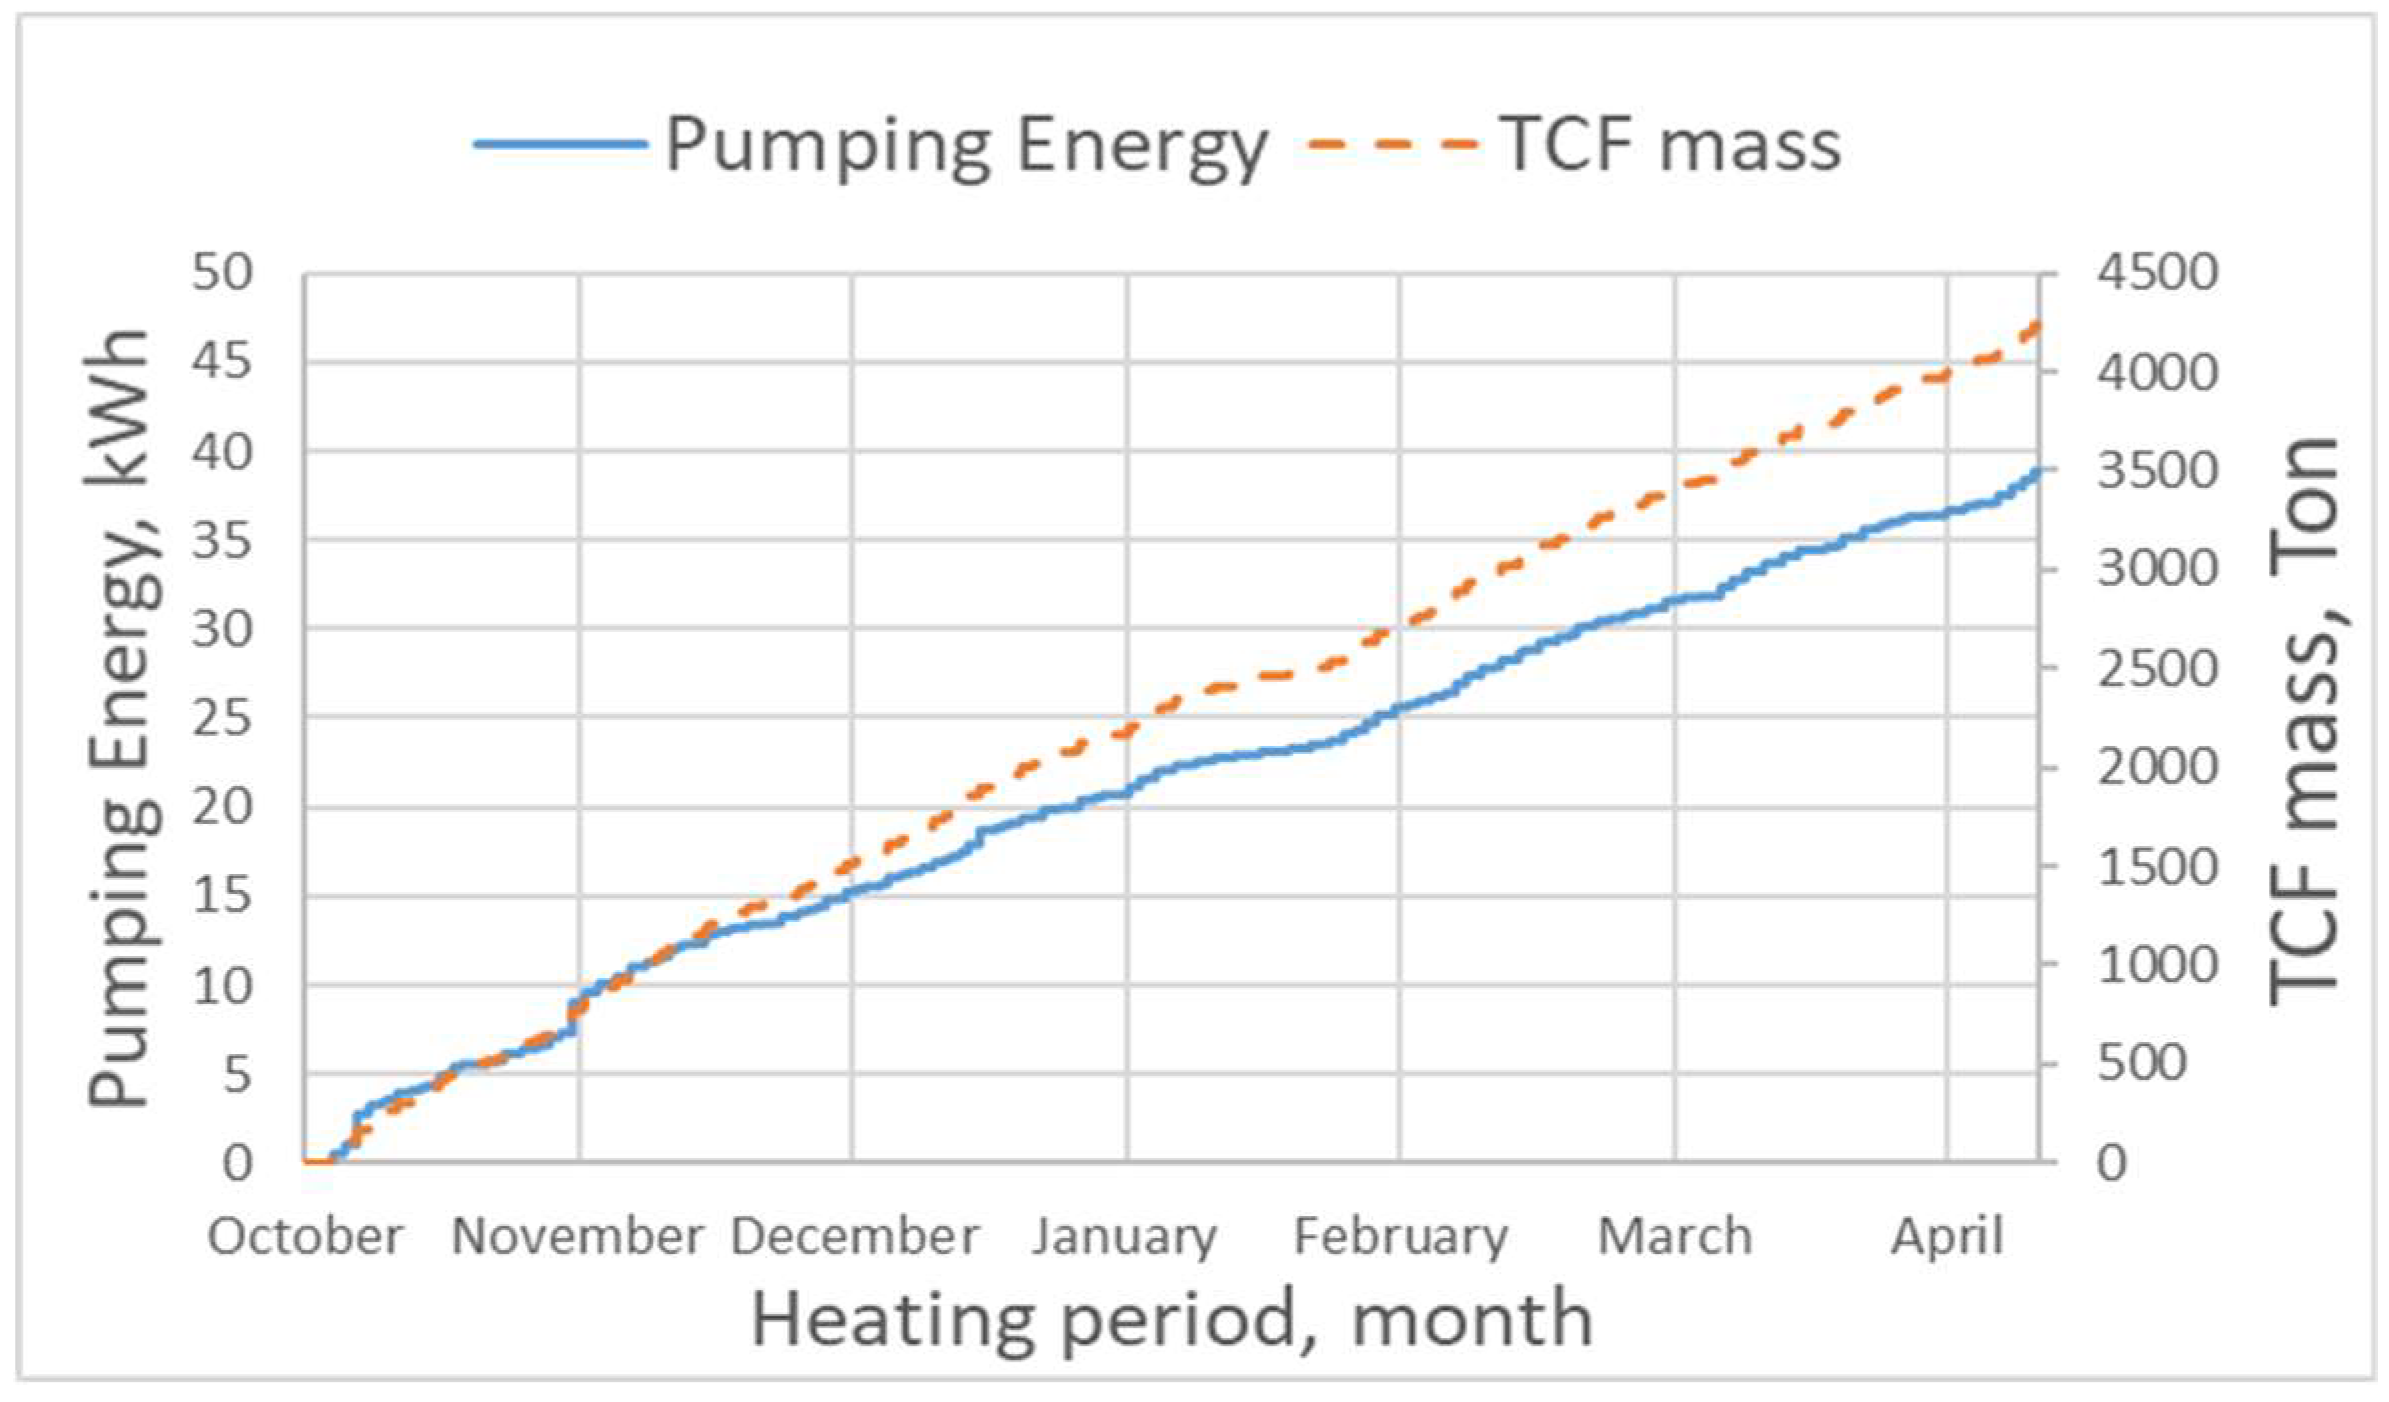
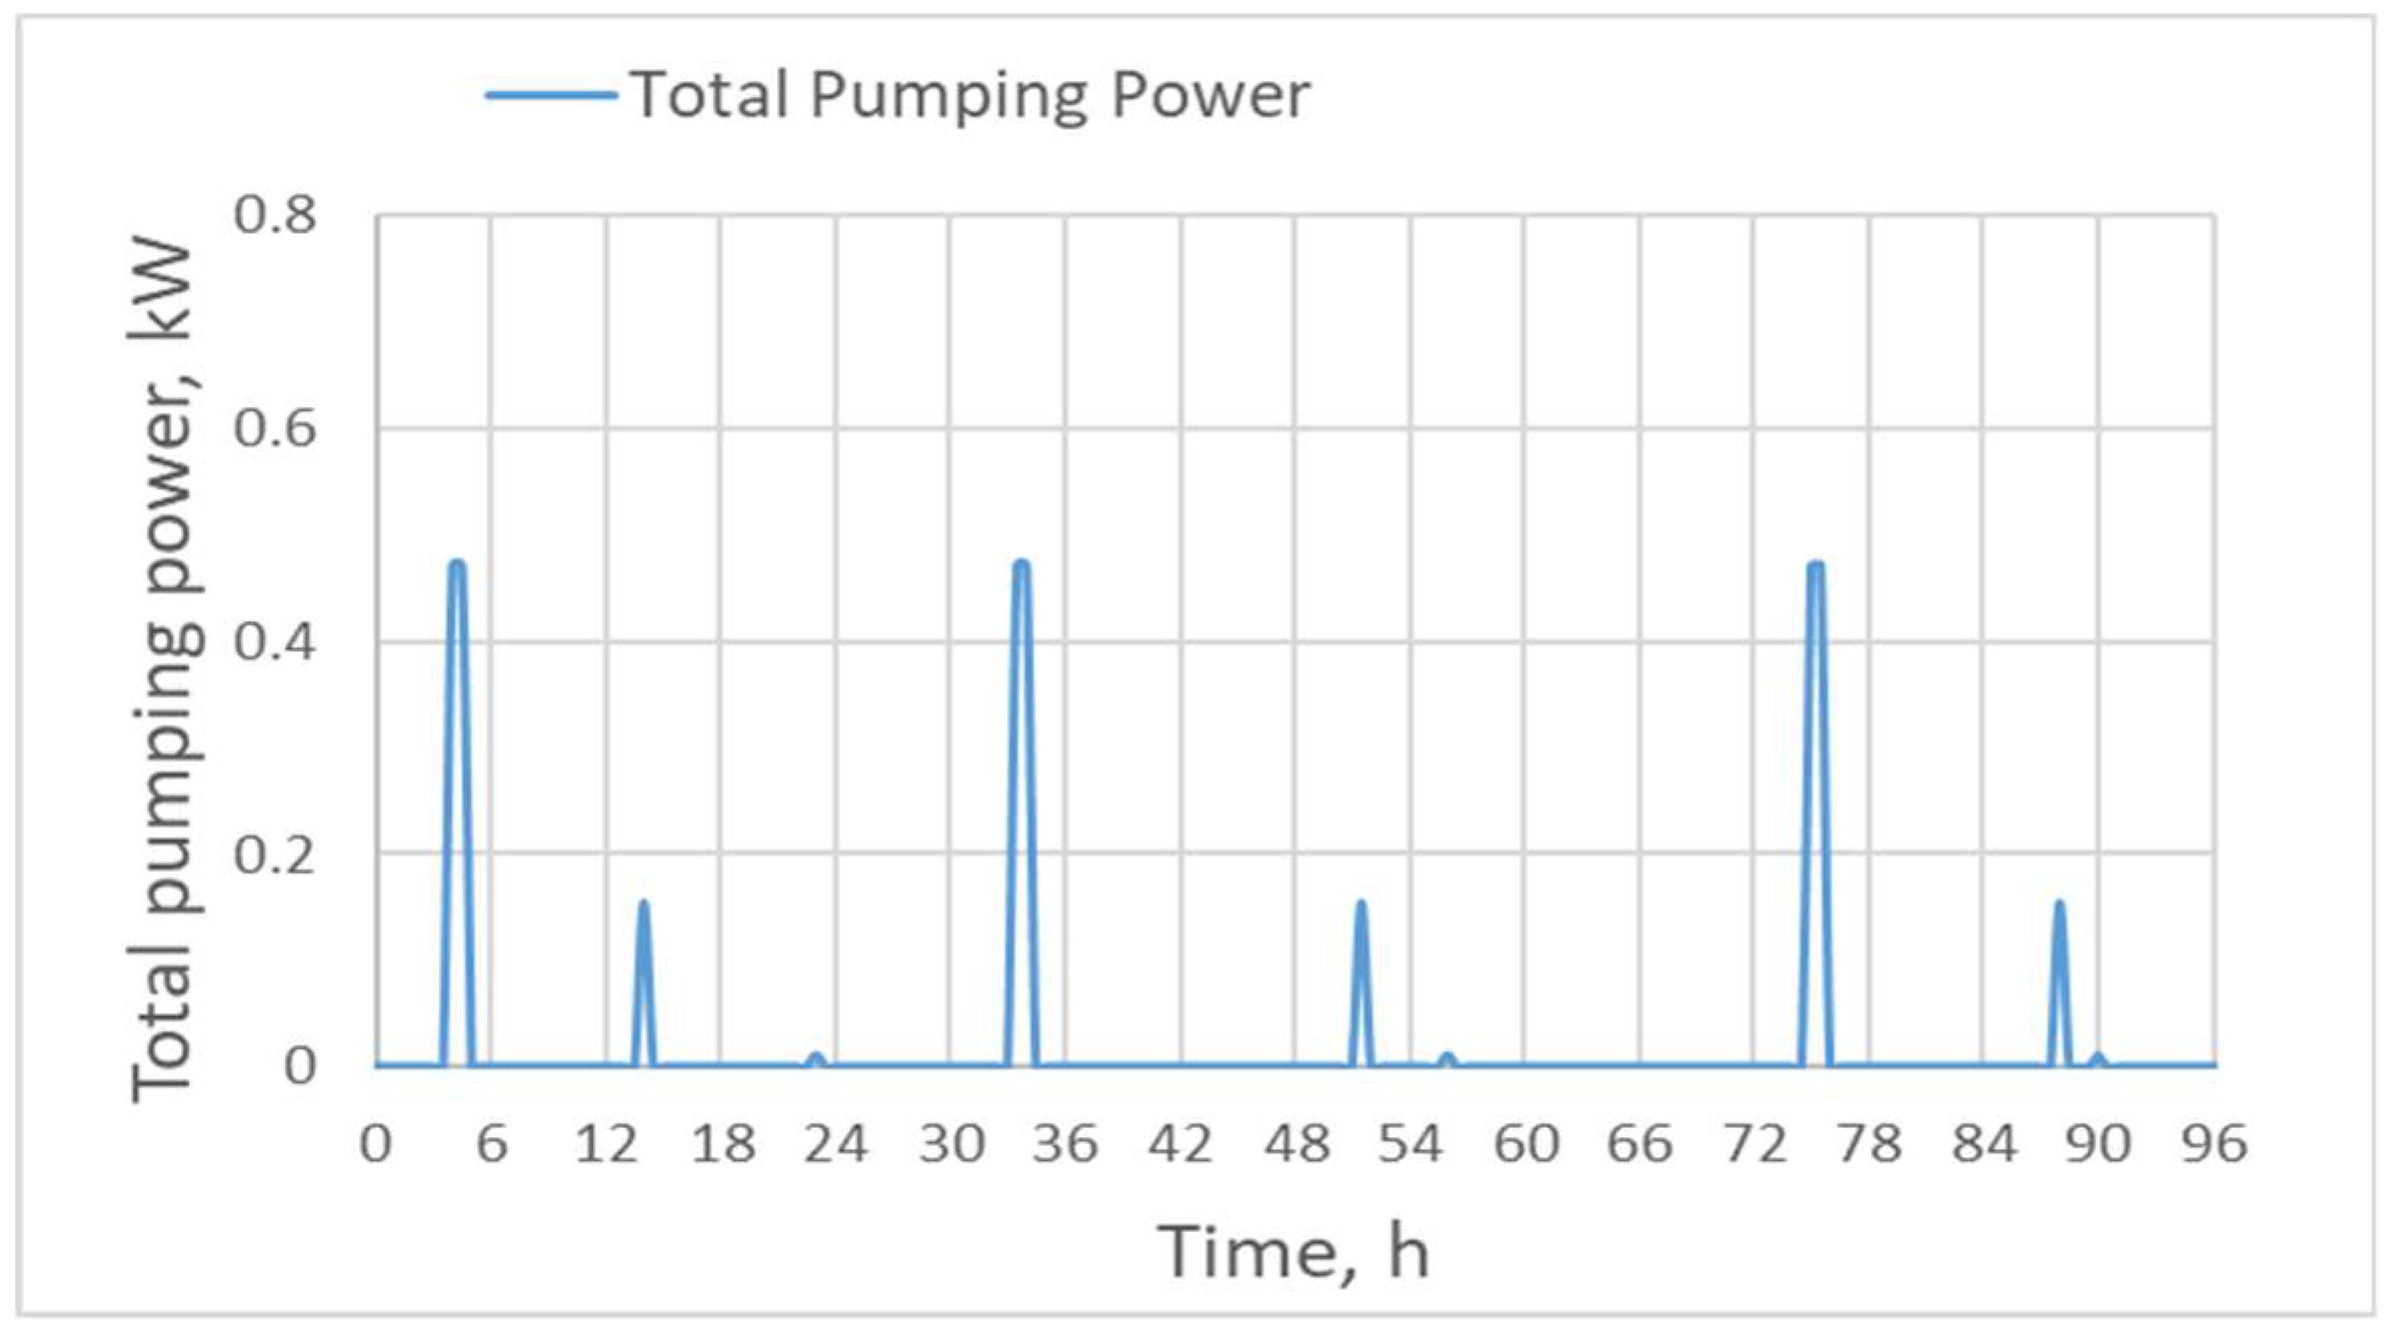
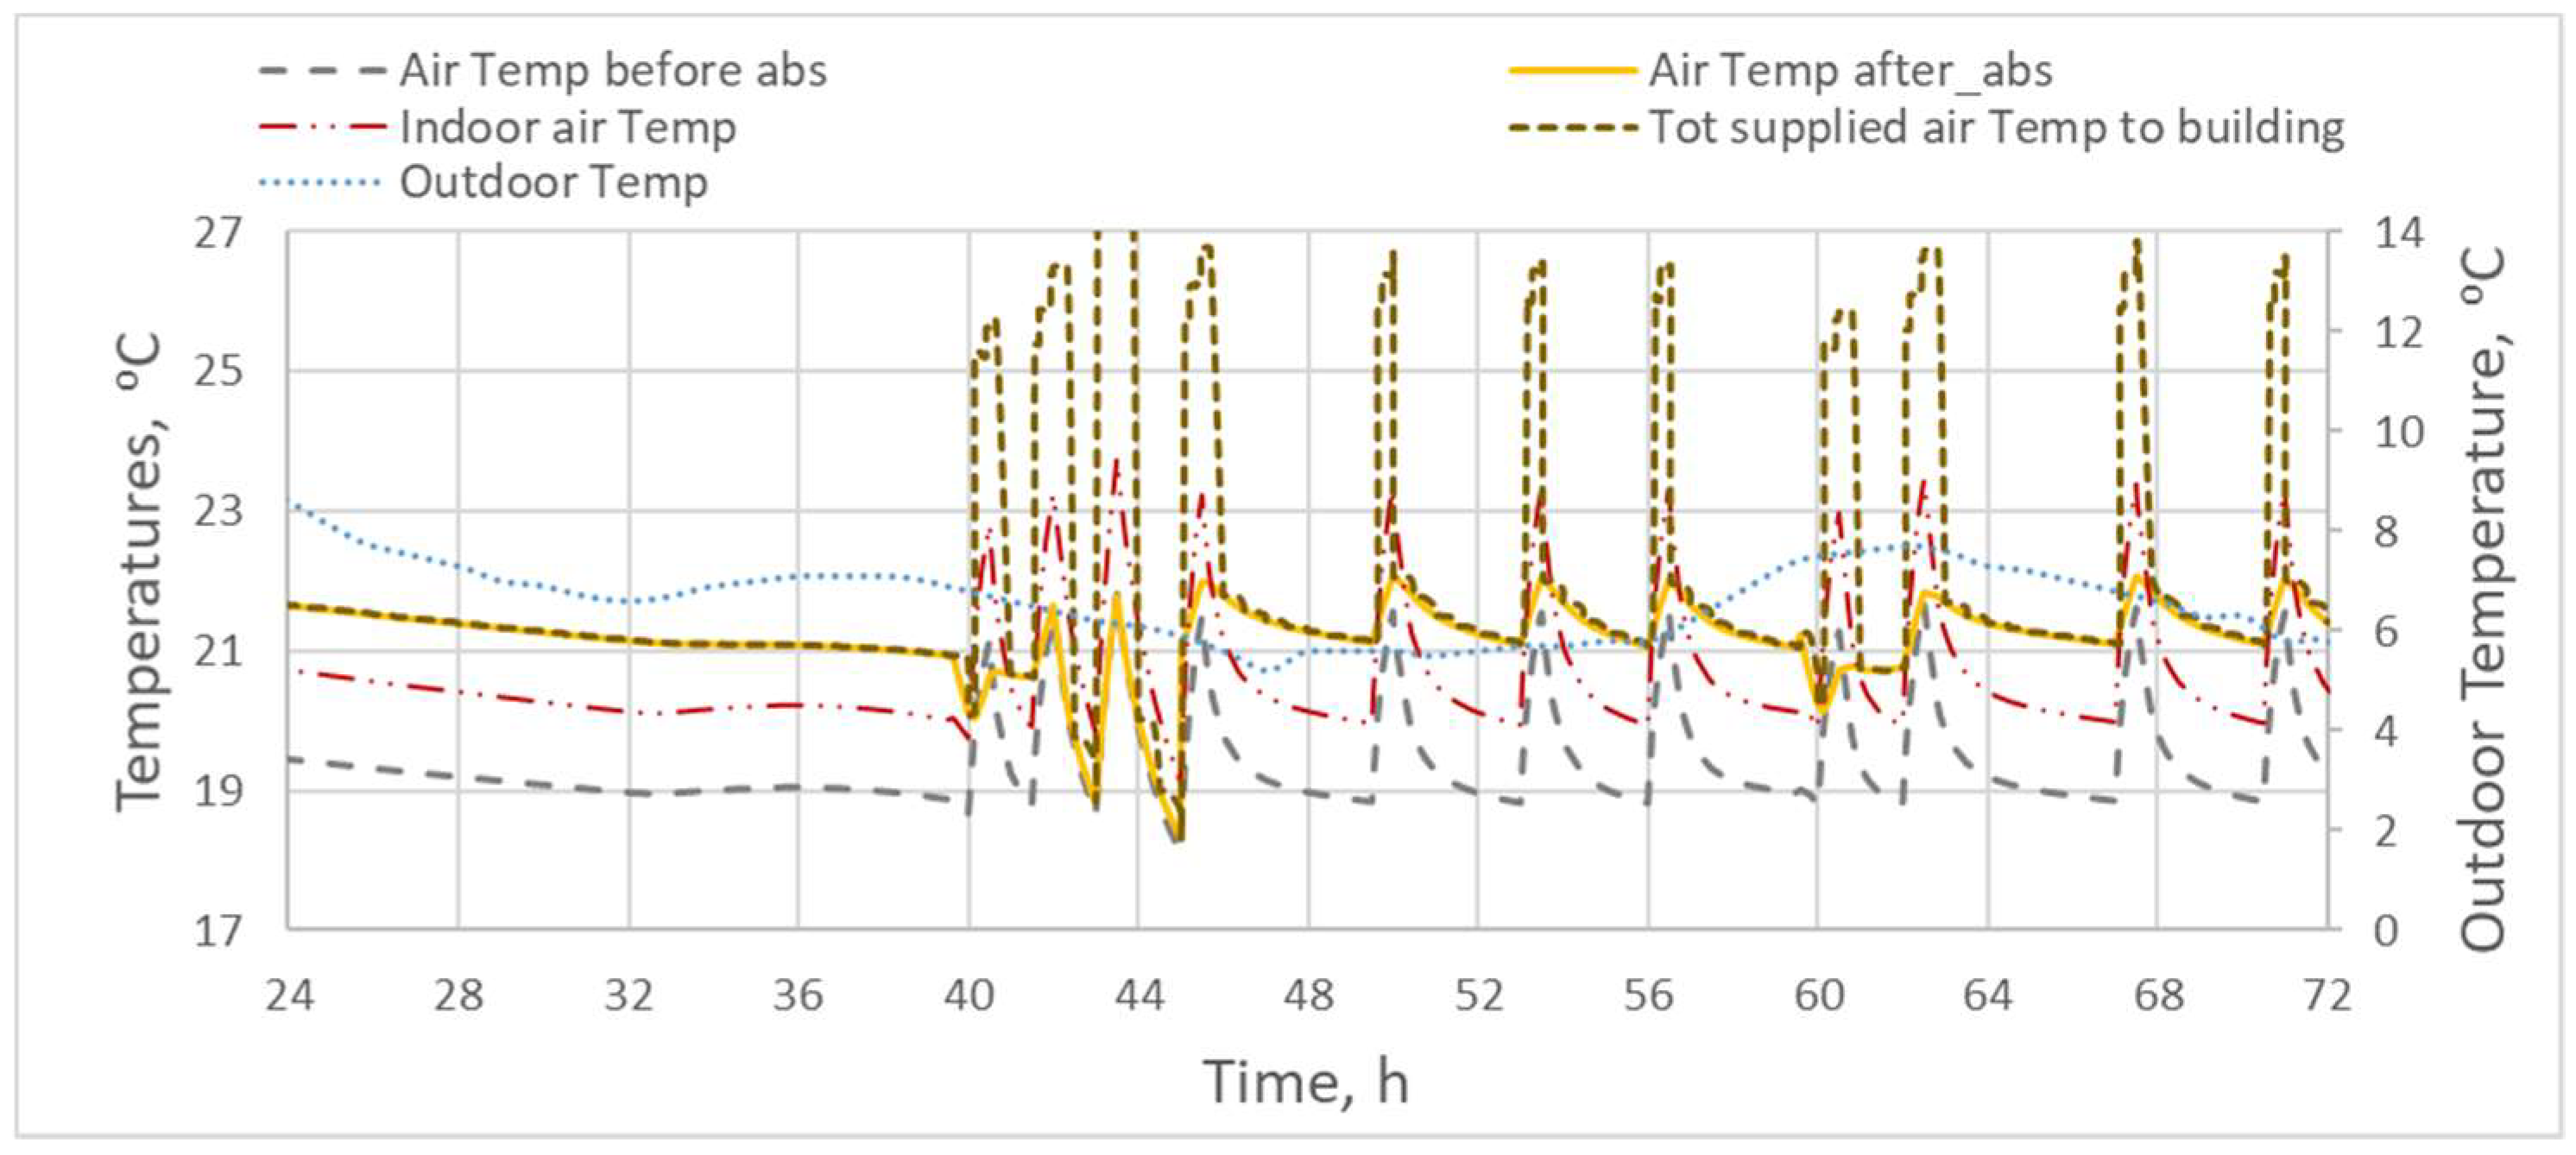
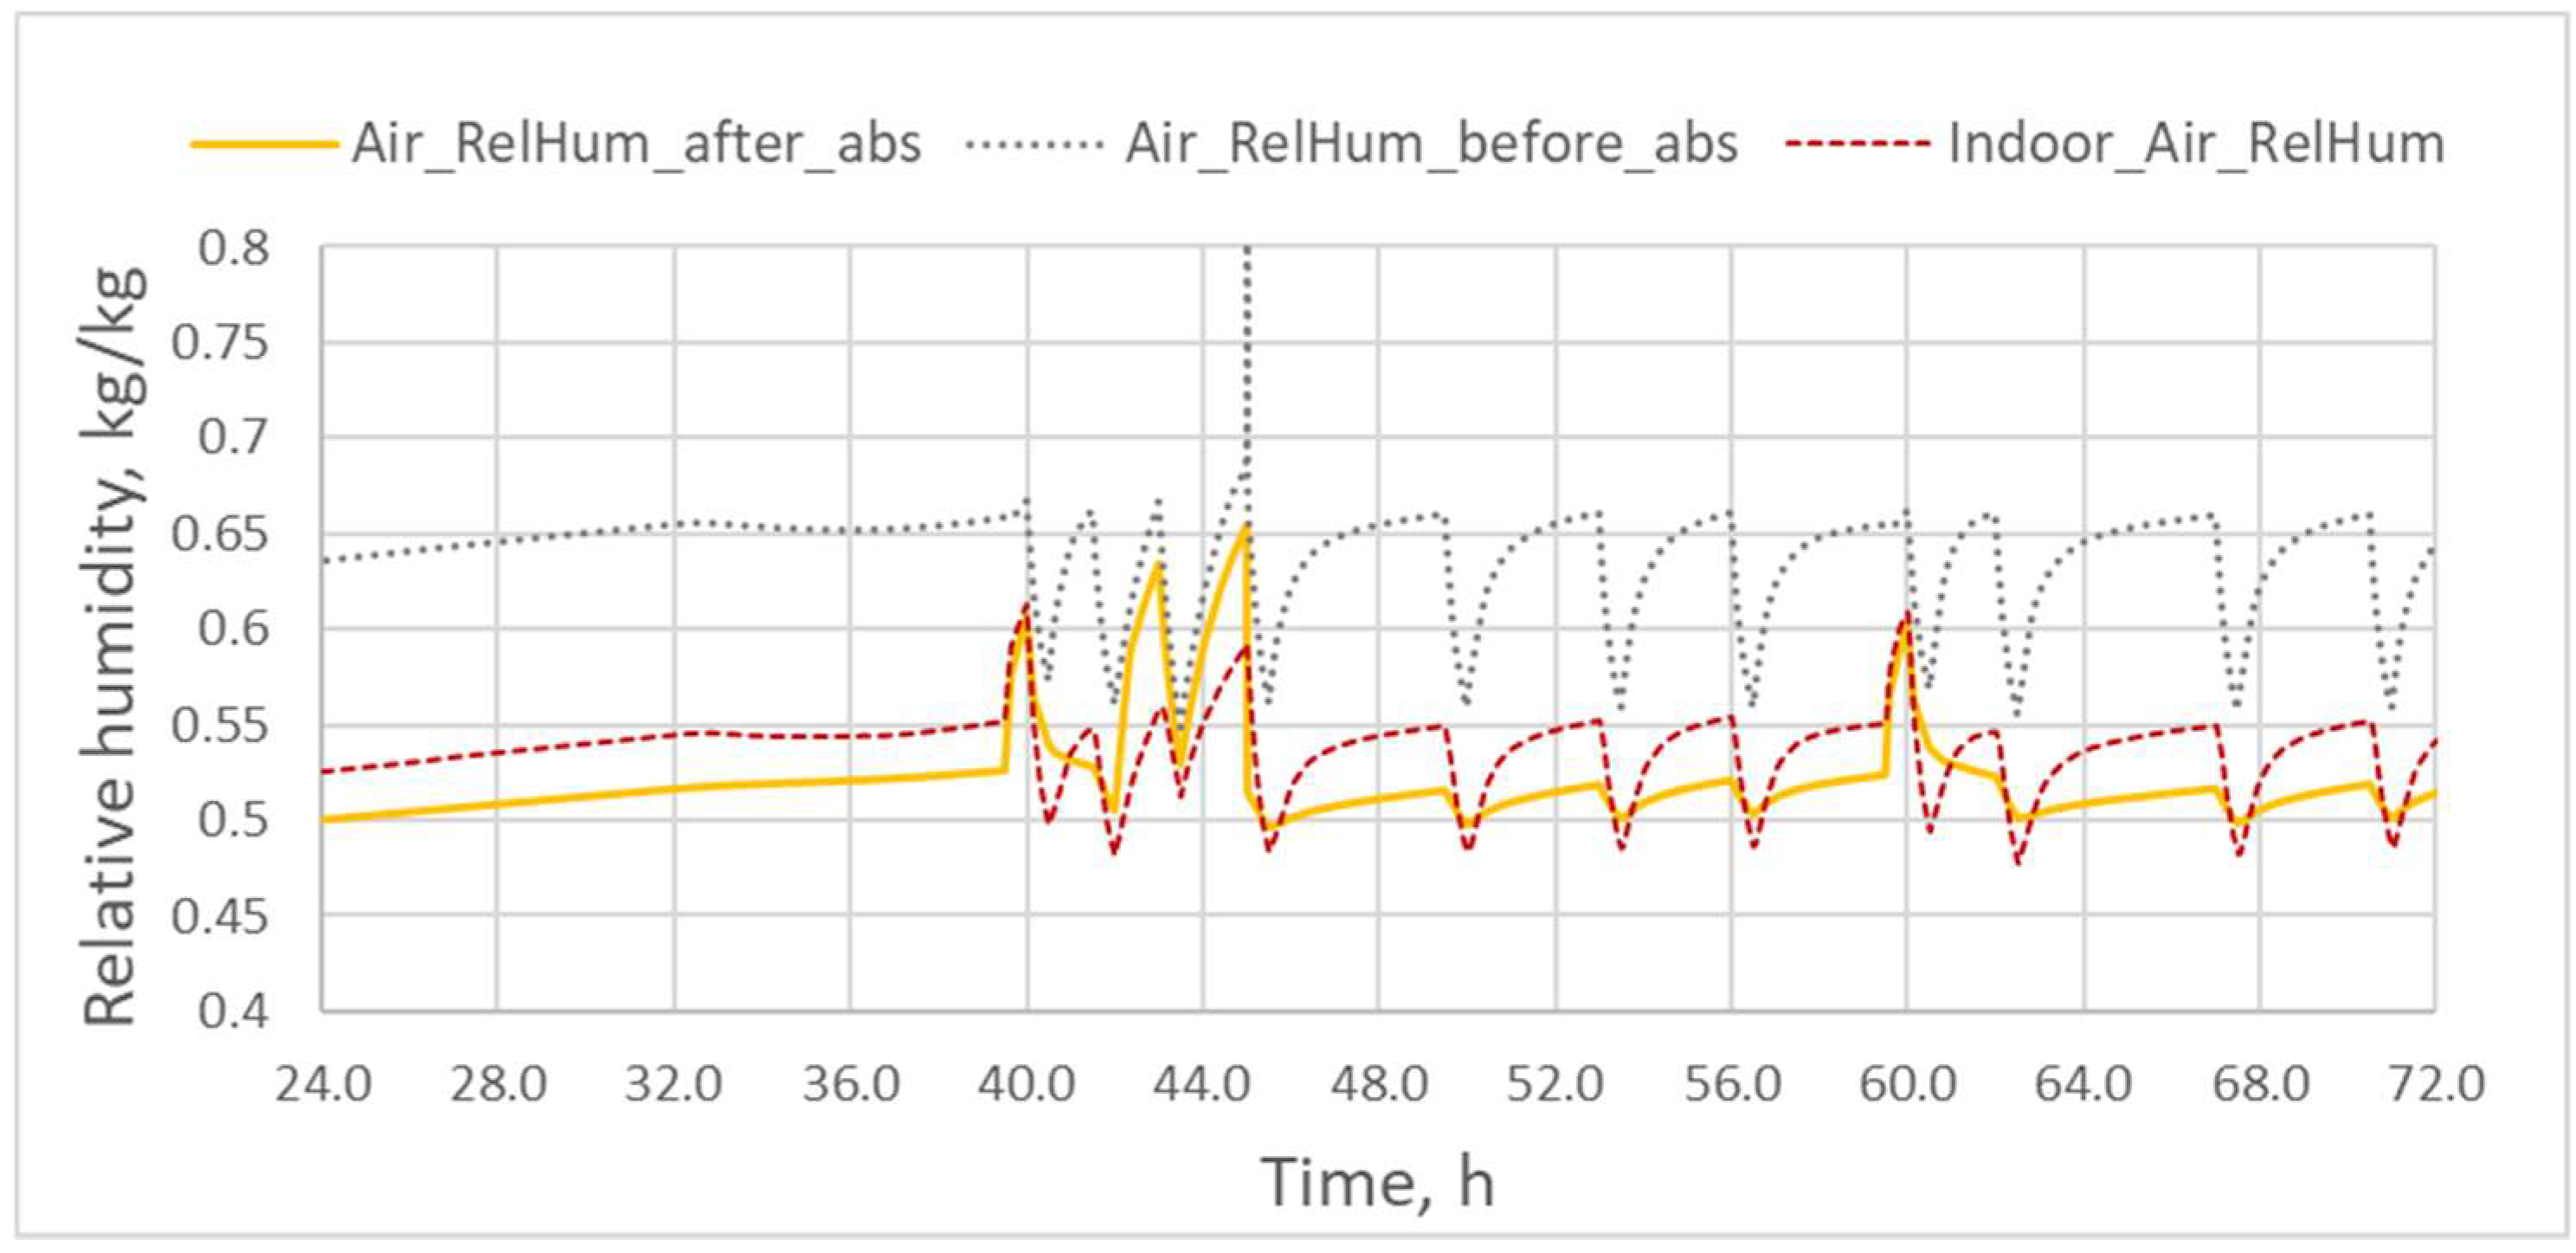
4. Simulation Results

Clusters of buildings were identified within the chosen district in accordance with the approach laid out previously in Section 3.2.5. As shown in Table 1, the three building clusters were present in the chosen district, each reflecting a heat demand level, with values of specific heat demand falling within the identified ranges for each cluster (as will be further elaborated on in Section 5.1).
Figure 8a shows the simulation results of the TCF mass flow of the three building clusters during four days of January. Figure 8b shows the total TCF mass flow profile of the Hasselt district during four days of January. The TCF mass flows with its peaks shows that the TCF solution in the tank needs to be changed once or twice per day and sometimes less or more depending on the heat demand and the outdoor temperature. The maximum total TCF mass flow in this case is 9 kg/s, however the demand on TCF mass flow is around one time per day per building.
The implemented control strategy of the district network is an on/off control using the signal from the TCF concentration sensor of the local tanks. Therefore, it is possible to decrease the maximum total TCF mass flow and the pump pressure by distributing supplying the TCF flow per building respectively, using a better control algorithm. As a result, multiple buildings will be supplied with the required TCF; however, the peaks will be averaged.
The TCF mass per building cluster during the heating period from October to April is shown in Figure 9; the values are around 300–400 tons, which is relatively high using the current control.
Figure 10 shows the provided heating energy percentage per cluster by both heating systems. In general, the total provided heating energy percentage of the integrated TC district heating network of the Hasselt district of the TC heating system is around 72%, while that of the heat-pump heating system is 28%, as shown in Figure 11. These heating energy percentages could be slightly changed when using a dynamic model of the humid air source. Thus, the heat pump usage will increase when the humid air source temperature is lower than the average temperature and vice versa, finally this will not effect on the conclusion of reducing the heat pump usage of the integrated heating system.
Figure 12 presents the integrated TC district heating network model. The pipe models are simplified models representing only the pressure losses and mass flow as there are no heat losses by using the TCF as a heat and hygroscopic property carrier. the total pipe length is 230 m, the total pressure drop is 170 kPa, and the maximum TCF mass flow is 17 kg/s. The supply side is not presented in this study, but only the external TCF tank that receives the concentrated TCF from the supply side. The colorful circles represent the cluster heat demand levels as they are presented in Table 1.
Finally, in terms of the estimation of the total pumping energy and total TCF running mass to be used in the economic evaluation, the simulation results in Figure 13 show that the TCF running mass is around 4200 tons during the heating period and total pumping energy for supply is about 40 kWh and return is about 40 kWh.
The total pumping energy seems to be small, as it is about 80 kWh comparing to the conventional DH, but in fact the integrated TC district heating network works in different way of the DH. Thus, the pumps works every few hours to pump small amount (around 0.5 m3) of the TCF to the local tanks in the buildings. For example Figure 8a,b and Figure 14 show that the pumps work half hour only nine times during four days and the pumping energy consumption was about 0.6 kWh.
The results of the simulation of the integrated heating system of the three building clusters during the heating period from October to April demonstrate the hygroscopic and heating potential of the TC heating system with heat-pump heating system. Figure 15 and Figure 16 show the exemplary behavior, during two days of January, of the temperature and relative humidity of building cluster 3 before and after the absorber and the total supplied air temperature to the building after mixing the warm incoming air from the absorber and heated fresh air.
Moreover, they show the indoor and outdoor temperatures and relative humidities. While the outdoor temperature varies between 5 and 11 °C, the indoor temperature and its relative humidity are maintained to be between 20 and 22.5 °C, and 45 to 55%, respectively. This shows that the system is able to keep the building indoor conditions within the comfort zone. Furthermore, the temperature peaks of the total supplied air to the building appear when the TCF heating system is not working or is initiating. Therefore, the heat-pump heating system heats the low-flow fresh air quickly and to a high degree by the water–air heat exchanger to recover the heat demand.

5. Economic evaluation results

5.1. Building Cluster Groups and Data for Modelica Simulations

Clustering resulted in identifying three groups of buildings:
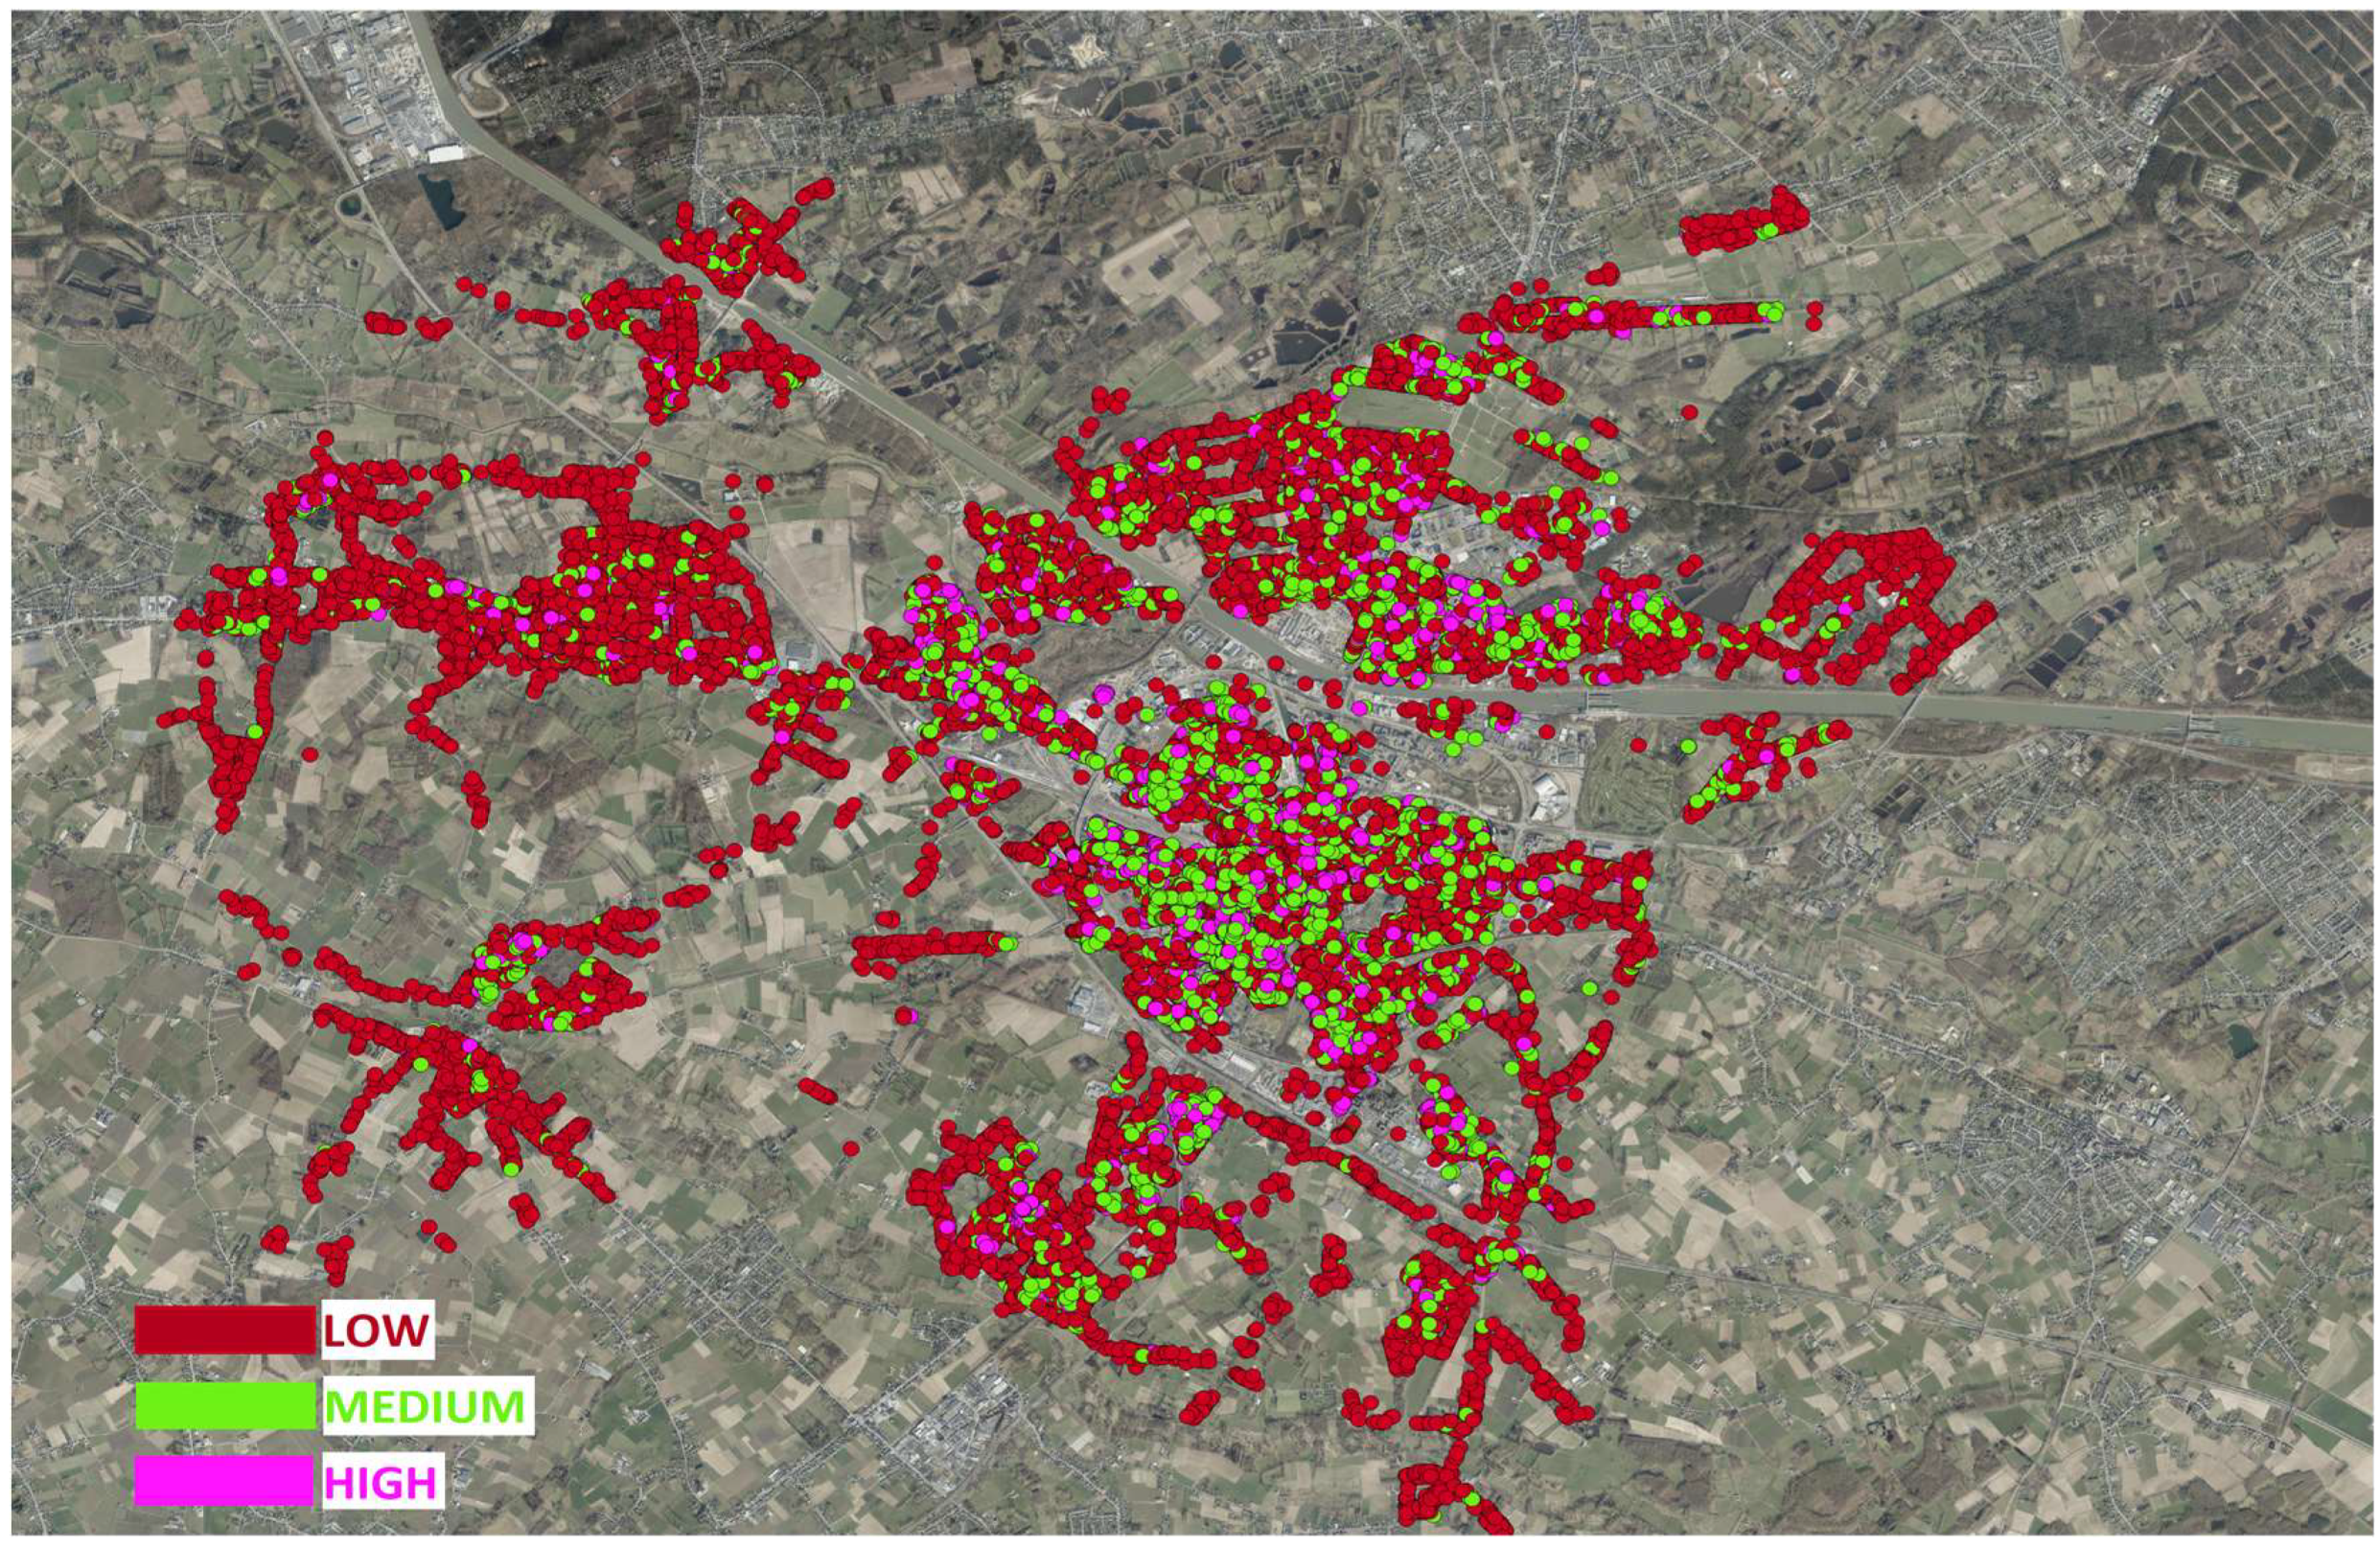
  • Low-demand group, with EPR lower than 110 kWh/m2a, representing 46% of the total sample;
  • Medium-demand group, with EPR between 110 to 256 kWh/m2a, representing 39% of the whole sample;
  • High-demand group, with EPR higher than 256 kWh/m2a, representing the remaining 15% of the building sample.
Buildings from all clusters are spread over the municipality as shown in Figure 17, with the low-demand cluster (in red) more present outside the city ring (in suburbs) than within the ring.
Since the methodology of using GIS data combined with clustering may not be familiar, accuracy of these results had to be judged in reference to research that addresses Belgian and/or European cities’ building stocks within district heating studies. The points below serve this goal as follows:
  • A hypothetical composite building with average characteristics of different built forms was found to have an EPR of 150 kWh/m2a. The composite building fell within the medium-demand cluster, being a two-story building with a 97 m2 footprint and a yearly heat demand of 12 MWh/a. The characteristics of this composite building significantly agree with the findings of EUROSTAT survey over Flemish households, in terms of annual heat demand, number of stories and total surface area [18].
  • The identified groups are similar to the findings of the FLEXYNETS project (Fifth generation, low temperature, high exergy district heating and cooling networks) in terms of buildings’ EPR for a number of European cities that are similar to Hasselt [11]. Also the high presence of low-demand building cluster agrees with the findings of this study.
  • The predominance of the low-demand group can be understood in light of the ‘prebound effect’ as described in [19]. This effect can be explained as the changes in occupants’ behavior towards more economical usage of their space heating as a response to their poorly heated dwellings, leading to lower actual energy use than the calculated one., with the low-demand cluster (in red) more present outside the city ring (in suburbs) than within the ring.

5.2. Economic Study: Base-Case Results

This section deals with the economic evaluation results of TCF technology implementation in Hasselt, Belgium, as well as those of alternative heating technologies. Table 2 shows a comparison between the technologies in terms of annualized project costs, yearly CO2 emissions, annual primary and electric energy consumption for domestic boilers and rest of the technologies, respectively, and deviations of the technologies from the TCF system as the reference level.
The first indication from the results is that TCF technology has a clear advantage over standalone heat-pump systems from both the economic and environmental points of view. The critical factor for heat-pump system cost hikes is the running costs from electric energy consumption, leading to it incurring the highest OPEX of all technologies. Despite the fact that Belgium’s overall power generation efficiency is around 42%, which leads to heat-pump systems using less primary energy than domestic boilers, the high electricity tariff in Belgium (one of the highest in the EU) primarily led to the economic unattractiveness of heat-pump systems. Despite the fact that Belgium’s overall power generation efficiency is around 42%, which leads to heat-pump systems using less primary energy than domestic boilers, the high electricity tariff in Belgium (one of the highest in the EU) primarily led to the economic unattractiveness of heat-pump systems.
In comparison with domestic gas boilers, TCF technology introduces a substantial reduction in CO2 emissions along with significant savings in primary energy consumption. Although domestic gas boilers have lower annualized costs than TCF systems, this is offset by the benefits in primary energy use and emission levels.
Furthermore, water-based district heating was found to have advantages over integrated TC systems. One factor behind the lower annualized costs of water-based DHs is that they do not require complex in-house systems as is the case for TC systems, but require rather traditional radiators, piping, and fittings. This also excludes the costs of air ducts and heat pumps of integrated TC systems for residential buildings. However, considering office buildings with ventilation systems, the costs for air ducts are not system specific as the required infrastructure is already available.
Additionally, the absence of a heat pump operating within the water-based DH system (contrary to integrated TC systems) led to substantial savings in energy consumption, limiting electric power use to only water pumping through transmission and distribution networks. This also led to a mere 1.2% pumping-to-transported heat fraction for the water-based DH. Furthermore, the water-based DH departed from all other systems in terms of low OPEX-to-annualized costs fractions, as is shown in Table 3. Again, although the water-based DH had higher energy requirements for network pumping than TCF networks (1.2% versus 0.7% of transported heat potential), heat pump operation within the integrated TC system offset the expected benefits from the TC systems in this regard. However, one critical advantage is still retained by the TC systems over water-based DH: that is, the long-distance transport of excess heat and the loss-free storage, which will be covered later in Section 5.3.
The numbers in Table 2 for different projects costs can be understood in line with the further breakdown as shown in Table 3. Included in this table are annual OPEX, annualized costs, ratio of the former to the latter, and the cost driving factors for both OPEX and CAPEX. Firstly, it is interesting to see the similarities between heat pump systems and gas boilers, as both feature input energy cost and yearly maintenance cost as the highest factors contributing to their OPEX. On the other hand, district heating systems display similar percentages of their in-house heating systems yearly operation and maintenance (O&M) costs, which represented their top CAPEX driving factor. However, DH systems differed in their second cost factor, with water-based DH having distribution network maintenance as its next factor. This is due to the much higher CAPEX of distribution network in water DH (181 M€) compared to that of TC network (105 M€), with maintenance costs assumed as 3% of CAPEX as shown in Appendix A.
Analyzing the CAPEX cost drivers in Table 3 revealed the drawback of the more complex TC integrated heating system, and how that affected project economic attractiveness as a whole. Water-based and TC integrated systems showed opposite positions regarding their two highest cost factors, with water-based DH suffering from high network costs and TC integrated systems suffering from high investment costs in their relatively more complex in-house heating systems. However, it can be believed that future technological developments will bring down the capital cost of absorbers and heat pumps, both of which are used in TC integrated heating systems. Such cost reductions can make TC systems competitive not only environmentally but also economically, along with other potential applications that can be provided through these systems (cooling, drying, humidity control).
The last parameter to be investigated is distribution network costs after being scaled-up from costs for high-demand and low-demand areas, as was illustrated earlier in Section 3.2.4. Table 4 planning for both DH systems followed essentially the same method and routing. Differences only came from the higher flow rates encountered in water-based DH, which entailed larger pipe diameters, higher capacity pumps, and higher pumping energy, and insulation for the pipes. As a simple example, the water flow rate required for the whole city demand in an average sense was 0.46 m3/s, while that of TCF was 0.16 m3/s. Naturally, the difference came from the relatively higher energy density of TCF, as well as heat pumps share in satisfying buildings heat loads within TC integrated heating systems.
It becomes clear from the results in Table 4 that a 100% market reach is far from being feasible or economically attractive, and, as per PETA 4.3 recommendations [12,13], in areas with limited district heating and cooling feasibility individual supplies should be from heat pumps that can contribute to the integration of variable renewables. Furthermore, a slight advantage is evident for TC networks over water-based thermal DH in terms of distribution network CAPEX and OPEX. This can be seen from the annualized marginal CAPEX for the distribution network, with TC networks offering economic advantages in this regard.

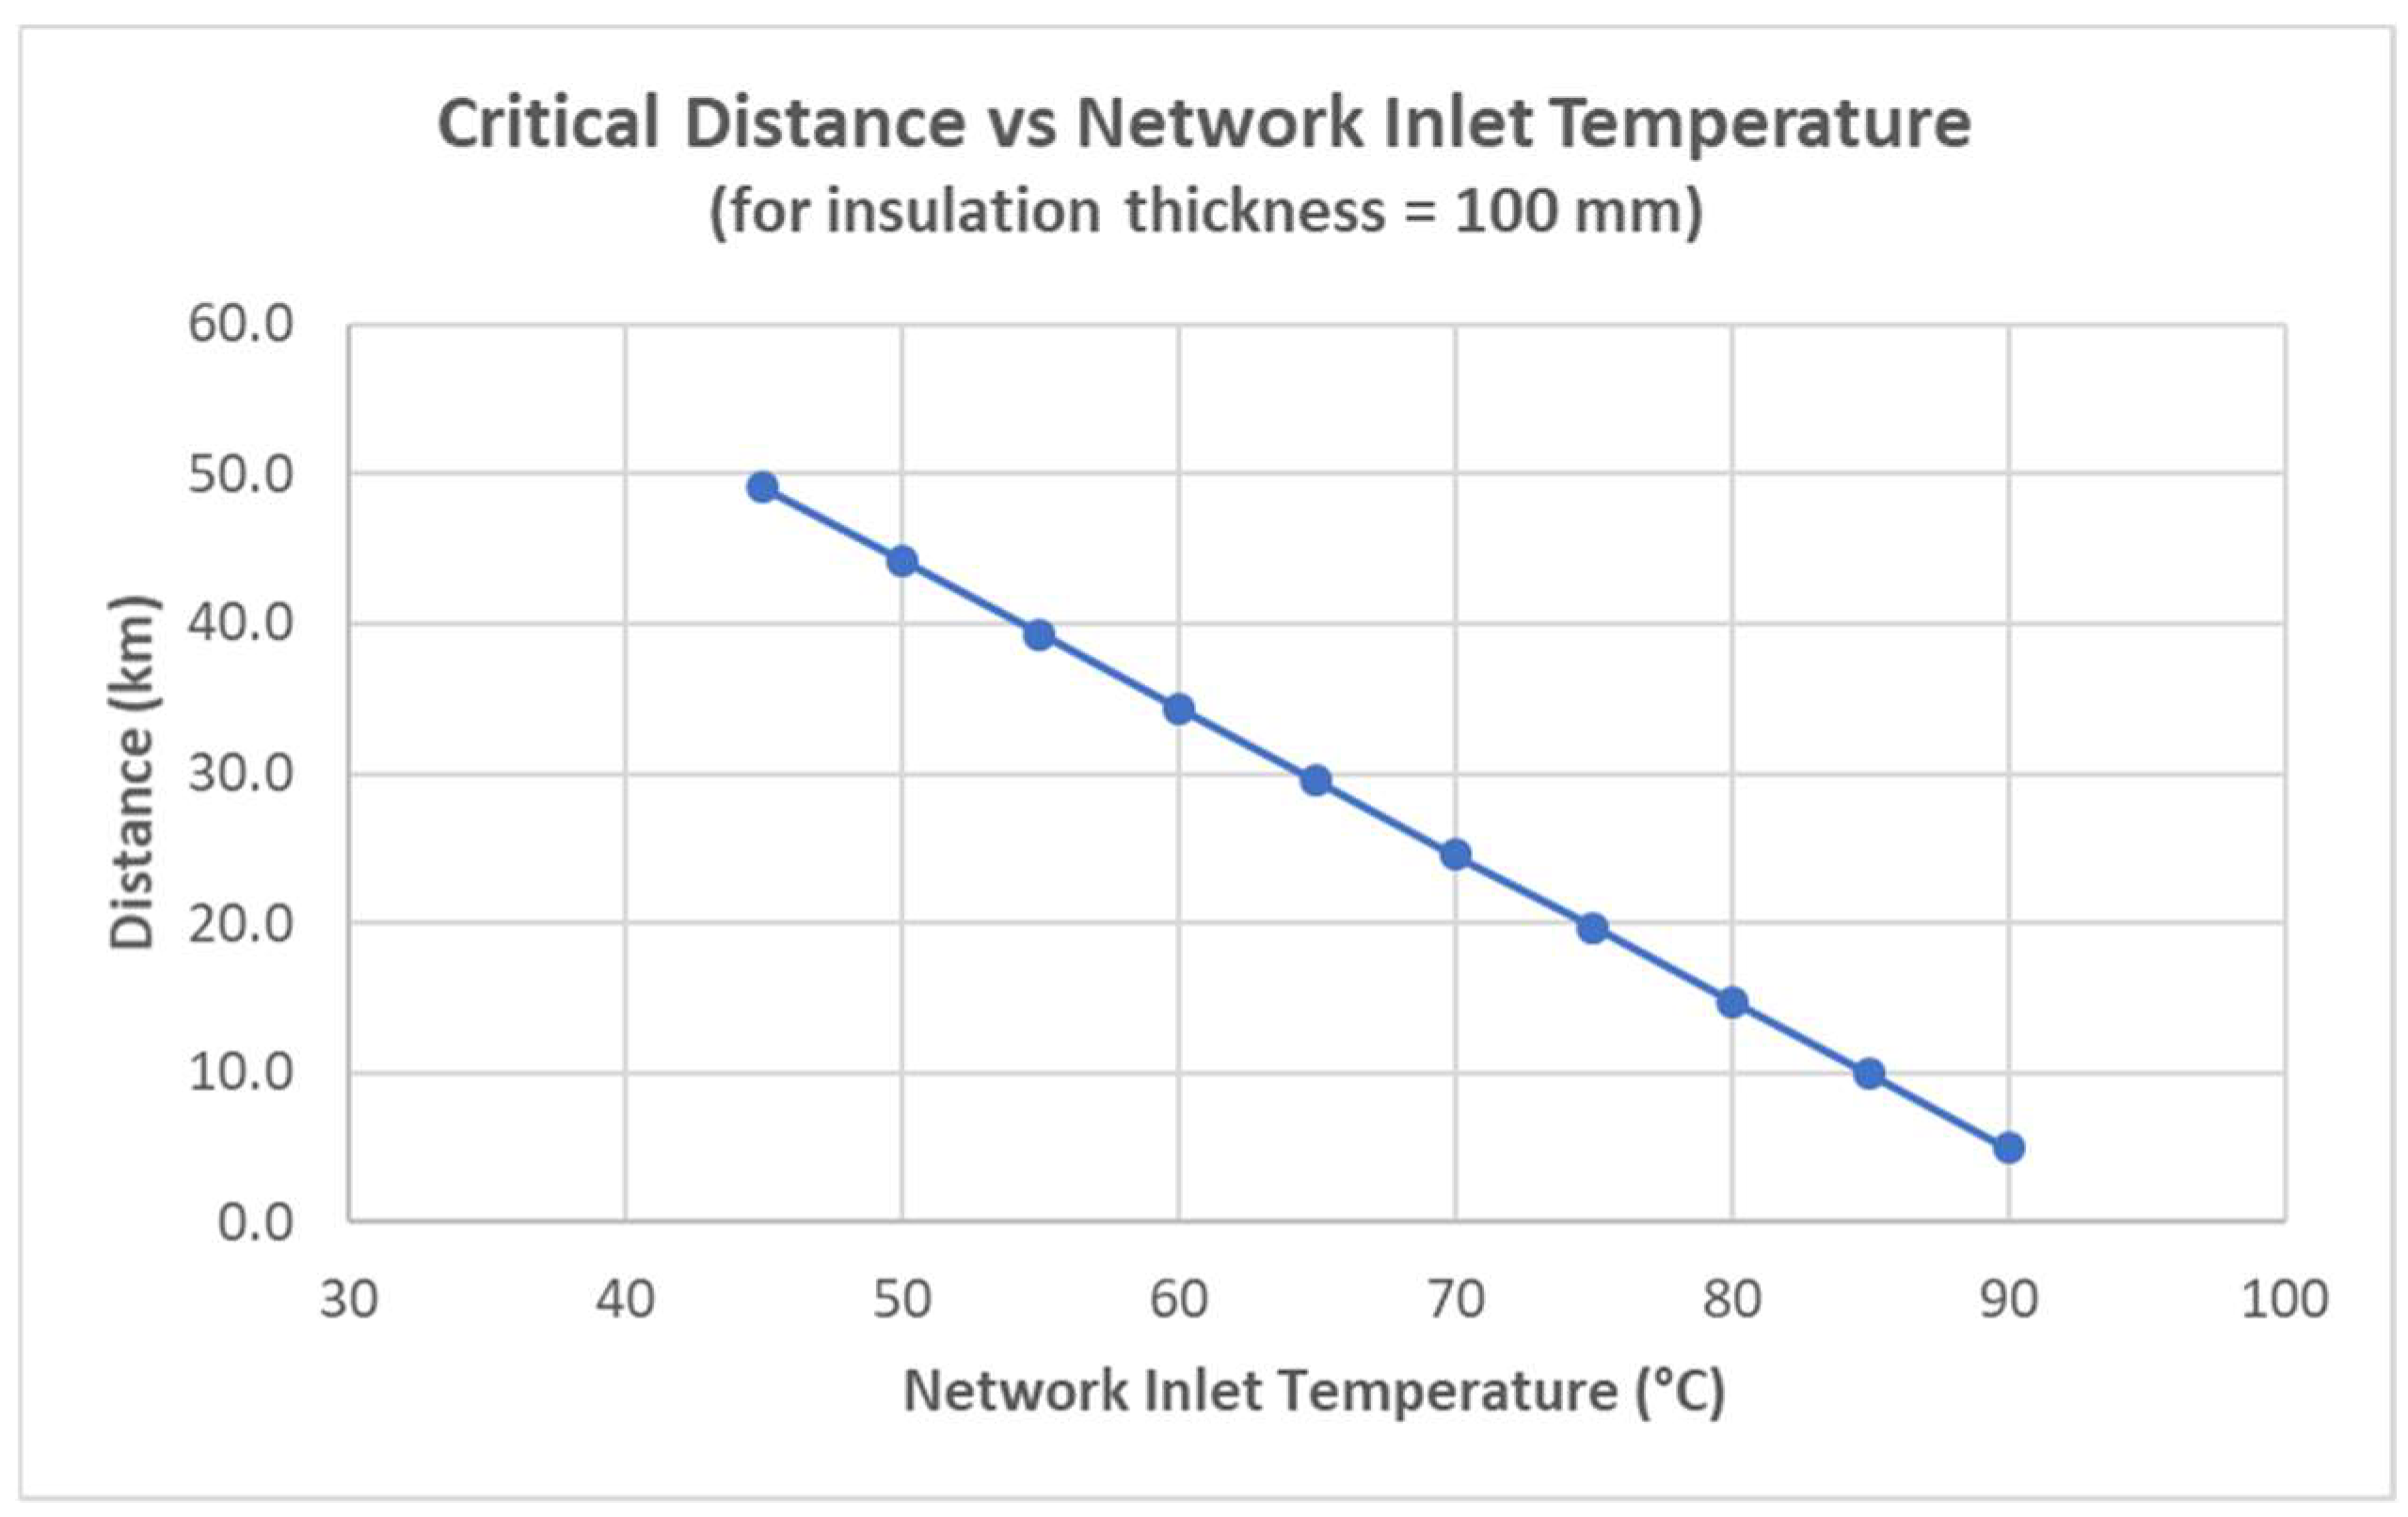
5.3. Long-distance Transport

Figure 18 shows the critical distance for water-based DH between excess heat supply and demand center as a function of warm fluid temperature at the inlet of the distribution network in the city. When considering an inlet temperature of 70 °C and a transmission pipe diameter of 600 mm with an insulation thickness of 100 mm, this distance cannot exceed 24 km. This imposes a limitation on the applicability of water-based DH, as some developed urban centers can lie further than 30 km from industrial or power-generation plants with exploitable excess heat potentials. On the other hand as mentioned previously, TCF technology faces no such limitation, since temperature drops during heat transmission poses no threat to the transported (latent) heat potential of the TCF in use. In our specific case for Hasselt, exploiting surplus heat potential from the Aurubis plant cannot be realized using conventional water-based DH.

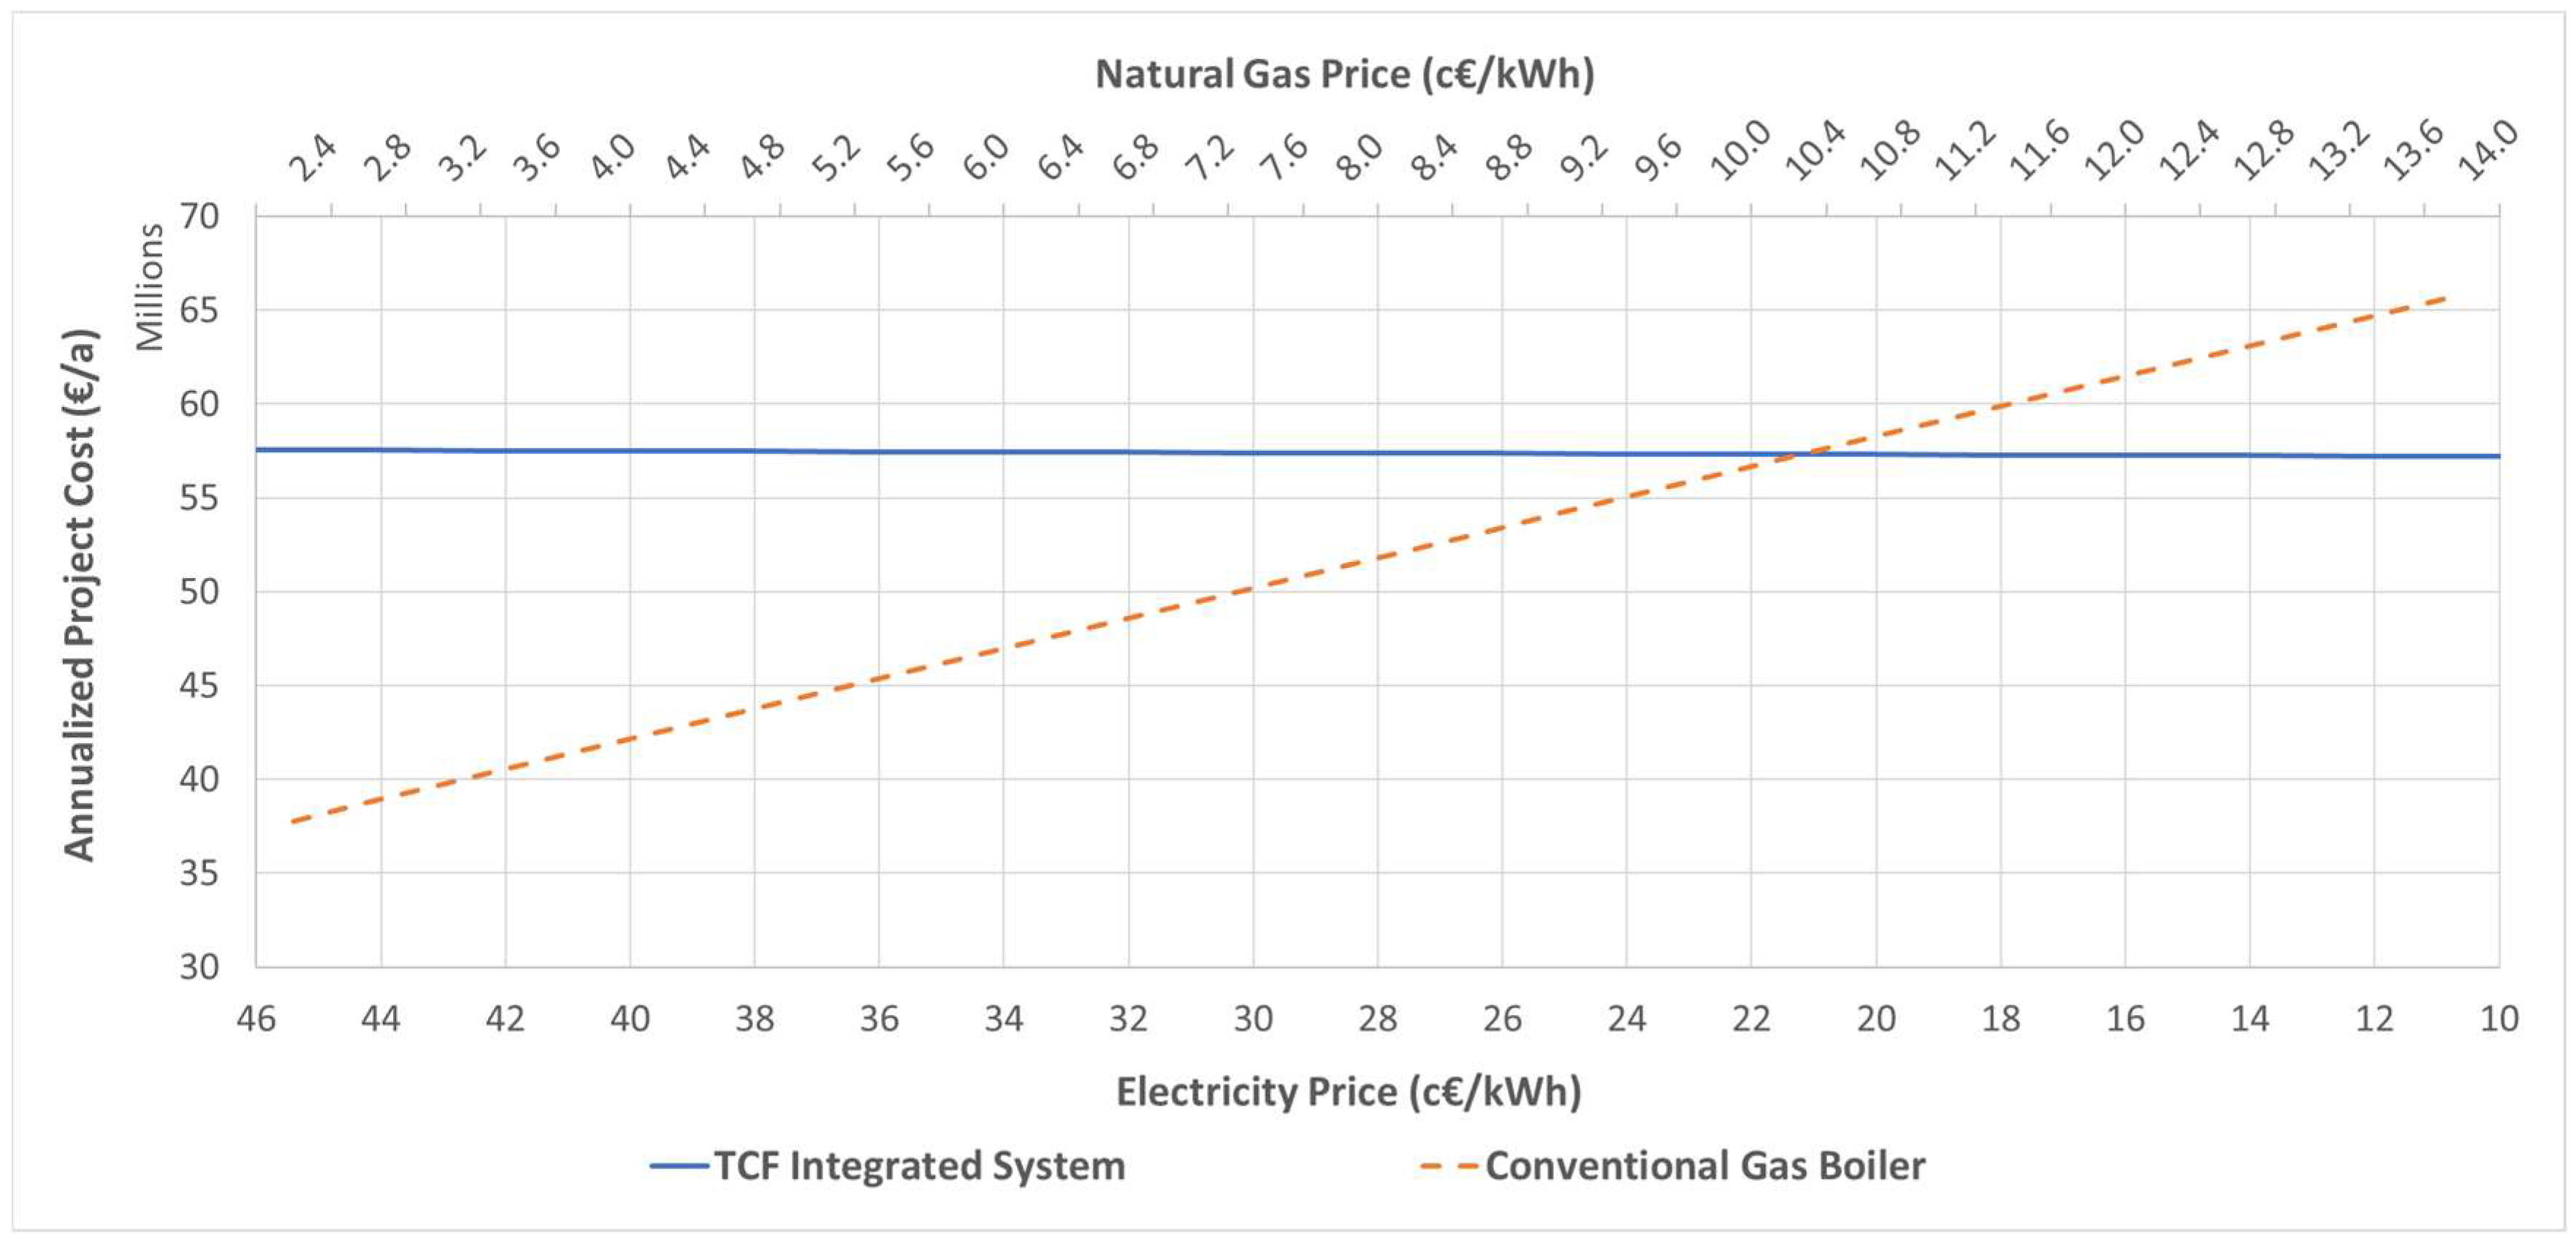
5.4. Favorable Market Conditions for TC Systems

We further looked into the market shifts needed regarding energy prices for better competitiveness between TCF technology and the well-established gas boiler technology. Figure 19 illustrates that for almost any electricity tariff, at a level of 11.7 c€/kWh for NG price the TCF technology and domestic gas boilers would equalize in terms of annualized project costs for Hasselt. That would represent and a 125% increase in NG price in Belgium. Such an NG price level can be seen in some countries such as Sweden, where our further analysis (not presented here) showed significant potential for TC integrated systems adoption in terms of economic advantage (62 M€/a for TC systems versus 69 M€//a for domestic boilers; assuming the hypothetical existence of a Hasselt-like city in Sweden, and using Swedish market conditions). Insensitivity of TC system to electricity tariff could be understood in light of electric energy consumption cost being overshadowed by other OPEX factors, namely maintenance and excess heat price and shipping cost price and shipping cost.
Certainly, all these results should not lead to overlooking one crucial parameter: the capital investment required upfront before any project rollout. This is where domestic gas boilers are the most competitive by a large margin among all technologies (35% lower capital investment than the other heating technologies). As CAPEX represents the main attractive factor for both investors and consumers, most studies considering economic evaluation between different heating technologies conclude that without a market or regulatory shift there will not be a significant adoption of low-carbon district systems for the existing building stock, especially in the residential sector [16].

6. Conclusions

In this paper, both simulation and economic evaluation studies were performed for a case study of a district in Hasselt, Belgium, to evaluate the economic and environmental potential of thermochemical networks. The simulation study was based on a large simulation model, using the Modelica language, of the integrated TC district heating network.
The simulation results demonstrated the benefit of using the hygroscopic and heating potential of TC technology. The heat-pump heating system usage was reduced to ~28% of the total supplied heat. However, the provided heat energy percentage is lowered when the heat demand of the building cluster is higher because of the use of the same size of absorber. As result, the required TCF amount per building cluster is decreased when the heat demand is higher as the heat pump usage is higher. The TCF network pumping energy is low since the network pump is required to work once or twice per day for only half an hour to fill up the TCF tank.
In the economic evaluation, a number of challenges were identified for the economic attractiveness of implementing integrated TC district heating. Urban sprawl of buildings drives initial capital investments and operating costs to economically unattractive levels compared to those of other heating technologies. Additionally, the complexity of in-house TC integrated systems and especially the operation of heat pumps offsets the expected benefits in terms of costs and environmental impact. However, integrated TC district heating still proves a viable and better option for the long-distance transport and storage of excess heat, compared to water-based DH systems. TC systems can also introduce significant reductions in CO2 emissions compared to heat pump and conventional boiler systems. Market and regulatory shifts have the potential to enable market penetration of TC district heating systems. Increasing natural gas prices, decreasing electricity residential tariffs, and extending emission trading system to the residential district will provide the required market situation to allow better economic attractiveness of less carbon-intensive heating technologies. Finally, TCF systems have both technical and economic advantage over water-based DH for long-distance transport of excess heat from supply centers to high-demand city areas. This became apparent from the maximum critical distance calculation for transmission pipeline of water-based district heating, and the marginal annualized distribution grid costs between the two systems.

Author Contributions

Conceptualization, M.D. and A.A.; Methodology, M.D. and A.A.; Software, M.D. and A.A; Validation M.D. and A.A Formal Analysis, M.D.; Investigation, M.D. and A.A Resources, M.D. and A.A.; Data Curation, M.D. and A.A.; Writing-Original Draft Preparation, M.D. and A.A.; Writing-Review & Editing, P.G. and M.D.; Visualization, M.D. and A.A.; Supervision, P.G.; Project Administration, M.D. and P.G.; Funding Acquisition, P.G.

Funding

The presented results originate from the project H-DisNet funded by the European Commission in the Horizon 2020 program under Grant No. 695780.

Conflicts of Interest

The authors declare no conflict of interest. The founding sponsors had no role in the design of the study; in the collection, analyses, or interpretation of data; in the writing of the manuscript; or in the decision to publish the results.

Abbreviations

DHWater-based district heating networks
CHPCombined Heat and Power
TCThermochemical
TCFThermochemical Fluid
GISGeographic Information System
DSODistribution System Operator
KPIsKey Performance Indicators
CAPEXCapital Expenditures
OPEXOperating Expenditures
EPREnergy Performance Rating
ETSEmission Trading System
PVCPolyvinyl Chloride
BEBelgium
DHWDomestic Hot Water
O&MOperation and Maintenance

Appendix A. Assumptions and Market Conditions used for the Economic Study

This section lists different assumptions and the figures used as market conditions and prices for the case study’s economic evaluation.
ItemUnitValue
Electricity Tariff for Households (Belgium)c€/kWh27.99
Natural Gas Price (Belgium)c€/kWh5.19
ETS Allowance Price (applied to residential sector)€/tCO220
Carbon Emissions from Energy Mix (Belgium)gCO2/kWh170
Carbon Emissions for Natural GasgCO2/kWh200
TC Network Heat Price for Consumerc€/kWh4
European Heating Index: Hasselt, Belgium-100%
Average Period of Daily Operation for Heating Systemh16
Household DHW yearly demandl/a35,040
Lifetime for TC System Absorbery15
Lifetime for TC Distribution Network Pumps and Fittingsy12
Lifetime for TC System Remaining Componentsy25
Heat Pump Lifetimey18
Domestic Gas Boiler Lifetimey20
Standalone Heat Pump SystemsCapacitykW8.3
Price8,755
TC Integrated System: Heat-Pumps for Low-demand Buildings ClusterCapacitykW5.4
Price5,660
TC Integrated System: Heat-Pumps for Medium-demand Buildings ClusterCapacitykW8.0
Price6,080
TC Integrated System: Heat-Pumps for High-demand Buildings ClusterCapacitykW6,4
Price5,700
Standalone Heat Pump: Chosen Model Price8857
TC Integrated System: In-House Component PricesAbsorber3500
Piping, fittings, and installation costs4000
Air ducts and installation2000
Air fan300
Insulated water storage300
Solar thermal collector (option 1)3000
Greenhouse (option 2)9000
Standalone Heat-Pump System: Component PricesPiping, fittings, and pump(s)4000
Radiators2400
Installation Costs8400
Domestic Gas Boiler: Component PricesPiping, fittings, and pump(s)4000
Gas Boiler4000
Radiators2000
Installation Costs7000
Water-Based District Heating: In-House Component PricesPiping, fittings, and pump(s)4000
Radiators2000
Installation Costs7000
Maintenance Activities Cost EstimationsIn-house Integrated TC Heating System€/a1000
Standalone Heat Pump Systems€/a1000
Domestic Gas Boiler Systems€/a850
In-house Heating System for Water-based DH€/a650
Distribution Network for DH Systems (water or TCF) as Percentage of Network CAPEX%3

References

  1. Heat om Renewable Energy Sources. Available online: https://ec.europa.eu/clima/sites/clima/files/eccp/second/docs/renewable_energy_srcs_heat_en.pdf (accessed on 1 December 2018).
  2. Ancona, M.A.; Bianchi, M.; Branchini, L.; Melino, F. District Heating Network Design and Analysis. Energy Procedia 2014, 45, 1225–1234. [Google Scholar] [CrossRef] [Green Version]
  3. Frederiksen, S.; Werner, S. District Heating and Cooling; Studentlitteratur AB: Lund, Sweden, 2013; ISBN 978-91-44-08530-2. [Google Scholar]
  4. Ertas, A.; Anderson, E.E.; Kiris, I. Properties of a new liquid desiccant solution—Lithium chloride and calcium chloride mixture. Solar Energy 1992, 49, 205–212. [Google Scholar] [CrossRef]
  5. Geyer, P.; Buchholz, M.; Buchholz, R.; Provost, M. Hybrid thermo-chemical district networks—Principles and technology. Appl. Energy 2017, 186, 480–491. [Google Scholar] [CrossRef]
  6. Modelica and the Modelica Association—Modelica Association. Available online: https://www.modelica.org/ (accessed on 16 November 2017).
  7. Davies, P.A.; Knowles, P.R. Seawater bitterns as a source of liquid desiccant for use in solar-cooled greenhouses. Desalination 2006, 196, 266–279. [Google Scholar] [CrossRef]
  8. Geyer, P.; Delwati, M.; Buchholz, M.; Giampieri, A.; Smallbone, A.; Roskilly, A.P.; Buchholz, R.; Provost, M. Use Cases with Economics and Simulation for Thermo-Chemical District Networks. Sustainability 2018, 10, 599. [Google Scholar] [CrossRef]
  9. Chung, T.-W.; Ghosh, T.K.; Hines, A.L. Comparison between Random and Structured Packings for Dehumidification of Air by Lithium Chloride Solutions in a Packed Column and Their Heat and Mass Transfer Correlations. Ind. Eng. Chem. Res. 1996, 35, 192–198. [Google Scholar] [CrossRef]
  10. Baetens, R.; De Coninck, R.; Jorissen, F.; Picard, D.; Helsen, L.; Saelens, D. Openideas-an open framework for integrated district energy simulations. In Proceedings of the International Building Performance Simulation Association, Hyderabad, India, 7–9 December 2015. [Google Scholar]
  11. Jensen, L.L.; Trier, D.; Cozzini, M.; Gómez-Uribarri Serrano, B. Analysis of Network Layouts in Selected Urban Contexts 2016. Available online: http://www.flexynets.eu/en/Results/Report-on-analysis-of-network-layouts-in-selected-urban-cont (accessed on 10 January 2019).
  12. Peta4—Heat Roadmap Europe. Available online: https://heatroadmap.eu/peta4/ (accessed on 5 January 2019).
  13. Paardekooper, S.; Lund, R.S.; Mathiesen, B.V.; Chang, M.; Petersen, U.R.; Grundahl, L.; David, A.; Dahlbæk, J.; Kapetanakis, I.A.; Lund, H.; et al. Heat Roadmap Belgium: Quantifying the Impact of Low-Carbon Heating and Cooling Roadmaps. 2018. Available online: http://vbn.aau.dk/files/287929422/Country_Roadmap_Belgium_20181005.pdf (accessed on 1 December 2018).
  14. Briones Alonso, L.; Geyer, P. Assessment of the Potential and Limitations of Hybrid District Heating Networks in Belgium; KU Leuven: Leuven, Belgium, 2017. [Google Scholar]
  15. Geopunt. Available online: http://www.geopunt.be/ (accessed on 6 December 2018).
  16. Poyry Energy (Oxford) Ltd. The Potential and Costs of District Heating Networks A Report to the Department of Energy and Climate Change; Poyry EnergyLtd.: Oxford, UK, 2009. Available online: https://webarchive.nationalarchives.gov.uk/20121205193015/http://www.decc.gov.uk/assets/decc/what%20we%20do/uk%20energy%20supply/energy%20mix/distributed%20energy%20heat/1467-potential-costs-district-heating-network.pdf (accessed on 6 December 2018).
  17. CO2 Emission Intensity. Available online: https://www.eea.europa.eu/data-and-maps/daviz/co2-emission-intensity-5 (accessed on 11 March 2019).
  18. Kaat, J.; Yoko, D.; Kristien, A.; Pascal, S.; Frederic, J.; Laurent, D. Energy Consumption Survey for Belgian households; EUROSTAT, VITO, ICEDD, and FPS Economy: Brussels, Belgium, 2012; p. 111. [Google Scholar]
  19. Sunikka-Blank, M.; Galvin, R. Introducing the prebound effect: The gap between performance and actual energy consumption. Build. Res. Inf. 2012, 40, 260–273. [Google Scholar] [CrossRef]
Figure 1. Equilibrium relative humidity vs. concentration mass solution [7] Equilibrium relative humidity vs. concentration mass solution.
Energies 12 01260 g001
Figure 2. (a) Absorption, and (b) desorption processes.
Energies 12 01260 g002
Figure 3. System model of the integrated space heating system and example results.
Energies 12 01260 g003
Figure 4. Integrated thermochemical (TC) district heating network parts.
Energies 12 01260 g004
Figure 5. Illustration of the air and thermochemical fluid (TCF) flow modes in the Modelica integrated space heating model.
Energies 12 01260 g005
Figure 6. Model and simulation approach of the Hasselt district integrated TC district heating network.
Energies 12 01260 g006
Figure 7. Screenshot of provided GIS data for natural gas consumption in the municipality of Hasselt.
Energies 12 01260 g007
Figure 8. (a) TCF mass flow per building cluster, and (b) total TCF mass flow of the integrated TC district heating network.
Energies 12 01260 g008
Figure 9. TCF mass per building cluster.
Energies 12 01260 g009
Figure 10. Provided heating energy/thermochemical potential percentage per cluster by both heating systems, TC system and heat-pump system.
Energies 12 01260 g010
Figure 11. Total provided heating energy/thermochemical potential percentage by both heating systems of the integrated TC district heating network.
Energies 12 01260 g011
Figure 12. Illustration of the Hasselt district integrated TC heating network.
Energies 12 01260 g012
Figure 13. Total pumping energy and total TCF mass of the integrated TC district heating network.
Energies 12 01260 g013
Figure 14. Total pumping power of the integrated TC district heating network during 4 days of January.
Energies 12 01260 g014
Figure 15. Indoor/outdoor air temperatures, air temperatures before/after the absorption, and total air temperature provided to the building during two days.
Energies 12 01260 g015
Figure 16. Relative humidity of indoor air and air relative humidities before/after the absorption.
Energies 12 01260 g016
Figure 17. Different buildings clusters identified in the city of Hasselt according to energy performance rating (EPR).
Energies 12 01260 g017
Figure 18. Critical distance between excess heat supply and demand for water-based district heating (DH) as a function of distribution network inlet temperature.
Energies 12 01260 g018
Figure 19. Sensitivity of annualized project cost for TCF system and gas boilers with electricity and natural gas prices, respectively.
Energies 12 01260 g019
Table 1. Buildings Characteristics within the Chosen District, with their Categorization within the Identified Buildings Clusters.
ClusterNo. of BuildingsVolume (m3)Heat Demand (MWh)Specific Heat Demand (kWh/m2a)
Low13457.5105.7
Medium548912147.2
High634610352.3
Table 2. Results for economic evaluation and comparisons between the different heating technologies considered.
ParameterTCF SystemStandalone Heat-PumpsDomestic Gas BoilersWater-based District Heating
Annualized Costs (M€/a)616844.543
Cost Deviations (%)-+11.4−27−30
CO2 Emissions (tCO2/a)2,33211,40048,400417
Emissions Deviations (%)-+390+1,974−86
Energy Consumption (GWh/a)13.7
(electric)
67
(electric)
242
(primary)
1.9
(electric)
Energetic Deviations (%)-+389N/A−82
Table 3. OPEX, Annualized Project Costs and their Ratios and Cost Driving Factors for the Heating Technologies considered. O&M stands for Operation and Maintenance.
ParameterTCF SystemsStandalone Heat-PumpsDomestic Gas BoilersWater-Based District Heating
OPEX
(M€/a)
34.53725.616.8
Annualized Costs
(M€/a)
616844.543
OPEX-to-Annualized Costs (%)56.454.557.639
Cost Driving Factors for OPEX
(%)
In-house Integrated Heating Systems O&M
(51%)
Electric Power Consumption
(51%)
Fuel Costs
(46%)
In-house Heating Systems O&M
(54%)
Supply Side (Excess Heat Price & Shipping from Supply)
(39%)
Yearly Maintenance
(49%)
Yearly Maintenance
(44%)
Distribution Network Maintenance
(32%)
Cost Driving Factors for CAPEX
(%)
In-house Integrated Heating Systems Components
(62%)
Heating System Components
(68%)
Heating System Components
(59%) Installation Costs of System Components
(41%)
Distribution Network
(Piping & Pumps)
(49%)
Distribution Network
(Piping & Pumps) (28%)
In-house Heating System Components
(22%)
Table 4. Distribution network costs for high-demand and low-demand areas in Hasselt.
ParameterHigh-demand AreasLow-demand Areas
Heat Demand covered (GWh/a)13923
CAPEX (M€)Water-Based District Heating3458
TC Network2955
OPEX (€/a)Water-Based District Heating218,00028,000
TC Network34,00027,800
Annualized Marginal CAPEX (€/MWh.a)Water-Based District Heating18256
TC Network15244
PETA 4.3 Estimation (for Hasselt)Between 18 and 54
(5–15 €/GJ.a)

