Immediate and Delayed Effects of Severe Winds on an Old-Growth Forest in Kentucky: A Forty-Year Retrospective

1
Department of Biology, Rider University, Lawrenceville, NJ 08648, USA
2
Department of Biology, Saint Peter’s University, Jersey City, NJ 07306, USA
3
Department of Biology, Southern Arkansas University, Magnolia, AR 71753, USA
4
Department of Biology, Thomas More University, Crestview Hills, KY 41017, USA
*
Author to whom correspondence should be addressed.
Forests 2019, 10(3), 271; https://doi.org/10.3390/f10030271
Submission received: 22 February 2019
/
Revised: 13 March 2019
/
Accepted: 15 March 2019
/
Published: 19 March 2019
(This article belongs to the Section Forest Ecology and Management)
Abstract
:Wind disturbance is an important factor that can affect the development of the forests of the Central Hardwood Region of the United States. However, there have been few long-term studies of the recovery of these systems following wind damage. Long-term studies of protected forest systems, such as Dinsmore Woods in Northern Kentucky, within the fragmented forest of this region are valuable as they provide a resource to document and understand the effect of both abiotic and biotic challenges to forest systems. This study is a 40-year analysis of both overstory and understory changes in the forest system at Dinsmore Woods as the result of damage caused by severe winds in the spring of 1974. The forest was surveyed before and immediately following the windstorm and then at 10-year intervals. Although the windstorm had an immediate effect on the forest, the pattern of damage was complex. The forest canopy (diameter at breast height (DBH) ≥ 30 cm) experienced an irregular pattern of damage while in the subcanopy (DBH ≤ 30 cm) there was a 25% reduction in total basal area. However, the major effects of the windstorm were delayed and subsequently have altered forest recovery. Ten years following the disturbance declines were seen in total density and basal area in the canopy and subcanopy of the forest as a consequence of windstorm damage. In the past 20 years the total basal area of the canopy has increased and exceeds the pre-disturbance total basal area. In contrast, the subcanopy total basal area continued to decline 20 years post-disturbance and has not recovered. Further openings in the canopy and subcanopy due to the delayed windstorm effects helped to establish a dense understory of native shrubs and sugar maple which have affected tree regeneration and is reflected in the continual decline in species diversity in the subcanopy and sapling strata over the 40-year period.
1. Introduction
The Central Hardwood Region (CHR) of the United States is a significant reservoir of biodiversity, carbon storage/flow and productivity [1,2,3]. As part of the CHR, the forests of Kentucky are ecologically diverse in composition and structure. Braun [4] placed Kentucky into two major forest regions, the Mixed Mesophytic Forest in the eastern part of the state and the central and western regions of the state in the Western Mesophytic Forest. One of the unique physiographic regions within Braun’s Western Mesophytic Forest is the area affected by the Illinoian Glaciation which extended into Northern Kentucky. Thus, in part because of its glacial history, this region of the state is distinct geologically and edaphically, in contrast to the rest of the state which was largely unglaciated [5,6]. This area of the Commonwealth supports a range of forest community types [7,8]. One of these forest communities is Dinsmore Woods State Nature Preserve, a 43.3 ha, late successional stage hardwood forest in Northern Kentucky. In 1973, two of the authors (Bryant and Held) initiated a study to characterize the composition and structure of Dinsmore Woods. This forest was considered fairly undisturbed (no known commercial logging) since at least the 1830s, except for removal of dead chestnut trees after the blight in the late 1930s. On 3 April 1974 an F5 tornado moved through Northern Kentucky near Dinsmore Woods. Although the forest was not in the direct path of the tornado, a resurvey of the forest shortly after the storm reported trees that were uprooted and damaged resulting in small gaps from crown damage as well as single-tree and multiple-tree gaps [9].
Although there have been studies on the impact of tornado and severe wind damage on forest composition and structure in the United States, to our knowledge none of these studies have monitored long-term (decades) forest (overstory and understory) changes following such disturbances [10,11,12]. The reviews by Everham and Brokaw [13] and Peterson [14] indicated that long-term studies on forest recovery after wind disturbances were needed. In addition, recent studies have noted the importance of understanding fine or stand scale dynamics in response to windstorm disturbances [15,16].
A 1985 survey of Dinsmore Woods (11 years after the windstorm) indicated the forest was still in flux post-disturbance and that longer-term study was required [17]. Two more surveys of the forest were conducted in 1994 and 2004 [18,19]. In 2014 we completed the final survey of this site. Our previous reports on forest composition and structure at this site largely described decadal or incremental changes. In this paper, we present a synthesis of what we have learned in this 40-year study of forest change including data from the 2014 survey. Our approaches to this final analysis and summary are as follows:
- An analysis and comparison of the temporal changes in forest structure and composition by canopy, subcanopy, saplings and seedlings. This classification approach is different than what we have used in previous reports and enabled us to identify more clearly the changes and recovery in forest composition and structure over time.
- A more comprehensive comparison of the canopy and subcanopy of the forest pre-disturbance (1973) and immediately post-disturbance (1974). This analysis allowed us to determine more directly the effects of wind damage on the forest canopy and subcanopy. In previous reports, we did not include the complete survey data of the forest canopy and subcanopy done prior to the 1974 windstorm.
2. Materials and Methods
2.1. Study Site
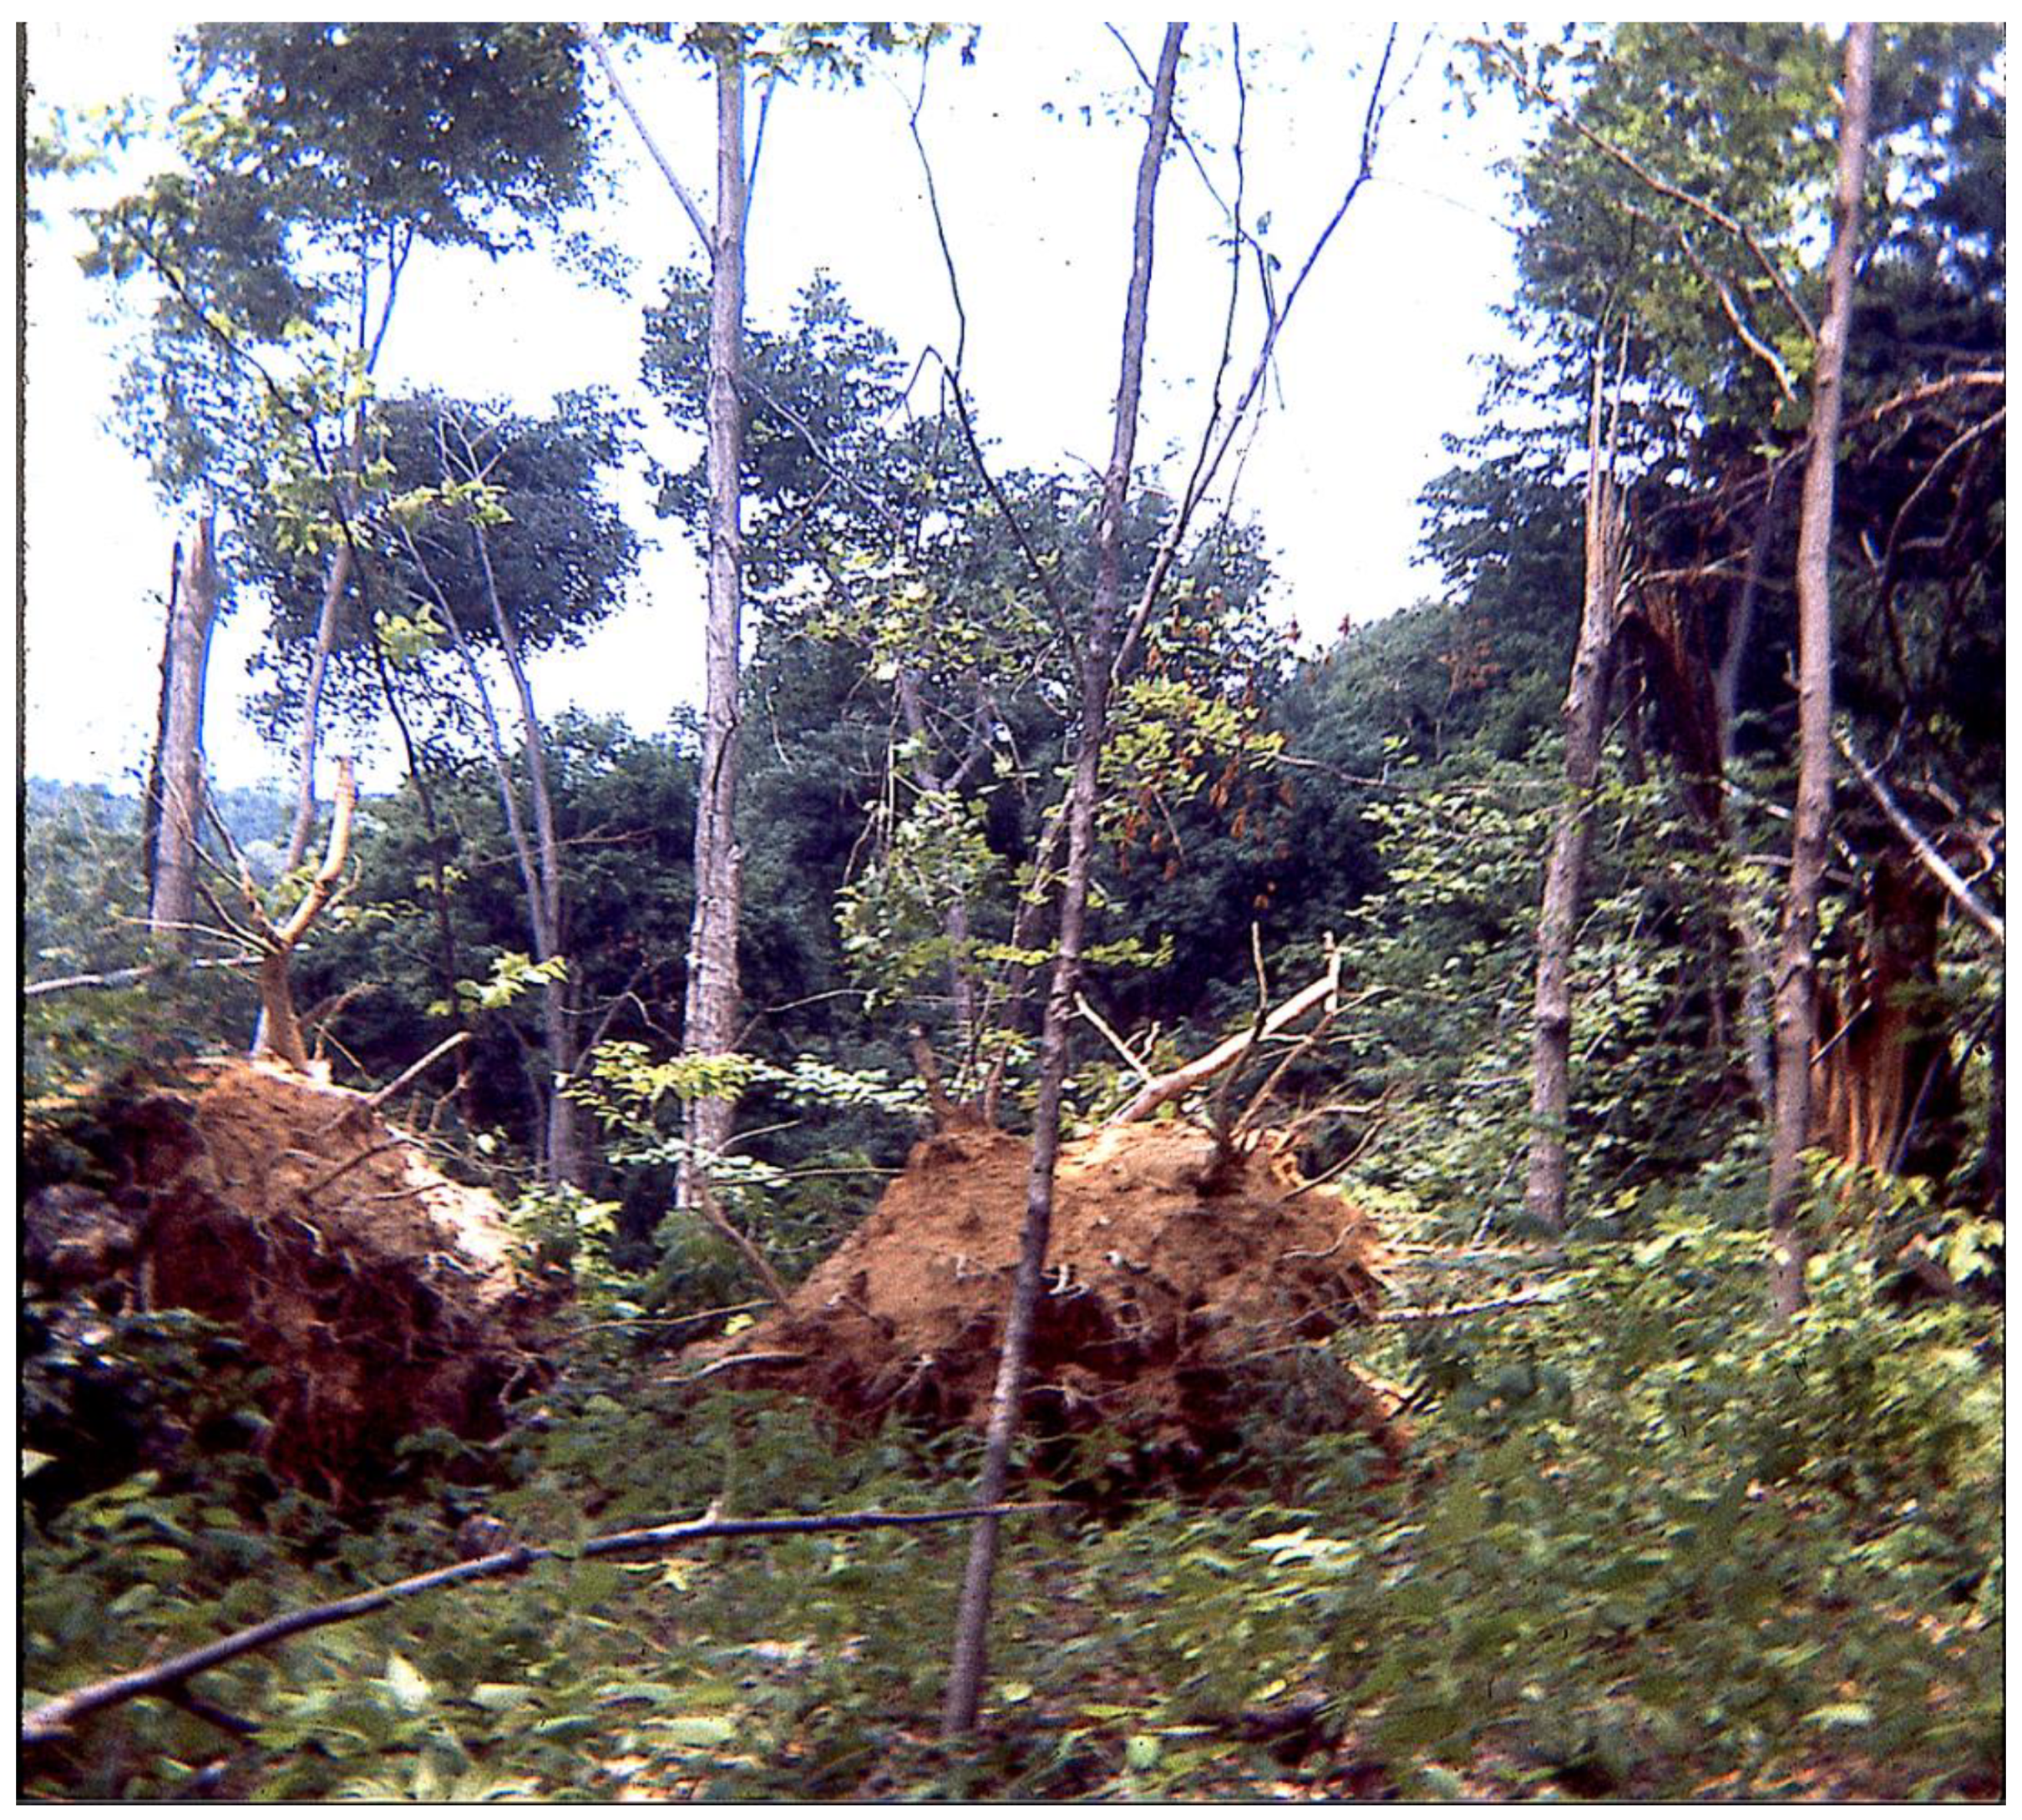
Dinsmore Woods is located in western Boone County, Kentucky (38°59′54″ N, 84°48′51″ W). The forest occupies moderate to steep slopes 220–250 m above the floodplain of the Ohio River. The bedrock of Boone County is primarily Ordovician limestone and shale which is covered by Illinoian glacial till deposits with localized areas of Kansan glacial till [6,21]. This area of Kentucky has an average January minimum temperature of −6.11 °C, an average July maximum temperature of 30 °C and an average total annual precipitation of 108.15 cm [22]. However, on 3–4 April 1974, there was a Super Outbreak of tornadoes that affected portions of Kentucky as well as several surrounding states. One of the tornadoes that moved through Northern Kentucky near Dinsmore Woods was subsequently rated an F5 tornado on the Fujita scale [23]. Based on information in the database, the track of this F5 tornado was approximately 1.3 km northwest of Dinsmore Woods and as a result the forest sustained windstorm damage (Figure 1) [9,23].
Until April 1974 there were no historical records or other indications of any significant modification of the site since the land was obtained by private ownership in the early 1830s. The Nature Conservancy recognized the uniqueness of Dinsmore Woods when the land was donated to the Conservancy in 1985. In 1990 the Conservancy and the Kentucky State Nature Preserves Commission dedicated Dinsmore Woods as a State Nature Preserve. Currently, Dinsmore Woods is owned and managed by the Boone County Parks System in cooperation with Kentucky State Nature Preserves Commission. Braun [4] described the forests of this region as Oak-Maple-Ash. A 1973 (pre-tornado) survey of Dinsmore Woods was consistent with the Oak-Maple-Ash classification [24].
2.2. Methods
All surveys were conducted in late May/early June or July of each survey year. In all surveys, nested circular plots randomly located along transect lines (3–4) were used. The transects in all surveys encompassed the entire range in topography of the forest. In 1973, species and diameter at breast height (DBH = 1.3 m above ground) of trees with a DBH ≥ 10 cm were recorded in a total of 14 plots of 0.04 ha in plot size. In 1974, following the windstorm, a total of 23 plots of 0.125 ha plot size were sampled. Fifteen 0.04 ha plots were surveyed in 1985, 1994, 2004 and 2014. We were not able to establish permanent plots at this site, however the plots sampled in subsequent surveys were located as close as possible to the 1974 plots and were within 20 m of the original transect lines used for placement of the 1974 circular plots. Seedlings and saplings were recorded in plots nested within the tree plots for the five sample dates (saplings and seedlings were not recorded in 1973). In 1974 seedling and sapling plots were 0.031 and 0.062 ha, respectively. For all subsequent surveys, seedling plot size was 0.004 and 0.01 ha for saplings.
Four classes of strata were used for analysis: canopy, subcanopy, saplings and seedlings. Trees were classed as canopy (≥30 cm DBH) and subcanopy (10–29.9 cm DBH). Seedlings included all stems with heights 15 cm to 1.4 m. All saplings had heights greater than 1.4 m (≤9.9 cm DBH). Nomenclature follows Fernald [25]. The following calculations for the canopy and subcanopy were done for each survey period: (a) total density (trees/ha), (b) species density by diameter class, (c) species relative density, (d) total basal area (m2/ha), (e) species basal area (m2/ha), (f) species relative basal area. An importance percentage was determined for each species by summing the relative density and relative basal area and then, dividing by two. The importance percentage is a reflection of the dominance of a species in the forest. For saplings and seedlings, density (# of stems/ha), relative density and relative frequency were determined for each survey period. Shannon diversity indices (species diversity) were calculated for each class of woody vegetation (canopy, subcanopy, saplings, seedlings) for each survey time.
3. Results
3.1. Overstory—Canopy and Subcanopy
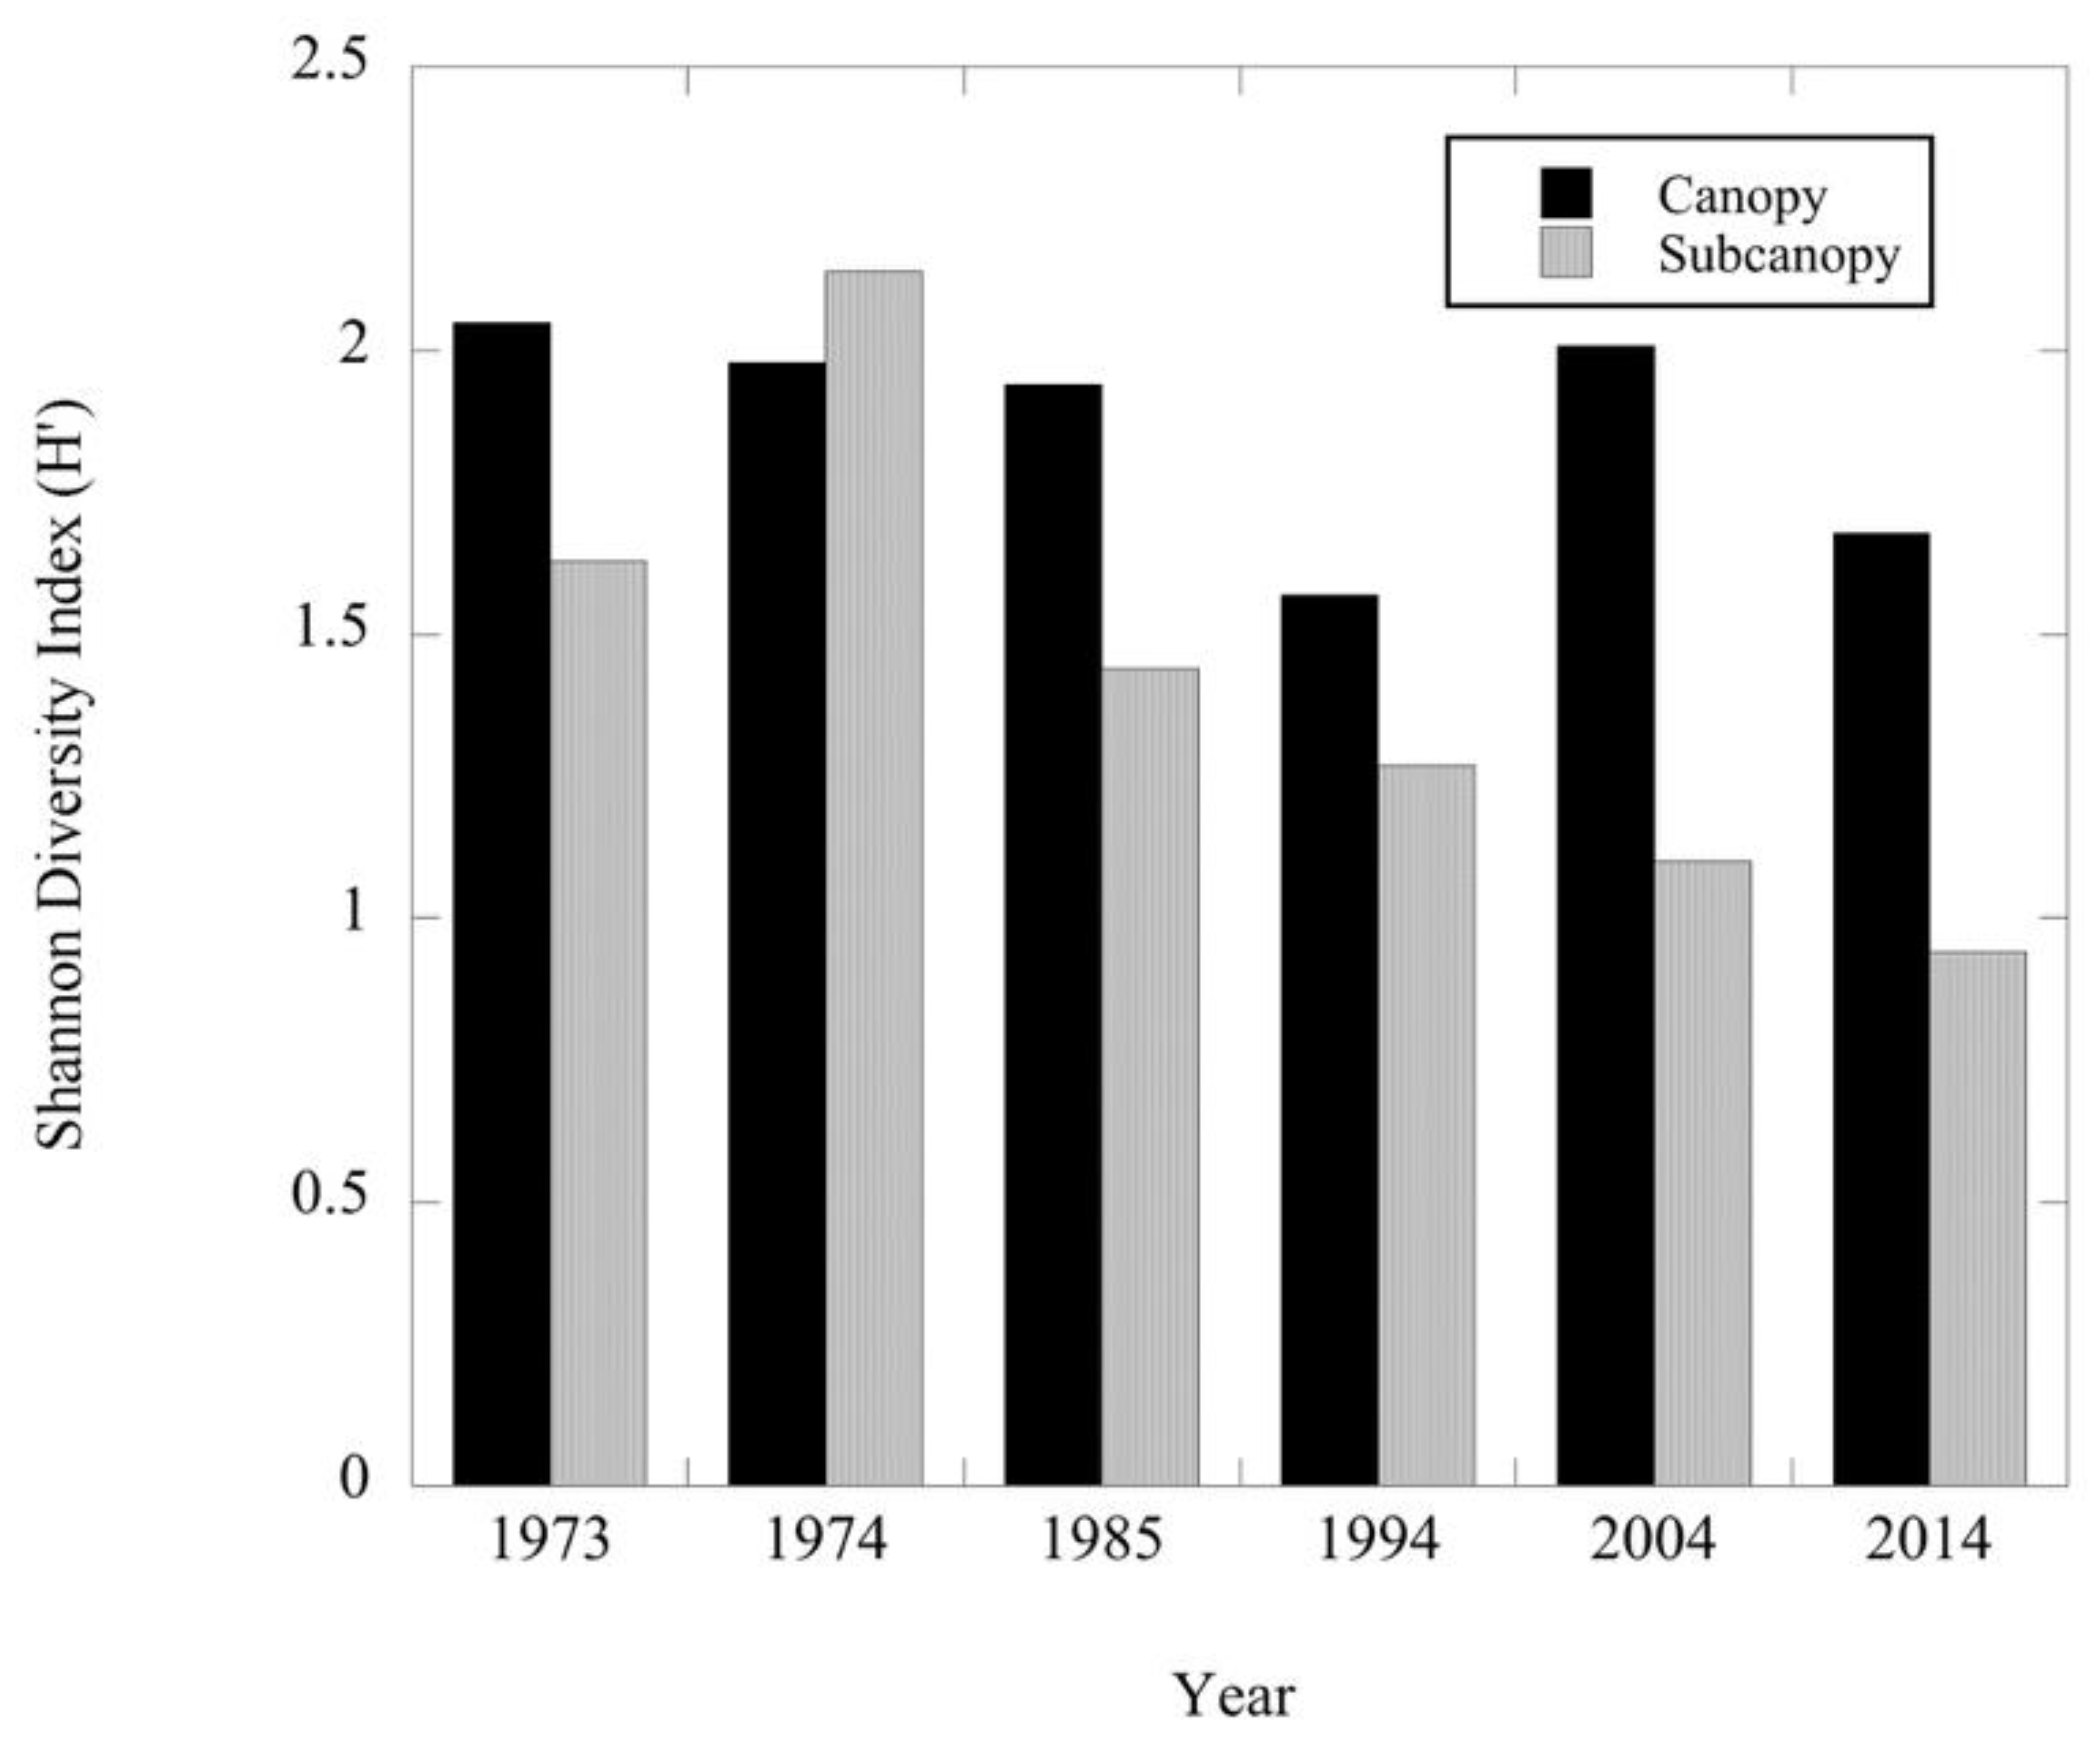
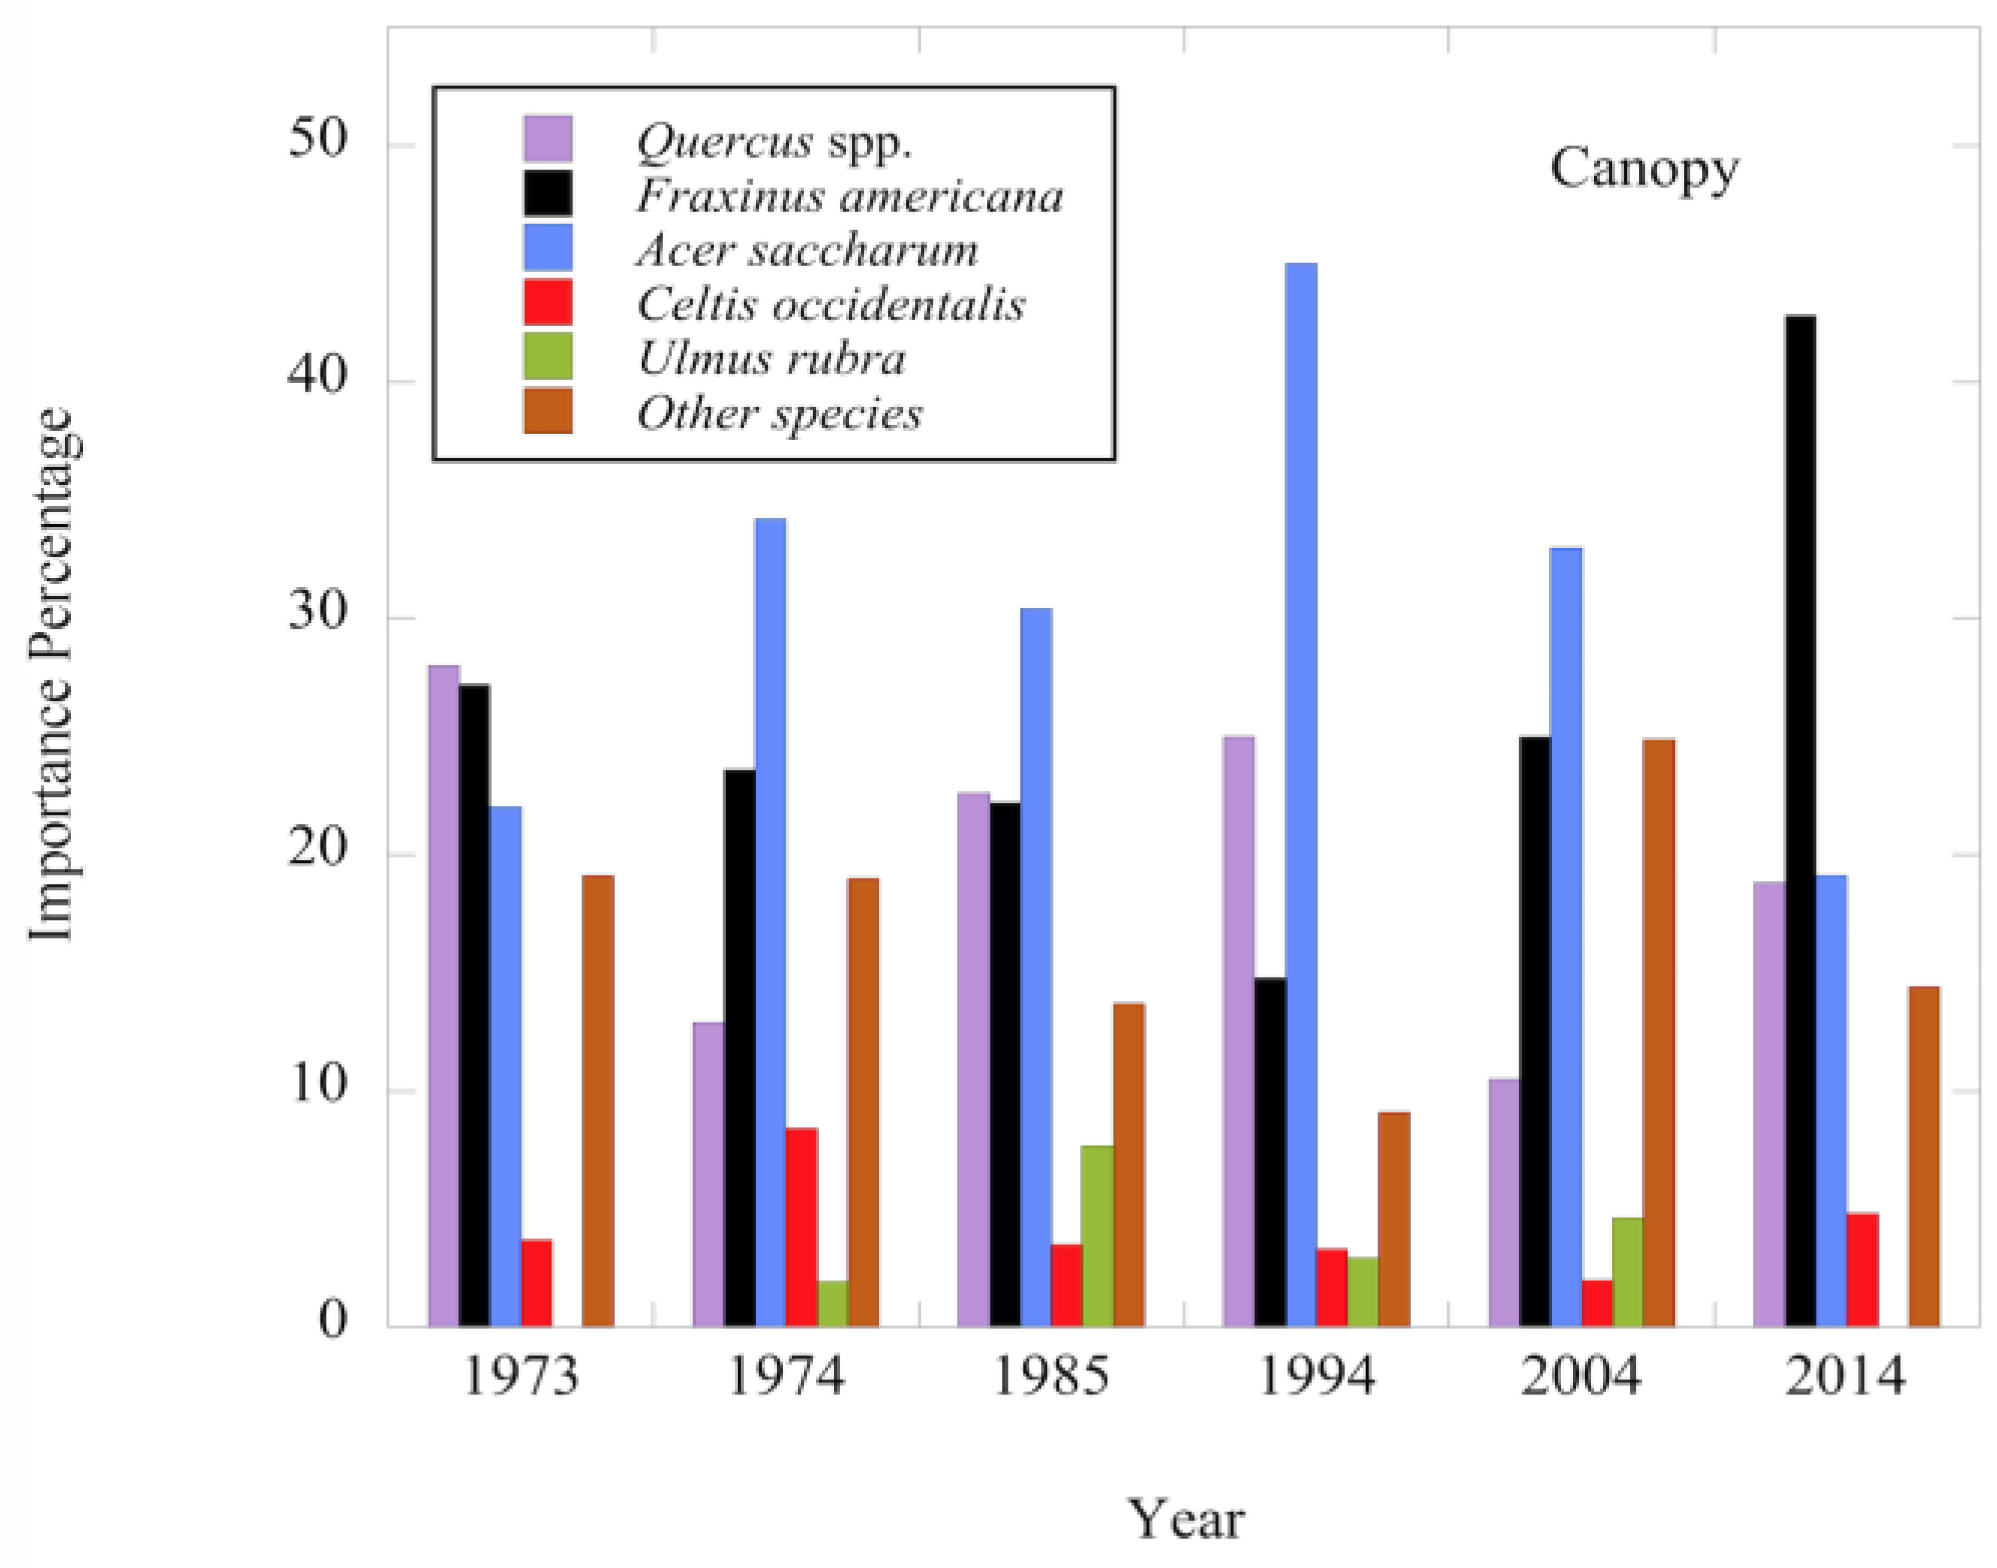
The Shannon diversity index of the canopy layer has fluctuated over the 40-year period with no consistent change (Figure 2). The total density of the canopy was lower in the 1985 and 1994 surveys compared to 1973 and 1974, but since 1994 total density has increased (Table 1). Total basal area/hectare of the canopy has also increased since 1994 and exceeds the pre-disturbance total basal area (Table 2). The total density and basal area changes were further analyzed by examining species- specific changes in density by diameter class and the corresponding species basal area. The three dominant tree species in the canopy in 1973 were Acer saccharum (sugar maple), Fraxinus americana (white ash) and Quercus spp. (oak spp.). Since 1973, no consistent pattern of changes in density and basal area of sugar maple have been observed (Table 1 and Table 2). Overall, the distribution pattern of canopy-level diameter size classes for sugar maple in 2014 was very similar to the pre-disturbance pattern of 1973 with a shifting in numbers between the larger diameter classes in the intervening 40-year period (Figure 3). In contrast to sugar maple, white ash continued to decline post-disturbance in both density and basal area through 1994 (Table 1 and Table 2). However, in the 20 years since then, white ash has increased its dominance in the canopy as a result of increases in the number of larger diameter trees (≥40 cm DBH) (Figure 4 and Figure 6). The density and basal area of oak spp. decreased immediately post disturbance due primarily to a decrease in the density of trees in the ≥40 cm DBH size class (Table 1 and Table 2; Figure 5). However, oak spp. have continued to be a significant component of the canopy in 2014 due to the presence of larger trees (Figure 5 and Figure 6). Celtis occidentalis (hackberry) is a smaller component of the canopy as is Ulmus rubra (slippery elm) which was not recorded as part of the canopy in the 2014 survey (Table 1 and Table 2). Other species have persisted as minor components of the canopy over the 40-year period (Table 1 and Table 2; Figure 6).
Unlike the canopy, subcanopy species diversity has decreased since 1974 (Figure 2). This decline in diversity has been due to the loss of the minor constituent species of the subcanopy as well as a decrease in density of major constituents like hackberry, slippery elm and white ash (Table 3). Additionally, oak spp. and slippery elm were not recorded as part of the subcanopy in 2014. Similarly, total density and basal area of the subcanopy has declined over the past 40 years (Table 3 and Table 4). In the subcanopy, sugar maple was the most abundant species. Immediately following the windstorm (1974) sugar maple density and basal area decreased, but by 1985 both the density and basal area of this species had returned to pre-disturbance levels and has remained fairly constant through 2014 (Table 3 and Table 4; Figure 3). White ash, hackberry and slippery elm had fewer individuals recorded in the 20–29.9 cm DBH size class in 1974 as compared to 1973, thus contributing along with sugar maple to the overall decrease in basal area in the subcanopy immediately post-disturbance (Table 4; Figure 4, Figure 7 and Figure 8). White ash and hackberry continued to decline in density and basal area through 1985, but in subsequent surveys these species showed some recovery in terms of density and basal area but not to pre-disturbance levels (Table 3 and Table 4; Figure 4 and Figure 7). In contrast, slippery elm declined in overall density and basal area from 1994 to 2014 when it was not recorded in the subcanopy. Oak spp. showed a similar pattern of decline in the subcanopy (Table 3 and Table 4; Figure 5). With the decline in both density and basal area in oak spp., white ash, hackberry and slippery elm, sugar maple has increased its dominance in the subcanopy following the disturbance (Figure 9).
3.2. Understory—Saplings and Seedlings
Similar to the subcanopy, sapling diversity has declined since 1974 (Figure 10). In 1974 there were 19 species recorded compared to only six species in 2014. While total sapling density has decreased since 1985, there is much variation in the total density values across the 40-year period (Table 5). Sugar maple was the most abundant species in the sapling class over the 40-year period (Table 5). The number of sugar maple saplings increased after the 1974 disturbance. However, relative density of this species has been declining since 1994 (Table 5). Other species such as oak spp. and white ash were absent in the sapling layer since 1985 and 1994, respectively. Hackberry sapling density fluctuated over time while slippery elm has continued to decline in density over the 40-year period as did other species. In contrast, since 1974 Asimina triloba (pawpaw) and Lindera benzoin (spicebush) have increased in density in this class. This increase in density and relative frequency was more consistent for spicebush than pawpaw. Additionally, Lonicera maackii (Amur honeysuckle) became an important component of this understory class in 2014 (Table 5).
Although the Shannon diversity index for seedlings has fluctuated over time, species richness has declined over the 40-year period since the disturbance. In 1974 there were 18 species of woody seedlings present in the understory in contrast to the 2014 survey where only 11 species were recorded (Figure 10). This decline in species richness was most pronounced by 1994 (10 species) and has remained near this level in 2004 and 2014. The total density per hectare of seedlings increased after 1974 although there has been fluctuation in the density over time (Table 6). Sugar maple has been the most abundant tree seedling throughout the 40-year period (Table 6). White ash decreased in relative seedling density since 1974 but continues to persist in the seedling class with oak spp., hackberry, slippery elm and other species. Since 1985, the seedling layer has been dominated by sugar maple, spicebush and pawpaw (combined RD 61.9%–72%). The 2014 survey indicated that the invasive Amur honeysuckle had become a significant component of the understory and to a lesser extent, Rosa multiflora (Table 6).
4. Discussion
4.1. Immediate Windstorm Effects
The pattern of damage immediately following the 1974 windstorm at Dinsmore Woods was complex. After examining species-specific changes in the density in the different diameter classes and basal area, the pattern of damage seemed to be unrelated to specific tree size or species. For example, Quercus spp. (oaks) which had a significant proportion of larger diameter (≥40 cm) trees prior to the storm appeared to be the species in the canopy most affected by the windstorm of 1974 with decreases in both density and basal area (Table 1 and Table 2; Figure 5). In contrast to the oak species, the disturbance seemed to have had no immediate effect on Fraxinus americana (white ash) and Acer saccharum (sugar maple) in the canopy class (Table 1 and Table 2; Figure 3 and Figure 4). In 1973 however, the subcanopy density of sugar maple was higher than in the canopy. Immediately following the disturbance (1974), sugar maple density and basal area decreased due to the reductions in the number of individuals in both subcanopy diameter classes (10–19.9 and 20–29.9 cm) (Table 3 and Table 4; Figure 3). White ash, Celtis occidentalis (hackberry) and Ulmus rubra (slippery elm) also had fewer individuals in the 20–29.9 cm diameter class immediately post-disturbance (Figure 4, Figure 7 and Figure 8). The decreases in sugar maple, white ash, hackberry and slippery elm account for most of the overall decrease in subcanopy basal area post disturbance (Table 4). Thus, our study indicated no clear relationship between tree size and immediate windstorm damage.
An explanation of the pattern we observed may be the variation in the intensity of the windstorm and the effects of trees being damaged by other trees toppling and breaking. Peterson [10] compared two tornado events, that differed in intensity, on the same old growth forest and found differences in the extent of damage and recovery depended on the intensity of the disturbance. In the less intense windstorm event, Peterson [10] found little change in either canopy species composition or diversity. Similarly, we found little change in diversity in the canopy and subcanopy immediately post-disturbance. In a study of two forests affected by windstorms, Webb [26] indicated that indirect damage of trees by other falling trees may produce a pattern with no relationship to tree size. Canopy breakage and toppling may have contributed to the decline in the subcanopy of sugar maple and other species immediately post-disturbance at Dinsmore Woods. In a simulated hurricane blowdown on a temperate forest, it was found that larger overstory trees were uprooted whereas subcanopy and understory trees were crushed by falling trees [27]. Canham et al. [28] noted that moderate winds resulting from F0-F1 tornados may result in differences in the proportion of trees that are blown down. Although the tornado that affected Dinsmore Woods was rated an F5 tornado, the distance of the forest from the direct path of the tornado may have resulted in the forest being subjected to wind speeds that were variable and moderate in intensity. Additionally, other factors such as site topography may have further influenced the pattern of damage [13,14].
4.2. Delayed Windstorm Effects, Recovery and Regeneration
After the 1974 windstorm and the resurvey of the forest immediately following the windstorm, damaged and fallen trees were salvaged along the perimeter of the forest, but not from the interior where subsequent surveys were conducted [17]. Also, no evidence of sprouting or deer browsing was observed during the course of the surveys. The residual or delayed effects of the storm were evident in the 1985 and 1994 surveys with declines in canopy and subcanopy total density and basal area (Table 1, Table 2, Table 3 and Table 4). These longer-term effects of the storm have had an impact on the recovery and regeneration of the forest. Held and Bryant [17] noted trees that had been uprooted and damaged by the windstorm had generated single tree and multiple tree gaps and that many of the wind- damaged trees that remained standing had died and fallen in the period between 1974 and 1985. Based on the 1985 and 1994 surveys, the number of oak trees increased in the subcanopy diameter classes which was also reflected in small increases in oak basal area (Table 4 and Figure 5). The transition of oak saplings to smaller diameter oak trees of the subcanopy may have been a response to the continued formation of canopy openings/gaps post-disturbance and, in part, this transition may account for the disappearance of oak saplings after 1974. Ehrenfeld [29] found evidence of slight increases in the number of oak saplings as well as lower canopy oak trees in response to canopy gaps. Similarly, Thomas-Van Gundy et al. [30] reported increases in oak sapling importance values in response to canopy gaps and exclusion of browsers although the importance values overall remained low for oak spp. Oak in the understory can undergo periods of suppression [31]. In a detailed study of saplings and understory trees in a mixed oak forest that had experienced a windthrow disturbance, Orwig and Abrams [31] found that following the disturbance, all species including white oak increased in height in gaps as compared to control sites. Additionally, white oak saplings and small trees showed increases in radial growth in response to recent gap formation [31]. The positive response (increased radial growth) of oaks to gaps or crown release may also explain the subsequent increase in the number of larger diameter trees in 1985 and 1994 in the canopy (Figure 5) [32,33].
In terms of the subcanopy, white ash continued to decline in number post-disturbance, but showed some evidence of recovery in 1994 with slight increases in both density and basal area (Table 3 and Table 4). Some of this recovery may be due to saplings moving into the subcanopy and, like oak, may partially account for the disappearance of saplings in the 1994 and subsequent surveys. Canopy level ash trees continued to decline in density and basal area over a 20-year period following the windstorm (Table 1 and Table 2; Figure 4). These declines are consistent with wind-damaged trees dying and falling. However, recent increases in 2004 and 2014 in density and basal area of white ash exceed pre-disturbance levels resulting in greater importance of white ash in the canopy compared to oak spp. and sugar maple (Figure 6). Merrens and Peart [34] found that ash saplings and smaller ash trees in a site that was damaged by a 1938 hurricane continued to maintain increased growth rates (radial growth) relative to a control site nearly 45 years after the disturbance. Furthermore, the increased growth rate exhibited by ash was significantly greater than other canopy species present at the site and, because of this sustained growth response, the hurricane disturbance seemed to favor ash compared to other species [34]. Over the 40-year period at Dinsmore Woods, the continued growth of white ash has resulted in a shift from mostly smaller diameter trees (<40 cm diameter) to larger (≥40 cm diameter) trees in the canopy (Figure 4).
Sugar maple has maintained a continual ingrowth of trees into the subcanopy over the 40-year period of monitoring. Immediately post-disturbance, there was a decrease in the number of sugar maple stems in the subcanopy, but by 1985 the number of these smaller diameter trees had reached pre-disturbance levels (Figure 3). The effect of gap openings as a result of windstorm damage may explain the increase of smaller diameter trees of sugar maple between 1974 and 1985. Sugar maple saplings show increased height and radial growth in response to canopy gaps [35,36,37]. In contrast, the transition to the larger diameter classes of the canopy has been inconsistent for this species and may further reflect its adaptation to shade. Sugar maple can undergo long periods of growth suppression followed by release in response to canopy openings [38] or thinning [39]. Abrams and Scott [40] found that sugar maple growth was slower in an old growth forest compared to forests that had been logged. The continued presence and dominance of large white ash and oak trees in the canopy at Dinsmore Woods may be restricting growth of sugar maple into the canopy.
At Dinsmore Woods, prior to the 1974 disturbance, hackberry and slippery elm were important components of the subcanopy. The density and basal area of hackberry was reduced post-disturbance showing some recovery by 2014, but not to pre-disturbance levels (Table 3 and Table 4). In contrast to hackberry, slippery elm showed little change in density and basal area between 1973 and 1974. However, since 1994 slippery elm has declined in importance in the subcanopy and was not recorded in 2014 (Figure 8). Although both species are fast growing, slippery elm saplings may be more dependent upon larger canopy gaps for growth and regeneration than hackberry [41].
In summary, over the 40-year recovery period, the canopy remains an Oak-Ash-Maple system. However, there has been shifts between the three species with fewer but larger diameter oaks and an increase in importance of white ash while sugar maple in the canopy is composed of smaller diameter trees when compared to the other two species. In contrast, sugar maple has increased in importance in the subcanopy not by an actual increase in abundance, but due to the decline in abundance and basal area of the other major species of the subcanopy: oak, white ash, hackberry and slippery elm. This change is reflected in the decline in subcanopy diversity.
The continued decline in the diversity of the subcanopy as well as the sapling class at Dinsmore Woods suggests that the longer-term significant effect of the 1974 disturbance was on the forest understory. The change in the understory post-disturbance appears to be affecting forest regeneration, specifically the transition of seedlings to the sapling class and saplings to the subcanopy. Various studies and reviews have emphasized that the understory may have a significant, but not completely understood effect on forest dynamics and resilience [3,20,42].
A major consequence of the 1974 windstorm at Dinsmore Woods may have been to help establish by 1985 a dense understory layer consisting of Asimina triloba (pawpaw) and Lindera benzoin (spicebush) (Table 5 and Table 6). Spicebush and pawpaw are clonal species and shade tolerant. Both species, however, are also responsive to openings in the canopy that may enhance their productivity, growth and reproduction [43,44,45]. Hosaka et al. [46] suggested that the growth habit of pawpaw may take advantage of temporal variations in light. Canopy and subcanopy gaps formed after the windstorm may have also enhanced sexual reproduction in both species resulting in fruits and seeds that were dispersed throughout the forest by animals, which contributed to the further spread of these species. Both of these species may affect regeneration of tree species by competing for resources. Shotola et al. [47] reported large increases in the density of pawpaw over a 17-year period in an old growth forest in Indiana and this could affect tree regeneration. The cause of the pawpaw expansion in this Indiana forest may have been due to insect defoliation of the canopy. Similarly, in an eight-year study of an old growth Fagus-Acer forest in Ohio, substantial increases in density of Asimina and Lindera were found and it was speculated that both species may negatively affect other woody species regeneration in the forest [42]. A recent study reported on an effort to control pawpaw growth in second growth hardwood stands in Missouri because of its potential negative effect on tree regeneration [48]. Baumer and Runkle [49] found that tree seedling stems (including sugar maple and white ash) not under pawpaw were taller and older compared to stems under pawpaw. As part of this study, Baumer and Runkle [49] did a manipulative experiment to explore the nature of the interactions between pawpaw and sugar maple seedlings. Their results indicated combined aboveground and belowground competition seemed to negatively affect seedling biomass. The negative impact on seedling growth by pawpaw and possibly spicebush may affect the seedling to sapling transition and partially explain the decline over time in the densities of white ash, oak spp. slippery elm and hackberry saplings at Dinsmore Woods.
Further confounding the effects of pawpaw and spicebush on tree regeneration was the increase in abundance of sugar maple saplings in 1985 and 1994. Shading by sugar maple saplings may also have affected the transition from seedling to sapling of other species such as oak and white ash [42,47,50]. Canham [35] found that lateral growth of branches of sugar maple saplings was increased in response to light gaps which would benefit the plant. However, Canham [35] further indicated that the more important effect of this response may be the shading of smaller less shade tolerant tree species after gap formation thereby reducing competition.
Since 1994, two other factors may be affecting tree regeneration at Dinsmore Woods. In the 1994 survey we observed the presence of Alliaria petiolata (garlic mustard) in the forest. However, at that time it was not as extensively present as it was observed in the 2014 survey (Personal Observation). Beginning in 1995, a study was conducted at Dinsmore Woods to determine the effects of prescribed burns on garlic mustard and the understory [51]. A series of burns were completed over a 3-year period. The prescribed or controlled burns in that study consisted of a small number of plots localized within the forest and did not overlap with plots in our subsequent surveys. The results indicated the repeated prescribed burns had no effect on garlic mustard abundance but did have a negative effect on woody seedlings (≤5 cm diameter) on upland sites within the forest [51]. The persistence of garlic mustard in the forest may be contributing to further decline in woody seedling richness and sapling diversity. In a short-term study, Stinson et al. [52] found that woody seedling abundance and Shannon diversity decreased with increasing garlic mustard cover in a New England forest. Among the tree species negatively affected by garlic mustard were sugar maple and white ash. Stinson et al. [52] further suggested that the species-specific response to garlic mustard removal may be due to plant–mycorrhizae interactions and/or shading. In an earlier study, Stinson et al. [53] experimentally demonstrated that garlic mustard negatively affected arbuscular mycorrhizal fungi (AMF) colonization of sugar maple and white ash seedlings and thereby affected seedling growth. In a subsequent field study, AMF colonization of sugar maple seedlings was reduced in forest patches invaded by garlic mustard [54].
Finally, in the 2014 survey, Lonicera maackii (Amur honeysuckle) was in significant abundance in the understory at Dinsmore Woods (Table 5 and Table 6). This invasive species can negatively affect tree seedling density and species richness over time [55,56]. Recently, Cameron et al. [57] conducted a study examining the effects of Lonicera and other environmental factors on sugar maple regeneration in forests of Southwestern Ohio including sites that are near Dinsmore Woods. Their results indicated that the effect of Lonicera depended on the life stage of sugar maple. Just as important, this study showed that other environmental factors such as soil and topography may be affecting seedling to sapling transition and sapling to tree transition in sugar maple, factors which also may be affecting tree regeneration in general at Dinsmore Woods.
5. Conclusions
In summary, in the original study of Dinsmore Woods, Held and Winstead [9] classified this forest as an Acer saccharum (sugar maple) system with Fraxinus americana (white ash) and Quercus spp. (oaks) as subdominants. In a subsequent report, Bryant et al. [7] described Dinsmore Woods as an Oak-Ash-Maple community. Based on our analysis, the canopy at Dinsmore Woods would still be classified as an Oak-Ash-Maple system and this is reflected in the no net change in the canopy Shannon diversity over the 40-year period. However, over the more than 40-year period there have been shifts in the relative importance of these species in the canopy layer. The greater impact and legacy of the windstorm may have been on the understory that resulted in increases in native shrubs like Lindera benzoin (spicebush) and Asimina triloba (pawpaw) as well as sugar maple that have affected tree regeneration resulting in declines in subcanopy density and diversity as well as sapling diversity. The continued presence of Alliaria petiolata (garlic mustard) may have further contributed to these declines through 2014. The invasion by Lonicera maackii (Amur honeysuckle) may also impact tree regeneration at Dinsmore Woods and the potential of Agrilus planipennis (Emerald Ash Borer) expanding in Kentucky coupled with possible climate change may well add to the complexity of the forest’s dynamics. Such questions increase the importance of protected areas such as Dinsmore Woods and its documented structure in understanding these effects on the fragmented forest ecosystems of the region.
Finally, only through the long-term study of this forest were we able to identify the delayed effects of the windstorm and its influence on understory development over time. The understory dynamics post-disturbance is altering both forest structure and composition over successional time. In their review, Rojo and Carson [20] indicated that the conventional view on forest succession following disturbance is closely related to both effects of overstory disturbance (gap creation) and the consequent interactions of both seedling and sapling responses to these gaps on the direction the recovery of the forest takes following disturbance. In contrast to this view, Rojo and Carson [20] proposed that if a persistent and dense understory of a few species develops after a disturbance this understory can alter both the rate and trajectory of succession that follows. Our research is consistent with this proposed view by Rojo and Carson [20] as the understory at Dinsmore Woods has become diminished in species diversity after the windstorm disturbance and this dense understory is interfering with the regeneration of both an understory and overstory (subcanopy) that is similar to the pre-disturbance community at this site. Our long-term study re-emphasizes the importance of understanding the effects of disturbance on the forest understory and the need for continued research to examine the understory influence on both forest succession and dynamics.
Author Contributions
Conceptualization, M.E.H. and J.E.W.; Methodology, M.E.H. and J.E.W.; Formal Analysis, S.J.-H. and M.E.H.; Investigation, S.J.-H., M.E.H., J.E.W. and W.S.B.; Data Curation, M.E.H.; Writing—Original Draft Preparation, S.J.-H.; Writing—Review & Editing, S.J.-H., M.E.H. and J.E.W.; Visualization, S.J.-H.; Project Administration, M.E.H.
Funding
This research received no external funding.
Acknowledgments
We wish to thank the Kentucky Energy and Environment Cabinet, Office of Kentucky Nature Preserves for permission to survey the forest community at Dinsmore Woods State Nature Preserve. MEH wishes to thank the Saint Peter’s University Office of Faculty Research and Sponsored Programs for its continued support of this research.
Conflicts of Interest
The authors declare no conflict of interest.
References
- Ma, W.; Liang, J.; Cumming, J.R.; Lee, E.; Welsh, A.B.; Watson, J.V.; Zhou, M. Fundamental shifts of central hardwood forests under climate change. Ecol. Model. 2016, 332, 28–41. [Google Scholar] [CrossRef] [Green Version]
- Jin, W.; He, H.S.; Thompson, F.R., III; Wang, W.J.; Fraser, J.S.; Shifley, S.R.; Hanberry, B.B.; Dijak, W.D. Future forest aboveground carbon dynamics in the central United States: The importance of forest demographic processes. Sci. Rep. 2017, 7, 41821. [Google Scholar] [CrossRef] [PubMed]
- Webster, C.R.; Dickinson, Y.L.; Burton, J.L.; Frelich, L.E.; Jenkins, M.A.; Kern, C.C.; Raymond, P.; Saunders, M.R.; Walters, M.B.; Wills, J.L. Promoting and maintaining diversity in contemporary hardwood forests: Confronting contemporary drivers of change and the loss of ecological memory. Forest Ecol. Manag. 2018, 421, 98–108. [Google Scholar] [CrossRef]
- Braun, E.L. Deciduous Forests of Eastern North America; The Blakiston Company: Philadelphia, PA, USA, 1950. [Google Scholar]
- Keith, J.R. Vegetation of the Pleistocene Drift Region, northern Kentucky. Trans. Kentucky Acad. Sci. 1968, 29, 10–20. [Google Scholar]
- Ray, L.L. Geomorphology and Quaternary Geology of the Glaciated Ohio River Valley—A Reconnaissance Study; Professional Paper 826; U.S. Department of the Interior Geological Survey: Washington, DC, USA, 1974.
- Bryant, W.S.; Galbraith, S.L.; Held, M.E. Natural terrestrial vegetation of Boone County, Kentucky: Classification, ordination and description. J. Kentucky Acad. Sci. 2004, 65, 132–139. [Google Scholar]
- Boyce, R.L. Size structure of Fagus grandifolia, Liriodendron tulipifera, and Celtis occidentalis populations in a wetland forest in Campbell County, Kentucky. J. Kentucky Acad. Sci. 2012, 73, 83–89. [Google Scholar] [CrossRef]
- Held, M.E.; Winstead, J.E. Structure and composition of a climax forest system in northern Kentucky. Trans. Kentucky Acad. Sci. 1976, 37, 57–67. [Google Scholar]
- Peterson, C.J. Damage and recovery of tree species after two different tornadoes in the same old growth forest: A comparison of infrequent wind disturbances. Forest Ecol. Manag. 2000, 135, 237–252. [Google Scholar] [CrossRef]
- Peterson, C.J. Consistent influence of tree diameter and species on damage in nine eastern North America tornado blowdowns. Forest Ecol. Manag. 2007, 250, 96–108. [Google Scholar] [CrossRef]
- Cowden, M.M.; Hart, J.L.; Schweitzer, C.J.; Dey, D. Effects of intermediate-scale wind disturbance on composition, structure, and succession in Quercus stands: Implications for natural disturbance-based silviculture. Forest Ecol. Manag. 2014, 330, 240–251. [Google Scholar] [CrossRef]
- Everham, E.M.; Brokaw, N.V. Forest damage and recovery from catastrophic wind. Bot. Rev. 1996, 62, 113–185. [Google Scholar] [CrossRef]
- Peterson, C.J. Catastrophic wind damage to North American forests and the potential impact of climate change. Sci. Total Environ. 2000, 262, 287–311. [Google Scholar] [CrossRef]
- Xi, W.; Peet, R.K.; Decoster, J.K.; Urban, D.L. Tree damage risk factors associated with large, infrequent wind disturbances of Carolina forests. Forestry 2008, 81, 317–334. [Google Scholar] [CrossRef] [Green Version]
- Meigs, G.W.; Keeton, W.S. Intermediate-severity wind disturbance in mature temperate forests: Legacy structure, carbon storage, and stand dynamics. Ecol. Appl. 2018, 28, 798–815. [Google Scholar] [CrossRef] [PubMed]
- Held, M.E.; Bryant, W.S. Recovery in a tornado—Damaged hardwood forest in northern Kentucky. Trans. Kentucky Acad. Sci. 1989, 50, 16–21. [Google Scholar]
- Held, M.E.; Jones-Held, S.; Winstead, J.E. Forest community structure and tornado damage in an old-growth system in northern Kentucky. Castanea 1998, 63, 474–481. [Google Scholar]
- Held, M.E.; Bryant, W.S.; Winstead, J.E. Thirty years of recovery in a tornado—Damaged forest in northern Kentucky. J. Kentucky Acad. Sci. 2006, 67, 81–86. [Google Scholar] [CrossRef]
- Royo, A.A.; Carson, W.P. On the formation of dense understory layers in forests worldwide: Consequences and implications for forest dynamics, biodiversity, and succession. Can. J. Forest Res. 2006, 36, 1345–1362. [Google Scholar] [CrossRef]
- McFarlan, A.C. Geology of Kentucky; University of Kentucky Press: Lexington, KY, USA, 1943. [Google Scholar]
- NOAA—National Climatic Data Center—Climate Data Online. Available online: https://www.ncdc.noaa.gov/cdo-web/ (accessed on 11 September 2018).
- NOAA—Storm Events Database. Available online: https://www.ncdc.noaa.gov/stormevents/eventdetails (accessed on 11 September 2018).
- Held, M.E. Structure and Composition of a Climax Forest System in Boone County, Kentucky. Master’s Thesis, Western Kentucky University, Bowling Green, KY, USA, 1975. [Google Scholar]
- Fernald, M.L. Gray’s Manual of Botany, 6th ed.; American Book Company: New York, NY, USA, 1950. [Google Scholar]
- Webb, S.L. Contrasting windstorm consequences in two forests, Itasca State Park, Minnesota. Ecology 1989, 70, 1167–1180. [Google Scholar] [CrossRef]
- Cooper-Ellis, S.; Foster, D.R.; Carleton, G.; Lezberg, A. Forest response to catastrophic wind: Results from an experimental hurricane. Ecology 1999, 80, 2683–2696. [Google Scholar] [CrossRef]
- Canham, C.D.; Papaik, M.J.; Latty, E.F. Interspecific variation in susceptibility to windthrow as a function of tree size and storm severity for northern temperate tree species. Can. J. Forest Res. 2001, 31, 1–10. [Google Scholar] [CrossRef]
- Ehrenfeld, J. Understory response to canopy gaps of varying sizes in a mature oak forest. Bull. Torrey Bot. Club 1980, 107, 29–41. [Google Scholar] [CrossRef]
- Thomas-Van Gundy, M.; Rentch, J.; Adams, M.B.; Carson, W. Reversing legacy effects in the understory of an oak—Dominated forest. Can. J. Forest Res. 2014, 44, 350–364. [Google Scholar] [CrossRef]
- Orwig, D.A.; Abrams, M.D. Dendroecological and ecophysiological analysis of gap environments in mixed—Oak understories of northern Virginia. Funct. Ecol. 1995, 9, 799–806. [Google Scholar] [CrossRef]
- Rentch, J.S.; Desta, F.; Miller, G.W. Climate, canopy disturbance, and radial growth averaging in a second-growth mixed-oak forest in West Virginia, USA. Can. J. Forest Res. 2002, 32, 915–927. [Google Scholar] [CrossRef]
- Rentch, J.S.; Fajvan, M.A.; Hicks, R.R., Jr. Oak establishment and canopy accession strategies in five old-growth stands in the central hardwood forest region. Forest Ecol. Manag. 2003, 184, 285–297. [Google Scholar] [CrossRef]
- Merrens, E.J.; Peart, D.R. Effects of hurricane damage on individual growth and stand structure in a hardwood forest in New Hampshire, USA. J. Ecol. 1992, 80, 787–795. [Google Scholar] [CrossRef]
- Canham, C.D. Growth and canopy architecture of shade—Tolerant trees: Response to canopy gaps. Ecology 1988, 69, 786–795. [Google Scholar] [CrossRef]
- Ricard, J.P.; Messier, C.; Delagrange, S.; Beaudet, M.C. Do understory sapling respond to both light and below—Ground competition? A field experiment in north—Eastern American hardwood forest and a literature review. Ann. For. Sci. 2003, 60, 749–756. [Google Scholar] [CrossRef]
- Forrester, J.A.; Lorimer, C.G.; Dyer, J.H.; Gower, S.T.; Mladenoff, D.J. Response of tree regeneration to experimental gap creation and deer herbivory in north temperate forests. Forest Ecol. Manag. 2014, 329, 137–147. [Google Scholar] [CrossRef]
- Canham, C.D. Suppression and release during canopy recruitment in Acer saccharum. Bull. Torrey Bot. Club 1985, 112, 134–145. [Google Scholar] [CrossRef]
- Singer, M.T.; Lorimer, C.G. Crown release as a potential old-growth restoration approach in northern hardwoods. Can. J. Forest Res. 1997, 27, 1222–1232. [Google Scholar] [CrossRef]
- Abrams, M.D.; Scott, M.L. Disturbance—Mediated accelerated succession in two Michigan forest types. For. Sci. 1989, 35, 42–49. [Google Scholar]
- Ward, J.S.; Parker, G.R. Spatial dispersion of woody regeneration in an old-growth forest. Ecology 1989, 70, 1279–1285. [Google Scholar] [CrossRef]
- Foré, S.A.; Vankat, J.L.; Schaefer, R.L. Temporal variation in the woody understory of an old-growth Fagus-Acer forest and implications for overstory recruitment. J. Veg. Sci. 1997, 8, 607–614. [Google Scholar] [CrossRef]
- Veres, J.S.; Pickett, S.T.A. Branching patterns of Lindera benzoin beneath gaps and closed canopies. New Phytol. 1982, 91, 767–772. [Google Scholar] [CrossRef]
- Niesenbaum, R.A. Light or pollen—Seasonal limitations on female reproductive success in the understory shrub Lindera benzoin. J. Ecol. 1993, 81, 315–323. [Google Scholar] [CrossRef]
- Hosaka, N.; Kachi, N.; Kudoh, H.; Stuefer, J.F.; Whigham, D.F. Patch structure and ramet demography of the clonal tree, Asimina triloba, under gap and closed—Canopy. Plant Ecol. 2008, 197, 219–228. [Google Scholar] [CrossRef]
- Hosaka, N.; Gómez, S.; Kachi, N.; Kudoh, H.; Stuefer, J.F.; Whigham, D.F. The ecological significance of clonal growth in the understory tree, pawpaw (Asimina triloba). Northeast. Nat. 2005, 12, 11–22. [Google Scholar] [CrossRef]
- Shotola, S.J.; Weaver, G.T.; Robertson, P.A.; Ashby, W. Sugar maple invasion of an old-growth oak-hickory forest in southwestern Illinois. Am. Midl. Nat. 1992, 127, 125–138. [Google Scholar] [CrossRef]
- Olson, M.G.; Keeley, M.T. Controlling dense layers of pawpaw (Asimina triloba) in mesic upland forest understories. For. Sci. 2018, 64, 324–329. [Google Scholar]
- Baumer, M.; Runkle, J.R. Tree seedling establishment under the native shrub, Asimina triloba. Castanea 2010, 75, 421–432. [Google Scholar] [CrossRef]
- Lorimer, C.G.; Chapman, J.W.; Lambert, W.D. Tall understory vegetation as a factor in the poor development of oak seedlings beneath mature stands. J. Ecol. 1994, 82, 227–237. [Google Scholar] [CrossRef]
- Luken, J.O.; Shea, M. Repeated prescribed burning at Dinsmore Woods State Nature Preserve (Kentucky, USA): Responses of the understory community. Nat. Area J. 2000, 20, 150–158. [Google Scholar]
- Stinson, K.; Kaufman, S.; Durbin, L.; Lowenstein, F. Impacts of garlic mustard invasion on a forest understory community. Northeast. Nat. 2007, 14, 73–88. [Google Scholar] [CrossRef]
- Stinson, K.A.; Campbell, S.A.; Powell, J.R.; Wolfe, B.E.; Callaway, R.M.; Thelen, G.C.; Hallett, S.G.; Prati, D.; Klironomus, J.N. Invasive plant suppresses the growth of native tree seedlings by disrupting belowground mutualisms. PLoS Biol. 2006, 4, e140. [Google Scholar] [CrossRef]
- Barto, E.K.; Antunes, P.M.; Stinson, K.; Koch, A.M.; Klironomus, J.N.; Cipollini, D. Differences in arbuscular mycorrhizal fungal communities associated with sugar maple seedlings in and out of invaded garlic mustard forest patches. Biol. Invasions 2011, 13, 2755–2762. [Google Scholar] [CrossRef]
- Hutchinson, T.F.; Vankat, J.L. Invasibility and effect of Amur honeysuckle in southwestern Ohio forests. Conserv. Biol. 1997, 11, 1117–1124. [Google Scholar] [CrossRef]
- Collier, M.H.; Vankat, J.L.; Hughes, M.R. Diminished plant richness and abundance below Lonicera maackii, an invasive shrub. Am. Midl. Nat. 2002, 147, 60–71. [Google Scholar] [CrossRef]
- Cameron, G.N.; Culley, T.M.; Kolbe, S.E.; Miller, A.I.; Matter, S.F. Relationship between an invasive shrub, Amur honeysuckle (Lonicera maackii, Caprifoliaceae) and environmental factors on recruitment of sugar maple trees, (Acer saccharum, Aceraceae) in southwestern Ohio. J. Torrey Bot. Soc. 2016, 143, 386–397. [Google Scholar] [CrossRef]
Figure 1.
Windstorm damage to the forest community at Dinsmore Woods, June 1974. Scene is representative of the damage seen throughout this site. Uprooted trees are in the foreground with bent and snapped trees seen in the background.
Figure 1.
Windstorm damage to the forest community at Dinsmore Woods, June 1974. Scene is representative of the damage seen throughout this site. Uprooted trees are in the foreground with bent and snapped trees seen in the background.

Figure 2.
Shannon diversity index values for all canopy (DBH ≥ 30.0 cm) and subcanopy (DBH ≥ 10.0–29.9 cm) tree species recorded at Dinsmore Woods across the six sampling periods.
Figure 2.
Shannon diversity index values for all canopy (DBH ≥ 30.0 cm) and subcanopy (DBH ≥ 10.0–29.9 cm) tree species recorded at Dinsmore Woods across the six sampling periods.

Figure 3.
Density (N/ha) distribution by diameter class (DBH ≥ 10.0 cm) of Acer saccharum individuals recorded across the six sampling periods at Dinsmore Woods.
Figure 3.
Density (N/ha) distribution by diameter class (DBH ≥ 10.0 cm) of Acer saccharum individuals recorded across the six sampling periods at Dinsmore Woods.

Figure 4.
Density (N/ha) distribution by diameter class (DBH ≥ 10.0 cm) of Fraxinus americana individuals recorded at each of the six sampling periods at Dinsmore Woods.
Figure 4.
Density (N/ha) distribution by diameter class (DBH ≥ 10.0 cm) of Fraxinus americana individuals recorded at each of the six sampling periods at Dinsmore Woods.

Figure 5.
Density (N/ha) distribution by diameter class (DBH ≥ 10.0 cm) of Quercus spp. individuals recorded at each of the six sampling periods at Dinsmore Woods.
Figure 5.
Density (N/ha) distribution by diameter class (DBH ≥ 10.0 cm) of Quercus spp. individuals recorded at each of the six sampling periods at Dinsmore Woods.

Figure 6.
Importance percentage (IP = (Relative Density + Relative Basal Area)/2) for tree species recorded in the canopy stratum (DBH ≥ 30.0 cm) at Dinsmore Woods in the six sampling times.
Figure 6.
Importance percentage (IP = (Relative Density + Relative Basal Area)/2) for tree species recorded in the canopy stratum (DBH ≥ 30.0 cm) at Dinsmore Woods in the six sampling times.

Figure 7.
Density (N/ha) distribution by diameter class (DBH ≥ 10.0 cm) of Celtis occidentalis individuals recorded at each of the six sampling periods at Dinsmore Woods.
Figure 7.
Density (N/ha) distribution by diameter class (DBH ≥ 10.0 cm) of Celtis occidentalis individuals recorded at each of the six sampling periods at Dinsmore Woods.

Figure 8.
Density (N/ha) distribution by diameter class (DBH ≥ 10.0 cm) of Ulmus rubra individuals recorded at each of the six sampling periods at Dinsmore Woods.
Figure 8.
Density (N/ha) distribution by diameter class (DBH ≥ 10.0 cm) of Ulmus rubra individuals recorded at each of the six sampling periods at Dinsmore Woods.

Figure 9.
Importance percentage (IP = (Relative Density + Relative Basal Area)/2) for tree species recorded in the subcanopy stratum (DBH 10.0–29.9 cm) at Dinsmore Woods in the six sampling times.
Figure 9.
Importance percentage (IP = (Relative Density + Relative Basal Area)/2) for tree species recorded in the subcanopy stratum (DBH 10.0–29.9 cm) at Dinsmore Woods in the six sampling times.

Figure 10.
Shannon diversity index values of all saplings (Height ≥ 1.4 m; DBH ≤ 9.9 cm) and seedlings (Height < 1.4 m) for all woody species recorded at Dinsmore Woods across the five sampling periods.
Figure 10.
Shannon diversity index values of all saplings (Height ≥ 1.4 m; DBH ≤ 9.9 cm) and seedlings (Height < 1.4 m) for all woody species recorded at Dinsmore Woods across the five sampling periods.


Table 1.
Density (N/ha) and Relative Density for the dominant tree species in the canopy (diameter at breast height (DBH) ≥ 30.0 cm) stratum at Dinsmore Woods recorded in the six sampling periods.
Table 1.
Density (N/ha) and Relative Density for the dominant tree species in the canopy (diameter at breast height (DBH) ≥ 30.0 cm) stratum at Dinsmore Woods recorded in the six sampling periods.
| Species | Density (N/ha) | Relative Density (%) | ||||||||||
|---|---|---|---|---|---|---|---|---|---|---|---|---|
| 1973 | 1974 | 1985 | 1994 | 2004 | 2014 | 1973 | 1974 | 1985 | 1994 | 2004 | 2014 | |
| Fraxinus americana | 34 | 33 | 17 | 13 | 32 | 40 | 28.3 | 24.6 | 21 | 14.9 | 23.7 | 41.2 |
| Acer saccharum | 29 | 49 | 28 | 43 | 47 | 25 | 24.2 | 36.6 | 34.6 | 49.4 | 34.8 | 25.8 |
| Quercus spp *. | 27 | 16 | 13 | 17 | 12 | 12 | 22.5 | 11.9 | 16 | 19.5 | 8.9 | 12.4 |
| Celtis occidentalis | 5 | 12 | 3 | 3 | 3 | 5 | 4.2 | 9.0 | 3.7 | 3.4 | 2.2 | 5.2 |
| Ulmus rubra | 0 | 2 | 8 | 3 | 7 | 0 | 0 | 1.5 | 9.9 | 3.4 | 5.2 | 0 |
| Other species ** | 25 | 22 | 12 | 8 | 34 | 15 | 20.8 | 16.4 | 14.8 | 9.2 | 25.2 | 15.5 |
| Total | 120 | 134 | 81 | 87 | 135 | 97 | 100.0 | 100.0 | 100.0 | 100.0 | 100.0 | 100.0 |
* Quercus spp.: Quercus alba, Quercus muhlenbergii, Quercus prinus, Quercus rubra; ** Other species: Carya cordiformis, Carya glabra, Carya ovata, Carya tomentosa, Juglans nigra, Gleditisia triacanthos, Ostrya virginiana, Fagus grandifolia, Cercis canadensis, Acer negundo, Tilia americana, Robinia pseudoacacia, Maclura pomifera, Prunus serotina, Aesculus glabra, Liriodendron tulipifera, Ulmus americana, Fraxinus quadrangulata, Gymnocladus dioicus.
Table 2.
Basal area (m2/ha) and Relative Basal Area for the dominant tree species in the canopy (DBH ≥ 30.0 cm) stratum at Dinsmore Woods recorded in the six sampling periods.
Table 2.
Basal area (m2/ha) and Relative Basal Area for the dominant tree species in the canopy (DBH ≥ 30.0 cm) stratum at Dinsmore Woods recorded in the six sampling periods.
| Species | Basal Area (m2/ha) | Relative Basal Area (%) | ||||||||||
|---|---|---|---|---|---|---|---|---|---|---|---|---|
| 1973 | 1974 | 1985 | 1994 | 2004 | 2014 | 1973 | 1974 | 1985 | 1994 | 2004 | 2014 | |
| Fraxinus americana | 4.4 | 4.9 | 3.6 | 2.5 | 6.8 | 11.3 | 26.2 | 22.4 | 24 | 14.3 | 26.4 | 44.3 |
| Acer saccharum | 3.4 | 7 | 3.9 | 7.1 | 8 | 3.2 | 20.2 | 32 | 26 | 40.6 | 31 | 12.5 |
| Quercus spp *. | 5.6 | 3.1 | 4.3 | 5.4 | 3.2 | 6.5 | 33.3 | 14.2 | 28.7 | 30.9 | 12.4 | 25.5 |
| Celtis occidentalis | 0.5 | 1.7 | 0.5 | 0.5 | 0.4 | 1.1 | 3.0 | 7.8 | 3.3 | 2.9 | 1.6 | 4.3 |
| Ulmus rubra | 0 | 0.5 | 0.8 | 0.4 | 1.1 | 0 | 0 | 2.3 | 5.3 | 2.3 | 4.3 | 0 |
| Other species ** | 2.9 | 4.7 | 1.9 | 1.6 | 6.3 | 3.4 | 17.3 | 21.5 | 12.7 | 9.1 | 24.4 | 13.3 |
| Total | 16.8 | 21.9 | 15 | 17.5 | 25.8 | 25.5 | 100.0 | 100.0 | 100.0 | 100.0 | 100.0 | 100.0 |
* Quercus spp.: Quercus alba, Quercus muhlenbergii, Quercus prinus, Quercus rubra; ** Other species: Carya cordiformis, Carya glabra, Carya ovata, Carya tomentosa, Juglans nigra, Gleditisia triacanthos, Ostrya virginiana, Fagus grandifolia, Cercis canadensis, Acer negundo, Tilia americana, Robinia pseudoacacia, Maclura pomifera, Prunus serotina, Aesculus glabra, Liriodendron tulipifera, Ulmus americana, Fraxinus quadrangulata, Gymnocladus dioicus.
Table 3.
Density (N/ha) and Relative Density for the dominant tree species in the subcanopy (DBH 10.0–29.9 cm) stratum at Dinsmore Woods recorded in the six sampling periods.
Table 3.
Density (N/ha) and Relative Density for the dominant tree species in the subcanopy (DBH 10.0–29.9 cm) stratum at Dinsmore Woods recorded in the six sampling periods.
| Species | Density (N/ha) | Relative Density (%) | ||||||||||
|---|---|---|---|---|---|---|---|---|---|---|---|---|
| 1973 | 1974 | 1985 | 1994 | 2004 | 2014 | 1973 | 1974 | 1985 | 1994 | 2004 | 2014 | |
| Fraxinus americana | 23 | 20 | 2 | 8 | 8 | 10 | 10.6 | 8.9 | 1.2 | 4.6 | 5.2 | 7.1 |
| Acer saccharum | 102 | 75 | 102 | 117 | 112 | 105 | 47.2 | 33.3 | 62.6 | 67.6 | 74.1 | 74.5 |
| Quercus spp *. | 2 | 6 | 10 | 10 | 3 | 0 | 0.9 | 2.7 | 6.1 | 5.8 | 2 | 0 |
| Celtis occidentalis | 34 | 29 | 3 | 8 | 3 | 15 | 15.7 | 12.9 | 1.8 | 4.6 | 2 | 10.6 |
| Ulmus rubra | 32 | 37 | 17 | 18 | 7 | 0 | 14.8 | 16.4 | 10.4 | 10.4 | 4.6 | 0 |
| Other species ** | 23 | 58 | 29 | 12 | 18 | 11 | 10.6 | 25.8 | 17.8 | 6.9 | 11.9 | 7.8 |
| Total | 216 | 225 | 163 | 173 | 151 | 141 | 100.0 | 100.0 | 100.0 | 100.0 | 100.0 | 100.0 |
* Quercus spp.: Quercus alba, Quercus muhlenbergii, Quercus prinus, Quercus rubra; ** Other species: Carya cordiformis, Carya glabra, Carya ovata, Carya tomentosa, Juglans nigra, Gleditisia triacanthos, Ostrya virginiana, Fagus grandifolia, Cercis canadensis, Acer negundo, Tilia americana, Robinia pseudoacacia, Prunus serotina, Aesculus glabra, Fraxinus quadrangulata, Gymnocladus dioicus, Asimina triloba, Cornus florida, Morus rubra.
Table 4.
Basal area (m2/ha) and Relative Basal Area for the dominant tree species in the subcanopy (DBH 10.0–29.9 cm) stratum at Dinsmore Woods recorded in the six sampling periods.
Table 4.
Basal area (m2/ha) and Relative Basal Area for the dominant tree species in the subcanopy (DBH 10.0–29.9 cm) stratum at Dinsmore Woods recorded in the six sampling periods.
| Species | Basal Area (m2/ha) | Relative Basal Area (%) | ||||||||||
|---|---|---|---|---|---|---|---|---|---|---|---|---|
| 1973 | 1974 | 1985 | 1994 | 2004 | 2014 | 1973 | 1974 | 1985 | 1994 | 2004 | 2014 | |
| Fraxinus americana | 1.23 | 0.45 | 0.02 | 0.19 | 0.31 | 0.38 | 15.1 | 7.3 | 0.50 | 4 | 6.6 | 8.9 |
| Acer saccharum | 3.18 | 2.20 | 2.87 | 3.12 | 3.23 | 3.20 | 39 | 35.8 | 71.4 | 66.4 | 69.2 | 75.3 |
| Quercus spp *. | 0.13 | 0.15 | 0.23 | 0.33 | 0.18 | 0 | 1.6 | 2.4 | 5.7 | 7.0 | 3.9 | 0 |
| Celtis occidentalis | 1.51 | 0.95 | 0.07 | 0.19 | 0.15 | 0.46 | 18.5 | 15.5 | 1.7 | 4 | 3.2 | 10.8 |
| Ulmus rubra | 1.34 | 0.90 | 0.35 | 0.47 | 0.23 | 0 | 16.4 | 14.7 | 8.7 | 10 | 4.9 | 0 |
| Other species ** | 0.77 | 1.49 | 0.48 | 0.40 | 0.57 | 0.21 | 9.4 | 24.3 | 11.9 | 8.5 | 12.2 | 4.9 |
| Total | 8.16 | 6.14 | 4.02 | 4.70 | 4.67 | 4.25 | 100.0 | 100.0 | 100.0 | 100.0 | 100.0 | 100.0 |
* Quercus spp.: Quercus alba, Quercus muhlenbergii, Quercus prinus, Quercus rubra; ** Other species: Carya cordiformis, Carya glabra, Carya ovata, Carya tomentosa, Juglans nigra, Gleditisia triacanthos, Ostrya virginiana, Fagus grandifolia, Cercis canadensis, Acer negundo, Tilia americana, Robinia pseudoacacia, Prunus serotina, Aesculus glabra, Fraxinus quadrangulata, Gymnocladus dioicus, Asimina triloba, Cornus florida, Morus rubra.
Table 5.
Density (N/ha), Relative Density, and Relative Frequency for the dominant woody species recorded in the sapling class (Height > 1.4 m; DBH ≤ 9.9 cm) at Dinsmore Woods across the five sampling periods.
Table 5.
Density (N/ha), Relative Density, and Relative Frequency for the dominant woody species recorded in the sapling class (Height > 1.4 m; DBH ≤ 9.9 cm) at Dinsmore Woods across the five sampling periods.
| Species | Density (N/ha) | Relative Density (%) | Relative Frequency (%) | ||||||||||||
|---|---|---|---|---|---|---|---|---|---|---|---|---|---|---|---|
| 1974 | 1985 | 1994 | 2004 | 2014 | 1974 | 1985 | 1994 | 2004 | 2014 | 1974 | 1985 | 1994 | 2004 | 2014 | |
| Fraxinus americana | 25 | 27 | 0 | 0 | 0 | 7.8 | 1.6 | 0 | 0 | 0 | 10.3 | 6.1 | 0 | 0 | 0 |
| Acer saccharum | 90 | 727 | 300 | 427 | 153 | 28.2 | 42.4 | 62.4 | 36.4 | 18.2 | 17.9 | 26.5 | 56.5 | 47.8 | 32.3 |
| Quercus spp *. | 8 | 0 | 0 | 0 | 0 | 2.5 | 0 | 0 | 0 | 0 | 4.3 | 0 | 0 | 0 | 0 |
| Celtis occidentalis | 20 | 93 | 0 | 20 | 0 | 6.3 | 5.4 | 0 | 1.7 | 0 | 7.7 | 14.3 | 0 | 13 | 0 |
| Ulmus rubra | 78 | 153 | 20 | 0 | 7 | 24.5 | 8.9 | 4.2 | 0 | 0.8 | 17.1 | 8.2 | 8.7 | 0 | 3.2 |
| Asimina triloba | 44 | 460 | 67 | 0 | 207 | 13.8 | 26.8 | 13.9 | 0 | 24.6 | 7.7 | 12.2 | 13 | 0 | 16.1 |
| Lindera benzoin | 12 | 40 | 73 | 713 | 327 | 3.8 | 2.3 | 15.2 | 60.7 | 38.9 | 6.8 | 6.1 | 8.7 | 30.4 | 35.5 |
| Lonicera maackii | 0 | 0 | 0 | 0 | 140 | 0 | 0 | 0 | 0 | 16.6 | 0 | 0 | 0 | 0 | 9.7 |
| Rosa multiflora | 0 | 0 | 0 | 0 | 7 | 0 | 0 | 0 | 0 | 0.8 | 0 | 0 | 0 | 0 | 3.2 |
| Other species ** | 42 | 215 | 21 | 14 | 0 | 13.2 | 12.5 | 4.4 | 1.2 | 0 | 28.5 | 26.6 | 13.1 | 8.8 | 0 |
| Total | 319 | 1715 | 481 | 1174 | 841 | 100.0 | 100.0 | 100.0 | 100.0 | 100.0 | 100.0 | 100.0 | 100.0 | 100.0 | 100.0 |
* Quercus spp.: Quercus alba, Quercus muhlenbergii, Quercus prinus, Quercus rubra; ** Other species: Carya spp., Ostrya virginiana, Fagus grandifolia, Cercis canadensis, Tilia americana, Robinia pseudoacacia, Prunus serotina, Aesculus glabra, Cornus florida, Morus rubra, Euonymus americanus, Sassafras albidum, Liriodendron tulipifera.
Table 6.
Density (N/ha), Relative Density, and Relative Frequency for the dominant woody species recorded in the seedling class (Height ≤ 1.4 m) at Dinsmore Woods across the five sampling periods.
Table 6.
Density (N/ha), Relative Density, and Relative Frequency for the dominant woody species recorded in the seedling class (Height ≤ 1.4 m) at Dinsmore Woods across the five sampling periods.
| Species | Density (N/ha) | Relative Density (%) | Relative Frequency (%) | ||||||||||||
|---|---|---|---|---|---|---|---|---|---|---|---|---|---|---|---|
| 1974 | 1985 | 1994 | 2004 | 2014 | 1974 | 1985 | 1994 | 2004 | 2014 | 1974 | 1985 | 1994 | 2004 | 2014 | |
| Fraxinus americana | 168 | 117 | 50 | 283 | 67 | 12.6 | 1.9 | 2.5 | 4.6 | 2.1 | 12 | 3.8 | 6.7 | 5 | 10.5 |
| Acer saccharum | 471 | 1617 | 933 | 1633 | 1200 | 35.4 | 25.9 | 46.7 | 26.6 | 38.1 | 14.7 | 15.2 | 24.4 | 16.7 | 13.2 |
| Quercus spp *. | 36 | 17 | 0 | 117 | 17 | 2.7 | 0.3 | 0 | 1.9 | 0.5 | 6.7 | 1.3 | 0 | 10 | 2.6 |
| Celtis occidentalis | 50 | 717 | 17 | 400 | 83 | 3.8 | 11.5 | 0.9 | 6.5 | 2.6 | 8 | 15.2 | 2.2 | 13.3 | 7.9 |
| Ulmus rubra | 295 | 300 | 500 | 567 | 83 | 22.1 | 4.8 | 25 | 9.2 | 2.6 | 13.3 | 7.6 | 20.0 | 11.7 | 5.3 |
| Asimina triloba | 53 | 1200 | 133 | 1167 | 200 | 4 | 19.2 | 6.7 | 19 | 6.3 | 6.7 | 11.4 | 13.3 | 10 | 10.5 |
| Lindera benzoin | 74 | 1617 | 217 | 1617 | 550 | 5.6 | 25.9 | 10.9 | 26.4 | 17.5 | 7.3 | 17.7 | 17.8 | 11.7 | 18.4 |
| Lonicera maackii | 0 | 0 | 0 | 0 | 800 | 0 | 0 | 0 | 0 | 25.4 | 0 | 0 | 0 | 0 | 21.1 |
| Rosa multiflora | 0 | 0 | 0 | 0 | 67 | 0 | 0 | 0 | 0 | 2.1 | 0 | 0 | 0 | 0 | 2.6 |
| Other species ** | 185 | 651 | 150 | 351 | 84 | 13.9 | 10.4 | 7.5 | 5.7 | 2.7 | 31.3 | 27.8 | 15.6 | 21.6 | 7.8 |
| Total | 1332 | 6236 | 2000 | 6135 | 3151 | 100.0 | 100.0 | 100.0 | 100.0 | 100.0 | 100.0 | 100.0 | 100.0 | 100.0 | 100.0 |
* Quercus spp.: Quercus alba, Quercus muhlenbergii, Quercus prinus, Quercus rubra; ** Other species: Carya spp., Ostrya virginiana, Fagus grandifolia, Cercis canadensis, Tilia americana, Prunus serotina, Aesculus glabra, Cornus florida, Morus rubra, Sassafras albidum, Juglans nigra, Gleditisia triacanthos, Fraxinus quadrangulata, Symphoricarpos orbiculatus.
© 2019 by the authors. Licensee MDPI, Basel, Switzerland. This article is an open access article distributed under the terms and conditions of the Creative Commons Attribution (CC BY) license (http://creativecommons.org/licenses/by/4.0/).
Share and Cite
MDPI and ACS Style
Jones-Held, S.; Held, M.E.; Winstead, J.E.; Bryant, W.S. Immediate and Delayed Effects of Severe Winds on an Old-Growth Forest in Kentucky: A Forty-Year Retrospective. Forests 2019, 10, 271. https://doi.org/10.3390/f10030271
AMA Style
Jones-Held S, Held ME, Winstead JE, Bryant WS. Immediate and Delayed Effects of Severe Winds on an Old-Growth Forest in Kentucky: A Forty-Year Retrospective. Forests. 2019; 10(3):271. https://doi.org/10.3390/f10030271
Chicago/Turabian StyleJones-Held, Susan, Michael E. Held, Joe E. Winstead, and William S. Bryant. 2019. "Immediate and Delayed Effects of Severe Winds on an Old-Growth Forest in Kentucky: A Forty-Year Retrospective" Forests 10, no. 3: 271. https://doi.org/10.3390/f10030271
Note that from the first issue of 2016, this journal uses article numbers instead of page numbers. See further details here.