Article

Assessing Across-Scale Optical Diversity and Productivity Relationships in Grasslands of the Italian Alps

1
Institute of Ecology, University of Innsbruck, Sternwartestrasse 15, 6020 Innsbruck, Austria
2
School of Geosciences, University of Edinburgh, EH9 3JW Edinburgh, UK
3
Sustainable Ecosystems and Bioresources Department, Research and Innovation Centre, Fondazione Edmund Mach, Via E. Mach 1, 38010 San Michele all’Adige (TN), Italy
4
Department of Agricultural, Food, Environmental and Animal Sciences, University of Udine, 33100 Udine, Italy
5
Institute of Biometeorology, National Research Council (CNR), 50145 Firenze, Italy
6
Department of Agronomy, Food, Natural Resources, Animals and Environment (DAFNAE), University of Padova, Agripolis, 35020, Legnaro, Italy
7
International Livestock Research Institute (ILRI), P.O. Box 30709, 00100 Nairobi, Kenya
8
Remote Sensing of Environmental Dynamics Laboratory, DISAT, Universita degli Studi Milano-Bicocca, 20126 Milano, Italy
9
Center Agriculture Food Environment, University of Trento, Via E. Mach 1, 38010 San Michele all’Adige (TN), Italy
10
Centre for Integrative Biology, University of Trento, Via Sommarive, 14, 38123 Povo (TN), Italy
11
Biodiversity and Molecular Ecology Department, Research and Innovation Centre, Fondazione Edmund Mach, Via E. Mach 1, 38010 San Michele all’Adige (TN), Italy
*
Author to whom correspondence should be addressed.
Remote Sens. 2019, 11(6), 614; https://doi.org/10.3390/rs11060614
Submission received: 10 January 2019 / Revised: 18 February 2019 / Accepted: 6 March 2019 / Published: 13 March 2019

Abstract

:
The linearity and scale-dependency of ecosystem biodiversity and productivity relationships (BPRs) have been under intense debate. In a changing climate, monitoring BPRs within and across different ecosystem types is crucial, and novel remote sensing tools such as the Sentinel-2 (S2) may be adopted to retrieve ecosystem diversity information and to investigate optical diversity and productivity patterns. But are the S2 spectral and spatial resolutions suitable to detect relationships between optical diversity and productivity? In this study, we implemented an integrated analysis of spatial patterns of grassland productivity and optical diversity using optical remote sensing and Eddy Covariance data. Across-scale optical diversity and ecosystem productivity patterns were analyzed for different grassland associations with a wide range of productivity. Using airborne optical data to simulate S2, we provided empirical evidence that the best optical proxies of ecosystem productivity were linearly correlated with optical diversity. Correlation analysis at increasing pixel sizes proved an evident scale-dependency of the relationships between optical diversity and productivity. The results indicate the strong potential of S2 for future large-scale assessment of across-ecosystem dynamics at upper levels of observation.

Graphical Abstract

1. Introduction

As extensive changes in biodiversity are occurring globally, ecosystem studies have been focusing on investigating how species composition, distribution, and abundance affect ecosystem functioning. To improve our understanding of such interactions, a deeper insight into processes that regulate vegetation biodiversity and productivity is fundamental [1].
Plant primary production (expressed as above-ground biomass) and productivity (the rate of new biomass generation, estimated through biomass harvesting or expressed as Net Ecosystem Exchange, NEE; [2]) are key metrics of ecosystem functioning. Although positive correlations between biodiversity and productivity (BPRs) were often highlighted in grassland ecosystems [2,3,4,5], other studies showed negative relationships [6,7,8]. A humped-back model was recently proposed for high above-ground biomass rates based on the hypothesis that plant diversity peaks at intermediate productivity, while at low and high productivity biodiversity is lower, as only a few species are able to deal with stress and competition, respectively [8]. Uncertainties about the methodologies beneath BPR studies also exist. The analysis of the factors affecting BPRs is often carried out at small scale using a “within-site” approach to keep environmental conditions constant as much as possible among treatments [9] and is often based on manipulation of species richness. To this regard, Grace et al. [6] highlighted the limits of manipulations experiments and the need for more analyses focused on mature natural ecosystems.
The scale-dependency of BPRs is under intense debate [7,9,10]. Remote Sensing (RS) techniques provide strong potential for across-scale BPRs spatial patterns investigations: Since ground surveys are time-consuming and costly, larger areas can be analyzed using remotely-sensed proxies of diversity and productivity, leading to innovative insights in ecological applications. However, only sporadic experimental RS studies have been carried out to analyze the scale-dependency of optical diversity and productivity relationships. Airborne hyperspectral sensors are able to retrieve and combine detailed information on biochemistry and structure and represent a solid basis for across-scale investigations and for the validation of existing and upcoming satellite observations [2].
Solar radiation interactions with vegetation in different spectral domains provide different information about the observed ecosystems. The visible (VIS) spectral region is dependent on biochemistry and pigments absorptions, while the relatively high reflectance in the near-infrared (NIR) is linked to structure and internal leaf and canopy scattering [11]. By combining structural and biochemical information obtained from light reflected at different wavelengths, optical data can be adopted to map both vegetation productivity and biodiversity [2,12,13].
Canopy structure can be described by structural traits such as Leaf Area Index (LAI), aboveground biomass (AGB), and the proportion of photosynthetic and non-photosynthetic elements. In herbaceous plants, AGB is a spatially and temporally-dynamic trait retrievable from RS observations [14]. A commonly-adopted approach integrating ecosystem productivity and RS is based on the theory of light use efficiency (LUE) [15] which states that a relatively constant relationship exists between productivity (expressed as Gross Primary Production (GPP) or Net Ecosystem Exchange (NEE)) and absorbed radiation at the canopy level:
C   uptake = ε × ( fAPAR × PAR ) = ε × APAR
where ε is the photosynthetic light use efficiency expressing the carbon sequestration efficiency per amount of the absorbed solar energy (µmol CO2·µmol−1 APAR); PAR is the incident photosynthetically active radiation (µmol·m−2·s−1); fAPAR is the fraction of PAR absorbed by the vegetation canopy (-), and APAR is the amount of PAR absorbed by the aboveground green biomass (µmol·m−2·s−1).
Productivity in herbaceous ecosystems such as grasslands and crops is strongly related to the seasonal variation of aboveground green biomass and is mostly driven by APAR, while ε is often assumed as a constant in the models [16,17]. The fAPAR term was demonstrated to be directly linked to canopy chlorophyll content, and in the Monteith model can be estimated using spectral vegetation indices (SVIs) [18,19], which are mathematical combinations of vegetation surface reflectance at two or more bands [20]. Productivity is usually retrieved using SVIs, including in their formulation a NIR band characterized by a high reflectance due to leaf and canopy scattering, and a VIS band where absorption by the chlorophyll pigments is predominant (e.g., the Normalized Difference Vegetation Index (NDVI), and other Chlorophyll-related indices [20]). The adopted models include an incident PAR component [16,21,22], although some other studies [17,23] demonstrated the suitability of SVIs to estimate productivity without PAR information.
The European Space Agency (ESA) satellite Sentinel-2 (S2) recent mission has opened unprecedented opportunities for BPRs monitoring. The S2 twin satellites are equipped with a Multispectral Instrument (MSI) measuring reflected radiance in 13 spectral bands ranging from VIS and NIR to shortwave infrared (SWIR) with a high spatial resolution. The red-edge domain, which is on the borderline between chlorophyll absorption (in the red wavelengths) and leaf/canopy scattering in the NIR wavelengths [24], is well covered by S2 (B5, B6).
S2 allows the calculation of both “traditional” VIS-NIR SVIs (which are greenness-related, as chlorophyll absorption takes place mostly in the VIS wavelengths up to 700 nm [25]) and NIR indices based on NIR bands ≥740 nm. Such band combinations can provide important information related to canopy light scattering and canopy structure, and therefore canopy structural controls on photosynthesis [26,27].
However, can NIR-based canopy structure observations be an indicator of productivity? To explain this, we cite Ollinger [25], who highlighted the paradox that “the physiological activity of vegetation is often more strongly related to reflectance at wavelengths that are not used in photosynthesis than to those that are”. The nature of the “paradoxical” relationship between the NIR spectral response and ecosystem physiology is related to the complex scattering dynamics of leaf, stem, and canopy-level structural traits, which appear to co-vary with traits related with physiology. Such dynamics have only been partially explored, and more studies are needed to investigate the links between ecosystem physiology, canopy structure, and NIR spectral responses [25,28].
Assuming that leaf biochemistry and canopy structure variability are linked to different strategies to cope with different environmental resource limitations [25], spectral heterogeneity can track relative diversity, which incorporates species richness, biochemical properties, and canopy structure [13,29]. A new objective method to relate hyperspectral RS and ecosystem diversity was proposed [29], and significant correlations were observed between grassland ecosystem diversity (expressed as conventional species diversity indices such as richness and Shannon index) and “optical diversity”, an optically-derived metric of biodiversity defined as the coefficient of variation (CV) in spectral reflectance across space. Optical diversity proved to be a valid approach for the detection of grassland α-diversity (at a local scale, e.g., at the plot level), while larger-scale models have been applied to measure the species turnover among sites (β-diversity, sensu Whittaker, 1972 [30]). We refer to Rocchini et al. [31] for a review of the matter. Following the optical diversity approach, a significant positive linear correlation was observed between optical diversity and productivity, but only for very low productive grasslands (maximum productivity: 136 g·m−2; [2]), while studies covering a wide range of productivity are missing.
The aim of this study was to use airborne optical RS data to investigate within-site spatial patterns of ecosystem diversity and functions in highly-diverse mature grassland canopies of the Italian Alps, considering different scenarios at decreasing spatial and spectral resolutions (using resampling techniques) to highlight the potential of S2 to capture ecosystem diversity and productivity patterns.
In this context, a number of research questions are addressed in this paper:
(i)
can we identify optical diversity and ecosystem productivity relationships (for a wide range of productivity) using remotely-sensed proxies?
(ii)
are such relationships scale-dependent?
(iii)
are the S2 data spatial and spectral resolutions suitable to detect such relationships?
Firstly, simulating the S2 bands, we compared the performance of VIS-NIR SVIs and the performance of solely NIR-based (≥740 nm bands) SVIs in estimating the NEE of five different grasslands, and we analyzed the relative contributions of different spectral domains for predicting the productivity of these ecosystems to highlight both structural and biochemical controls.
Secondly, we calculated the coefficient of variation (CV) of reflectance across space (which was demonstrated to be a proxy of ecosystem biodiversity [29]), and thus we explored across-scale optical diversity and productivity patterns for the investigated grasslands using both hyperspectral and S2 simulated multi-spectral bands. Finally, we investigated the S2 data spatial and spectral resolutions suitability for detecting optical diversity and productivity spatial patterns.

2. Materials and Methods
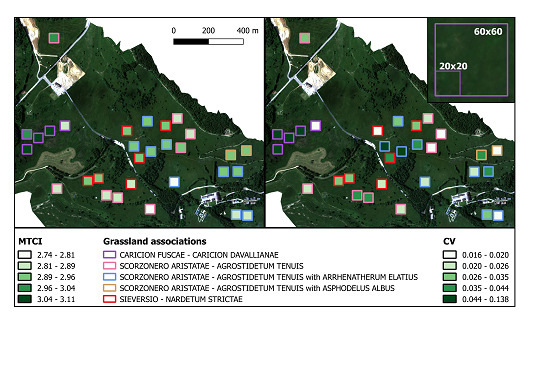
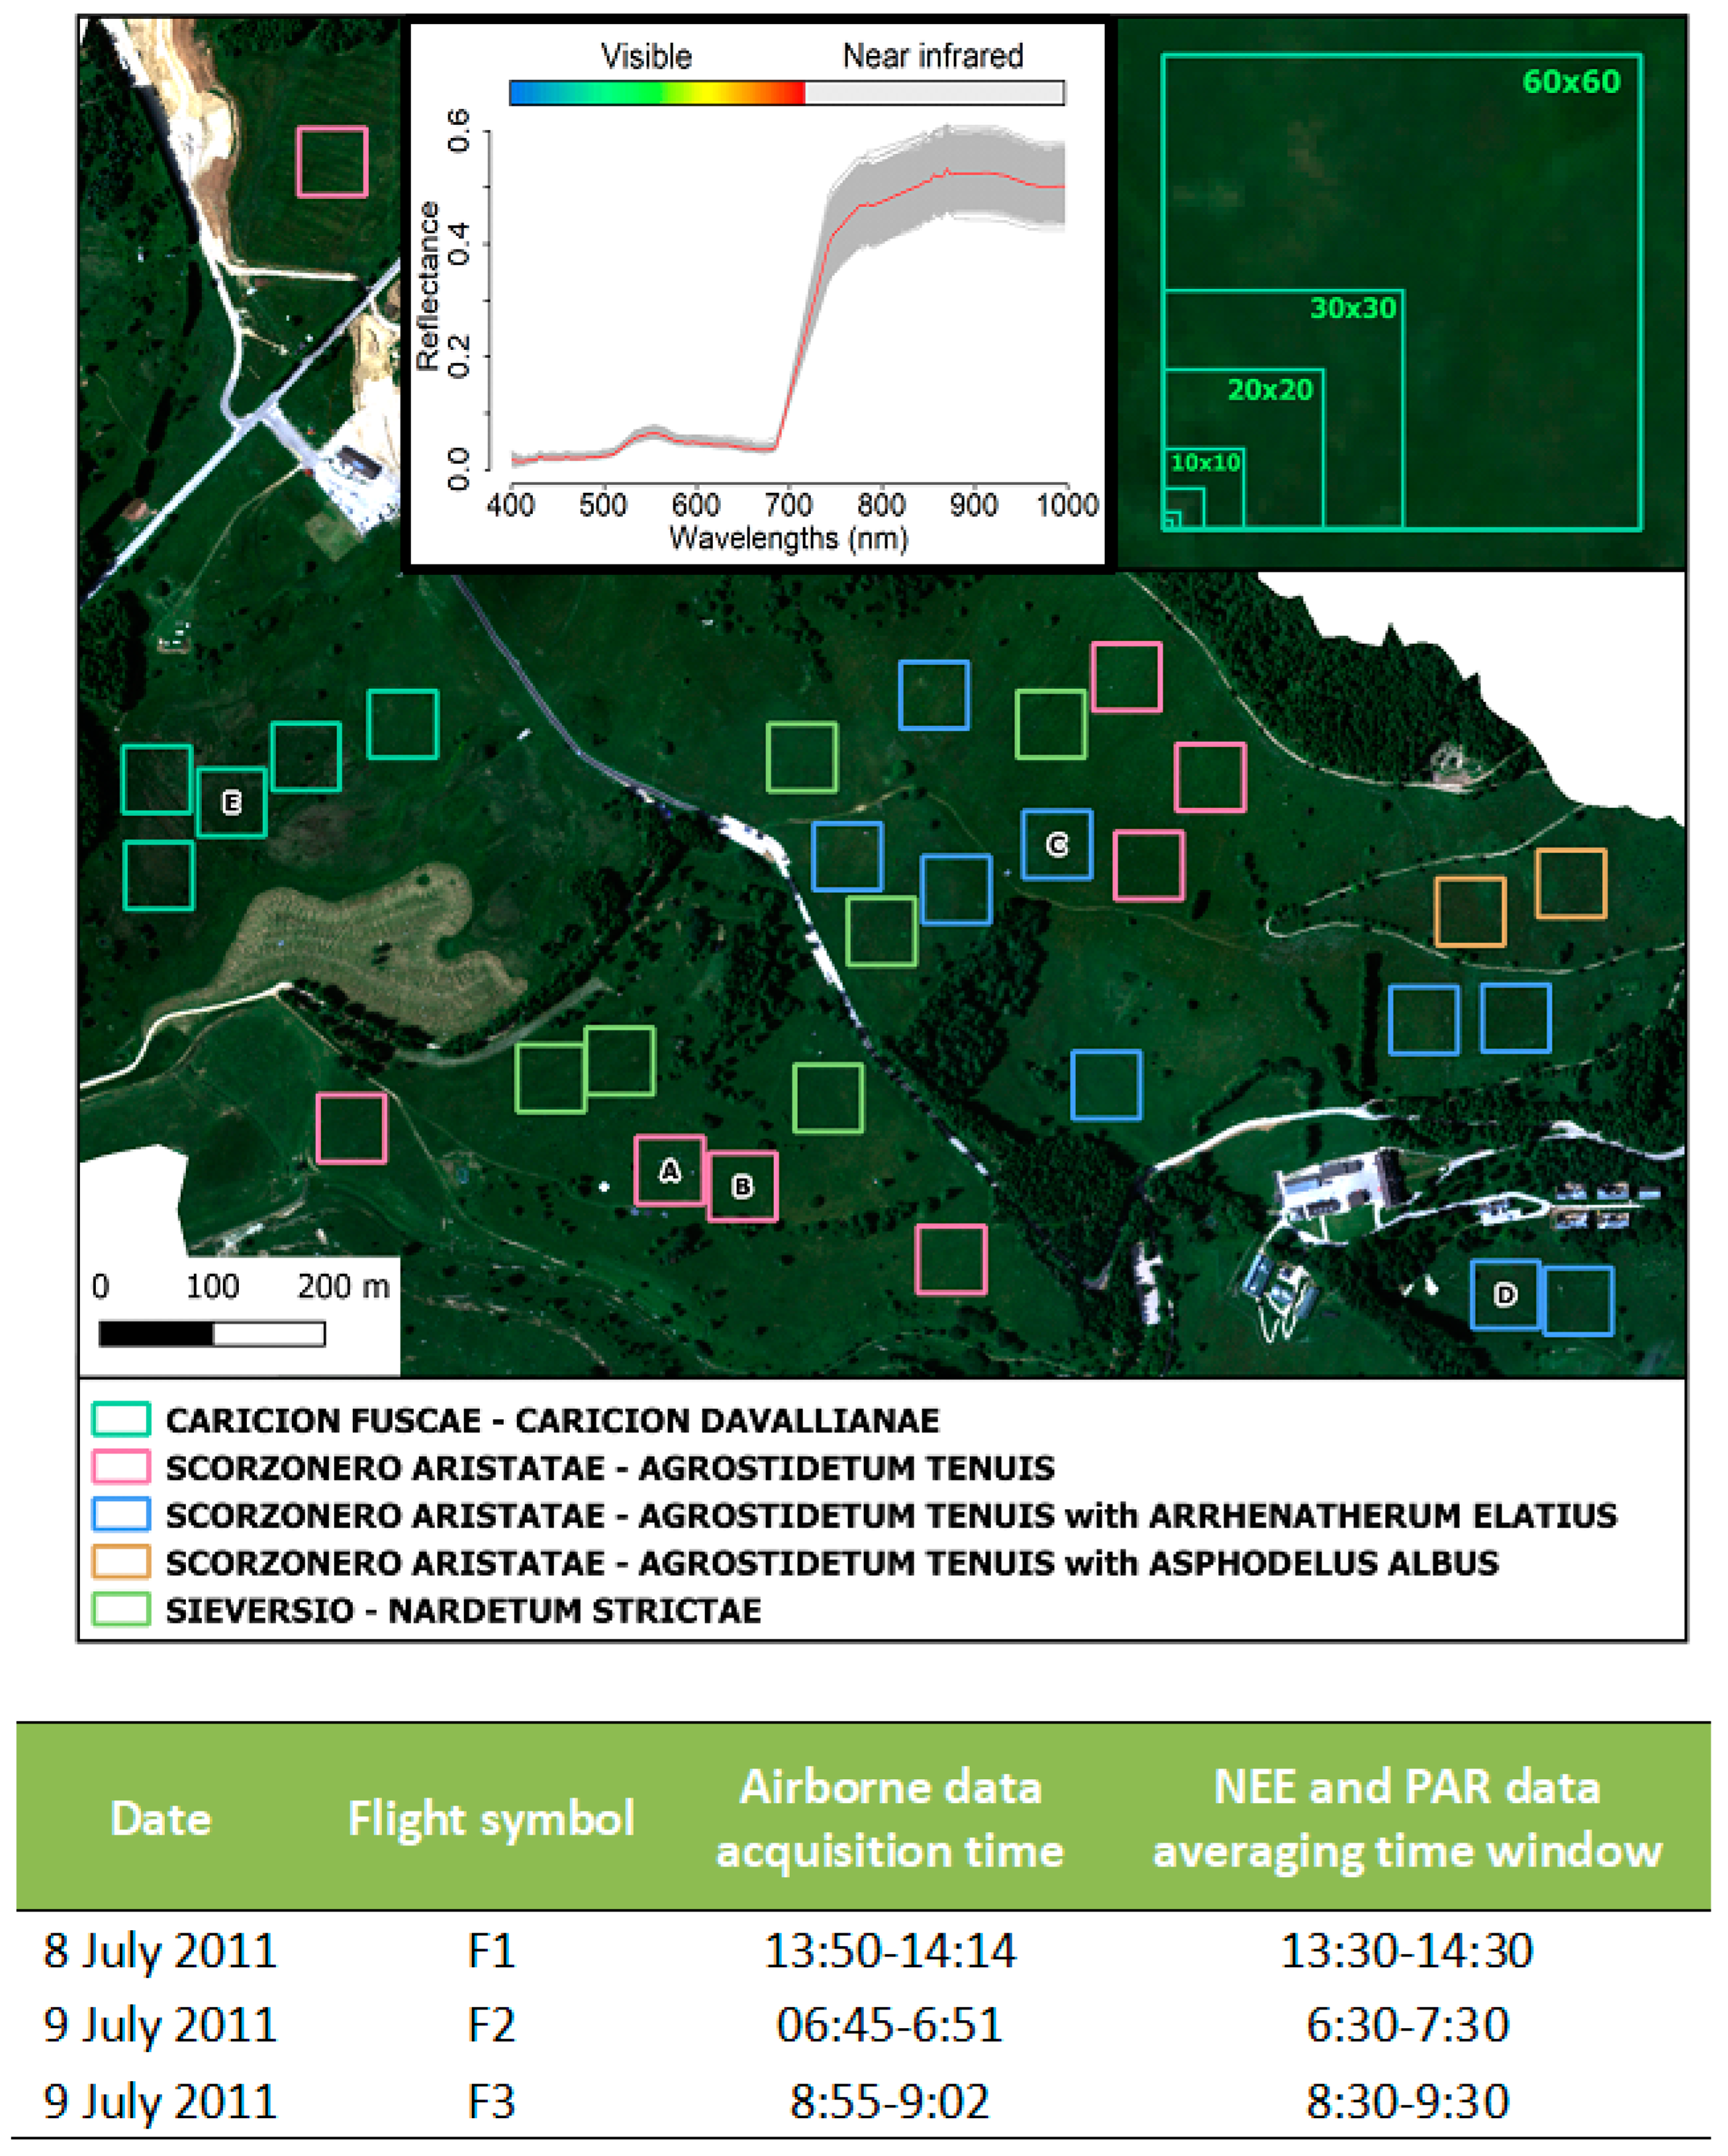
2.1. Study Area

The study area covered a grassland plateau located at Viote del Monte Bondone (Trentino province, Italy; 46°00′N 11°02′E; 1480–1550 m a.s.l.) where grasslands are managed mostly as meadows, with low mineral fertilization and one cut per year, usually in mid-July. The grasslands show a wide range of LAI (varying from 0.4–7 m2·m−2), productivity (31–735 g·m−2 green dry biomass), and species composition ([32]; Figure 1). The vegetation of the area is very heterogeneous, and three main vegetation associations (one of them including two variants) can be found. The Sieverso-Nardetum strictae association (species richness: 71; average aboveground biomass: 236 g·m−2, [32]) is characterized by short canopies, acid soils and is lightly-managed [33]. The Scorzonero Aristatae-Agrostidetum tenuis (species richness: 88; average aboveground biomass: 384 g·m−2 [32]) grows on calcareous soils and includes some much more productive variants with species which can be typically found at much lower altitudes (e.g., Arrenatherum elatius, Dactylis glomerata). The plateau, in its Eastern part, consists of small peatland associations of the Caricion fuscae and Caricion davallianae characterized by very high productivity, with values of green aboveground biomass up to 735 g·m−2 [34].

2.2. Eddy Covariance Measurements

Continuous Eddy Covariance (EC) measurements of CO2, water vapor, and sensible heat fluxes were performed at five EC towers (Figure 1), one of which is a permanent FLUXNET EC site (IT_MBo, Tower A in Figure 1). The other four temporarily installed EC towers were located within a maximum distance of one kilometer from the IT_MBo tower and were operational three days before the flight campaign, and maintained for two weeks after the flight campaign (8–9 July 2011). All EC systems consisted of the same open-path infrared gas analyzer (Li-7500, Li-COR Inc., Lincoln, NE, USA) and a 3-D ultrasonic anemometer (Gill R3, Gill Instruments Ltd., Lymington, UK or YOUNG Model 81,000 V, R. M. Young Company, Traverse City, MI, USA), mounted at a height from 1.30–2.50 m. A preliminary footprint analysis demonstrated that in most cases for all the five sites, in unstable conditions, 70% of the total CO2 flux originated within 30 m from the EC tower. Incoming total and diffuse PAR (BF3H, Delta-T Devices Ltd., Cambridge, UK) were measured at the permanent IT_MBo tower (Tower A; Figure 1) and assumed (in cloud-free conditions) to be representative of all the sites. Radiation variables were recorded at one-minute intervals and averaged over 30 minutes. Half-hourly measurements of NEE (µmol CO2·m−2·s−1) and photosynthetically active radiation (PAR, µmol·m−2·s−1) were averaged and matched to the time of hyperspectral data flight acquisitions (Figure 1).

2.3. The Hyperspectral Flight Campaign and Imagery Processing

A hyperspectral flight campaign was organized in July 2011. Three flights (Figure 1) were carried out in cloud-free conditions on 8–9 July 2011 at different times of the day using an AisaEAGLE hyperspectral sensor (VIS-NIR, 130 bands; SPECIM, Finland). Hyperspectral images (0.9 m spatial resolution; 400–1000 nm; spectral resolution: 4.3–4.8 nm FWHM) were ortho-rectified, atmospherically corrected, and mosaicked using the ATCOR-4 package of the PARGE software (ReSe applications, Zurich, Switzerland).
According to the preliminary EC footprint analysis, a circular area with a radius of 30 m (region of interest: ROI) was considered, and data were exported and averaged using ENVI 4.8. In order to calculate the SVIs, S2 bands (Table 1; as in Clevers et al. [35]) were considered, and a simulation was obtained by calculating the average reflectance over the bandwidth of the respective MSI bands following Peng et al. [36]. Both traditional VIS-NIR and NIR-based (NIDI; Normalized Infrared Difference Index) SVIs were investigated (Table 2).

2.4. Models for NEE Estimation

In order to estimate NEE, three different approaches were used: (i) linear regression between NEE and SVIs (model 1); (ii) linear regression between NEE and a product of SVIs and incoming PAR (model 2); and (iii) partial least squares regression (PLSR) using the full set of AisaEAGLE hyperspectral reflectance spectra (model 3). The first two models utilized S2 simulated spectral bands, while in the third approach the full set of hyperspectral AisaEAGLE reflectance spectra (130 bands between 400 and 1000 nm) was used simultaneously to estimate NEE.
The PLSR method, which is commonly adopted to analyze hyperspectral datasets [7], iteratively transforms predictor (reflectance data) and response (NEE) variables into latent vectors and generates band-wise calibration factors used to create a predictive linear model [19,42].
Model 1 was tested for each single flight on a separate basis (as radiation was assumed to be constant at all five towers), while models 2 and 3 (both including PAR) were tested for all the three flights together using the PAR data averaged for the same time period used for EC flux data (Figure 1).
Pearson’s correlation analysis was used to test the significance of the relationships between SVIs and NEE and SVIs*PAR and NEE. The PLSR analyses were carried out by means of the PLS package of the R software environment [43]. The optimal number of components in the PLSR analysis was determined by minimizing the leave-one-out cross-validated root mean square error of predictions (RMSEPCV). The variable importance projection (VIP) statistic was computed in order to evaluate the relative importance of reflectance at different wavelengths in the PLSR model. VIP values >1 indicated high importance to the PLSR model [19].
The model’s coefficients were obtained by fitting each model against the measured NEE. The main goodness-of-fit statistics (coefficient of determination—R2, percentage root mean square error (PRMSE)) were computed to compare the performances of the different models. All the statistical analyses were performed by means of the R soſtware (version 3.0.3, https://www.r-project.org/).

2.5. Ecosystem Function and Diversity Relationships: Spatial Dynamics

To investigate ecosystem productivity and diversity relationships across spatial scales, thirty 60 × 60 m ROIs located on the grassland plateau (Figure 1) were considered (five ROIs corresponding to the EC towers and the other 25 haphazardly chosen ROIs) in grassland homogeneous areas, i.e., where the disturbance due to the presence of rocks, roads, and small bushes was negligible (<1%). The average coefficient of variation in reflectance across space (CV, defined as “optical diversity”) for all the wavelengths between 430–900 nm was calculated (at increasing pixel sizes of 0.9, 2, 5, 10, 20, 30 m, obtained by spatial resampling) as in Wang et al. [2]:
CV = ( Σ λ = 430 900 ( std ( ρ λ ) mean ( ρ λ ) ) ) /   number   of   bands
where ρ λ is the reflectance at wavelength λ, std( ρ λ ) and mean ( ρ λ ) are the standard deviation and mean value of reflectance at wavelength λ across all pixels in one 60 × 60 m ROI, respectively. CV calculations were performed for both full-spectrum hyperspectral bands (AisaEAGLE) and S2 simulated multispectral bands (bands highlighted in bold, Table 1). CV is representing the variability of the spectral information content of pixels included in a given ROI (Figure 1). Instead of original reflectance values as in Wang et al. [2], the Continuum Removal (CR) reflectance was considered, adopting a spectral transformation technique (using the CR function of the R package “prospectr”; [44]) to enhance individual spectral features reducing noise from the sensor, atmosphere, soil background, topographic variation, and differences in albedo [13].
For all thirty ROIs, the average values of the investigated SVIs calculated based on S2 simulated bands was finally calculated and the across-scale correlations between these SVIs and CVs (calculated from both full-spectrum AisaEAGLE bands and S2 simulated bands) were assessed at increasing pixel sizes. To verify the possible collinearity between the aforementioned variables, a collinearity test was run using the NumXL Microsoft Excel add-in (Spider Financial Corp., IL, USA). Accordingly, maps coupling the optical diversity (CV) and MERIS terrestrial chlorophyll index (MTCI; Table 2) were obtained to visualize optical diversity and productivity patterns for the different investigated ecosystems.

3. Results

3.1. NEE Estimations

The linear regression analysis showed a large range of variation of R2 values of the correlations between the investigated SVIs and NEE (Table 3). Traditional VIS-NIR SVIs showed highly variable performances when considering flights on a separate basis (model 1: R2 up to 0.89). Red-edge based SVIs showed R2 values ranging from 0.41–0.79. For model 1, NIDI indices showed extremely variable R2 values (up to 0.75).
Considering the model 2, a strong increase of the predictive performance was observed. The R2 of the model fed with NIDI1 reached 0.90 and PRMSE 14.54 % (Table 3), and red-edge SVIs R2 values were very high (MTCI was the second-best index and reached an R2 value of 0.85).
The PLSR (model 3) demonstrated that 95% of the variation in NEE could be explained by algorithms derived from AisaEAGLE spectra (7 latent components; PRMSE = 10.25%), with a heterogeneous statistical contribution of the various wavelengths (Figure 2). The most relevant region of the spectrum was at the very end of the chlorophyll absorption wavelengths (VIP peak at 741.9 nm; VIP value 3.14). The adjacent bands also showed high VIP values: For wavelengths <741.9nm, the VIP values were still higher than 2 for bands 737.3, 732.6, 727.9, and 723.3 nm. Also, considering the NIR shoulder bands >741.9 nm (towards the NIR-shoulder region), band 746.6 and 751 showed VIP values higher than 2. VIP values were higher than 1 up to 800 nm, indicating a relevant contribution of the NIR spectral domain.

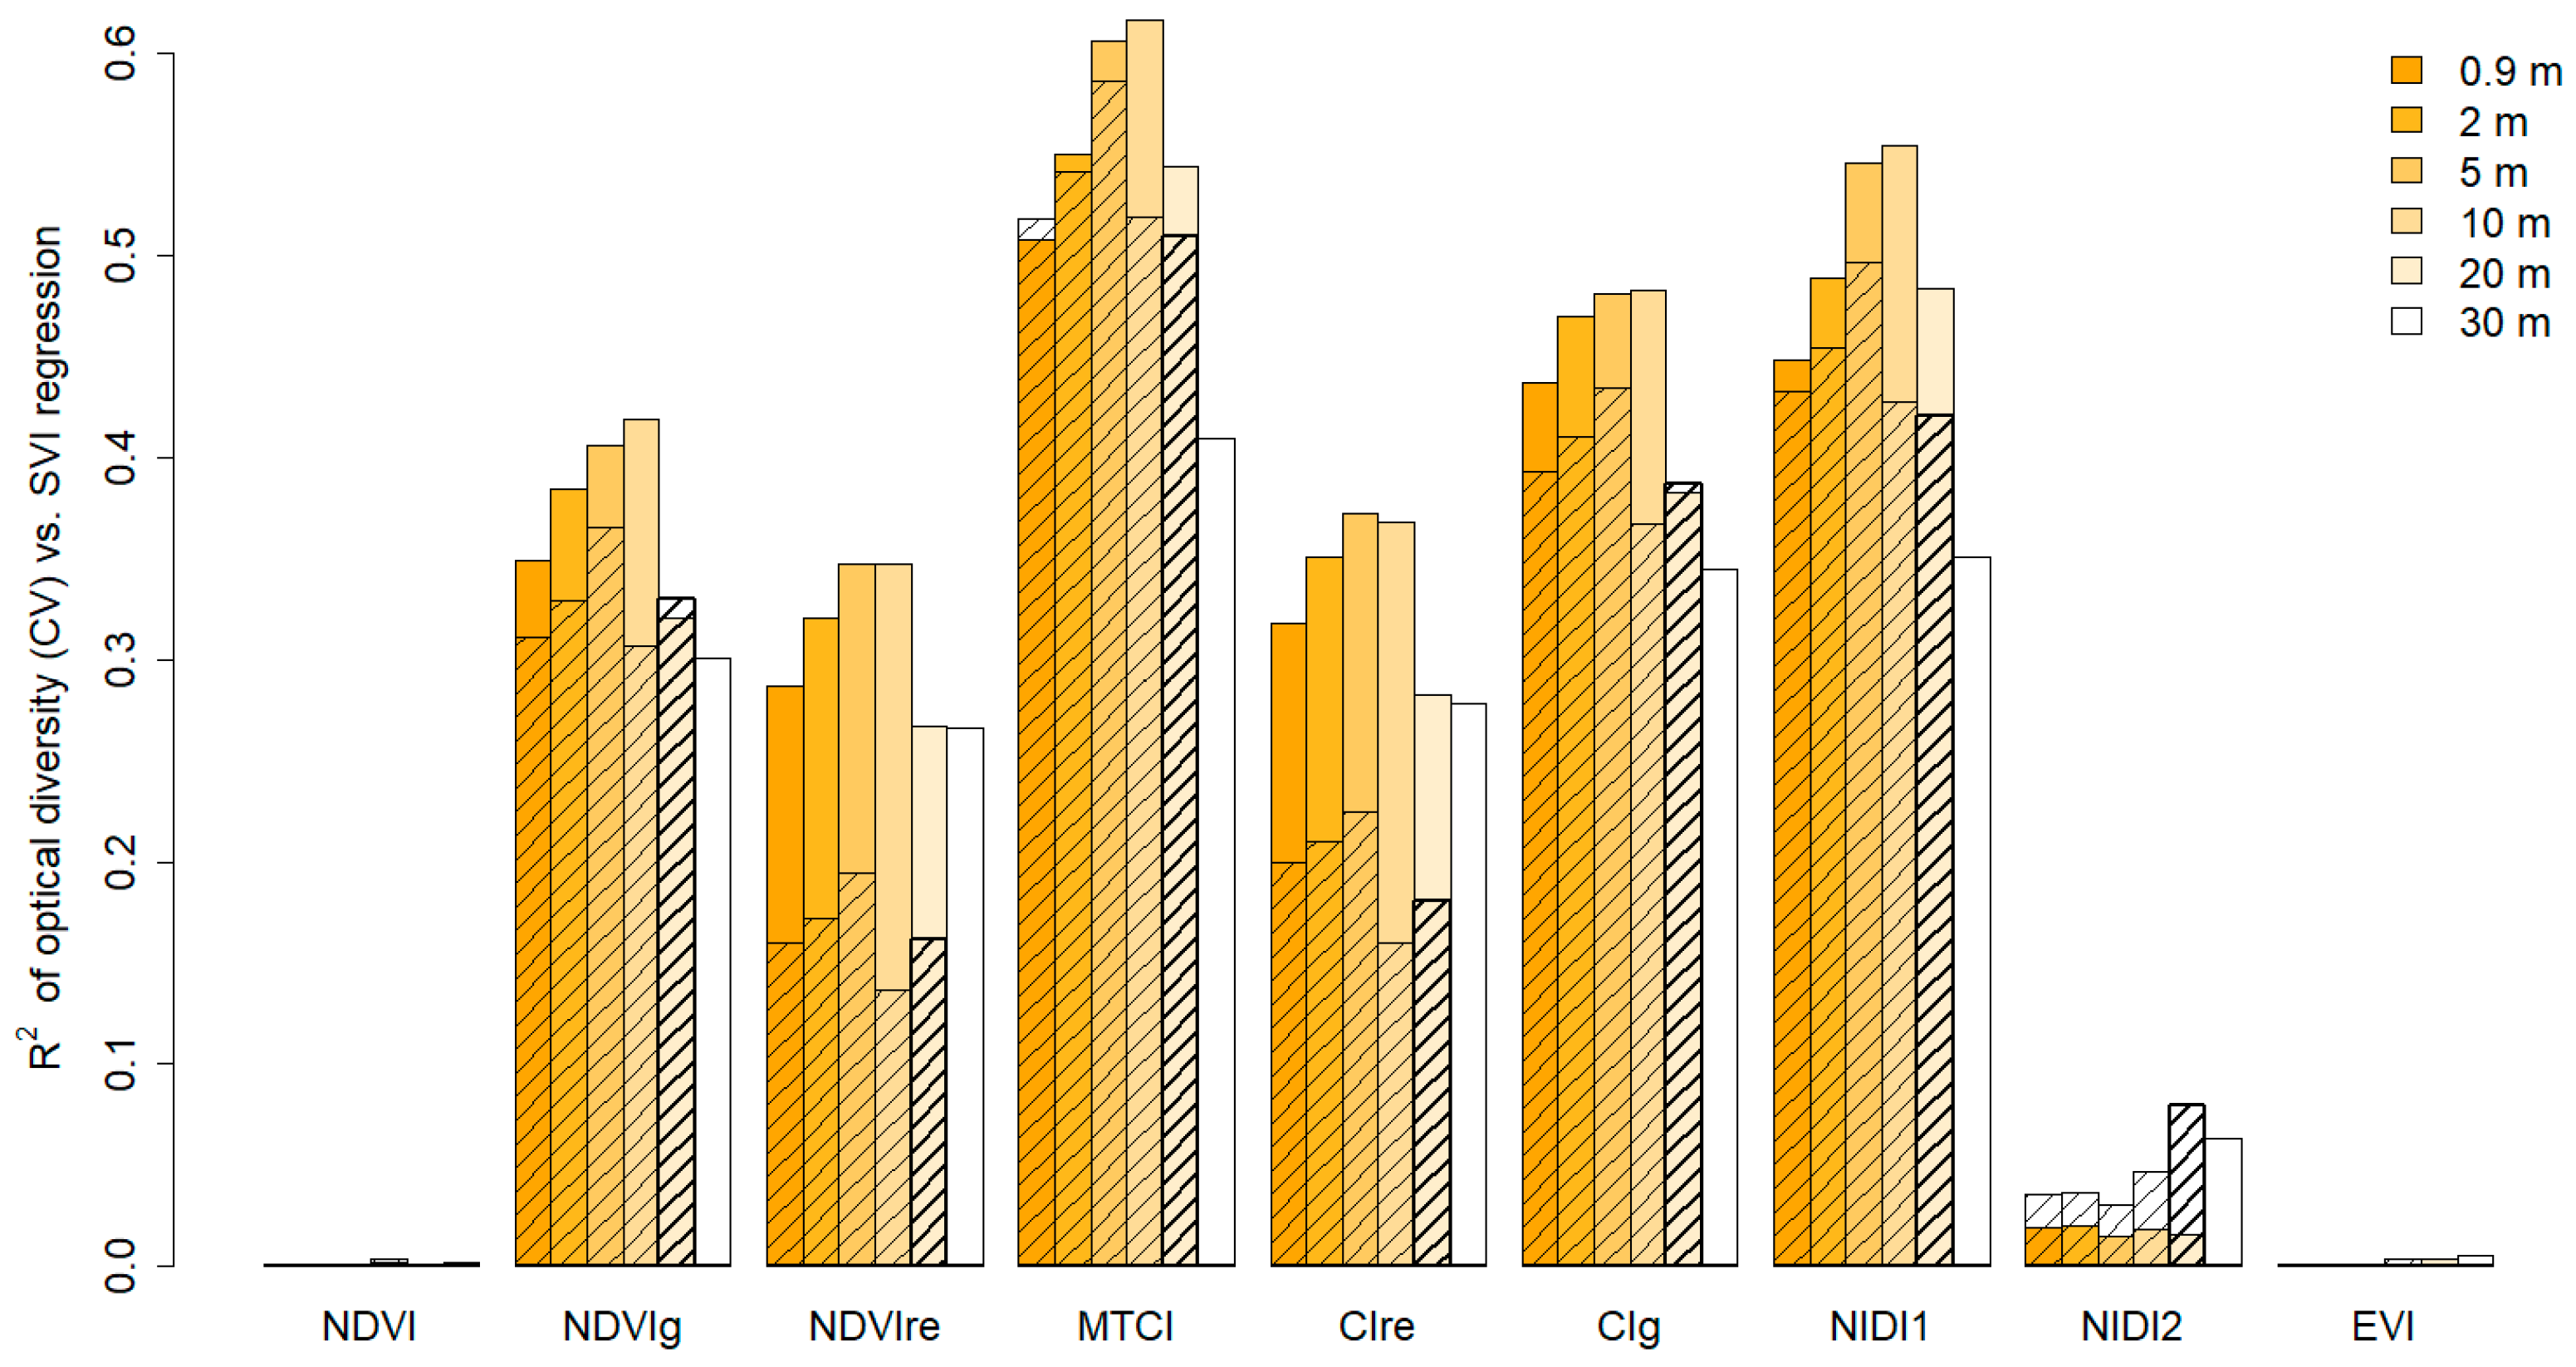
3.2. Ecosystem Optical Diversity and Productivity

Ecosystem optical diversity showed linear positive correlations with the best NEE predictors (Figure 3), indicating evident optical diversity and productivity relationships. The collinearity test showed that there was no collinearity between SVIs and CVs as at the Variance Inflation Factor (VIF) values range was included between 1 and 2.61. The highest correlations between SVIs and CVs (CV calculated from full spectrum) were observed for MTCI (R2 = 0.61) and NIDI1 (R2 = 0.51), which were, in turn, the SVIs which were best correlated with NEE. Quite surprisingly, the widely-used SVIs NDVI and EVI, although they were good proxies of NEE (Table 3), showed very low correlations with CV. Across-scale observations indicated a clear scale-dependency of optical diversity and ecosystem productivity relationships, with an evident across-scale hump-shaped pattern of R2 values for most SVIs. The best results were mostly obtained with 10 meters pixels (Figure 3), while the 20 meters spatial resolution (corresponding to the S2 resolution of the bands needed to calculate all the investigated SVIs) was still able to provide important information on ecosystem diversity and productivity relationships (MTCI R2 = 0.54). Conversely, when the 30-meter spatial resolution was considered, a noticeable decrease in the coefficient of determination was observed (MTCI R2 = 0.40).
When optical diversity (CV) was calculated from S2 simulated bands (Figure 3), a similar across-scale pattern was observed, with only slightly lower R2 values compared to the ones obtained when CV was calculated from full-range hyperspectral data.
The MTCI and CV maps including the average optical diversity and the MTCI productivity proxy values within the 30 60 × 60 m ROIs enabled the visualization of the ecosystem diversity-productivity patterns for the investigated grassland ecosystems (Figure 4).

4. Discussion

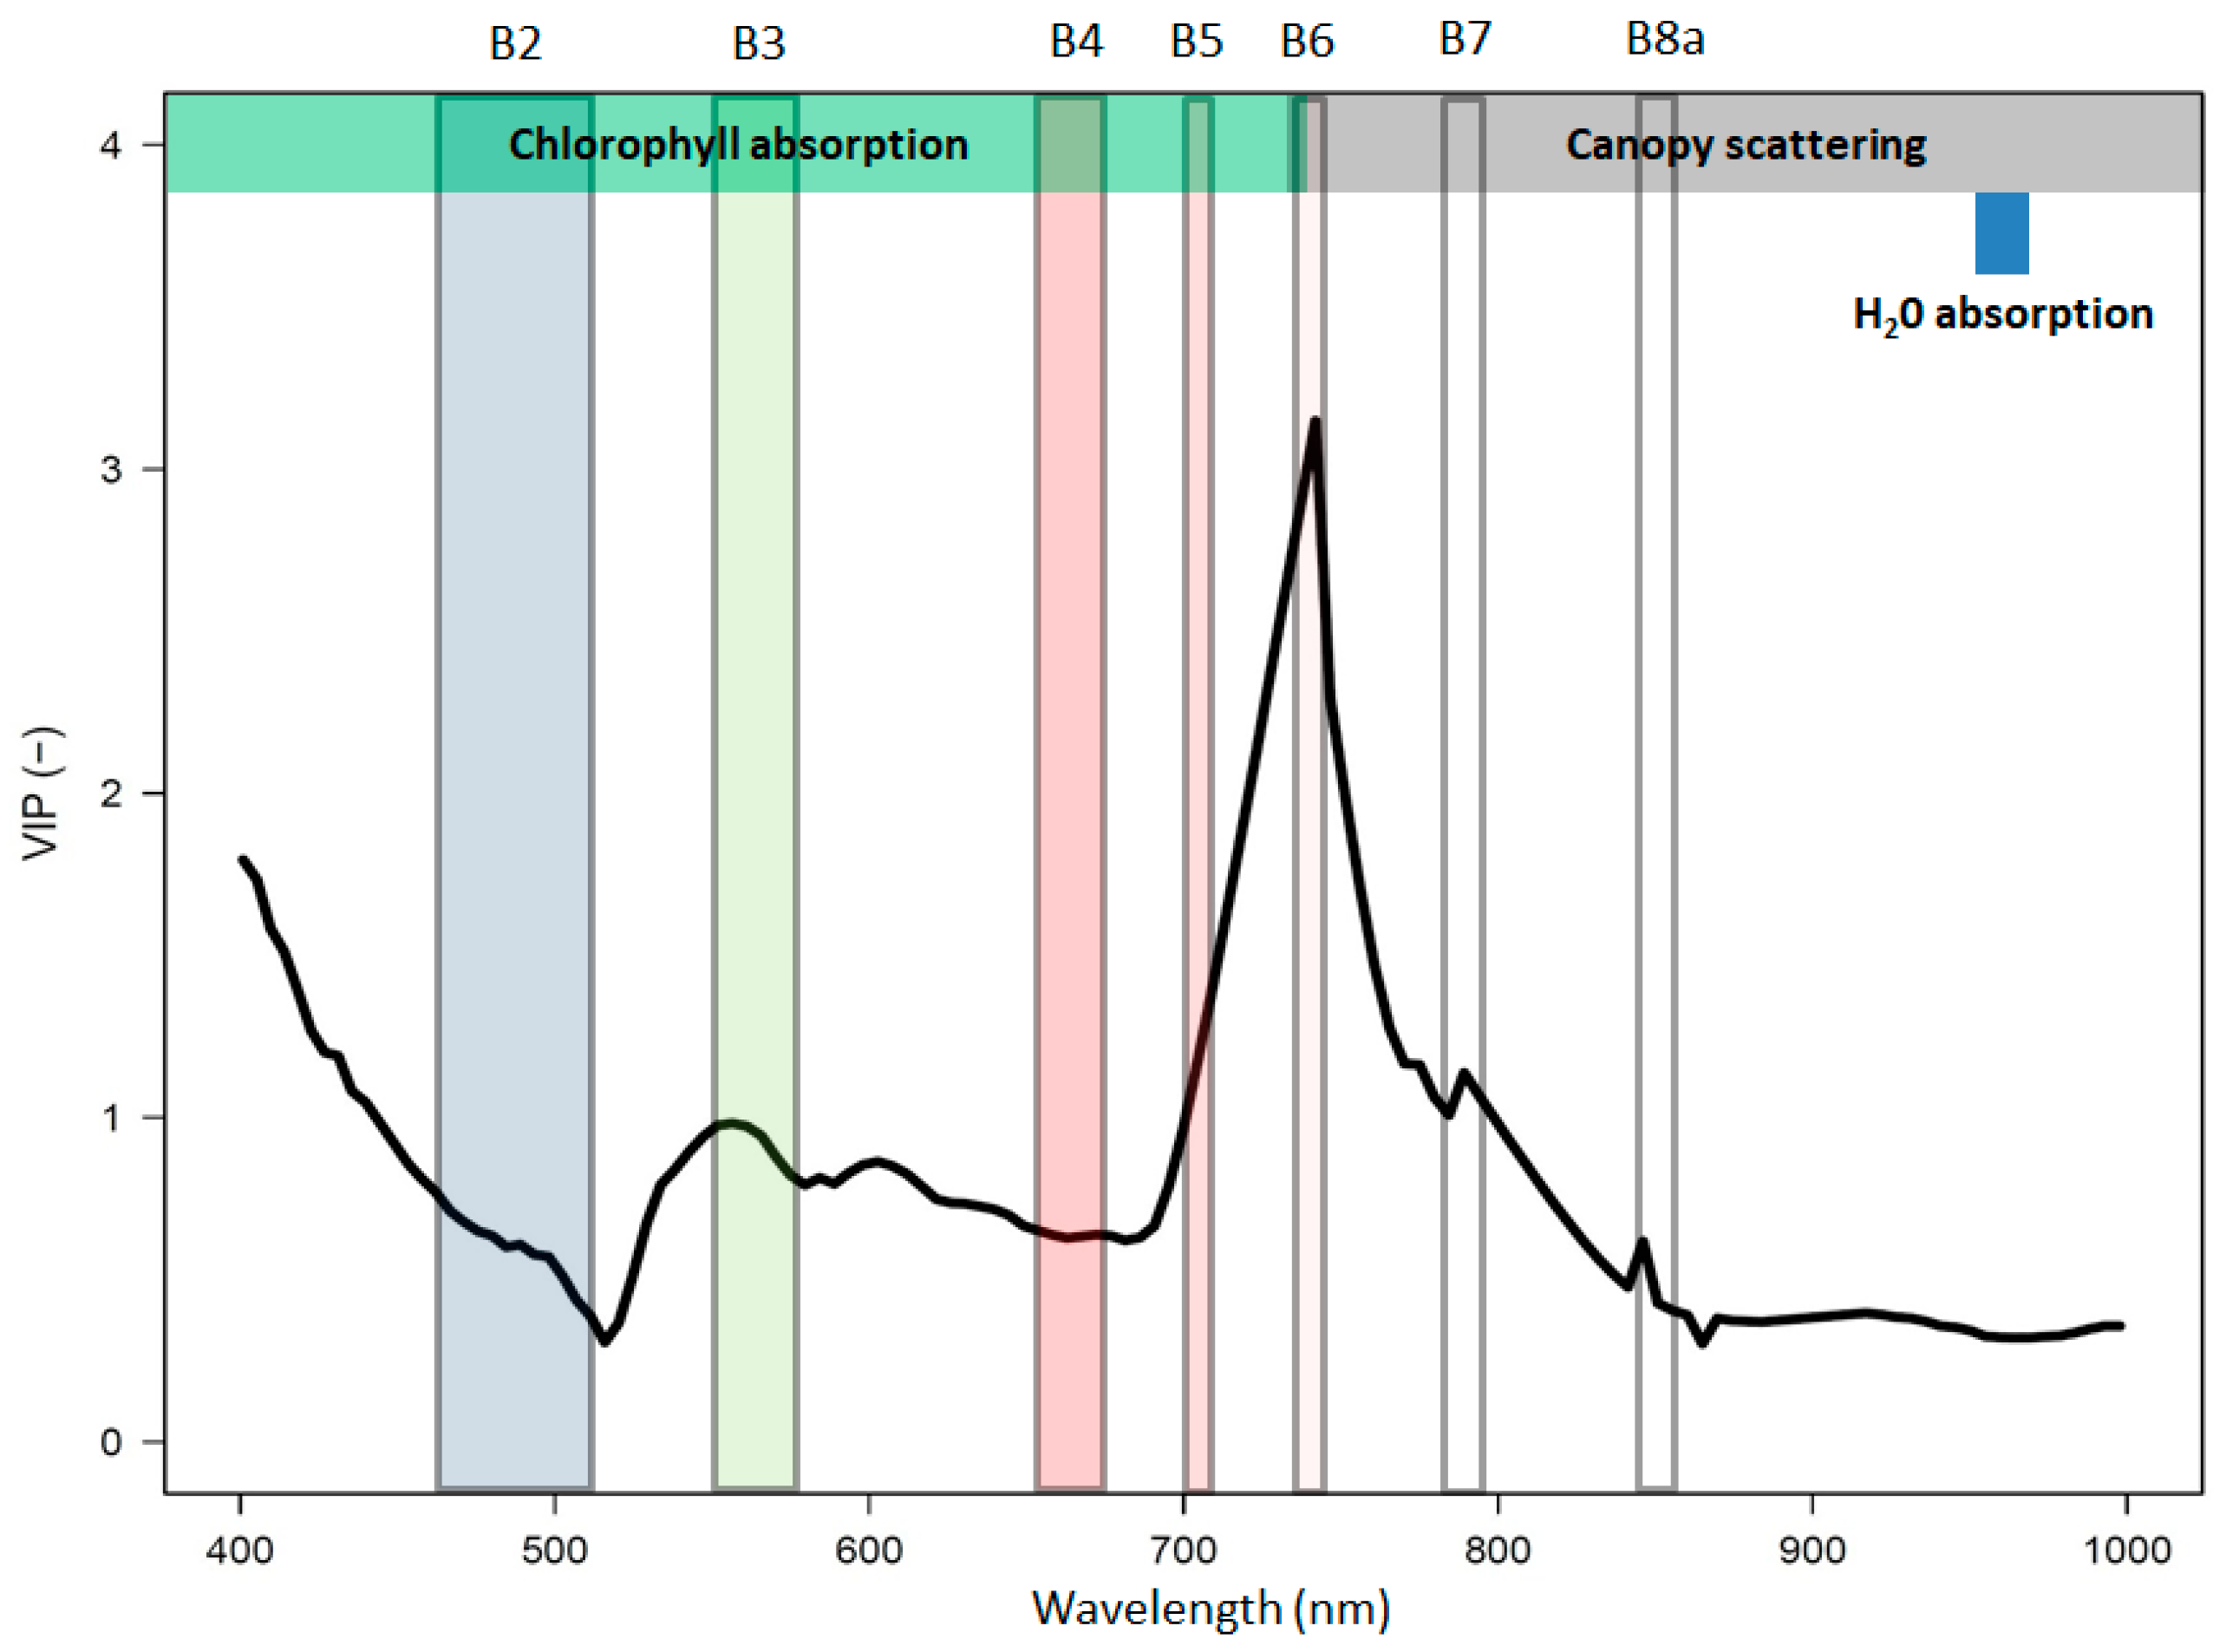
4.1. Chlorophyll and Structural Controls on Ecosystem Function

Analyzing the relative contributions of different spectral domains for predicting productivity of different grassland ecosystems, both structural and biochemical controls were highlighted (Figure 2). Numerous studies demonstrated how the red-edge spectral domain [45] can be used for monitoring chlorophyll-related canopy traits (i.e., fAPAR and LAI) and ecosystem productivity of herbaceous ecosystems [16,17,18,19,24,47,48].
Band combinations investigated by these authors included at least one band <740 nm, in the region of the spectrum which is sensitive to chlorophyll absorption.
Indices calculated with NIR band combinations are expected to be influenced mostly by canopy structure [25,28,48]. As canopy chlorophyll is usually calculated as the product of foliar chlorophyll and LAI [36], the correlations between canopy chlorophyll content and NIR-based indices may be indirect and mostly driven by factors related to canopy structure and architecture. As demonstrated by Ollinger [25], variables such as cellular leaf anatomy, leaf clumping, and leaf angle distribution (which are contributing to the whole canopy architecture and, in turn, to scattering and reflectance in the NIR region) co-vary with traits strongly related to photosynthesis. The underlying mechanisms of such co-variations have only been partially explored and need more research.
Within model 1, the R2 values between some SVIs and NEE showed variations among the three different flights (e.g., NDVI performance was much better in flight 3 in respect to the other two flights). Such variations very likely result from uncertainties which are typically associated with both EC flux [49,50,51] and spectral measurements [52,53], and from the constrained number of tower observations per flight available in the study. However, distinctive results were shown by both model 1 and model 2. The good performance of NIR-based indices is pointing out a substantial canopy structural control on photosynthesis. The correlations between NIR-based indices and productivity were often stronger than the ones observed with traditional VIS-NIR SVIs, as shown by Vescovo et al. [26] and Matthes et al. [27]. But how strong are structural controls on productivity? Can we expect relevant structural controls even in ecosystems where leaf chlorophyll content is strongly varying? According to the results of Sakowska et al. [54], who compared the photosynthetic activity of a soybean chlorophyll deficient mutant (with approximately 80% less chlorophyll than green varieties) and a wildtype, the leaf and canopy structure still appeared to be the key drivers for light absorption and photosynthesis dynamics.

4.2. Optical Diversity and Productivity Across-Scale Observations

In contrast with what was observed by Fraser et al. [8] at the global scale, our within-site observations on optical diversity and ecosystem productivity seemed to indicate positive linear BPRs for grasslands including a wide biomass range. More RS-based studies following the optical diversity approach (investigating the link between biodiversity indices and optical diversity, and combining multiple within-site observations, at upper scales) are recommended to clarify the possible impact of different sampling approaches and observation scales on the obtained results.
The optical diversity-productivity relationships were shown to be strongly scale-dependent as observed using a modeling approach for detecting BPRs by Grace et al. [1]. In our study, SVIs which were best correlated with optical diversity (MTCI and NIDI1; model 2 in Table 3) were, in turn, also the best proxies of productivity.
Spectral diversity incorporates not only ecosystem characteristics detectable at very small scale, such as species richness and leaf biochemical properties, but also canopy structure, which is expected to be detectable at relatively larger scales. Accordingly, Wang et al. [29] suggested that the relevant patch size (defined as a relatively homogenous spatial unit) for canopy structure is expected to be larger than the one for leaf biochemical traits. Our results on NIR-based indices confirm the importance of structural controls on diversity and productivity relationships, but on another hand suggest comparable biochemistry and structure optimal patch sizes, as the optical diversity vs. productivity R2 values at increasing pixel sizes of both VIS-NIR and NIR-based indices (Figure 3) showed a similar hump-shaped trend.
NDVI and EVI (Figure 3) showed, in most cases, extremely low coefficient of determination values. These results are in strong disagreement with the observations of Wang et al. [2] for NDVI, and this is probably due to the strong saturation effect [26,34], which is detectable for medium-high values of productivity.

4.3. Interpretation of the Diversity Measures Detectable with Optical Sampling

Across-scale studies are vital to verify that the spatial resolution of remote observations are matching with the grain size of field data, considering that the “optimal” pixel size is varying among biomes and communities [29] and that actual spatial heterogeneity information may be hidden at the sub-pixel level [12]. Our study, showing that the optimal pixel size for detecting optical diversity and productivity relationships was mostly 10 meters, points out the potential of adopting coarser spatial data to analyze diversity and productivity spatial patterns in grassland ecosystems and is opening the way to further research on the nature of the observed diversity. The observed across-scale ecosystem diversity and productivity linear relationships may be linked to different measures of diversity. While the observed relationships at high spatial resolution (0.9 m) may be associated to grassland α-diversity at the plot level (as the pixel size is more comparable with the plant size), for larger-scale observations the diversity-productivity relationships may be related to other measures of diversity, such as β-diversity [29]. In the investigated grasslands ecosystems, β-diversity may be related to small-scale spatial variability of ecological factors (e.g., soil properties, slope) and varying disturbance effects (e.g., land use intensity).

4.4. The Potential of Sentinel-2 Optical Data to Analyze Ecosystem BPRs at the Global Scale

The most striking result of our study is that, when the optical diversity (CV) was calculated from S2 simulated data (thus both spectral and spatial resolutions corresponded to the S2 sensor), across-scale patterns of diversity and productivity still could be observed, with only slightly lower R2 values compared to the CV calculated from full-range hyperspectral data (Figure 3).
Such results are opening exciting perspectives on the possible use of S2 to monitor grassland BPRs spatial patterns starting from within-site observations (focusing on the links between spectra and biodiversity indices) and scaling up to the landscape, regional, and global levels of observation. S2 is expected to help ecologists to extensively explore BPRs patterns linked to higher levels of diversity (such as β-diversity) for grassland ecosystem types where single plant size is small. Using remote sensing imagery, selected optical-based proxies of plant traits are expected to significantly improve the combined analysis of taxonomic and functional diversity [31]. Also, further studies are needed to assess the suitability of coarser resolution data to monitor diversity and productivity patterns in other ecosystem and vegetation types (e.g., forests, shrublands) where the higher single plant size is expected to facilitate the detection of lower-level diversity.

5. Conclusions

In this study, we adopted an optical-based approach to estimate productivity and optical diversity-productivity relationships. Our results demonstrated both structural and biochemical controls on grassland productivity. We provided empirical evidence that the best optical proxies of ecosystem productivity were also the best correlated with optical diversity. Our study assessed the linearity of optical diversity and productivity relationships for a wide range of productivity and highlighted their strong scale-dependency.
Using the optical diversity approach, we proved that S2 multispectral data are able to provide unprecedented datasets to extensively explore optical diversity and productivity patterns, providing a first basis for using satellite observations for assessing BPRs within and across different ecosystem types, scaling up to the landscape, regional, and global levels for novel developments in ecology studies.

Author Contributions

Conceptualization, K.S., D.G., B.G., F.M., M.R., D.R. and L.V.; Data curation, K.S., G.A., B.G., A.P., F.M., F.F., T.J. and M.R.; Formal analysis, K.S., A.M., M.D. and L.V.; Methodology, K.S., D.G., B.G., F.M., M.R., D.R. and L.V.; Writing—original draft, K.S. and L.V.; Writing—review & editing, K.S., A.M., D.G., M.D., G.A., B.G., F.M., A.P., F.M., F.F., T.J., M.R., D.R. and L.V.

Funding

This publication is based upon work from COST Actions ES0903 EUROSPEC and ES1309 OPTIMISE, supported by COST (European Cooperation in Science and Technology; www.cost.eu). This project has received funding from the European Union’s Horizon 2020 research and innovation programme under the Marie Skłodowska-Curie grant agreement No 749323 and No 721995.

Conflicts of Interest

The authors declare no conflict of interest. The funders had no role in the design of the study; in the collection, analyses, or interpretation of data; in the writing of the manuscript, or in the decision to publish the results.

References

  1. Grace, J.B.; Anderson, T.M.; Seabloom, E.W.; Borer, E.T.; Adler, P.B.; Harpole, W.S.; Hautier, Y.; Hillebrand, H.; Lind, E.M.; Pärtel, M.; et al. Integrative modelling reveals mechanisms linking productivity and plant species richness. Nature 2016, 529, 390–393. [Google Scholar] [CrossRef]
  2. Wang, R.; Gamon, J.A.; Emmerton, C.A.; Li, H.; Nestola, E.; Pastorello, G.Z.; Menzer, O. Integrated analysis of productivity and biodiversity in a southern Alberta prairie. Remote Sens. 2016, 8, 214. [Google Scholar] [CrossRef]
  3. Van Ruijven, J.; Berendse, F. Positive effects of plant species diversity on productivity in the absence of legumes. Ecol. Lett. 2003, 6, 170–175. [Google Scholar] [CrossRef]
  4. Lambers, J.H.R.; Harpole, W.S.; Tilman, D.; Knops, J.; Reich, P.B. Mechanisms responsible for the positive diversity-productivity relationship in Minnesota grasslands. Ecol. Lett. 2004, 7, 661–668. [Google Scholar] [CrossRef]
  5. Bessler, H.; Temperton, V.M.; Roscher, C.; Buchmann, N.; Schulze, E.-D.; Weisser, W.W.; Engels, C. Aboveground Overyielding in Grassland Mixtures Is Associated with Reduced Biomass Partitioning to Belowground Organs. Ecology 2009, 90, 1520–1530. [Google Scholar] [CrossRef]
  6. Grace, J.B.; Anderson, T.M.; Smith, M.D.; Seabloom, E.; Andelman, S.J.; Meche, G.; Weiher, E.; Allain, L.K.; Jutila, H.; Sankaran, M.; et al. Does species diversity limit productivity in natural grassland communities? Ecol. Lett. 2007, 10, 680–689. [Google Scholar] [CrossRef] [Green Version]
  7. Fava, F.; Parolo, G.; Colombo, R.; Gusmeroli, F.; Della Marianna, G.; Monteiro, A.T.; Bocchi, S. Fine-scale assessment of hay meadow productivity and plant diversity in the European Alps using field spectrometric data. Agric. Ecosyst. Environ. 2010, 137, 151–157. [Google Scholar] [CrossRef]
  8. Fraser, L.H.; Pither, J.; Jentsch, A.; Sternberg, M.; Zobel, M.; Askarizadeh, D.; Bartha, S.; Beierkuhnlein, C.; Bennett, J.A.; Bittel, A. Worldwide evidence of a unimodal relationship between productivity and plant species richness. Science 2015, 349, 302–305. [Google Scholar] [CrossRef] [Green Version]
  9. Roscher, C.; Temperton, V.M.; Scherer-Lorenzen, M.; Schmitz, M.; Schumacher, J.; Schmid, B.; Buchmann, N.; Weisser, W.W.; Schulze, E.D. Overyielding in experimental grassland communities—Irrespective of species pool or spatial scale. Ecol. Lett. 2005, 8, 419–429. [Google Scholar] [CrossRef]
  10. Chase, J.M.; Leibold, M.A. Spatial scale dictates the productivity—Biodiversity relationship. Nature 2002, 416, 427–430. [Google Scholar] [CrossRef]
  11. Knipling, E.B. Physical and Physiological Basis for the Reflectance of Visible and Near Infrared Radiation from Vegetation. Remote Sens. Environ. 1970, 1, 155–159. [Google Scholar] [CrossRef]
  12. Rocchini, D. Effects of spatial and spectral resolution in estimating ecosystem α-diversity by satellite imagery. Remote Sens. Environ. 2007, 111, 423–434. [Google Scholar] [CrossRef]
  13. Aneece, I.P.; Epstein, H.; Lerdau, M. Correlating species and spectral diversities using hyperspectral remote sensing in early-successional fields. Ecol. Evol. 2017, 7, 3475–3488. [Google Scholar] [CrossRef]
  14. Kumar, L.; Mutanga, O. Remote sensing of above-ground biomass. Remote Sens. 2017, 9, 935. [Google Scholar] [CrossRef]
  15. Monteith, J.L. Climate and the Efficiency of Crop Production in Britain. Philos. Trans. R. Soc. B Biol. Sci. 1977, 281, 277–294. [Google Scholar] [CrossRef]
  16. Peng, Y.; Gitelson, A.A. Remote estimation of gross primary productivity in soybean and maize based on total crop chlorophyll content. Remote Sens. Environ. 2012, 117, 440–448. [Google Scholar] [CrossRef]
  17. Sakowska, K.; Vescovo, L.; Marcolla, B.; Juszczak, R.; Olejnik, J.; Gianelle, D. Monitoring of carbon dioxide fluxes in a subalpine grassland ecosystem of the Italian Alps using a multispectral sensor. Biogeosciences 2014, 11, 4695–4712. [Google Scholar] [CrossRef] [Green Version]
  18. Viña, A.; Gitelson, A.A. New developments in the remote estimation of the fraction of absorbed photosynthetically active radiation in crops. Geophys. Res. Lett. 2005, 32, 1–4. [Google Scholar] [CrossRef]
  19. Sakowska, K.; Juszczak, R.; Gianelle, D. Remote Sensing of Grassland Biophysical Parameters in the Context of the Sentinel-2 Satellite Mission. J. Sens. 2016, 2016, 1–16. [Google Scholar] [CrossRef]
  20. Jackson, R.D.; Huete, A.R. Interpreting vegetation indices. Prev. Vet. Med. 1991, 11, 185–200. [Google Scholar] [CrossRef]
  21. Wu, C.; Niu, Z.; Tang, Q.; Huang, W.; Rivard, B.; Feng, J. Remote estimation of gross primary production in wheat using chlorophyll-related vegetation indices. Agric. For. Meteorol. 2009, 149, 1015–1021. [Google Scholar] [CrossRef]
  22. Rossini, M.; Meroni, M.; Migliavacca, M.; Manca, G.; Cogliati, S.; Busetto, L.; Picchi, V.; Cescatti, A.; Seufert, G.; Colombo, R. High resolution field spectroscopy measurements for estimating gross ecosystem production in a rice field. Agric. For. Meteorol. 2010, 150, 1283–1296. [Google Scholar] [CrossRef]
  23. Rossini, M.; Cogliati, S.; Meroni, M.; Migliavacca, M.; Galvagno, M.; Busetto, L.; Cremonese, E.; Julitta, T.; Siniscalco, C.; Morra di Cella, U.; et al. Remote sensing-based estimation of gross primary production in a subalpine grassland. Biogeosciences 2012, 9, 2565–2584. [Google Scholar] [CrossRef] [Green Version]
  24. Frampton, W.J.; Dash, J.; Watmough, G.; Milton, E.J. Evaluating the capabilities of Sentinel-2 for quantitative estimation of biophysical variables in vegetation. ISPRS J. Photogramm. Remote Sens. 2013, 82, 83–92. [Google Scholar] [CrossRef] [Green Version]
  25. Ollinger, S.V. Sources of variability in canopy reflectance and the convergent properties of plants. New Phytol. 2011, 189, 375–394. [Google Scholar] [CrossRef] [PubMed]
  26. Vescovo, L.; Wohlfahrt, G.; Balzarolo, M.; Pilloni, S.; Sottocornola, M.; Rodeghiero, M.; Gianelle, D. New spectral vegetation indices based on the near-infrared shoulder wavelengths for remote detection of grassland phytomass. Int. J. Remote Sens. 2012, 33, 2178–2195. [Google Scholar] [CrossRef] [PubMed]
  27. Matthes, J.H.; Knox, S.H.; Sturtevant, C.; Sonnentag, O.; Verfaillie, J.; Baldocchi, D. Predicting landscape-scale CO2 flux at a pasture and rice paddy with long-term hyperspectral canopy reflectance measurements. Biogeosciences 2015, 12, 4577–4594. [Google Scholar] [CrossRef]
  28. Knyazikhin, Y.; Schull, M.A.; Stenberg, P.; Mõttus, M.; Rautiainen, M.; Yang, Y.; Marshak, A.; Latorre Carmona, P.; Kaufmann, R.K.; Lewis, P.; et al. Hyperspectral remote sensing of foliar nitrogen content. Proc. Natl. Acad. Sci. USA 2013, 110, E185–E192. [Google Scholar] [CrossRef] [PubMed]
  29. Wang, R.; Gamon, J.A.; Cavender-Bares, J.; Townsend, P.A.; Zygielbaum, A.I. The spatial sensitivity of the spectral diversity-biodiversity relationship: An experimental test in a prairie grassland. Ecol. Appl. 2018, 28, 541–556. [Google Scholar] [CrossRef] [PubMed]
  30. Whittaker, R.H. Evolution and Measurement of Species Diversity. Taxon 1972, 21, 213–251. [Google Scholar] [CrossRef]
  31. Rocchini, D.; Bacaro, G.; Chirici, G.; Da Re, D.; Feilhauer, H.; Foody, G.M.; Galluzzi, M.; Garzon-Lopez, C.X.; Gillespie, T.W.; He, K.S.; et al. Remotely sensed spatial heterogeneity as an exploratory tool for taxonomic and functional diversity study. Ecol. Indic. 2018, 85, 983–990. [Google Scholar] [CrossRef] [Green Version]
  32. Donita, N.; Ivan, D.; Pedrotti, F. Structure and Productivity of the Meadows of Viote on Monte Bondone; Centro di ecologia alpine: Trento, Italy, 2003; p. 36. [Google Scholar]
  33. Lüth, C.; Tasser, E.; Niedrist, G.; Via, J.D.; Tappeiner, U. Plant communities of mountain grasslands in a broad cross-section of the Eastern Alps. Flora Morphol. Distrib. Funct. Ecol. Plants 2011, 206, 433–443. [Google Scholar] [CrossRef]
  34. Vescovo, L.; Gianelle, D. Mapping the green herbage ratio of grasslands using both aerial and satellite-derived spectral reflectance. Agric. Ecosyst. Environ. 2006, 115, 141–149. [Google Scholar] [CrossRef]
  35. Clevers, J.G.P.W.; Kooistra, L.; van den Brande, M.M.M. Using Sentinel-2 data for retrieving LAI and leaf and canopy chlorophyll content of a potato crop. Remote Sens. 2017, 9, 405. [Google Scholar] [CrossRef]
  36. Peng, Y.; Nguy-Robertson, A.; Arkebauer, T.; Gitelson, A.A. Assessment of canopy chlorophyll content retrieval in maize and soybean: Implications of hysteresis on the development of generic algorithms. Remote Sens. 2017, 9, 226. [Google Scholar] [CrossRef]
  37. Rouse, J.W.; Haas, R.H.; Schell, J.A.; Deering, D.W.; Harlan, J.C. Monitoring the Vernal Advancement and Retrogradation (Green Wave Effect) of Natural Vegetation; Final Report; NASA/GSFC: Greenbelt, MD, USA, 1974; p. 390.
  38. Gitelson, A.; Merzlyak, M.N. Quantitative estimation of chlorophyll-a using reflectance spectra: Experiments with autumn chestnut and maple leaves. J. Photochem. Photobiol. 1994, 22, 247–252. [Google Scholar] [CrossRef]
  39. Dash, J.; Curran, P.J. The MERIS terrestrial chlorophyll index. Int. J. Remote Sens. 2004, 25, 5403–5413. [Google Scholar] [CrossRef]
  40. Gitelson, A.A.; Gritz, Y.; Merzlyak, M.N. Relationships between leaf chlorophyll content and spectral reflectance and algorithms for non-destructive chlorophyll assessment in higher plant leaves. J. Plant Physiol. 2003, 160, 271–282. [Google Scholar] [CrossRef]
  41. Huete, A.; Didan, K.; Miura, T.; Rodriguez, E.P.; Gao, X.; Ferreira, L.G. Overview of the radiometric and biophysical performance of the MODIS vegetation indices. Remote Sens. Environ. 2002, 83, 195–213. [Google Scholar] [CrossRef]
  42. Serbin, S.P.; Singh, A.; Desai, A.R.; Dubois, S.G.; Jablonski, A.D.; Kingdon, C.C.; Kruger, E.L.; Townsend, P.A. Remotely estimating photosynthetic capacity, and its response to temperature, in vegetation canopies using imaging spectroscopy. Remote Sens. Environ. 2015, 167, 78–87. [Google Scholar] [CrossRef]
  43. Mevik, B.-H.; Wehrens, R. The pls package: Principal component and partial least squares regression in R. J. Stat. Softw. 2007, 18, 1–23. [Google Scholar] [CrossRef]
  44. Stevens, A.; Ramirez-Lopez, L. An Introduction to the Prospectr Package. Available online: https://cran.r-project.org/web/packages/prospectr/vignettes/prospectr-intro.pdf (accessed on 9 January 2019).
  45. Curran, P.J.; Dungan, J.L.; Gholz, H.L. Exploring the relationship between reflectance red edge and chlorophyll content in slash pine. Tree Physiol. 1990, 7, 33–48. [Google Scholar] [CrossRef] [Green Version]
  46. Peñuelas, J.; Piñol, J.; Ogaya, R.; Filella, I. Estimation of plant water concentration by the reflectance Water Index WI (R900/R970). Int. J. Remote Sens. 1997, 18, 2869–2875. [Google Scholar] [CrossRef]
  47. Clevers, J.G.P.W.; Gitelson, A.A. Remote estimation of crop and grass chlorophyll and nitrogen content using red-edge bands on Sentinel-2 and -3. Int. J. Appl. Earth Obs. Geoinf. 2013, 23, 344–351. [Google Scholar] [CrossRef]
  48. Delegido, J.; Verrelst, J.; Rivera, J.P.; Ruiz-Verdú, A.; Moreno, J. Brown and green LAI mapping through spectral indices. Int. J. Appl. Earth Obs. Geoinf. 2015, 35, 350–358. [Google Scholar] [CrossRef]
  49. Hollinger, D.Y.; Richardson, A.D. Uncertainty in eddy covariance measurements and its application to physiological models. Tree Physiol. 2005, 25, 873–885. [Google Scholar] [CrossRef] [Green Version]
  50. Papale, D.; Reichstein, M.; Aubinet, M.; Canfora, E.; Bernhofer, C.; Kutsch, W.; Longdoz, B.; Rambal, S.; Valentini, R.; Vesala, T.; et al. Towards a standardized processing of Net Ecosystem Exchange measured with eddy covariance technique: Algorithms and uncertainty estimation. Biogeosciences 2006, 3, 571–583. [Google Scholar] [CrossRef]
  51. Richardson, A.D.; Hollinger, D.Y.; Burba, G.G.; Davis, K.J.; Flanagan, L.B.; Katul, G.G.; Munger, J.W.; Ricciuto, D.M.; Stoy, P.C.; Suyker, A.E.; et al. A multi-site analysis of random error in tower-based measurements of carbon and energy fluxes. Agric. For. Meteorol. 2006, 136, 1–18. [Google Scholar] [CrossRef] [Green Version]
  52. Kerr, G.H.G.; Fischer, C.; Reulke, R. A data-driven approach to quality assessment for hyperspectral systems. Comput. Geosci. 2015, 83, 100–109. [Google Scholar] [CrossRef]
  53. Anderson, K.; Dungan, J.L.; MacArthur, A. On the reproducibility of field-measured reflectance factors in the context of vegetation studies. Remote Sens. Environ. 2011, 115, 1893–1905. [Google Scholar] [CrossRef]
  54. Sakowska, K.; Alberti, G.; Genesio, L.; Peressotti, A.; Delle Vedove, G.; Gianelle, D.; Colombo, R.; Rodeghiero, M.; Panigada, C.; Juszczak, R.; et al. Leaf and canopy photosynthesis of a chlorophyll deficient soybean mutant. Plant Cell Environ. 2018, 41, 1427–1437. [Google Scholar] [CrossRef]
Figure 1. The Viote del Monte Bondone RGB image derived from AisaEAGLE hyperspectral data including the five Eddy Covariance towers positions (indicated by letters from A–E) and the thirty 60 × 60 m regions of interest (ROIs) used in this study for optical diversity assessment. Reflectance values for each 0.9 m pixel (in grey) and the ROI mean reflectance value (in red) are indicated as an example of spectral variability within a single ROI. Optical diversity and productivity relationships were analyzed at the thirty 60 × 60 m ROIs at an increasing pixel size window (from 0.9–20 m; see the upper right corner). At the bottom, a list of the three flights carried out during the campaign including the adapted solar time window for averaging Net Ecosystem Exchange (NEE) and photosynthetically active radiation (PAR) data.
Remotesensing 11 00614 g001
Figure 2. Variable importance of projection (VIP) statistics for the modeling coefficients of partial least squared regression (7 components; R2 = 0.95; RMSE 10.25%) based on AisaEAGLE ROI reflectance data (circular ROIs with a radius of 30m), fitted to the Eddy Covariance measured Net Ecosystem Exchange (NEE). The Sentinel-2 bands used in the study are highlighted, as well as the chlorophyll absorption, the leaf and canopy scattering ranges [45], and the NIR water absorption peak [46].
Remotesensing 11 00614 g002
Figure 3. Across-scale optical diversity and productivity relationships (calculated for the 30 60 × 60 m ROIs) expressed as the R2 values of the linear regression between CV (calculated from continuum-removed reflectance) and spectral vegetation indices at increasing pixel sizes (0.9–30 m). Solid color bars indicate the R2 values when the CV was calculated from the AisaEAGLE full spectrum continuum-removed reflectance, while the striped-line bars indicate the R2 values when the CV was calculated only from the continuum-removed reflectance values of the Sentinel-2 simulated bands. The bars highlighted with a bold line are indicating the R2 values obtained with the full simulation (both spectral and spatial resolution) of Sentinel-2 data.
Remotesensing 11 00614 g003
Figure 4. Map of the productivity (expressed as MTCI, on the left) and optical diversity (expressed as CV, on the right) values for the 30 60 × 60 m ROIs located on the different grasslands associations. The spectral and spatial resolutions of the image used to process the map were achieved resampling the AisaEAGLE hyperspectral imagery and simulate the resolutions which can be obtained using Sentinel-2 data to calculate all the investigated SVIs. Darker green colors correspond to higher levels of productivity (expressed as MTCI, on the left) and optical diversity (expressed as CV, on the right).
Remotesensing 11 00614 g004
Table 1. Specification of the Multi-Spectral Instrument (MSI) of the Sentinel-2 (S2) satellite system. The bands which were simulated for spectral vegetation indices (SVIs) and for the S2 CV calculations are shown in bold.
Band NumberCentral Wavelength (nm)Bandwidth (nm)Spatial Resolution (m)
B14432060
B24906510
B35603510
B46653010
B57051520
B67401520
B77832020
B884211510
B8a8652020
B99452060
B1013803060
B1116109020
B12219018020
Table 2. Spectral vegetation indices (SVIs) presented in this study: normalized difference vegetation index (NDVI), green normalized difference vegetation index (NDVIg), red-edge normalized difference vegetation index (NDVIre), MERIS terrestrial chlorophyll index (MTCI), red-edge chlorophyll index (CIre), green chlorophyll index (CIg), and enhanced vegetation index (EVI). The list includes two near-infrared difference indices (NIDI1, NIDI2) using NIR bands ≥740 nm. R refers to reflectance at a specific S2 simulated band (nm).
SVIFormulationReference
NDVI(R865-R665)/(R865+R665)[37]
NDVIg(R865-R560)/(R865+R560)[38]
NDVIre(R865-R705)/(R865+R705)[38]
MTCI(R865-R705)/(R705+R665)[39]
CIre(R865/R705)-1[40]
CIg(R865/R561)-1[40]
NIDI1(R865-R740)/(R865+R740)Proposed in this study
NIDI2(R865-R783)/(R865+R783)[26]
EVI2.5*(R865-R665)/(1+R865+6*R665-7.5*R490)[41]
Table 3. Summary of the statistics (R2—coefficient of determination, PRMSE—percentage root mean square error) of the linear regression between measured Net Ecosystem Exchange (NEE) and spectral vegetation indices (SVIs; model 1) for single flights (F1, F2 and F3) and the product of SVIs and photosynthetically active radiation for all flights together (F1F2F3*: SVIs*PAR; model 2).
SVIModel 1Model 2
F1F2F3F1F2F3*
R2PRMSE (%)R2PRMSE (%)R2PRMSE (%)R2PRMSE (%)
NDVI0.2613.210.2537.680.896.840.7722.07
NDVIg0.678.850.7023.900.7210.890.8020.61
NDVIre0.649.180.4133.360.6012.910.8020.47
MTCI0.757.680.5230.200.799.400.8517.89
CIre0.659.020.4233.230.6112.810.8219.34
CIg0.708.370.6625.280.7310.520.8120.17
NIDI10.737.930.5230.220.7510.190.9014.54
NIDI20.0015.330.2039.050.0020.430.7523.14
EVI0.846.210.2537.650.7410.510.8020.84

