Application of Slag–Cement and Fly Ash for Strength Development in Cemented Paste Backfills


School of Civil, Environmental and Mining Engineering, The University of Adelaide, Adelaide, SA 5005, Australia
*
Authors to whom correspondence should be addressed.
Minerals 2019, 9(1), 22; https://doi.org/10.3390/min9010022
Submission received: 25 October 2018
/
Revised: 24 December 2018
/
Accepted: 24 December 2018
/
Published: 30 December 2018
(This article belongs to the Special Issue Backfilling Materials for Underground Mining)
Abstract
:The present study investigates the combined capacity of a newly developed slag-blended cement (MC) and fly ash (FA) as a sustainable solution towards improving the mechanical performance of the cemented paste backfill (CPB) system of a copper-gold underground mine. A total of thirteen mix designs consisting of three MC-treated and ten MC + FA-treated blends were examined. Samples were prepared with a solids content of 77% (by total mass), and were allowed to cure for 7, 14, 28, 56 and 128 days prior unconfined compression testing. Scanning electron microscopy (SEM) studies were also carried out to observe the evolution of fabric in response to MC and MC + FA amendments. The greater the MC content and/or the longer the curing period, the higher the developed strength, toughness and stiffness. The exhibited improvements, however, were only notable up to 56 days of curing, beyond of which the effect of curing was marginal. The performance of 4% Portland cement or PC (by total dry mass) was found to be similar to that of 1.5% MC, while the higher MC inclusions of 2.5% and 3%, though lower in terms of binder content, unanimously outperformed 4% PC. The use of FA alongside MC improved the bonding/connection interface generated between the tailings aggregates, and thus led to improved mechanical performance compared with similar MC inclusions containing no FA. Common strength criteria for CPBs were considered to assess the applicability of the newly introduced MC and MC + FA mix designs. The mix designs “3% MC” and “2.5% MC + 2–2.5% FA” satisfied the 700 kPa strength threshold required for stope stability, and thus were deemed as optimum design choices.
1. Introduction
Mine tailings, a by-product of the ore beneficiation process, are among the largest and most problematic sources of solid waste. Approximately 14 billion tons of tailings were produced globally by the mining industry in 2010 [1]. Given the high-volume generation of tailings every year throughout the world, a significant concern hitherto has been the space required for storing and transporting these waste materials, and the resulting environmental hazards and costs [2,3]. Tailings have been traditionally deposited into tailings storage facilities such as embankments, dams and other types of surface impoundments [4,5]. These conventional disposal methods, though commonly practiced, are often associated with serious environmental, geotechnical (or structural failure) and economic concerns [6,7,8].
The mining process involves the removal and recovery of economically valuable minerals from the earth’s crust. The resulting excavations are commonly revived by a process referred to as backfilling [9,10,11]. The fill performs as both a support system and a working platform; its different roles determine the requirements of its mechanical properties. Backfilling techniques can be categorized into three groups, namely, rock fills, hydraulic fills and paste fills, which can be implemented in cemented or uncemented forms [12]. Cemented Paste Backfill (CPB) is a high-density slurry composed of dewatered tailings, a cementitious binder and processed mine water, which is thickened to obtain a non-settling character for facile pumping into mined cavities resulted from underground mine operations. The desired rheological behavior, the non-settling character, often emerges at a solids content (by total mass) ranging between 70% and 85% [12,13,14]. CPB technology recycles tailings into underground mine excavations, and as such, reduces the volume of surface-disposed tailings, mitigates the burden on the environment, and assists waste management [15,16,17,18].
Over the past few decades, CPB technology has been increasingly applied to reviving mined cavities in underground mine operations, owing to its low operating costs as well as its superior mechanical performance compared with other backfilling methods, i.e., rock fills and hydraulic fills [19,20,21,22]. Strength performance of CPBs is governed by physicochemical and mineralogical properties of the tailings, chemical composition of the mixing water, binder type (and its content), the adopted mix design (or solids content), and in situ stress and curing conditions [5,23,24,25,26,27,28]. Ordinary Portland cement is often implemented as the cementitious binder; its application for strength development of CPBs has been well documented in the literature. Some reports indicate that the cost of CPB implementation tends to vary from 10% to 20% of the mine’s total operating cost, and the cementitious binder represents up to 75% of the total CPB cost [11]. In an attempt to minimize costs while maintaining the strength performance at its required level, the use of alternative binders and/or additives should be sought. In this context, several studies have examined the efficiency of newly developed cement blends, fly ashes, nano-silica particles and superplasticizers [5,18,29,30,31,32,33]. Though promising, the reported results are not consistent in defining an ad hoc alternative for Portland cement, and as such, further research is urgently required.
The present study examines the combined capacity of a newly developed slag-blended cement, the binder, and fly ash, the additive, as a sustainable solution towards improving the mechanical performance of a copper-gold underground mine CPB system. A series of unconfined compression tests were carried out on various binder and binder + additive mix designs to evaluate the effect of binder and/or additive contents and curing time on strength, toughness and stiffness of the CPB system. Additional tests were also carried out on samples prepared with ordinary Portland cement for comparison. Finally, scanning electron microscopy (SEM) studies were carried out to observe the evolution of fabric in response to the binder and binder + additive amendments.
2. Materials
2.1. Mine Tailings
A large quantity of processed tailings was sourced from a copper-gold underground mine, and was used in the present study. The physical and mechanical properties of the tailings, determined as per relevant ASTM and Australian (AS) standards, are summarized in Table 1. The conventional grain-size analysis, carried out in accordance with ASTM D422–07, indicated a fines fraction (<75 μm) of 38.6%, along with 55.2% fine sand (0.075–0.425 mm) and 6.2% medium sand (0.425–2 mm). The liquid limit and plasticity index were, respectively, measured as wL = 19.2% and IP = 6.1%, of which the fines fraction of the tailings was characterized as clay–silt with low plasticity (i.e., CL–ML) in accordance with the Unified Soil Classification System (USCS). The standard Proctor compaction test, carried out in accordance with ASTM D698–12, indicated an optimum water content of wopt = 8.7% and a maximum dry unit weight of γdmax = 20.2 kN/m3, which are both on par with that reported for natural CL–ML soils [34,35].
The chemical composition of the tailings, as supplied by the distributor, is provided in Table 2. The chemical composition is mainly dominated by silicon dioxide (SiO2) and ferric oxide (Fe2O3), with mass fractions of 38.27% and 37.70%, respectively.
2.2. Binders and Additives
A commercially manufactured cementitious agent, commonly traded as Mine Cement in Australia (and hereafter referred to as MC), was used as the binder. MC is a slag-blended cement specifically developed for underground mine backfilling applications. The chemical composition of MC, as supplied by the manufacturer, consists of ground-granulated blast-furnace slag (50%), Portland cement clinker (20%), cement kiln dust (<15%), natural gypsum (5–7%), limestone (<7%), and other mineral additives (see Table 3). As stated by the manufacturer, an MC content of 3% (by total dry mass) is anticipated to satisfy common strength criteria for cemented paste backfills adopted in mining applications. Class C Fly Ash, hereafter referred to as FA, was adopted as the siliceous-aluminous (or pozzolan) additive to partially replace (by mass) the main cementitious binder (or MC).
2.3. Mine Water
A large quantity of processed mine water was sourced from the underground copper-gold mine, and was used for the experimental program (see Section 3.1). The chemical composition of the processed mine water, as supplied by the distributor, is presented in Table 4. The pH was found to be 7.5, based on which the water was characterized as a neutral substance.
3. Experimental Program
3.1. Mix Designs and Sample Preparations
In this study, a total of thirteen mix designs consisting of three MC-treated and ten MC + FA-treated blends were examined (see Table 5). Hereafter, the following coding system is used to designate the various mix designs:
where Mx = x% MC; Fy = y% FA; and Tz = z days of curing.
The binder or binder + additive (MC or MC + FA), solids and water contents were, respectively, defined as:
where Bc = binder or binder + additive content (in %); Sc = solids content (in %); Wc = water content (in %); mB = mass of binder or binder + additive; mT = mass of dry tailings; and mW = mass of processed mine water.
The tailings and binder (or binder + additive) were mixed in dry form in accordance with the adopted MC and MC + FA contents summarized in Table 5. The required amount of processed mine water corresponding to a water content of Wc = 30% (or a solids content of Sc = 77%) was added to each blend, and thoroughly mixed by a mechanical mixer for approximately 5 minutes to obtain slurries of uniform consistency. The choice of Wc = 30% (or Sc = 77%) was selected as per the mine’s requirements; this provides the rheological behavior required to accommodate facile pumping of the paste into mined cavities. The resultant slurries were poured into cylindrical molds (measuring 42 mm in diameter and 100 mm in height) in one-third length increments, each layer being tamped approximately 25 times with a small metal rod to remove entrapped air. The molds were then transferred to a humidity chamber, maintained at 70% relative humidity and a temperature of 25 °C, where curing was allowed for periods of 7, 14, 28, 56 and 128 days. Upon demolding, the two ends of the samples were covered with a thin layer of dental paste, targeting surface homogeneity, and hence uniform load distribution, during unconfined compression testing (see Section 3.2).
3.2. Unconfined Compression Test
Unconfined compression (UC) tests were carried out in accordance with ASTM C39–18. The prepared samples (see Section 3.1) were axially compressed at a constant displacement rate of 0.1 mm/min. Axial strains and the corresponding axial stresses were recorded at various time intervals to a point at which the maximum axial stress required for sample failure, denoted as the peak UC strength, and its corresponding axial strain could be achieved. To ensure sufficient accuracy, triplicate samples were tested for each mix design and the median value was considered for further analyses. On account of the five curing times and the three replicates adopted, a total of 195 UC tests, i.e., 45 for MC and 150 for MC + FA, were conducted to address the thirteen mix designs outlined in Table 5. The standard deviation (SD) and the coefficient of variation (CV) for the triplicate peak UC strength data were found to range between SD = 2.0 kPa and 4.9 kPa, and CV = 0.4% and 0.8%, thus corroborating the sufficient accuracy and, hence, the repeatability of the adopted sample preparation technique and the implemented testing procedure.
3.3. Microstructure Analysis
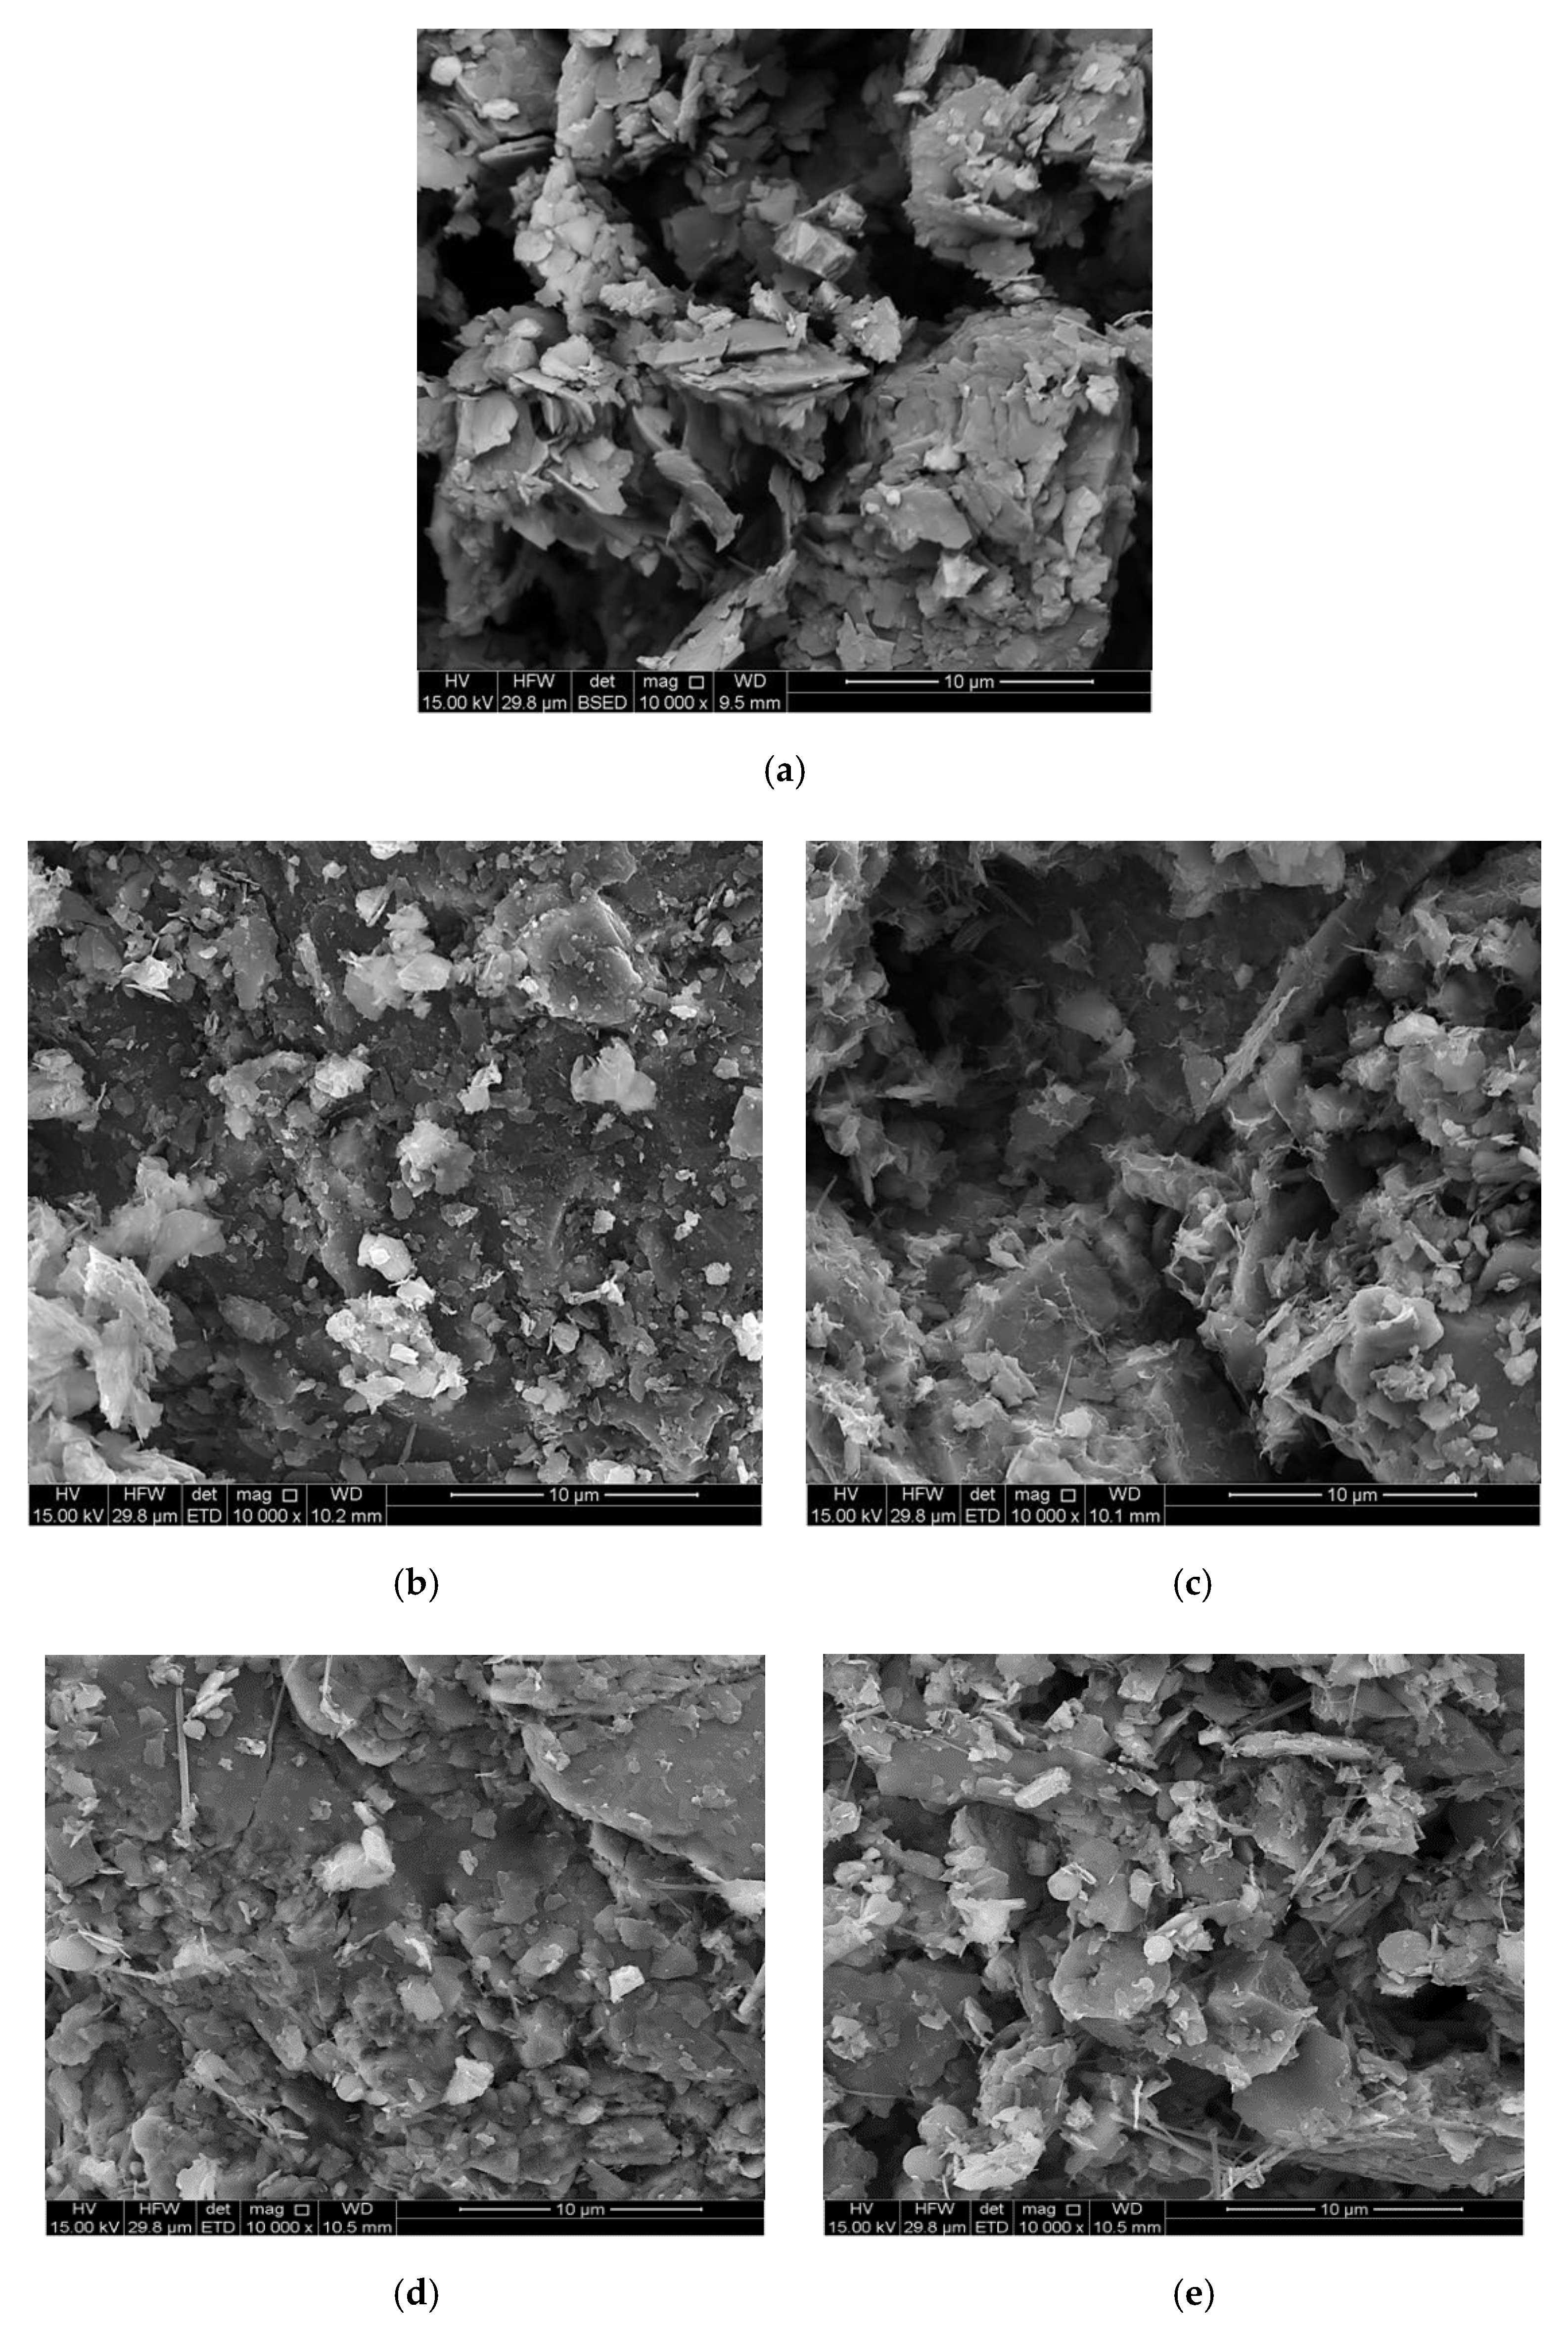
Scanning electron microscopy (SEM) studies were carried out to investigate the evolution of fabric in response to MC and MC + FA amendments. The Philips XL20 scanning electron microscope (PHILIPS, Amsterdam, The Netherlands), with a resolution of 4 μm and a maximum magnification ratio of 50,000×, was employed for SEM imaging. A total of five mix designs consisting of M0F0T7 (pure tailings), M2.5F0T7, M2.5F0T28, M2.5F1.5T7 and M2.5F1.5T28 were examined. The middle sections of the desired samples (prepared as per Section 3.1) were carefully fractured into small cubic–shaped pieces, measuring approximately 1 cm3 in volume, as suggested in the literature [36,37], and were further scanned over various magnification ratios ranging from 250× to 20,000×. The pure tailings sample (or M0F0T7) was prepared in a similar fashion to that described for various MC and MC + FA blends (see Section 3.1). In this case, however, the molded tailings slurry was allowed to desiccate under room temperature conditions (for 7 days) to gain rigidity for SEM testing.
4. Results and Discussions
4.1. Effect of MC on UC Strength
Stress–strain curves, obtained from the UC tests, for various MC-treated mixtures—MxFyTz where x = {1.5, 2.5, 3.0}, y = {0} and z = {7, 14, 28, 56, 128}—are provided in Figure A1 in the Appendix section. The stress–strain locus for all MC-treated mixtures exhibited a rise–fall behavior with visually detectable peak points, thus signifying a strain-softening character accompanied by brittle sample failures. In general, the greater the MC content and/or the longer the curing period, the more pronounced the strain-softening effect, and hence, the more dramatic the sample failures.
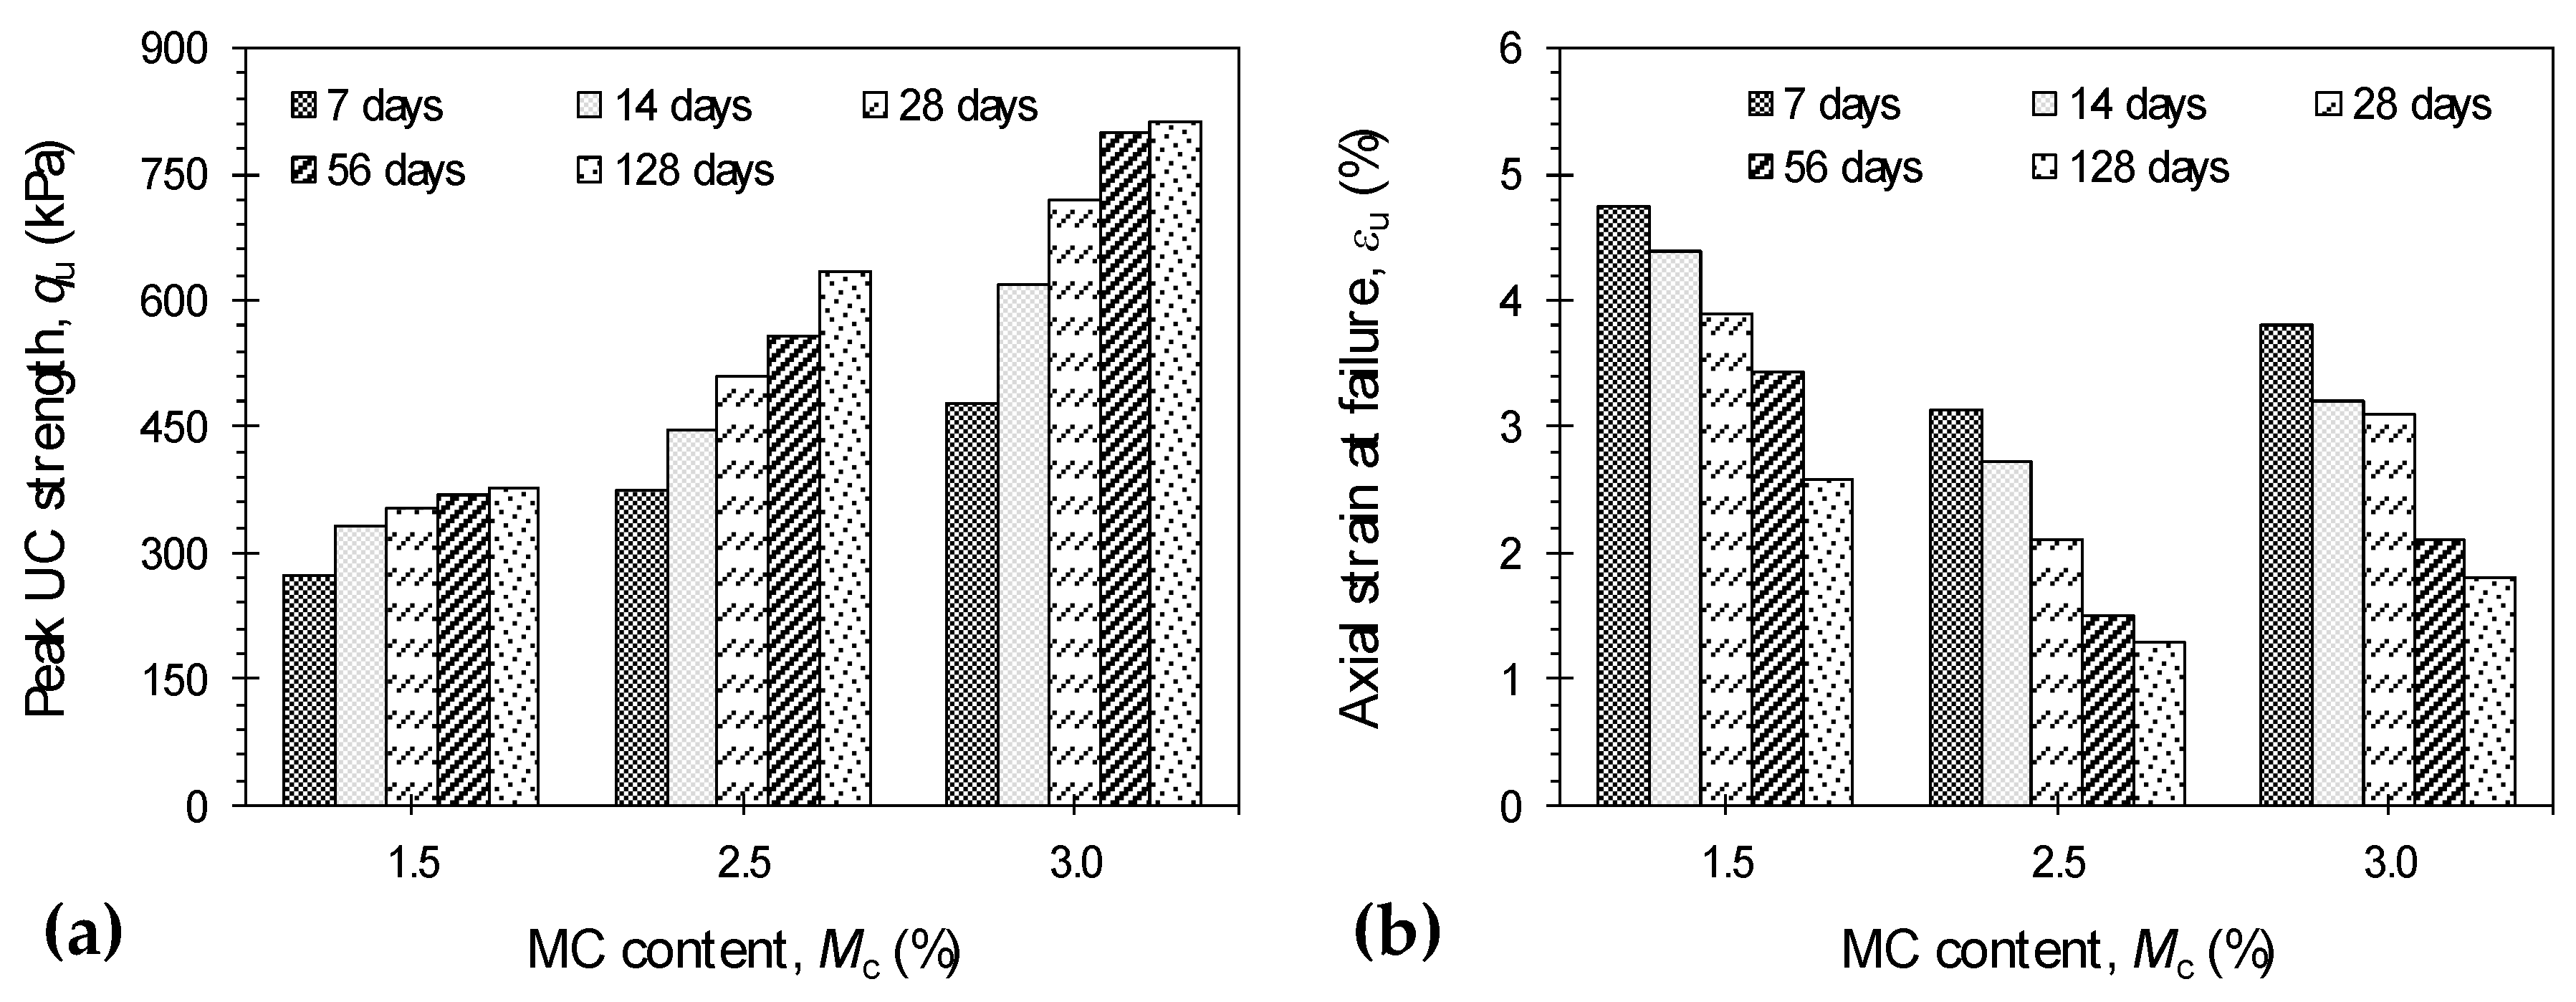
Figure 1a illustrates the variations of peak UC strength against MC content for the samples tested at various curing times. At any given curing time, the greater the MC content the higher the peak UC strength, following a monotonically increasing trend. The sample M1.5F0T7, for instance, exhibited a peak UC strength of qu = 272.1 kPa, while the inclusion of Mc = 2.5% and 3%, with the same 7-day curing condition, resulted in qu = 375.5 kPa and 476.5 kPa, respectively. Similarly, for any given MC content, an increase in curing time promoted a major increase in the peak UC strength up to Tc = 56 days, beyond of which the effect of curing was found to be rather marginal. The inclusion of 3% MC at Tc = 7 days, for instance, resulted in qu = 476.5 kPa, while higher values of 619.5 kPa, 719.3 kPa, 800.6 kPa and 812.6 kPa were noted for the same 3% MC inclusion at 14, 28, 56 and 128 days of curing, respectively.
The axial strain at failure, denoted as εu, is an indication of the material’s ductility, with higher values manifesting a more ductile/less brittle character [38,39]. Figure 1b illustrates the variations of axial strain at failure against MC content for the samples tested at various curing times. The axial strain at failure demonstrated a trend similar to that observed for the peak UC strength; however, in an adverse manner. In general, the greater the MC content and/or the longer the curing period, the lower the sample’s ductility. As typical cases, the samples M1.5F0T7, M1.5F0T128, M3.0F0T7 and M3.0F0T128 resulted in εu = 4.74%, 2.58%, 3.81% and 1.80%, respectively.
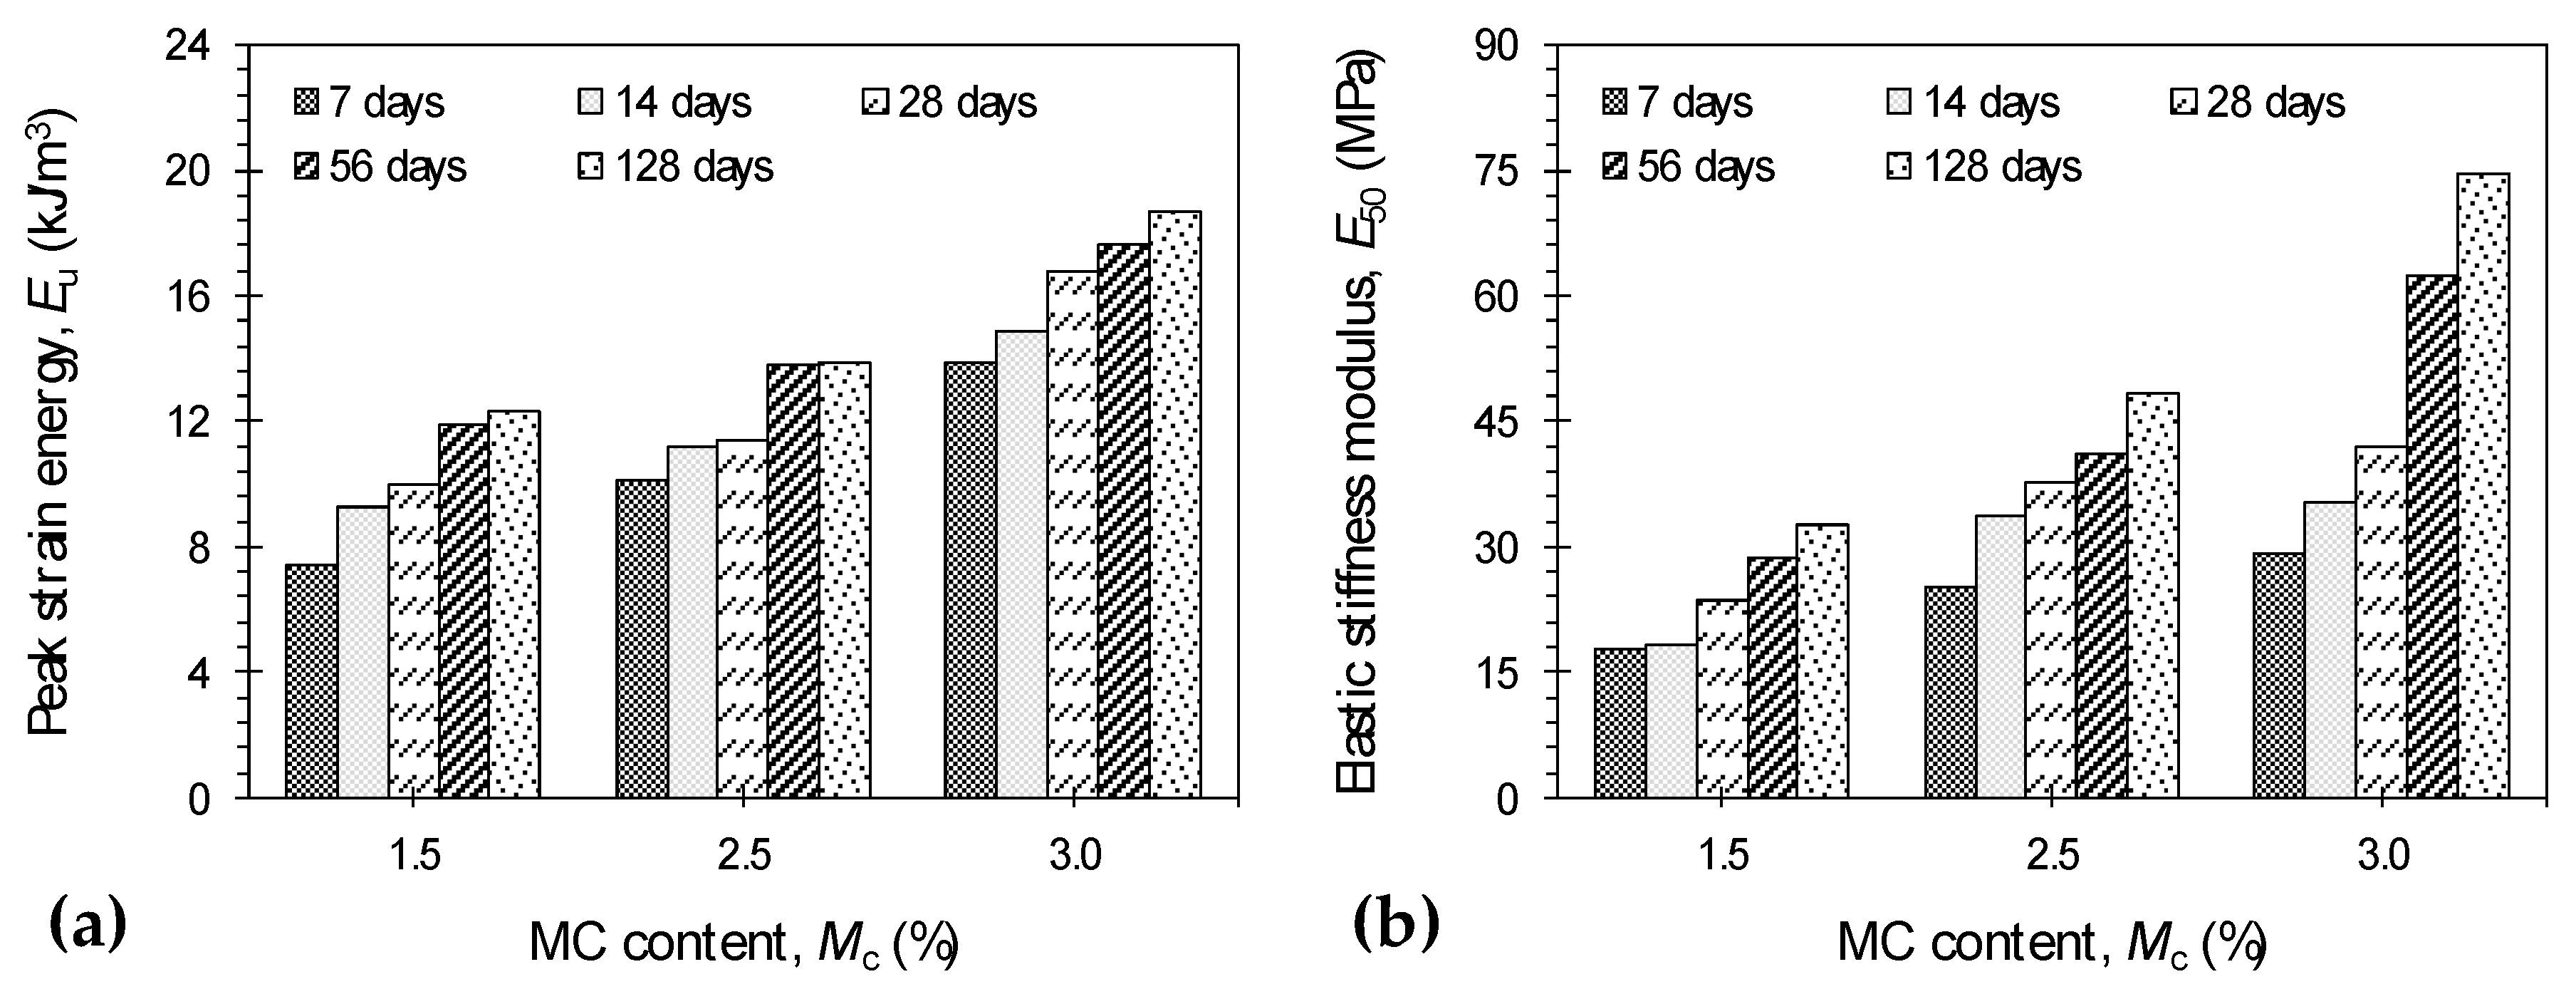
The area under a typical stress–strain curve up to the failure point, defined as peak strain energy (or energy adsorption capacity) and denoted as Eu, serves as a measure of the material’s toughness [40,41]. Figure 2a illustrates the variations of peak strain energy against MC content for the samples tested at various curing times. The variations of peak strain energy followed a trend similar to that observed for the peak UC strength, thus indicating that the greater the MC content and/or the longer the curing period, the higher the sample’s degree of toughness. An increase in peak strain energy signifies an increase in the peak UC strength and/or the axial strain at failure, thereby indicating a balance between the material’s strength and ductility [42,43,44]. As demonstrated in Figure 1b, the axial strain at failure was adversely affected by MC inclusion and/or curing time, and thus should lead to lower peak strain energy values. On the contrary, the peak UC strength was in favor of greater MC contents and/or longer curing times (see Figure 1a), which in turn should give rise to higher degrees of toughness. As such, the increase in peak strain energy, as demonstrated in Figure 2a, indicates that the improvement in qu for all MC-treated mixtures outweighs the exhibited reduction in εu. As typical cases, the samples M1.5F0T7, M1.5F0T128, M3.0F0T7 and M3.0F0T128 resulted in Eu = 7.4 kJ/m3, 12.3 kJ/m3, 13.9 kJ/m3 and 18.7 kJ/m3, respectively.
The elastic stiffness modulus, defined as the secant modulus at 50% of the peak UC strength and denoted as E50 [44,45], was also measured for various MC-treated mixtures, and the results are provided in Figure 2b. Similar to the peak UC strength and the peak strain energy, the development of stiffness was in favor of a greater MC content and/or a longer curing time. The samples M1.5F0T7 and M1.5F0T128, for instance, resulted in E50 = 17.7 MPa and 32.6 MPa, respectively. With the inclusion of 3% MC; however, higher values of 29.3 MPa and 74.6 MPa were observed at 7 and 128 days of curing, respectively.
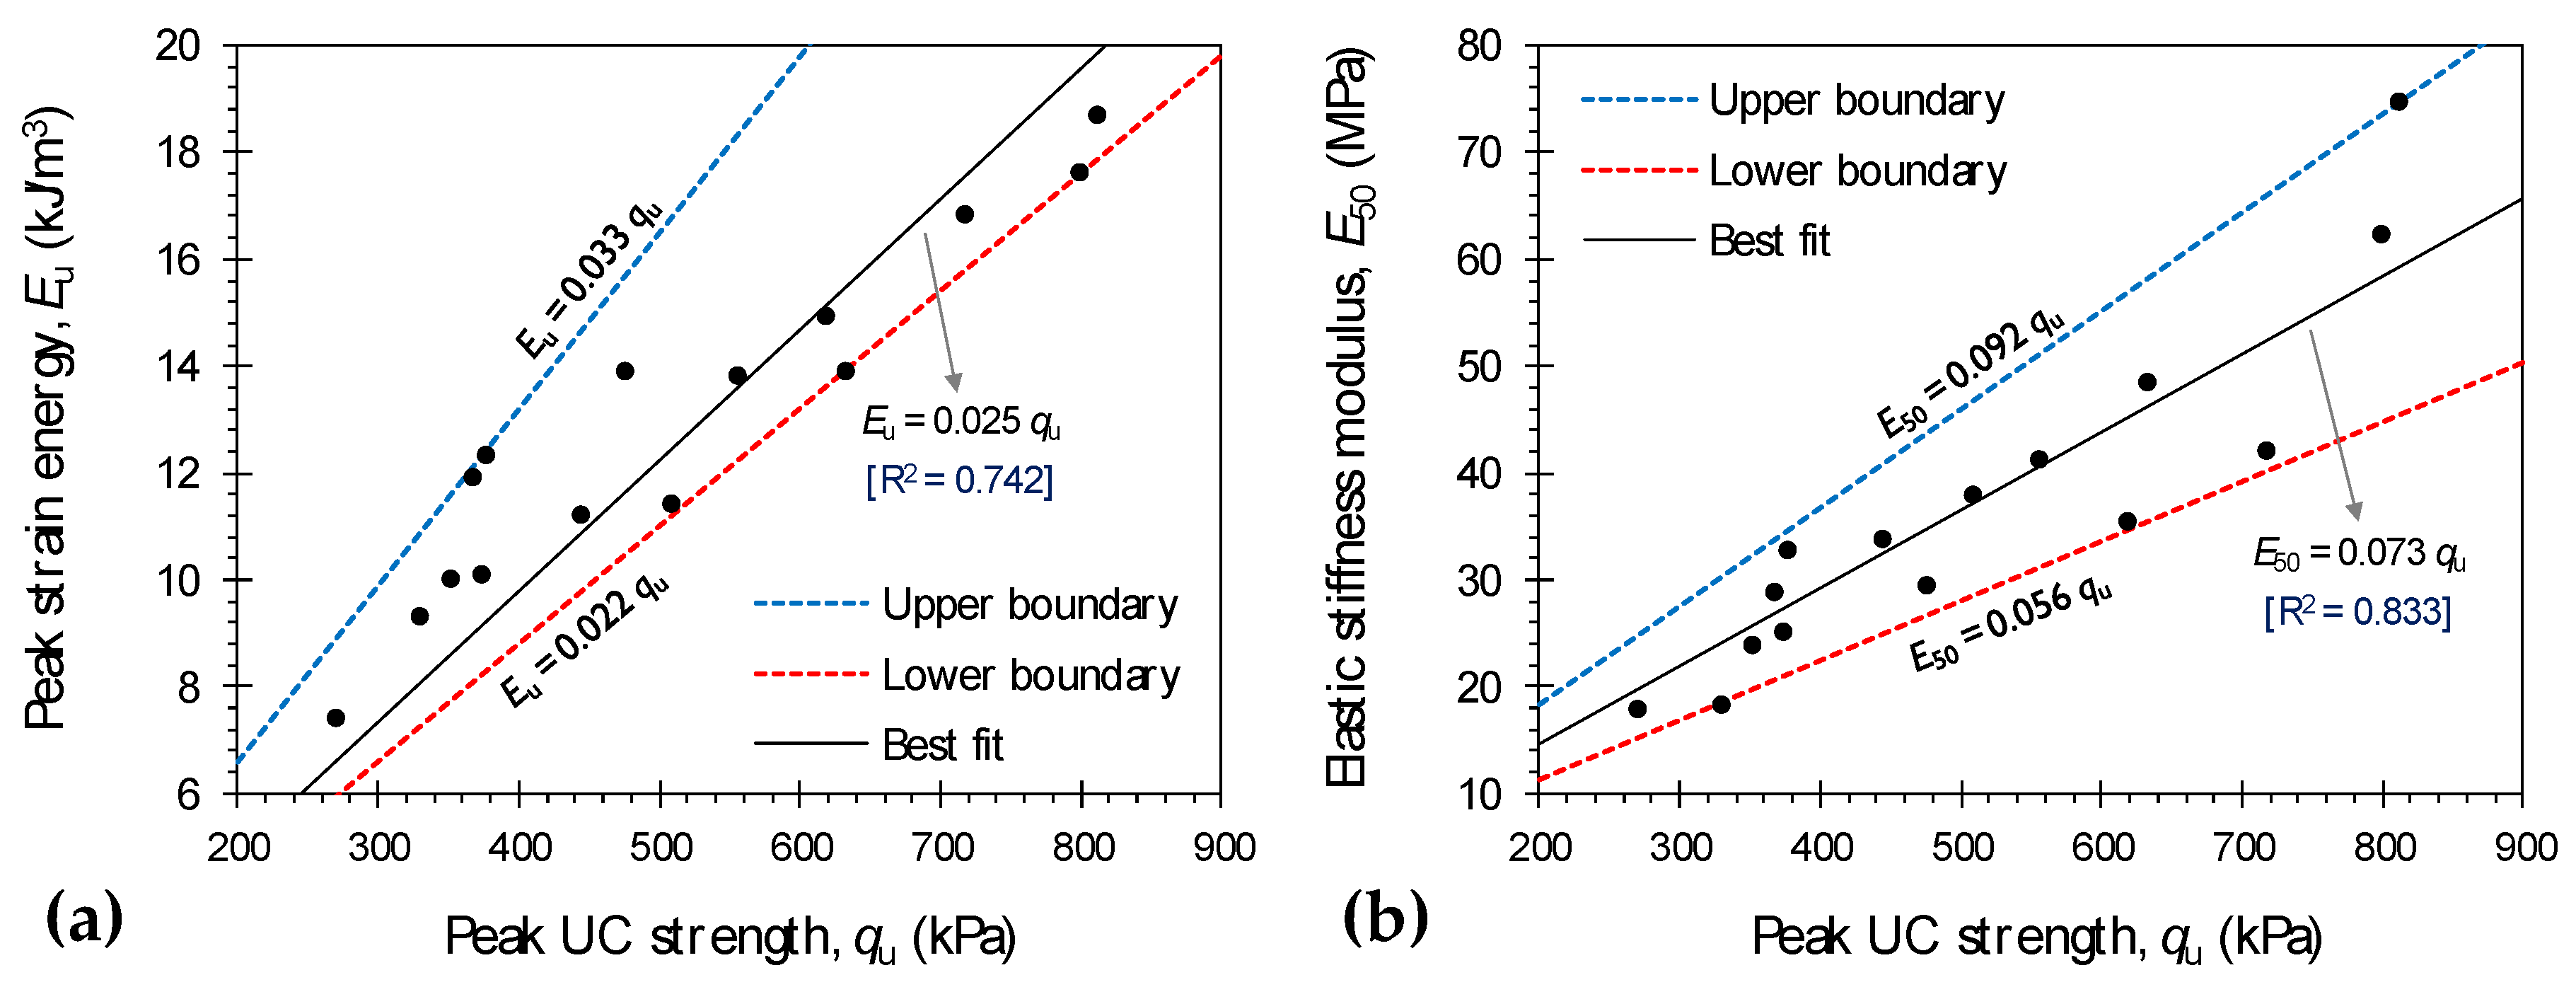
Figure 3a,b illustrate the variations of Eu and E50 against qu for various MC-treated mixtures, respectively. The variations of Eu lies within the 0.022qu < Eu < 0.033qu domain (Eu in kJ/m3, and qu in kPa). For E50, however, a wider domain in the form of 0.056qu < E50 < 0.092qu (E50 in MPa, and qu in kPa) can be observed. Both Eu and E50 exhibited good correlations with qu. In this case, simple correlative models in the forms of Eu = 0.025qu (with R2 = 0.742) and E50 = 0.073qu (with R2 = 0.833) can be obtained, and hence implemented for indirect estimations.
Table 6 presents common strength criteria for cemented paste backfills adopted in mining applications. As is evident from the data outlined in Figure 1a, the peak UC strength for various MC-treated mixtures ranges between 272.1 kPa (for M1.5F0T7) and 812.6 kPa (for M3.0F0T128), and thus satisfies the requirement for eliminating liquefaction in underground disposal applications. However, none of the tested samples meet the prerequisite for roof support applications, i.e., qu > 4000 kPa, and hence alternative mix designs should be sought. The inclusion of Mc = 3% resulted in qu = 719.3 kPa at 28 days of curing, and thus satisfies the minimum 700 kPa threshold suggested for stope stability. With regard to surface disposal applications, all MC-treated mixtures, excluding M1.5F0T7 and M1.5F0T14, well meet the qu > 345 kPa criterion. Moreover, the ASTM D4609–08 standard suggests a minimum increase of 345 kPa in the peak UC strength as a criterion for characterizing an effective stabilization scheme for general/non-mining construction practices [46]. Conservatively, assuming that the non-cemented tailings in high-moisture environments would have a low to negligible peak UC strength, all MC-treated mixtures, excluding M1.5F0T7 and M1.5F0T14, well meet with the aforementioned criterion and hence are deemed to be optimum design choices for general construction practices.
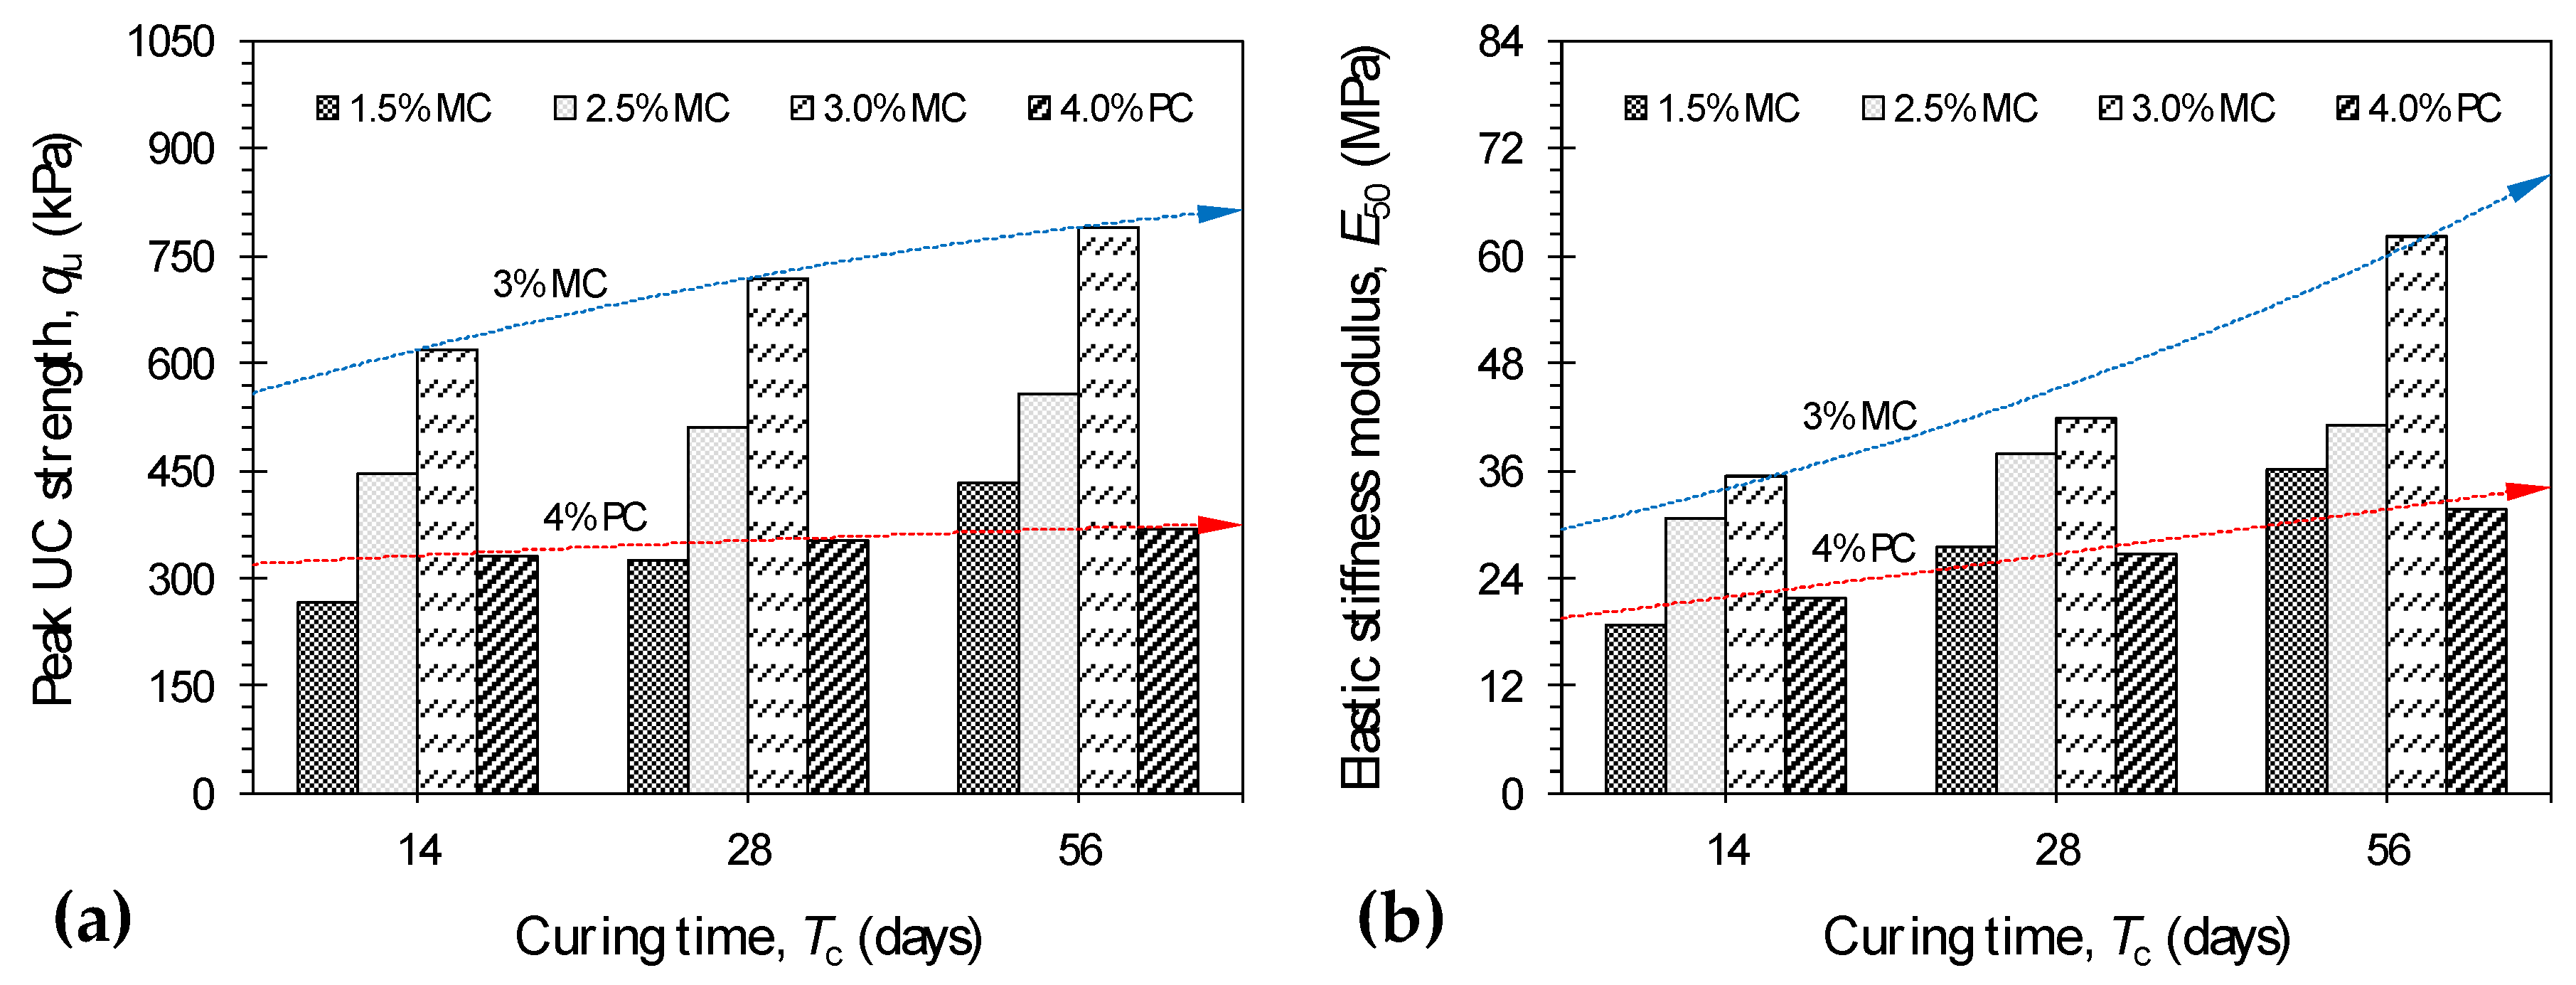
Portland Cement (PC) often serves as a benchmark binder with respect to underground mine backfilling applications. The performance of any newly introduced binder, such as MC, should hence be cross-checked with that of PC to further justify its applicability. In this regard, Figure 4a,b illustrate the variations of peak UC strength and elastic stiffness modulus against curing time for the samples treated with 1.5%, 2.5% and 3% MC alongside 4% PC, respectively. It should be noted that all PC-treated samples were prepared in a similar fashion to that described for various MC-treated blends (see Section 3.1). The performance of 4% PC was found to be on par with that of 1.5% MC, while the higher MC inclusions of 2.5% and 3% unanimously outperformed 4% PC in terms of both strength and stiffness. Interestingly, the effect of curing time, i.e., Tc = 14–56 days, was found to be rather marginal for PC-treated mixtures, while the development of strength and particularly stiffness were evidently monotonic for various MC-treated blends (compare the trendlines 3% MC and 4% PC in Figure 4). As a typical case, 4% PC resulted in qu= 352.8 kPa (E50 = 26.7 MPa) at 28 days of curing, while the inclusion of Mc = 1.5%, 2.5% and 3% (at Tc = 28 days), though lower in terms of binder content, resulted in similar to higher values of qu = 325.2 kPa, 510.6 kPa and 719.3 kPa (E50 = 27.6 MPa, 37.8 MPa and 41.9 MPa), respectively.
4.2. Effect of MC + FA on UC Strength
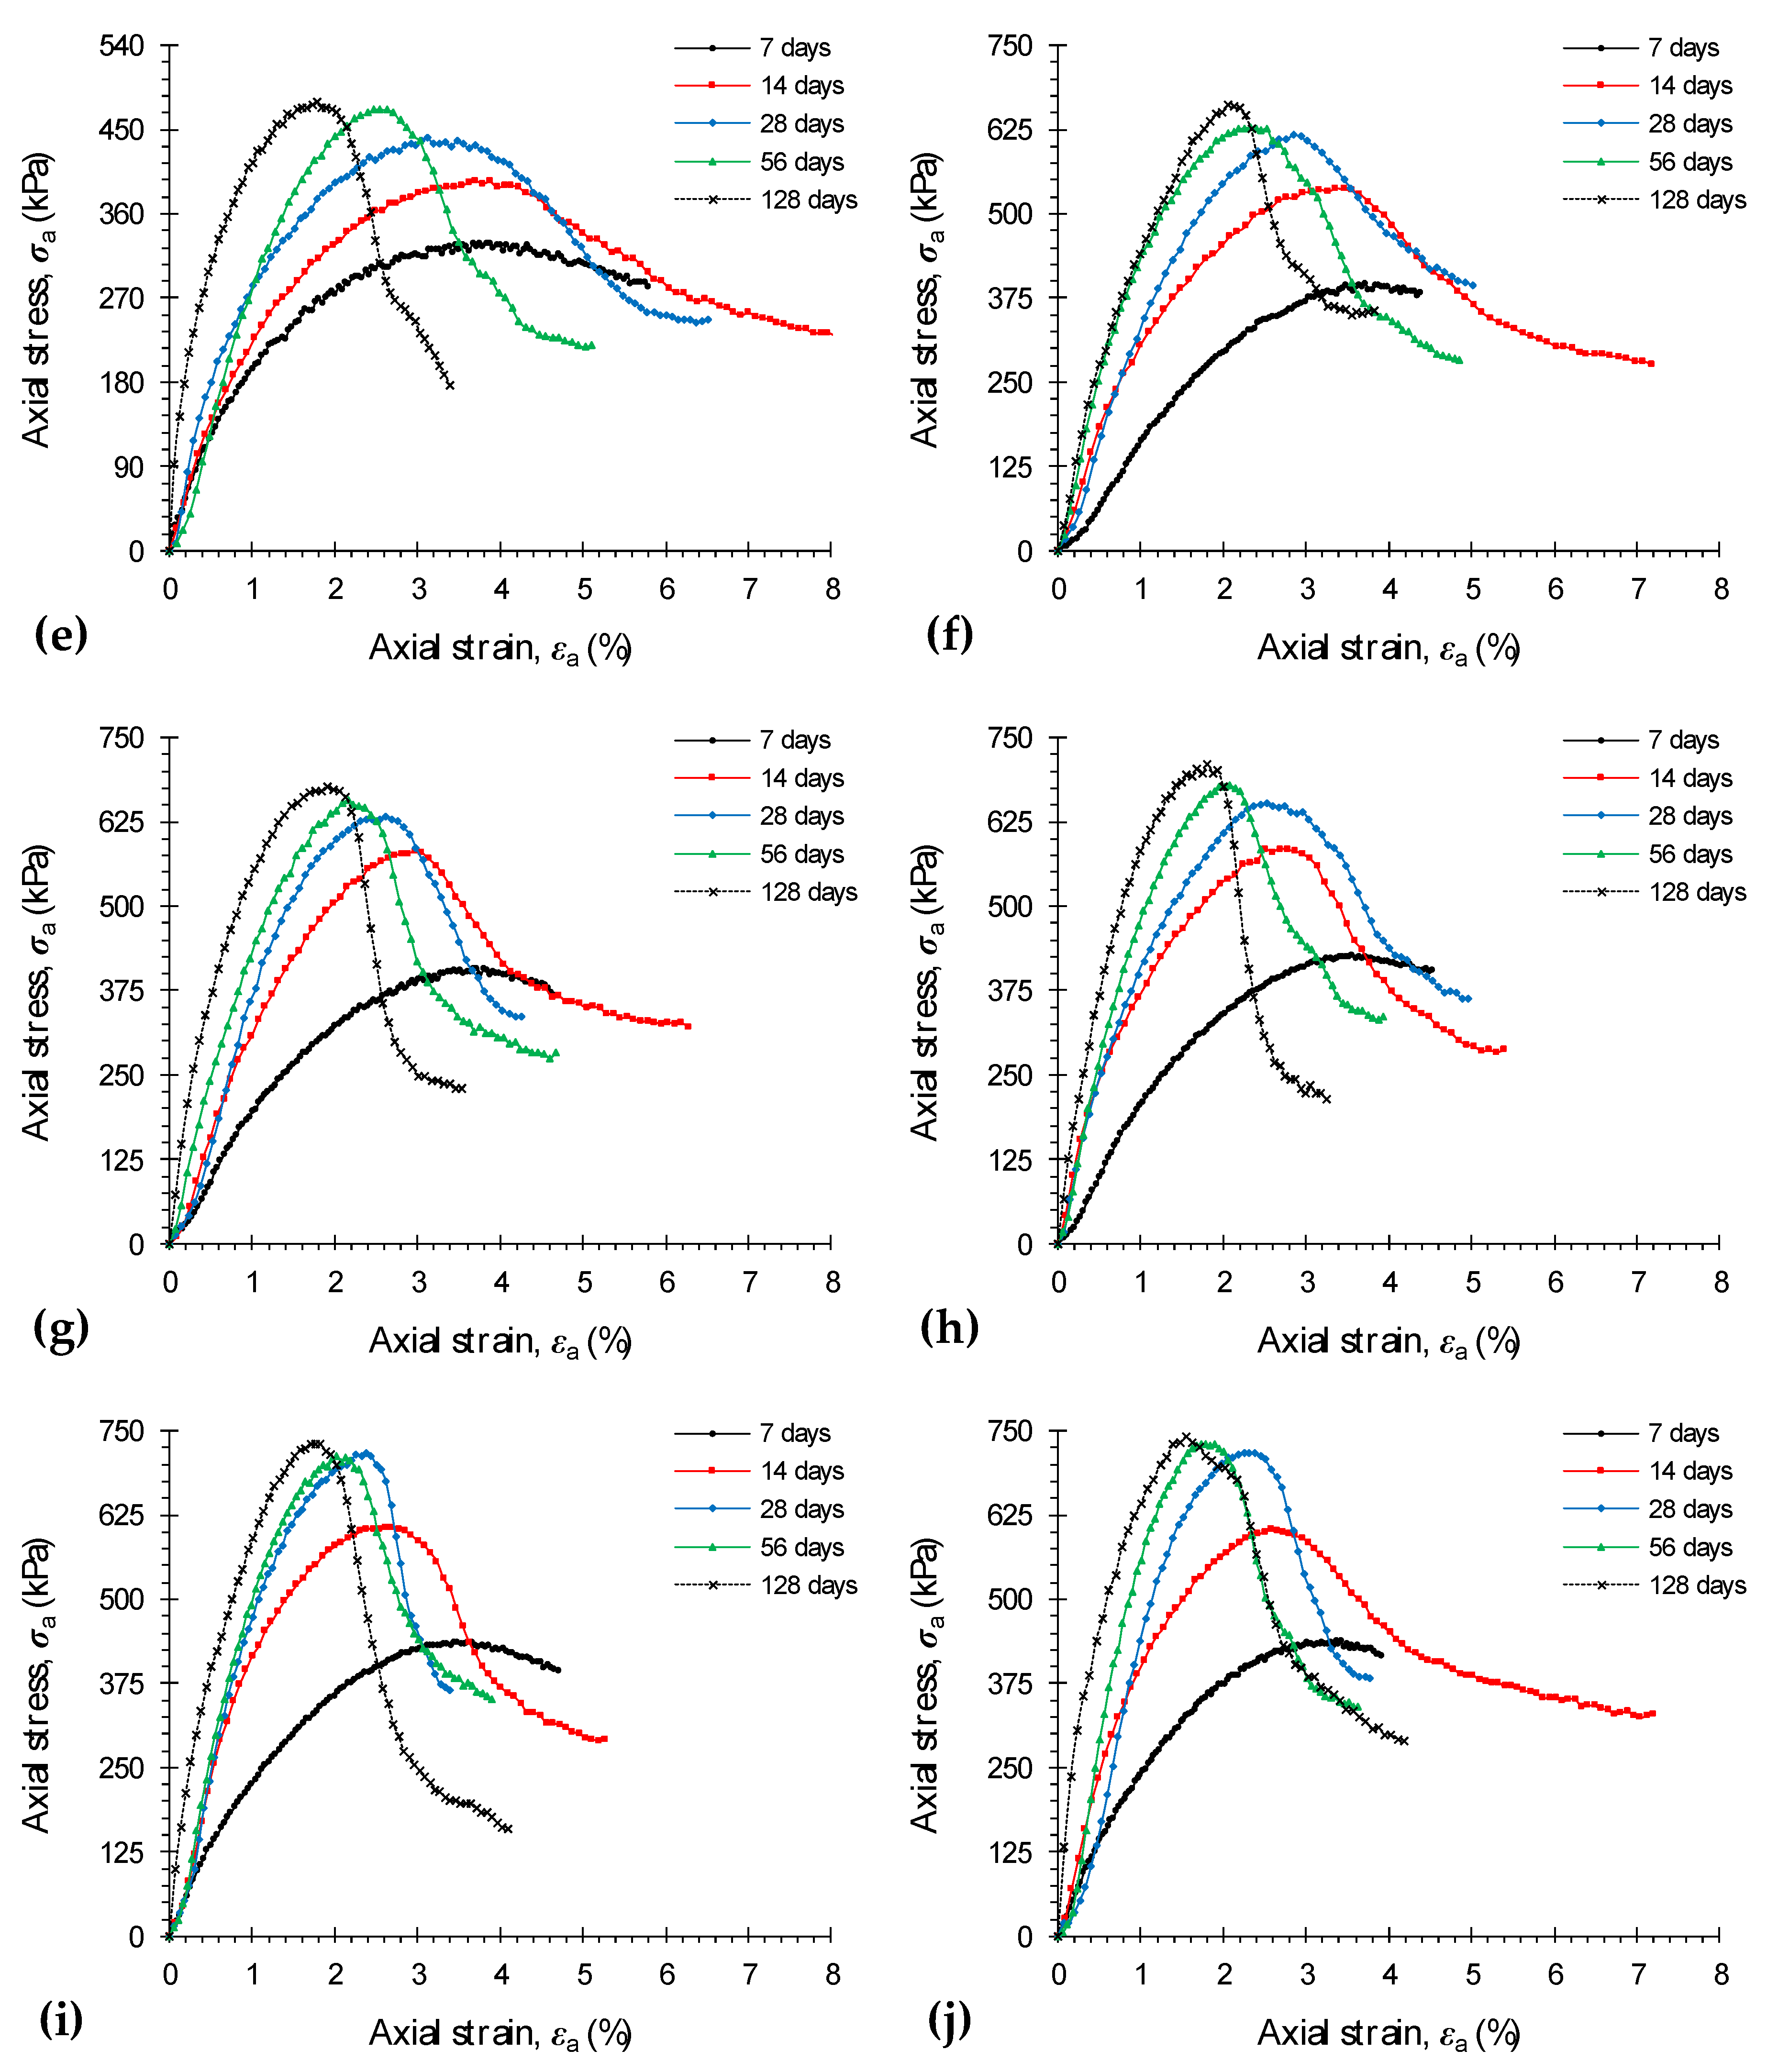
Stress–strain curves, obtained from the UC tests, for various MC + FA-treated mixtures—MxFyTz where x = {1.5, 2.5}, y = {0.5, 1.0, 1.5, 2.0, 2.5} and z = {7, 14, 28, 56, 128}—are provided in Figure A2 in the Appendix section. Similar to the mixtures treated with MC alone (see Figure A1), the stress–strain response for all MC + FA-treated mixtures exhibited a strain-softening behavior with visually detectable peak points, thus indicating brittle sample failures. In general, for any given MC content, the greater the FA content and/or the longer the curing period, the more pronounced the strain-softening effect, with Mc = 2.5% displaying a more pronounced strain-softening character (and hence more dramatic sample failures) compared with similar cases treated with Mc = 1.5%.
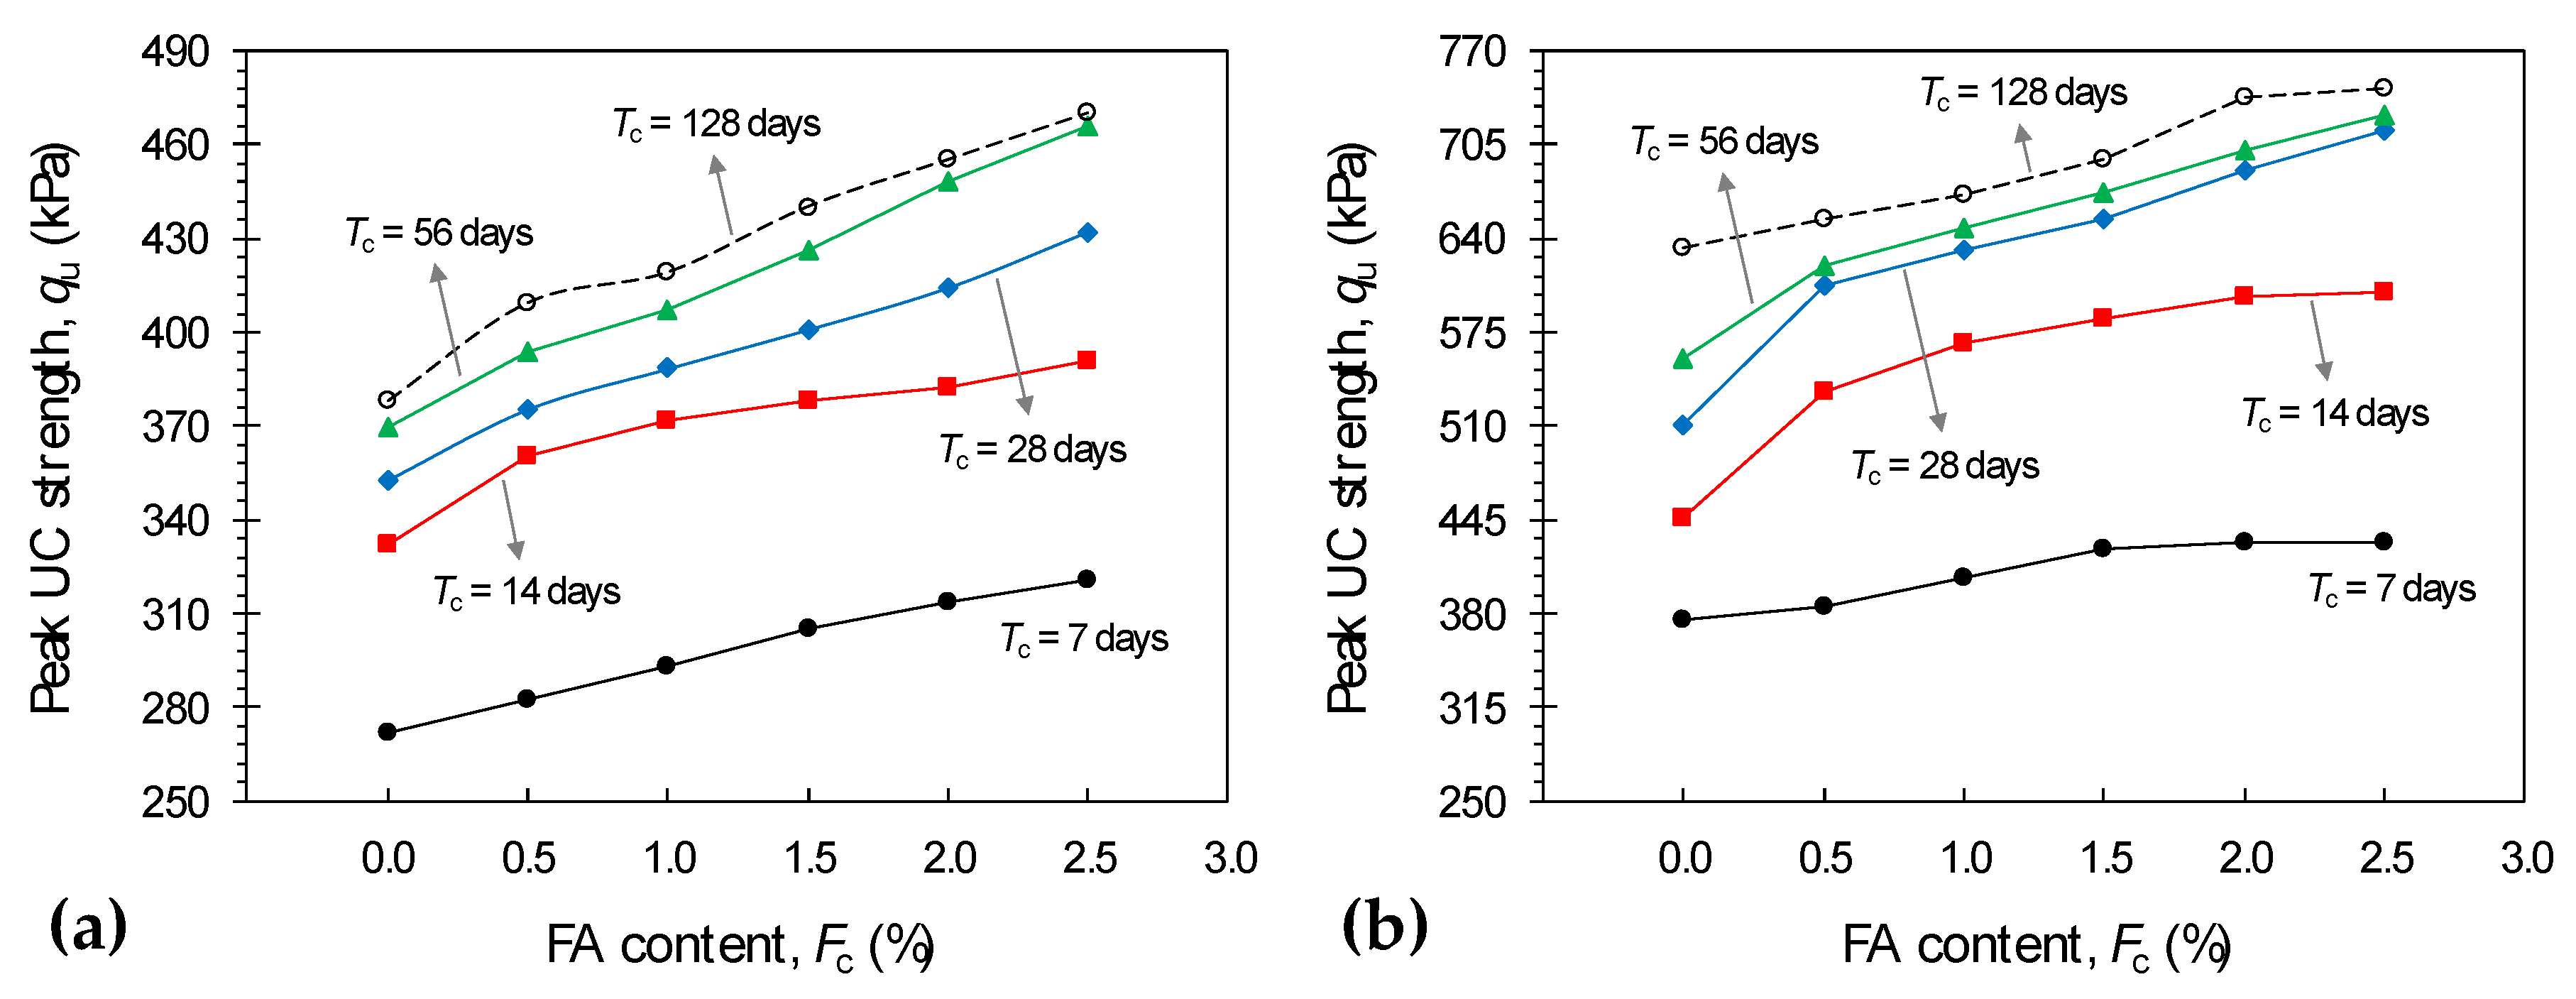
Figure 5a,b illustrate the variations of peak UC strength against FA content for the samples treated with Mc = 1.5% and 2.5% and tested at various curing times, respectively. At any given curing time, the greater the FA content the higher the peak UC strength, following a monotonically increasing trend, with all Mc = 2.5% blends holding a notable advantage over their Mc = 1.5% counterparts. The samples M1.5F0T7 and M2.5F0T7, for instance, exhibited peak UC strengths of qu = 272.1 kPa and 375.5 kPa, respectively. For Mc = 1.5% and the same 7-day curing condition, the inclusion of 0.5%, 1%, 1.5%, 2% and 2.5% FA resulted in qu = 282.8 kPa, 292.8 kPa, 305.4 kPa, 313.9 kPa and 320.7 kPa, respectively. Similar mix designs treated with Mc = 2.5%, however, promoted a higher peak UC strength, as the aforementioned values increased to 384.4 kPa, 404.8 kPa, 425.1 kPa, 429.3 kPa and 429.6 kPa, respectively. Moreover, for any given MC+FA content, an increase in curing time promoted a significant increase in the peak UC strength up to Tc = 56 days, beyond of which marginal improvements were noted. The inclusions of Mc = 2.5% and Fc = 1.5% at Tc = 7 days, for instance, resulted in qu = 425.1 kPa, while higher values of 584.3 kPa, 653.6 kPa, 671.7 kPa and 695.1 kPa were obtained for the same MC + FA inclusion at 14, 28, 56 and 128 days of curing, respectively.
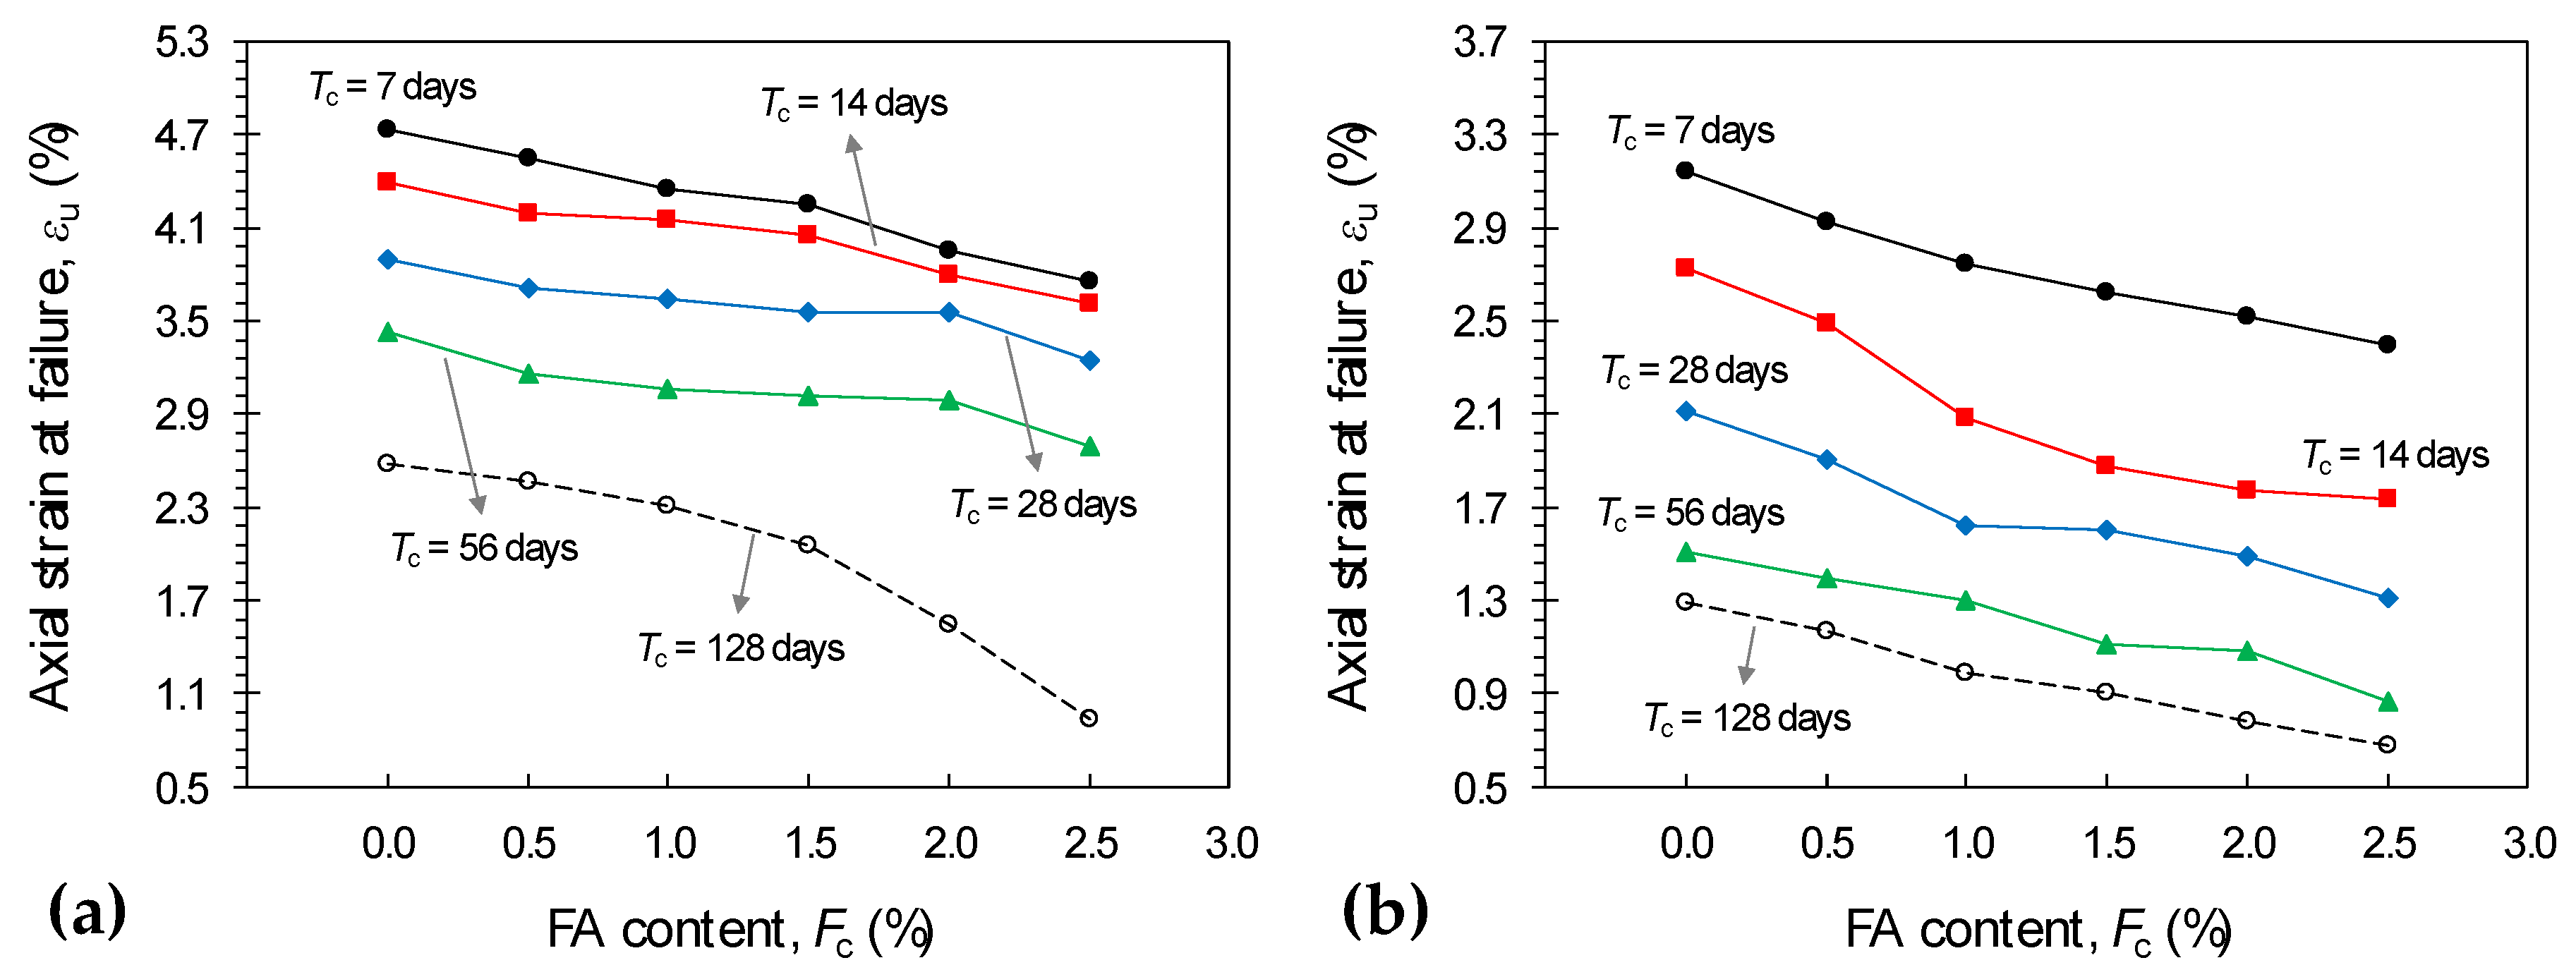
Figure 6a,b illustrate the variations of axial strain at failure against FA content for the samples treated with Mc = 1.5% and 2.5% and tested at various curing times, respectively. The axial strain at failure, an indication of the material’s ductility, exhibited a trend similar to that observed for the peak UC strength; however, in an adverse manner. In general, the greater the FA content and/or the longer the curing period, the lower the sample’s ductility, with all Mc = 1.5% blends holding a notable advantage over similar cases treated with Mc = 2.5%. The samples M1.5F0T7 and M2.5F0T7 displayed failure axial strains of εu = 4.74% and 3.14%, respectively. As typical cases, these values, respectively, dropped to 4.25% and 2.62% for M1.5F1.5T7 and M2.5F1.5T7, and 2.05% and 0.91% for M1.5F1.5T128 and M2.5F1.5T128.
The peak strain energy, a measure of the material’s toughness, was also calculated for various MC + FA-treated mixtures, and the results are provided in Figure 7. Similar to the peak UC strength, the improvement in toughness was in favor of both the FA content and the curing time, with all Mc = 2.5% blends (see Figure 7b) holding a notable advantage over similar cases treated with Mc = 1.5% (see Figure 7a). As discussed in Section 4.1, the improvement in toughness with respect to an increase in binder content and/or curing time can be attributed to an increase in the peak UC strength and/or the axial strain at failure. The rise in peak strain energy, which, as demonstrated in Figure 7 was in favor of a greater MC + FA content and/or a longer curing period, indicates that the improvement in qu dominates the exhibited reduction in εu for all MC + FA mix designs. The samples M1.5F0T7 and M2.5F0T7 resulted in peak strain energies of Eu = 7.4 kJ/m3 and 10.1 kJ/m3, respectively. As typical cases, these values, respectively, increased to 8.9 kJ/m3 and 12.2 kJ/m3 for M1.5F1.5T7 and M2.5F1.5T7, and 15.6 kJ/m3 and 16.8 kJ/m3 for M1.5F1.5T128 and M2.5F1.5T128.
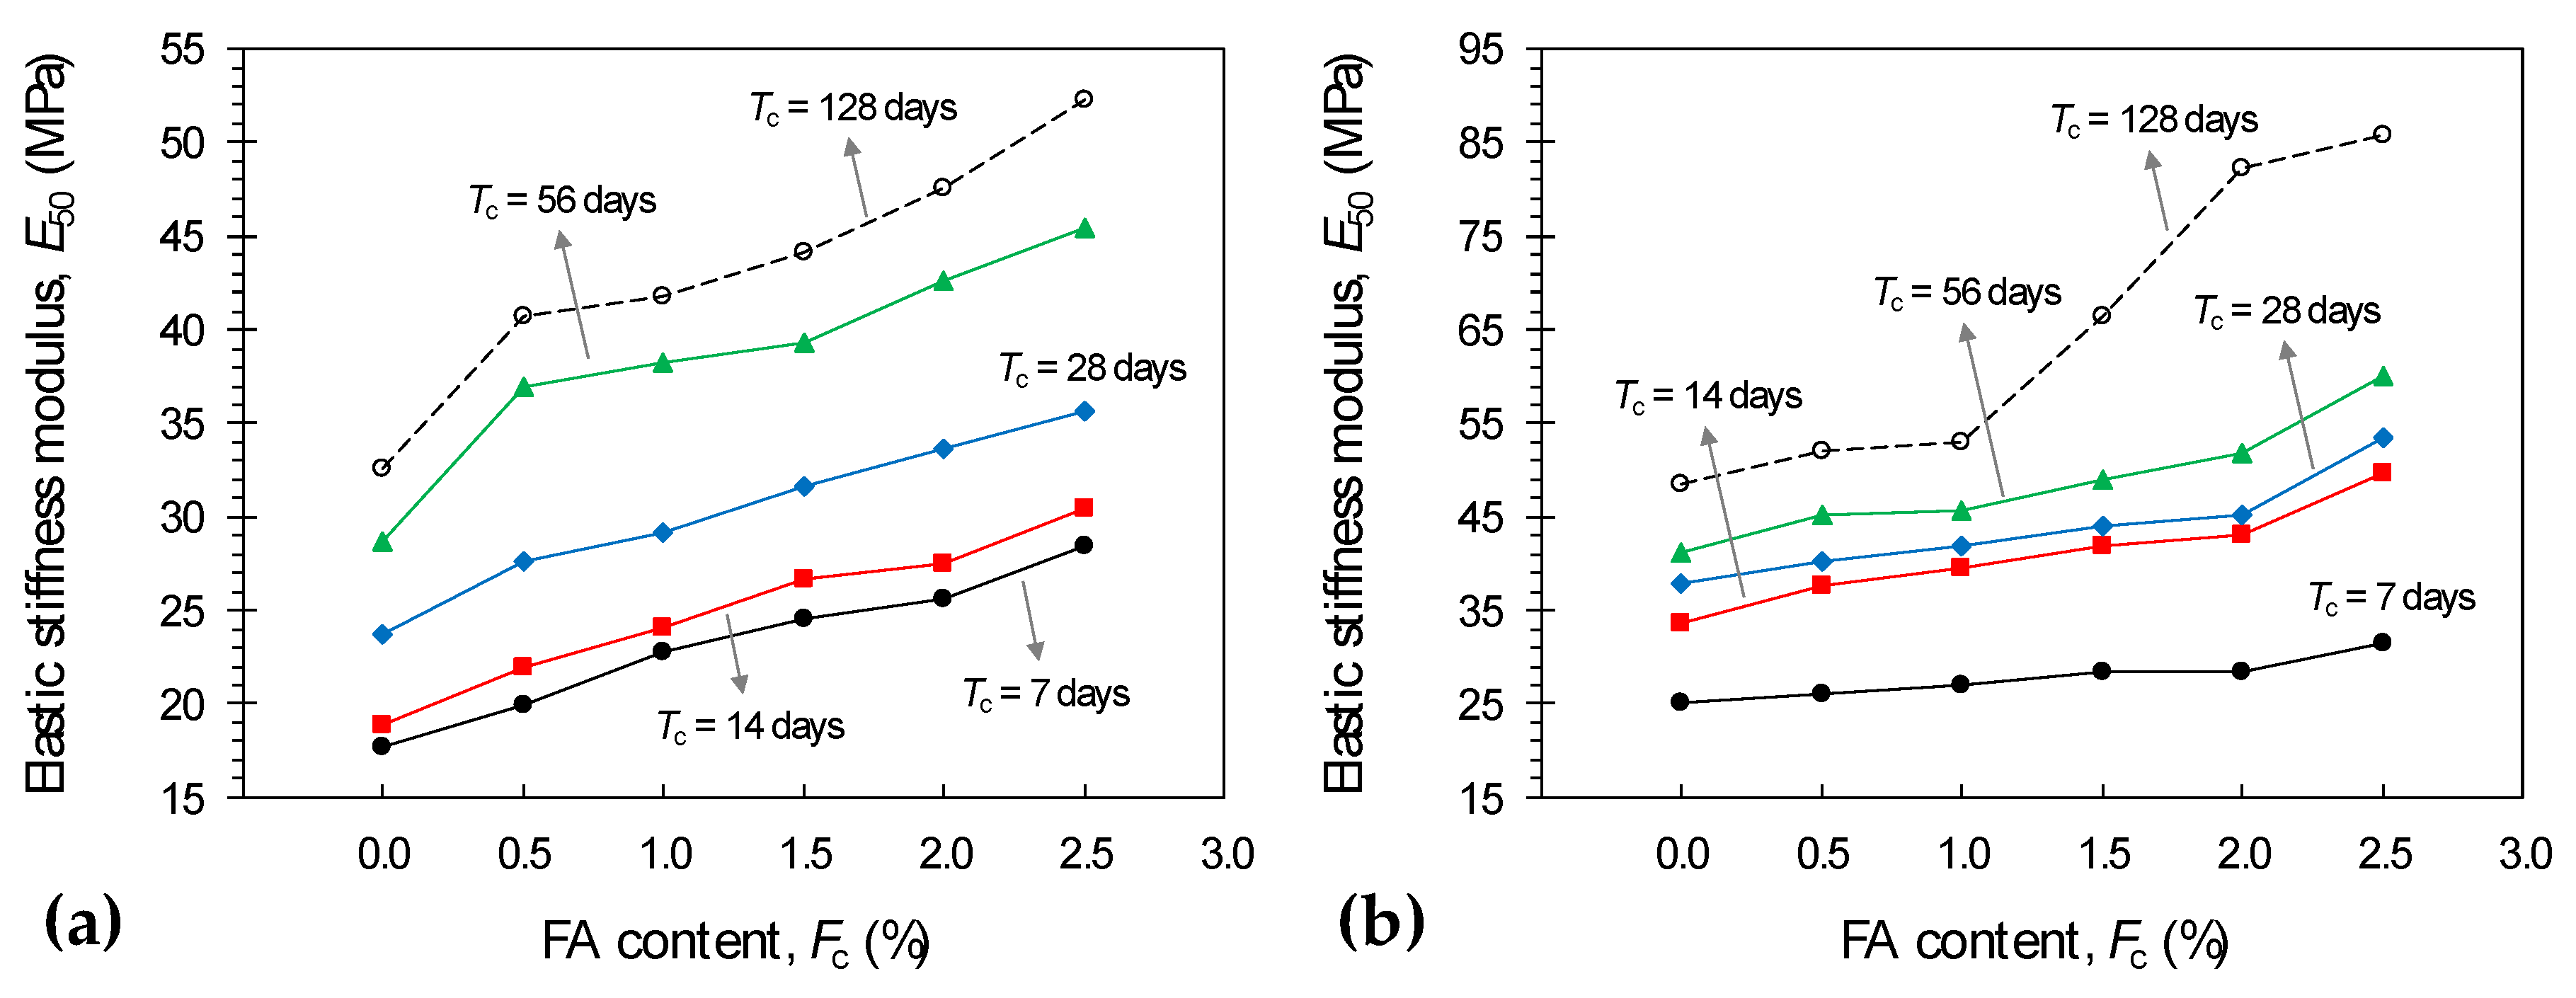
Figure 8a,b illustrate the variations of elastic stiffness modulus E50 against FA content for the samples treated with Mc = 1.5% and 2.5% and tested at various curing times, respectively. In general, the elastic stiffness modulus demonstrated a trend similar to that observed for the peak UC strength and the peak strain energy. The greater the FA content and/or the longer the curing period, the higher the developed stiffness, with all Mc = 2.5% blends outperforming similar cases treated with Mc = 1.5%. The samples M1.5F0T7 and M2.5F0T7 resulted in E50 = 17.7 MPa and 25.1 MPa, respectively. As typical cases, these values, respectively, increased to 24.5 MPa and 28.4 MPa for M1.5F1.5T7 and M2.5F1.5T7, and 44.1 MPa and 66.4 MPa for M1.5F1.5T128 and M2.5F1.5T128.
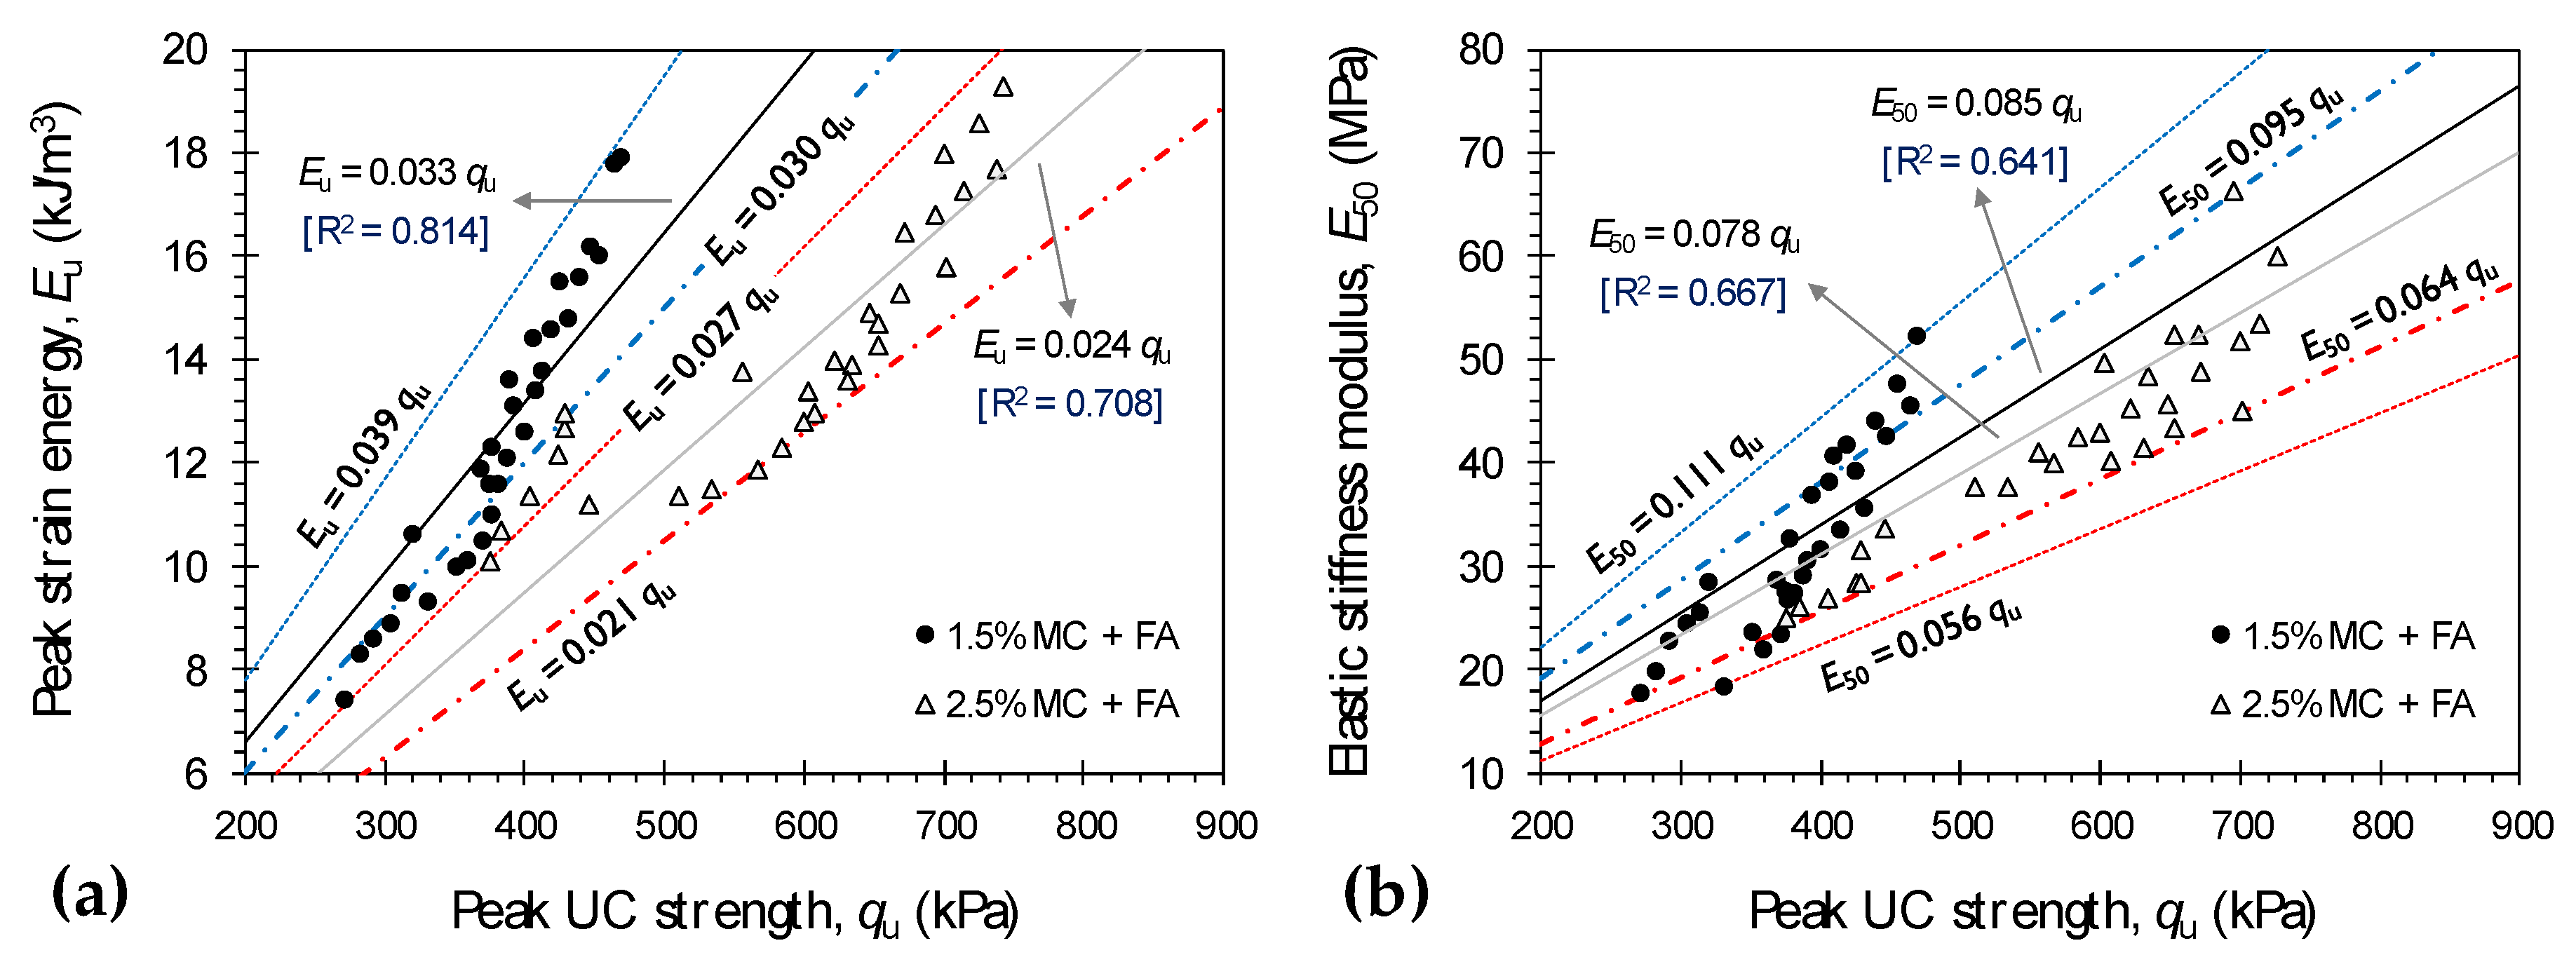
Figure 9a,b illustrate the variations of Eu and E50 against qu for various MC + FA-treated mixtures, respectively. The variations of Eu lies within the 0.027qu < Eu < 0.039qu and 0.021qu < Eu < 0.030qu domains (Eu in kJ/m3, and qu in kPa) for the samples treated with Mc = 1.5% and 2.5%, respectively. For E50, however, wider domains in the forms of 0.056qu < E50 < 0.111qu and 0.064qu < E50 < 0.095qu (E50 in MPa, and qu in kPa) can be observed, respectively. For any given MC content, the variations of Eu and E50 both exhibited good correlations with qu. In this case, simple correlative models in the forms of Eu = 0.033qu (with R2 = 0.814) and E50 = 0.085qu (with R2 = 0.641) can be obtained for Mc = 1.5%. For the samples treated with Mc = 2.5%, the correlations changed to Eu = 0.024qu (with R2 = 0.708) and E50 = 0.078qu (with R2 = 0.667), which strongly indicate a lower rate of increase in both Eu and E50 with respect to an increase in qu.
As is evident from the data outlined in Figure 5, the peak UC strength for various MC + FA-treated mixtures—MxFyTz where x = {1.5, 2.5}, y = {0.5, 1.0, 1.5, 2.0, 2.5} and z = {7, 14, 28, 56, 128}—ranges between 282.8 kPa (for M1.5F0.5T7) and 743.4 kPa (for M2.5F2.5T128), and thus unanimously satisfies the requirement for eliminating liquefaction, i.e., 150 < qu (kPa) < 300. Similar to the samples treated with MC alone, none of the tested MC + FA mix designs meet the prerequisite for roof support applications, i.e., qu > 4000 kPa. With regard to stope stability, the samples M2.5F2.0T28 (qu = 701.6 kPa) and M2.5F2.5T28 (qu = 714.4 kPa) well comply with the minimum 700 kPa (at Tc = 28 days) requirement, and thus are deemed to be sustainable alternatives for M3.0F0T28 (qu = 719.3 kPa). As for surface disposal applications and general construction practices (ASTM D4609–08), all MC + FA-treated mixtures, excluding M1.5FyT7 where y = {0.5, 1.0, 1.5, 2.0, 2.5}, well satisfy the qu > 345 kPa criterion.
4.3. Amending Mechanisms and Fabric Evolution
In the presence of water, calcium-rich binders such as MC act as a precursor agent, initiating a series of short/immediate- and long-term chemical reactions in the tailings–binder medium, thereby amending the tailings fabric into a unitary mass of enhanced mechanical performance. Short-term chemical reactions include cation exchange and flocculation–agglomeration, the amending roles of which are often limited with respect to neutrally charged particles such as sands, silts and tailings. For fine-grained soils containing notable fractions of negatively charged clay particles; however, short-term reactions lead to notable improvements in soil plasticity, workability, early age strength and swell–consolidation capacity [39,51,52,53]. Long-term chemical reactions consist of pozzolanic reactions, which are strongly time- and often temperature-dependent; their commencement and evolution require a specific and often long period of curing. During pozzolanic reactions, calcium cations (Ca2+) and hydroxide anions (OH−), both released from the cementitious binder, or in this case MC, gradually react with silicate (SiO2) and aluminate (Al2O3) units from the tailings, thereby resulting in the formation of cementation products/gels, i.e., Calcium–Silicate–Hydrates (C–S–H), Calcium–Aluminate–Hydrates (C–A–H) and Calcium–Aluminate–Silicate–Hydrates (C–A–S–H), which encourage solidification and flocculation of the tailings particles and hence the development of a uniform, dense matrix coupled with enhanced strength performance [39,53,54]. Quite clearly, the commencement and evolution of pozzolanic reactions are strongly dependent on the amount of available silicate and aluminate units (or pozzolan materials) in the matrix. In general, the greater the number of available silicate and aluminate units, the greater the number of developed cementation products and hence the higher the developed peak UC strength.
As demonstrated in Figure 4, the performance of 4% PC was found to be on par with that of 1.5% MC, while the higher MC inclusions of 2.5% and 3% unanimously outperformed 4% PC in terms of both strength and stiffness. Such observations can be attributed to the more dominant self–hardening features exhibited by MC compared with that of PC. Calcium hydroxide or Ca(OH)2 is a by-product of PC hydration during the pozzolanic reactions stage; however, it does not contribute to further strength development, owing to the lack of any remaining silicate and aluminate units in the medium which are normally exhausted during PC hydration. When slag-blended cement or MC is used as the main cementitious binder, the additional silicate and aluminate units in slag particles gradually react with Ca(OH)2 and water, thereby resulting in the formation of additional cementation products as part of secondary pozzolanic reactions which further densify the matrix and hence enhance the peak UC strength.
Common fly ash additives, or in this case FA, often contain a low content of calcium oxide (CaO), and as such, possess limited self-hardening features; such additives require activation by a calcium-rich binder, e.g., PC or MC, to encourage pozzolanic reactions [54]. Unlike tailings, which are rather poor in terms of aluminate (see Table 2), FA is dominated by large fractions of silicate and, particularly, aluminate. As such, the addition of FA, alongside MC as its activator, induces the development of pozzolanic reactions (or cementation products) in the matrix, which in turn leads to an improved peak UC strength compared with similar MC inclusions containing no FA.
Figure 10a–c illustrates SEM micrographs for the samples M0F0T7 (pure tailings), M2.5F0T7 and M2.5F0T28, respectively. The micro-fabric of the pure tailings sample displayed a partly loose matrix, along with a notable number of large inter- and intra-assemblage pore-spaces, respectively, formed between and within the tailings aggregates, thereby corroborating the existence of an edge-to-edge dispersed structure (see Figure 10a). For the sample M2.5F0T7, as shown in Figure 10b, the micro-fabric became more uniform in nature, indicating aggregation of the tailings particles and hence the development of a dense matrix with an edge-to-face flocculated structure. Prevalent cementation products, i.e., C–S–H, C–A–H and C–A–S–H, were clearly visible between and within the tailings aggregates, which portrayed a major role in reducing the number of inter- and intra-assemblage pore-spaces in the matrix. The same 2.5% MC inclusion at 28 days of curing (or sample M2.5F0T28) exhibited a micro-fabric similar to that observed for M2.5F0T7 (compare Figure 10b,c). In this case, however, a more pronounced cementation bonding was evident, which in turn promoted a slightly denser matrix with fewer pore-spaces followed by a higher developed strength and stiffness, i.e., the peak UC strength increased from 375.5 kPa for M2.5F0T7 to 510.6 kPa for M2.5F0T28. SEM micrographs for the samples M2.5F1.5T7 and M2.5F1.5T28 are provided in Figure 10d,e, respectively. In general, the samples M2.5F1.5T7 and M2.5F1.5T28 displayed micro-fabric features similar to that observed for their Fc = 0 counterparts, i.e., M2.5F0T7 and M2.5F0T28. However, as a result of FA inclusion, the bonding/connection interface generated between the tailings aggregates was markedly improved. Moreover, the inter- and intra-assemblage pore-spaces displayed a notable decrease in both number and size, which all in all justify the increase in strength and stiffness compared with similar cases containing no FA, e.g., the peak UC strength increased from 510.6 kPa for M2.5F0T28 to 653.6 kPa for M2.5F1.5T28.
5. Conclusions
The following conclusions can be drawn from this study:
- The greater the MC content and/or the longer the curing period, the higher the developed strength, toughness and stiffness, with the former, the MC content, portraying a more significant role. The exhibited improvements; however, were only notable up to 56 days of curing, beyond of which the effect of curing was found to be marginal. The axial strain at failure, an indication of the material’s ductility, demonstrated a trend similar to that observed for the strength, toughness and stiffness; however, in an adverse manner.
- The performance of 4% PC was found to be similar to that of 1.5% MC, while the higher MC inclusions of 2.5% and 3%, though lower in terms of binder content, consistently outperformed 4% PC in terms of both strength and stiffness. As such, the newly introduced binder, MC, can be regarded as a sustainable alternative for conventional PC.
- The use of FA alongside MC improved the bonding/connection interface generated between the tailings aggregates, and thus led to improved mechanical performance compared with similar MC inclusions containing no FA. For any given MC content, the greater the FA content and/or the longer the curing period, the higher the developed strength, toughness and stiffness up to 56 days of curing, beyond of which the effect of curing was found to be marginal. Similarly, for any given FA content, an increase in MC content promoted higher mechanical properties. However, in all cases, the material’s ductility was adversely affected by the MC + FA content and/or curing time.
- Common strength criteria for cemented paste backfills were considered to assess the applicability of the newly introduced MC and MC + FA mix designs. With regard to stope stability, for instance, the mix designs M3.0F0T28, M2.5F2.0T28 and M2.5F2.5T28 satisfied the minimum 700 kPa threshold, and thus were deemed as optimum design choices.
Author Contributions
Conceptualization, Y.Z., A.T. and A.D.; Methodology, Y.Z., A.S. and A.T.; Validation, Y.Z. and A.S.; Formal analysis, Y.Z. and A.S.; Investigation, Y.Z.; Writing—original draft preparation, Y.Z. and A.S.; Writing—review and editing, A.T., M.K. and A.D.; Visualization, A.S.; Supervision, A.T., M.K. and A.D.; Funding acquisition, A.T. and M.K.
Funding
This research was partially funded by Mining Education Australia (MEA) and OZ Minerals, Australia; their support is gratefully acknowledged.
Conflicts of Interest
The authors declare no conflict of interest.
Appendix A
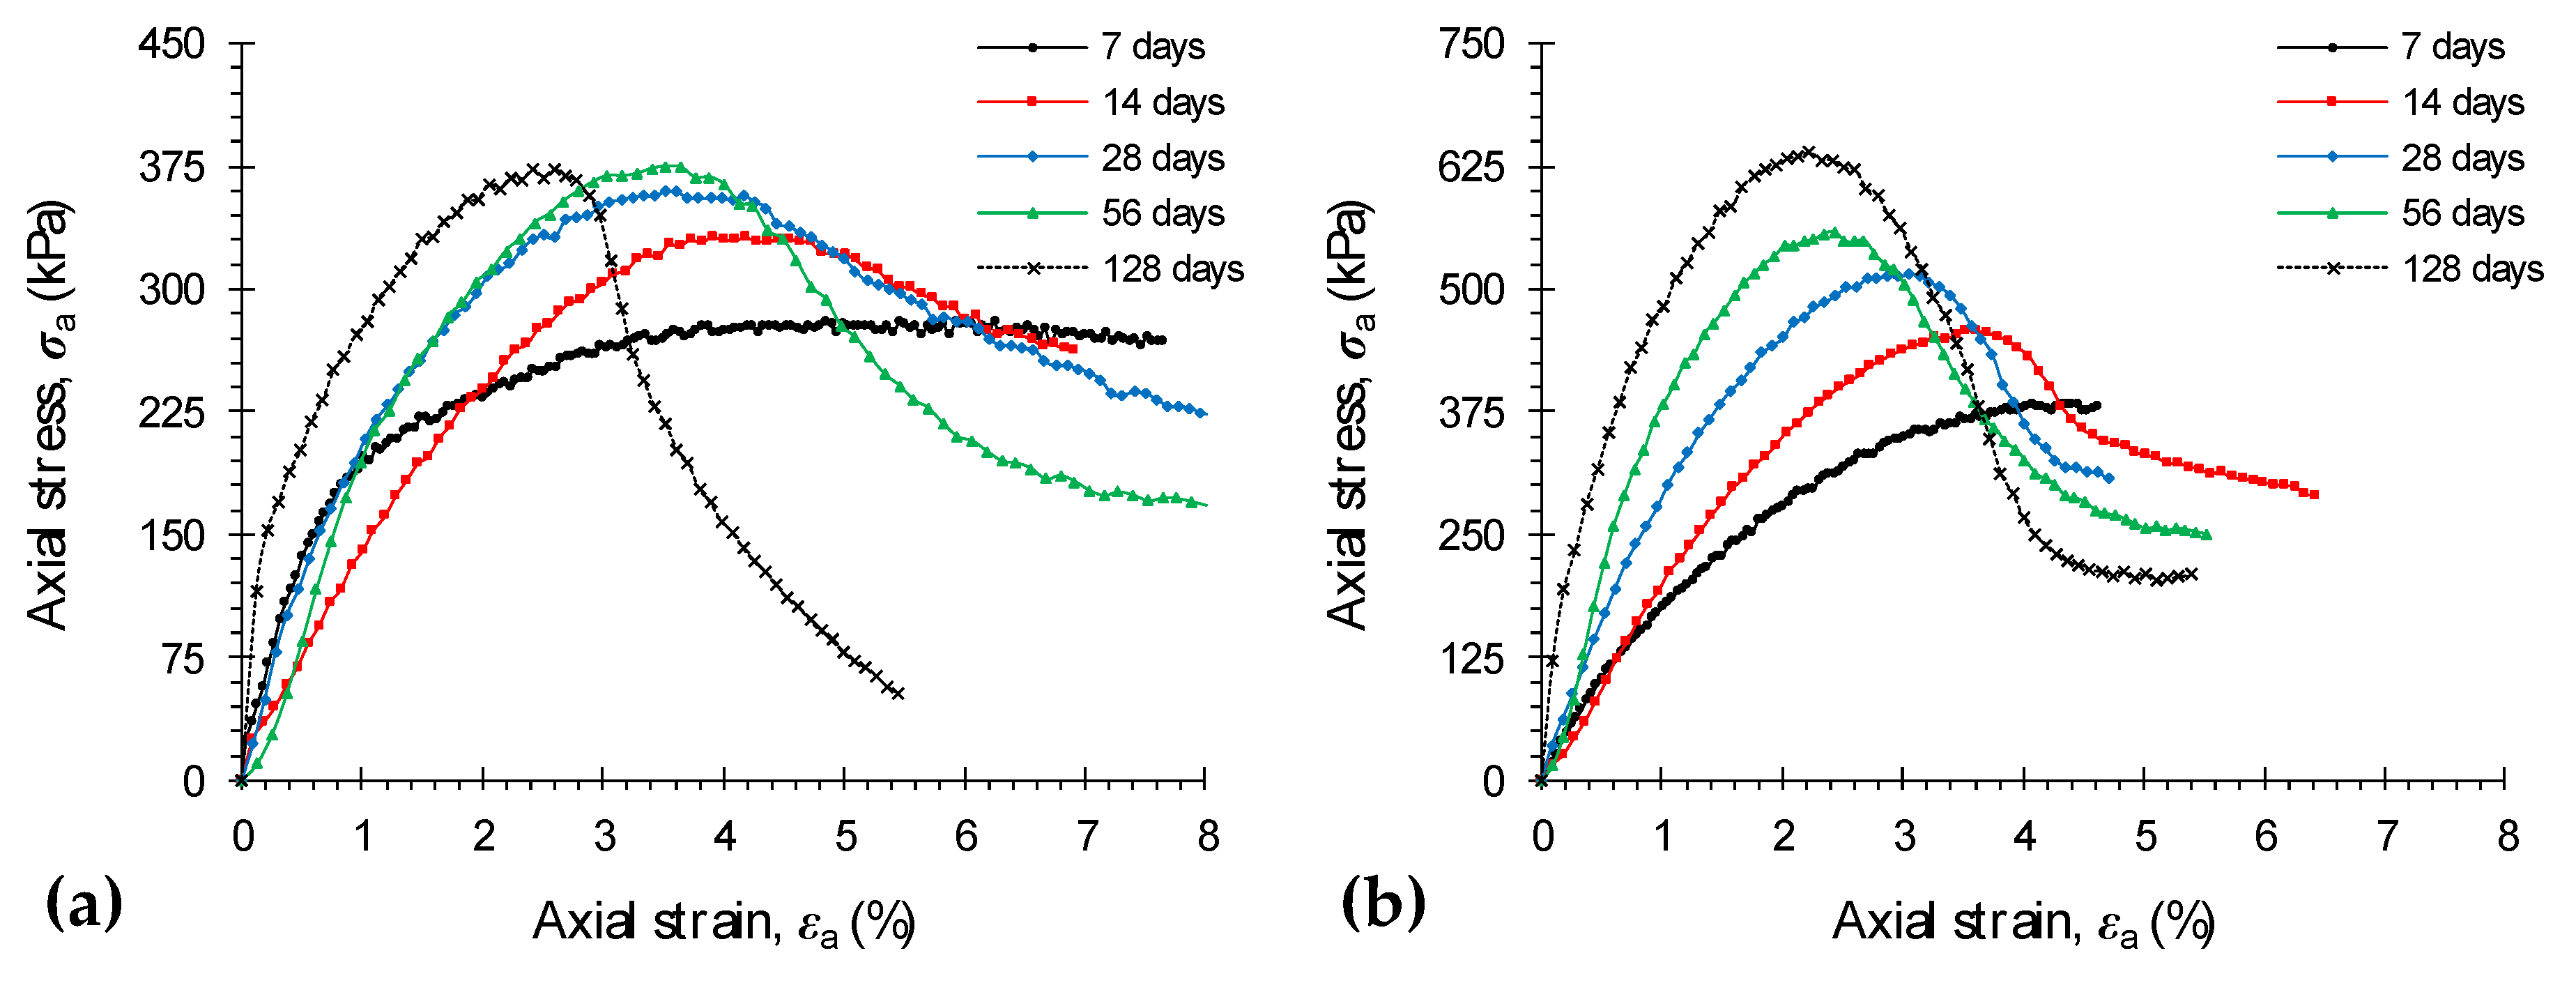
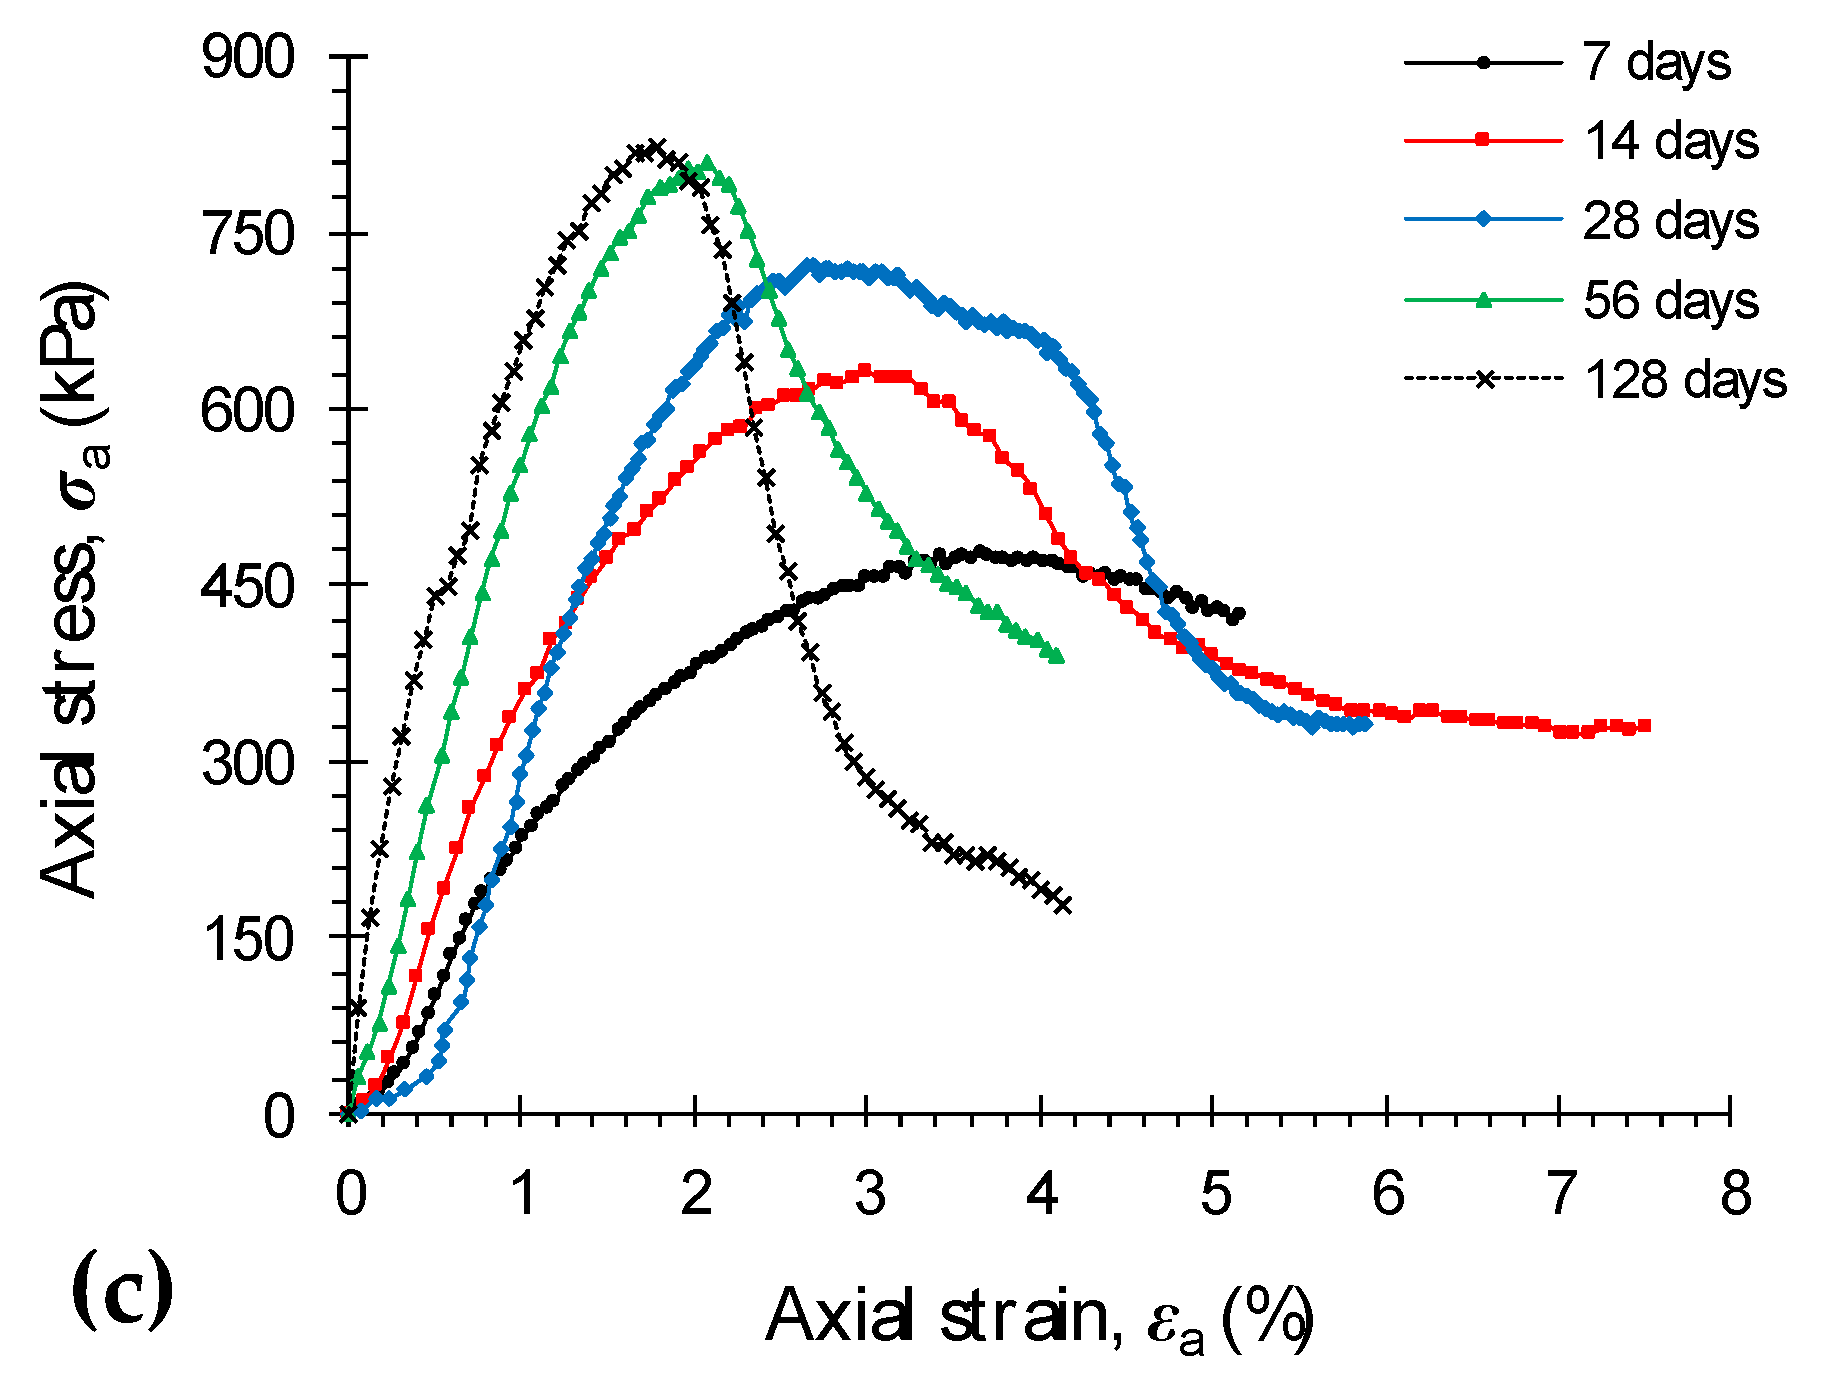
Stress–strain curves, obtained from the UC tests, for various MC-treated mixtures—MxFyTz where x = {1.5, 2.5, 3.0}, y = {0} and z = {7, 14, 28, 56, 128}—are provided in Figure A1.
Figure A1.
UC stress–strain curves for various MC-treated mixtures: (a) M1.5F0Tz; (b) M2.5F0Tz; (c) M3.0F0Tz (z = {7, 14, 28, 56, 128}).
Figure A1.
UC stress–strain curves for various MC-treated mixtures: (a) M1.5F0Tz; (b) M2.5F0Tz; (c) M3.0F0Tz (z = {7, 14, 28, 56, 128}).


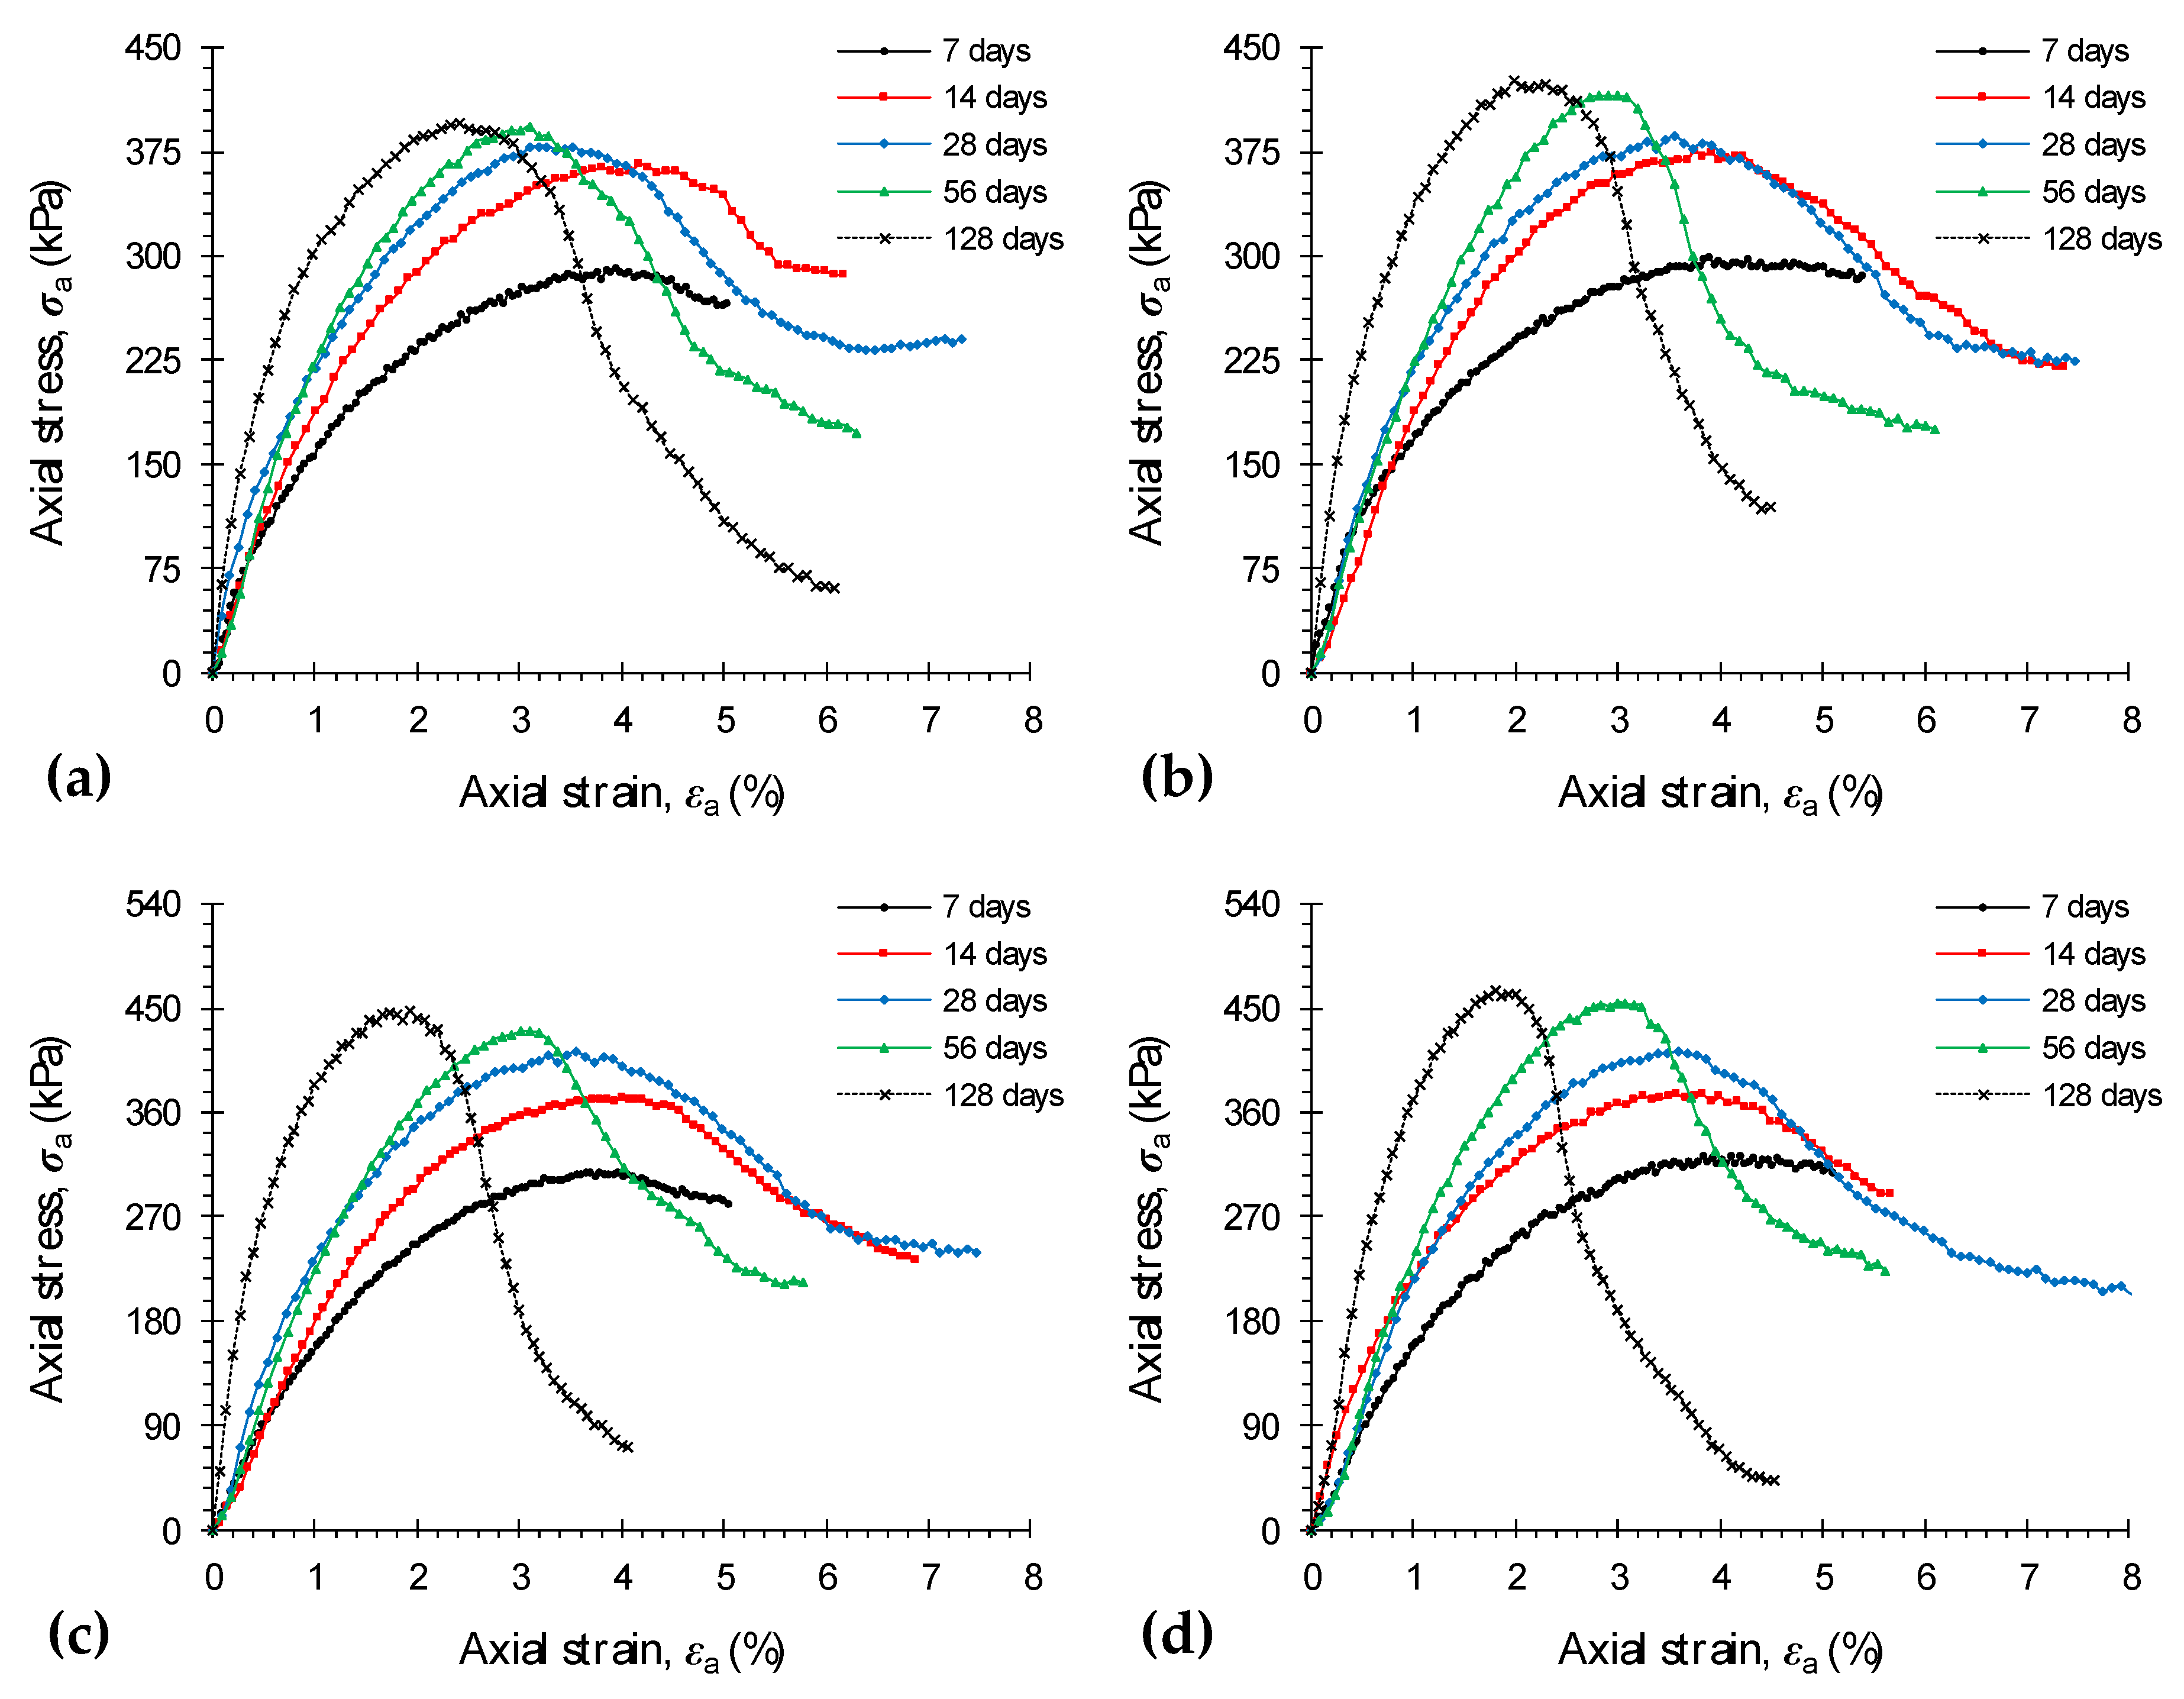
Stress–strain curves, obtained from the UC tests, for various MC + FA-treated mixtures—MxFyTz where x = {1.5, 2.5}, y = {0.5, 1.0, 1.5, 2.0, 2.5} and z = {7, 14, 28, 56, 128}—are provided in Figure A2.
Figure A2.
UC stress–strain curves for various MC + FA-treated mixtures: (a) M1.5F0.5Tz; (b) M1.5F1.0Tz; (c) M1.5F1.5Tz; (d) M1.5F2.0Tz; (e) M1.5F2.5Tz; (f) M2.5F0.5Tz; (g) M2.5F1.0Tz; (h) M2.5F1.5Tz; (i) M2.5F2.0Tz; (j) M2.5F2.5Tz (z = {7, 14, 28, 56, 128}).
Figure A2.
UC stress–strain curves for various MC + FA-treated mixtures: (a) M1.5F0.5Tz; (b) M1.5F1.0Tz; (c) M1.5F1.5Tz; (d) M1.5F2.0Tz; (e) M1.5F2.5Tz; (f) M2.5F0.5Tz; (g) M2.5F1.0Tz; (h) M2.5F1.5Tz; (i) M2.5F2.0Tz; (j) M2.5F2.5Tz (z = {7, 14, 28, 56, 128}).


References
- Jones, H.; Boger, D.V. Sustainability and waste management in the resource industries. Ind. Eng. Chem. Res. 2012, 51, 10057–10065. [Google Scholar] [CrossRef]
- Öhlander, B.; Chatwin, T.; Alakangas, L. Management of sulfide–bearing waste, a challenge for the mining industry. Minerals 2012, 2, 1–10. [Google Scholar] [CrossRef]
- Aldhafeeri, Z.; Fall, M.; Pokharel, M.; Pouramini, Z. Temperature dependence of the reactivity of cemented paste backfill. Appl. Geochem. 2016, 72, 10–19. [Google Scholar] [CrossRef]
- Davies, M.P.; Rice, S. An Alternative to Conventional Tailing Management—“Dry Stack” Filtered Tailings. In Proceedings of the 8th International Conference on Tailings and Mine Waste, Fort Collins, CO, USA, 16–19 January 2001; pp. 411–420. [Google Scholar]
- Xu, W.; Cao, P.; Tian, M. Strength development and microstructure evolution of cemented tailings backfill containing different binder types and contents. Minerals 2018, 8, 167. [Google Scholar] [CrossRef]
- Dold, B. Submarine tailings disposal (STD)—A Review. Minerals 2014, 4, 642–666. [Google Scholar] [CrossRef]
- Franks, D.M.; Boger, D.V.; Côte, C.M.; Mulligan, D.R. Sustainable development principles for the disposal of mining and mineral processing wastes. Resour. Policy 2011, 36, 114–122. [Google Scholar] [CrossRef]
- Liu, Q.; Liu, D.; Liu, X.; Gao, F.; Li, S. Research and application of surface paste disposal for clay–sized tailings in tropical rainy climate. Int. J. Miner. Process. 2016, 157, 227–235. [Google Scholar] [CrossRef]
- Kesimal, A.; Yilmaz, E.; Ercikdi, B. Evaluation of paste backfill mixtures consisting of sulphide–rich mill tailings and varying cement contents. Cem. Concr. Res. 2004, 34, 1817–1822. [Google Scholar] [CrossRef]
- Kesimal, A.; Yilmaz, E.; Ercikdi, B.; Alp, I.; Deveci, H. Effect of properties of tailings and binder on the short– and long–term strength and stability of cemented paste backfill. Mater. Lett. 2005, 59, 3703–3709. [Google Scholar] [CrossRef]
- Bloss, M.L. An Operational Perspective of Mine Backfill. In Proceedings of the 11th International Symposium on Mining with Backfill, Mine Fill 2014; Potvin, Y., Grice, T., Eds.; Australian Centre for Geomechanics: Perth, WA, Australia, 2014; pp. 15–30. [Google Scholar]
- Sivakugan, N.; Veenstra, R.; Naguleswaran, N. Underground mine backfilling in Australia using paste fills and hydraulic fills. Int. J. Geosynth. Ground Eng. 2015, 1, 18. [Google Scholar] [CrossRef]
- Rankine, R.M.; Sivakugan, N. Geotechnical properties of cemented paste backfill from Cannington Mine, Australia. Geotech. Geol. Eng. 2007, 25, 383–393. [Google Scholar] [CrossRef]
- Orejarena, L.; Fall, M. The use of artificial neural networks to predict the effect of sulphate attack on the strength of cemented paste backfill. Bull. Eng. Geol. Environ. 2010, 69, 659–670. [Google Scholar] [CrossRef]
- Sivakugan, N.; Rankine, R.M.; Rankine, K.J.; Rankine, K.S. Geotechnical considerations in mine backfilling in Australia. J. Clean. Prod. 2006, 14, 1168–1175. [Google Scholar] [CrossRef]
- Belem, T.; Benzaazoua, M. Design and application of underground mine paste backfill technology. Geotech. Geol. Eng. 2008, 26, 147–174. [Google Scholar] [CrossRef]
- Huang, S.; Xia, K.; Qiao, L. Dynamic tests of cemented paste backfill: Effects of strain rate, curing time, and cement content on compressive strength. J. Mater. Sci. 2011, 46, 5165–5170. [Google Scholar] [CrossRef]
- Zhang, J.; Deng, H.; Taheri, A.; Deng, J.; Ke, B. Effects of superplasticizer on the hydration, consistency, and strength development of cemented paste backfill. Minerals 2018, 8, 381. [Google Scholar] [CrossRef]
- Brackebusch, F.W. Basics of paste backfill systems. Min. Eng. 1994, 46, 1175–1178. [Google Scholar]
- Landriault, D. Paste Backfill Mix Design for Canadian Underground Hard Rock Mining. In Proceedings of the 97th Annual General Meeting of the CIM Rock Mechanics and Strata Control Session; Hassani, F.P., Mottahed, P., Eds.; Canadian Institute of Mining, Metallurgy and Petroleum: Montreal, QC, Canada, 1995; pp. 652–663. [Google Scholar]
- Fall, M.; Célestin, J.C.; Pokharel, M.; Touré, M. A contribution to understanding the effects of curing temperature on the mechanical properties of mine cemented tailings backfill. Eng. Geol. 2010, 114, 397–413. [Google Scholar] [CrossRef]
- Ouattara, D.; Yahia, A.; Mbonimpa, M.; Belem, T. Effects of superplasticizer on rheological properties of cemented paste backfills. Int. J. Miner. Process. 2017, 161, 28–40. [Google Scholar] [CrossRef]
- Benzaazoua, M.; Fall, M.; Belem, T. A contribution to understanding the hardening process of cemented pastefill. Miner. Eng. 2004, 17, 141–152. [Google Scholar] [CrossRef]
- Fall, M.; Samb, S.S. Pore structure of cemented tailings materials under natural or accidental thermal loads. Mater. Charact. 2008, 59, 598–605. [Google Scholar] [CrossRef]
- Taheri, A.; Tatsuoka, F. Stress-strain relations of cement–mixed gravelly soil from multiple–step triaxial compression test results. Soils Found. 2012, 52, 748–766. [Google Scholar] [CrossRef]
- Taheri, A.; Tatsuoka, F. Small- and large-strain behaviour of a cement-treated soil during various loading histories and testing conditions. Acta Geotech. 2015, 10, 131–155. [Google Scholar] [CrossRef]
- Cao, S.; Yilmaz, E.; Song, W. Evaluation of viscosity, strength and microstructural properties of cemented tailings backfill. Minerals 2018, 8, 352. [Google Scholar] [CrossRef]
- Wu, J.; Feng, M.; Chen, Z.; Mao, X.; Han, G.; Wang, Y. Particle size distribution effects on the strength characteristic of cemented paste backfill. Minerals 2018, 8, 322. [Google Scholar] [CrossRef]
- Klein, K.; Simon, D. Effect of specimen composition on the strength development in cemented paste backfill. Can. Geotech. J. 2006, 43, 310–324. [Google Scholar] [CrossRef]
- Mishra, M.K.; Karanam, U.M.R. Geotechnical characterization of fly ash composites for backfilling mine voids. Geotech. Geol. Eng. 2006, 24, 1749–1765. [Google Scholar] [CrossRef]
- Fall, M.; Belem, T.; Samb, S.; Benzaazoua, M. Experimental characterization of the stress-strain behaviour of cemented paste backfill in compression. J. Mater. Sci. 2007, 42, 3914–3922. [Google Scholar] [CrossRef]
- Ercikdi, B.; Kesimal, A.; Cihangir, F.; Deveci, H.; Alp, İ. Cemented paste backfill of sulphide–rich tailings: Importance of binder type and dosage. Cem. Concr. Compos. 2009, 31, 268–274. [Google Scholar] [CrossRef]
- Koohestani, B.; Belem, T.; Koubaa, A.; Bussière, B. Experimental investigation into the compressive strength development of cemented paste backfill containing Nano–silica. Cem. Concr. Compos. 2016, 72, 180–189. [Google Scholar] [CrossRef]
- Blotz, L.R.; Benson, C.H.; Boutwell, G.P. Estimating optimum water content and maximum dry unit weight for compacted clays. J. Geotech. Geoenvironmental Eng. 1998, 124, 907–912. [Google Scholar] [CrossRef]
- Nagaraj, H.B.; Reesha, B.; Sravan, M.V.; Suresh, M.R. Correlation of compaction characteristics of natural soils with modified plastic limit. Transp. Geotech. 2015, 2, 65–77. [Google Scholar] [CrossRef]
- Estabragh, A.R.; Khatibi, M.; Javadi, A.A. Effect of cement on treatment of a clay Soil contaminated with glycerol. J. Mater. Civ. Eng. 2016, 28, 04015157:1–04015157:10. [Google Scholar] [CrossRef]
- Soltani, A.; Deng, A.; Taheri, A.; Mirzababaei, M. Rubber powder–polymer combined stabilization of South Australian expansive soils. Geosynth. Int. 2018, 25, 304–321. [Google Scholar] [CrossRef]
- Estabragh, A.R.; Namdar, P.; Javadi, A.A. Behavior of cement–stabilized clay reinforced with nylon fiber. Geosynth. Int. 2012, 19, 85–92. [Google Scholar] [CrossRef]
- Soltani, A.; Taheri, A.; Khatibi, M.; Estabragh, A.R. Swelling potential of a stabilized expansive soil: A comparative experimental study. Geotech. Geol. Eng. 2017, 35, 1717–1744. [Google Scholar] [CrossRef]
- Maher, M.H.; Ho, Y.C. Mechanical properties of kaolinite/fiber soil composite. J. Geotech. Eng. 1994, 120, 1381–1393. [Google Scholar] [CrossRef]
- Yadav, J.S.; Tiwari, S.K. Evaluation of the strength characteristics of cement–stabilized clay–crumb rubber mixtures for its sustainable use in geotechnical applications. Environ. Dev. Sustain. 2018, 20, 1961–1985. [Google Scholar] [CrossRef]
- Mirzababaei, M.; Miraftab, M.; Mohamed, M.; McMahon, P. Unconfined compression strength of reinforced clays with carpet waste fibers. J. Geotech. Geoenvironmental Eng. 2013, 139, 483–493. [Google Scholar] [CrossRef]
- Mirzababaei, M.; Arulrajah, A.; Horpibulsuk, S.; Soltani, A.; Khayat, N. Stabilization of soft clay using short fibers and poly vinyl alcohol. Geotext. Geomembranes 2018, 46, 646–655. [Google Scholar] [CrossRef]
- Soltani, A.; Deng, A.; Taheri, A.; Sridharan, A. Swell–shrink–consolidation behavior of rubber-reinforced expansive soils. Geotech. Test. J. 2019, 42. [Google Scholar] [CrossRef]
- Taheri, A.; Tani, K. Use of down–hole triaxial apparatus to estimate the mechanical properties of heterogeneous mudstone. Int. J. Rock Mech. Min. Sci. 2008, 45, 1390–1402. [Google Scholar] [CrossRef]
- Soltani, A.; Deng, A.; Taheri, A.; Mirzababaei, M. A sulphonated oil for stabilisation of expansive soils. Int. J. Pavement Eng. 2017. [Google Scholar] [CrossRef]
- Grice, T. Underground Mining with Backfill. In Proceedings of 2nd Annual Summit—Mine Tailings Disposal Systems; Australasian Institute of Mining and Metallurgy: Carlton, VIC, Australia, 1998; pp. 234–239. [Google Scholar]
- Tariq, A. Synergistic and Environmental Benefits of Using Cement Kiln Dust with Slag and Fly Ash in Cemented Paste Tailings. Ph.D. Thesis, The University of Western Ontario, London, ON, Canada, 2012. [Google Scholar]
- United States Environmental Protection Agency (USEPA). Handbook for Stabilization/Solidification of Hazardous Waste; Report EPA/540/2-86/001; Hazardous Waste Engineering Research Laboratory: Cincinnati, OH, USA, 1986. [Google Scholar]
- Jewell, R.J.; Fourie, A.B. Paste and Thickened Tailings—A Guide, 1st ed.; Australian Centre for Geomechanics: Perth, WA, Australia, 2002; pp. 103–126. [Google Scholar]
- Locat, J.; Bérubé, M.-A.; Choquette, M. Laboratory investigations on the lime stabilization of sensitive clays: Shear strength development. Can. Geotech. J. 1990, 27, 294–304. [Google Scholar] [CrossRef]
- Sivapullaiah, P.V.; Prashanth, J.P.; Sridharan, A. Effect of fly ash on the index properties of black cotton soil. Soils Found. 1996, 36, 97–103. [Google Scholar] [CrossRef]
- Mallela, J.; Von Quintus, H.; Smith, K.L. Consideration of Lime–Stabilized Layers in Mechanistic–Empirical Pavement Design; The National Lime Association: Arlington, VA, USA, 2004; Available online: http://lime.org/documents/other/MechEmpPavement.pdf (accessed on 2 December 2018).
- Sharma, A.K.; Sivapullaiah, P.V. Ground granulated blast furnace slag amended fly ash as an expansive soil stabilizer. Soils Found. 2016, 56, 205–212. [Google Scholar] [CrossRef]
Figure 1.
Variations of (a) peak UC strength qu and (b) axial strain at failure εu against MC content for the samples tested at various curing times (i.e., MxFyTz where x = {1.5, 2.5, 3.0}, y = {0} and z = {7, 14, 28, 56, 128}).
Figure 1.
Variations of (a) peak UC strength qu and (b) axial strain at failure εu against MC content for the samples tested at various curing times (i.e., MxFyTz where x = {1.5, 2.5, 3.0}, y = {0} and z = {7, 14, 28, 56, 128}).

Figure 2.
Variations of (a) peak strain energy Eu and (b) elastic stiffness modulus E50 against MC content for the samples tested at various curing times (i.e., MxFyTz where x = {1.5, 2.5, 3.0}, y = {0} and z = {7, 14, 28, 56, 128}).
Figure 2.
Variations of (a) peak strain energy Eu and (b) elastic stiffness modulus E50 against MC content for the samples tested at various curing times (i.e., MxFyTz where x = {1.5, 2.5, 3.0}, y = {0} and z = {7, 14, 28, 56, 128}).

Figure 3.
Variations of (a) peak strain energy Eu and (b) elastic stiffness modulus E50 against peak UC strength qu for various MC-treated mixtures (i.e., MxFyTz where x = {1.5, 2.5, 3.0}, y = {0} and z = {7, 14, 28, 56, 128}).
Figure 3.
Variations of (a) peak strain energy Eu and (b) elastic stiffness modulus E50 against peak UC strength qu for various MC-treated mixtures (i.e., MxFyTz where x = {1.5, 2.5, 3.0}, y = {0} and z = {7, 14, 28, 56, 128}).

Figure 4.
Variations of (a) peak UC strength qu and (b) elastic stiffness modulus E50 against curing time for the samples treated with 1.5%, 2.5% and 3% MC and 4% PC.
Figure 4.
Variations of (a) peak UC strength qu and (b) elastic stiffness modulus E50 against curing time for the samples treated with 1.5%, 2.5% and 3% MC and 4% PC.

Figure 5.
Variations of peak UC strength qu against FA content for the samples tested at various curing times: (a) M1.5FyTz; (b) M2.5FyTz (y = {0, 0.5, 1.0, 1.5, 2.0, 2.5} and z = {7, 14, 28, 56, 128}).
Figure 5.
Variations of peak UC strength qu against FA content for the samples tested at various curing times: (a) M1.5FyTz; (b) M2.5FyTz (y = {0, 0.5, 1.0, 1.5, 2.0, 2.5} and z = {7, 14, 28, 56, 128}).

Figure 6.
Variations of axial strain at failure εu against FA content for the samples tested at various curing times: (a) M1.5FyTz; (b) M2.5FyTz (y = {0, 0.5, 1.0, 1.5, 2.0, 2.5} and z = {7, 14, 28, 56, 128}).
Figure 6.
Variations of axial strain at failure εu against FA content for the samples tested at various curing times: (a) M1.5FyTz; (b) M2.5FyTz (y = {0, 0.5, 1.0, 1.5, 2.0, 2.5} and z = {7, 14, 28, 56, 128}).

Figure 7.
Variations of peak strain energy Eu against FA content for the samples tested at various curing times: (a) M1.5FyTz; (b) M2.5FyTz (y = {0, 0.5, 1.0, 1.5, 2.0, 2.5} and z = {7, 14, 28, 56, 128}).
Figure 7.
Variations of peak strain energy Eu against FA content for the samples tested at various curing times: (a) M1.5FyTz; (b) M2.5FyTz (y = {0, 0.5, 1.0, 1.5, 2.0, 2.5} and z = {7, 14, 28, 56, 128}).

Figure 8.
Variations of elastic stiffness modulus E50 against FA content for the samples tested at various curing times: (a) M1.5FyTz; (b) M2.5FyTz (y = {0, 0.5, 1.0, 1.5, 2.0, 2.5} and z = {7, 14, 28, 56, 128}).
Figure 8.
Variations of elastic stiffness modulus E50 against FA content for the samples tested at various curing times: (a) M1.5FyTz; (b) M2.5FyTz (y = {0, 0.5, 1.0, 1.5, 2.0, 2.5} and z = {7, 14, 28, 56, 128}).

Figure 9.
Variations of (a) peak strain energy Eu and (b) elastic stiffness modulus E50 against peak UC strength qu for various MC + FA-treated mixtures (i.e., MxFyTz where x = {1.5, 2.5}, y = {0, 0.5, 1.0, 1.5, 2.0, 2.5} and z = {7, 14, 28, 56, 128}).
Figure 9.
Variations of (a) peak strain energy Eu and (b) elastic stiffness modulus E50 against peak UC strength qu for various MC + FA-treated mixtures (i.e., MxFyTz where x = {1.5, 2.5}, y = {0, 0.5, 1.0, 1.5, 2.0, 2.5} and z = {7, 14, 28, 56, 128}).

Figure 10.
SEM micrographs for the tested samples: (a) M0F0T7 (pure tailings); (b) M2.5F0T7; (c) M2.5F0T28; (d) M2.5F1.5T7; (e) M2.5F1.5T28.
Figure 10.
SEM micrographs for the tested samples: (a) M0F0T7 (pure tailings); (b) M2.5F0T7; (c) M2.5F0T28; (d) M2.5F1.5T7; (e) M2.5F1.5T28.


Table 1.
Physical and mechanical properties of the used tailings.
| Properties | Value | Standard Designation |
|---|---|---|
| Specific gravity, Gs | 2.4 | ASTM D854–14 |
| Natural water content, wN (%) | 40.2 | ASTM D2216–10 |
| Fines [<75 μm] (%) | 38.6 | ASTM D422–07 |
| Fine sand [0.075–0.425 mm] (%) | 55.2 | ASTM D422–07 |
| Medium sand [0.425–2 mm] (%) | 6.2 | ASTM D422–07 |
| Coarse sand [2–4.75 mm] (%) | 0 | ASTM D422–07 |
| Liquid limit, wL (%) | 19.2 | AS 1289.3.9.1–15 |
| Plastic limit, wP (%) | 13.1 | AS 1289.3.2.1–09 |
| Plasticity index, IP (%) | 6.1 | AS 1289.3.3.1–09 |
| USCS classification | CL–ML 1 | ASTM D2487–11 |
| Optimum water content, wopt (%) | 8.7 | ASTM D698–12 |
| Maximum dry unit weight, γdmax (kN/m3) | 20.2 | ASTM D698–12 |
| Unconfined compressive strength, qu (kPa) 2 | 143.6 | ASTM D2166–16 |
1 Clay–Silt with low plasticity; and 2 Tested at standard Proctor optimum condition.
Table 2.
Chemical composition of the used tailings (as supplied by the distributor).
| Component | SiO2 | Fe2O3 | Al2O3 | K2O | CaO | MgO | TiO2 | Na2O | Other |
|---|---|---|---|---|---|---|---|---|---|
| Mass percentage (%) | 38.27 | 37.70 | 7.19 | 2.33 | 0.81 | 0.75 | 0.56 | 0.07 | 12.32 |
Table 3.
Chemical composition of MC (as supplied by the manufacturer).
| Component | Mass Percentage (%) |
|---|---|
| Ground-granulated blast-furnace slag | 50 |
| Portland cement clinker | 20 |
| Cement kiln dust | <15 |
| Natural gypsum | 5–7 |
| Chloride, Cl− | <8 |
| Limestone | <7 |
| Sulfur trioxide, SO3 | <4 |
| Crystalline silica | <1 |
Table 4.
Chemical composition of the processed mine water (as supplied by the distributor).
| Component | Cl− | SO42− | NO3− | Na+ | Ca2+ | K+ | Mg2+ |
|---|---|---|---|---|---|---|---|
| Value (mg/L) | 5800 | 2400 | 6 | 3800 | 480 | 380 | 280 |
Table 5.
Mix designs and their properties.
| Designation | MC Content, Mc (%) | FA Content, Fc (%) | Solids Content, Sc (%) | Water Content, Wc (%) |
|---|---|---|---|---|
| M1.5F0T7,14,28,56,128 | 1.5 | 0 | 77 | 30 |
| M2.5F0T7,14,28,56,128 | 2.5 | 0 | 77 | 30 |
| M3.0F0T7,14,28,56,128 | 3.0 1 | 0 | 77 | 30 |
| M1.5F0.5T7,14,28,56,128 | 1.5 | 0.5 | 77 | 30 |
| M1.5F1.0T7,14,28,56,128 | 1.5 | 1.0 | 77 | 30 |
| M1.5F1.5T7,14,28,56,128 | 1.5 | 1.5 | 77 | 30 |
| M1.5F2.0T7,14,28,56,128 | 1.5 | 2.0 | 77 | 30 |
| M1.5F2.5T7,14,28,56,128 | 1.5 | 2.5 | 77 | 30 |
| M2.5F0.5T7,14,28,56,128 | 2.5 | 0.5 | 77 | 30 |
| M2.5F1.0T7,14,28,56,128 | 2.5 | 1.0 | 77 | 30 |
| M2.5F1.5T7,14,28,56,128 | 2.5 | 1.5 | 77 | 30 |
| M2.5F2.0T7,14,28,56,128 | 2.5 | 2.0 | 77 | 30 |
| M2.5F2.5T7,14,28,56,128 | 2.5 | 2.5 | 77 | 30 |
1 Manufacturer-recommended content.
© 2018 by the authors. Licensee MDPI, Basel, Switzerland. This article is an open access article distributed under the terms and conditions of the Creative Commons Attribution (CC BY) license (http://creativecommons.org/licenses/by/4.0/).
Share and Cite
MDPI and ACS Style
Zhao, Y.; Soltani, A.; Taheri, A.; Karakus, M.; Deng, A. Application of Slag–Cement and Fly Ash for Strength Development in Cemented Paste Backfills. Minerals 2019, 9, 22. https://doi.org/10.3390/min9010022
AMA Style
Zhao Y, Soltani A, Taheri A, Karakus M, Deng A. Application of Slag–Cement and Fly Ash for Strength Development in Cemented Paste Backfills. Minerals. 2019; 9(1):22. https://doi.org/10.3390/min9010022
Chicago/Turabian StyleZhao, Yue, Amin Soltani, Abbas Taheri, Murat Karakus, and An Deng. 2019. "Application of Slag–Cement and Fly Ash for Strength Development in Cemented Paste Backfills" Minerals 9, no. 1: 22. https://doi.org/10.3390/min9010022
Note that from the first issue of 2016, this journal uses article numbers instead of page numbers. See further details here.