


INTRODUCTION
Firn is the intermediate product created when snow is converted to glacier ice by a combination of compaction and/or melt–freeze processes. Typically, the objectives of firn monitoring are to measure annual accumulation and densification, identify ice lenses and layers, measure temperature and track percolation of water and estimate the volume of meltwater stored in the firnpack (van As and others, Reference van As, Box and Fausto2016). These parameters are critical for the assessment of glacier mass balance (Sørensen and others, Reference Sørensen2011; Simonsen and others, Reference Simonsen2013; Munneke and others, Reference Munneke2015; Schaller and others, Reference Schaller2016) and accurate dating of ice cores, by estimating annual layer thickness (Vallelonga and others, Reference Vallelonga2014). Variations in densification rates are typically measured via in situ methods including snow pits and shallow cores (Simonsen and others, Reference Simonsen2013), borehole logging (Hawley and Waddington, Reference Hawley and Waddington2011), ‘coffee can’ experiments (Arthern and others, Reference Arthern, Vaughan, Rankin, Mulvaney and Thomas2010) or remote-sensing methods including airborne ice-penetrating radar (Medley and others, Reference Medley2013; Reference Medley2017).
Firn can act as significant storage of meltwater, delaying its release to the subglacial environment. The short-term variability in water retention is extremely challenging to measure, since within-firn processes take place at depth, out of sight of many observation techniques (van As and others, Reference van As, Box and Fausto2016), but can have a significant impact on mass-balance estimates (Harper and others, Reference Harper, Humphrey, Pfeffer, Brown and Fettweis2012; Rennermalm and others, Reference Rennermalm2013; Forster and others, Reference Forster2014; Koenig and others, Reference Koenig, Miege, Forster and Brucker2014; de la Pena and others, Reference de la Pena2015; Mikkelsen and others, Reference Mikkelsen2016). Meltwater percolation may be measured via snow forks (Pfeffer and Humphrey, Reference Pfeffer and Humphrey1998), or time domain reflectometry (Samimi and Marshall, Reference Samimi and Marshall2017), and then radar, seismic or magnetic resonance techniques can be applied to detect and monitor subsurface meltwater (Forster and others, Reference Forster2014; Machguth and others, Reference Machguth2016; Montgomery and others, Reference Montgomery2017; Legchenko and others, Reference Legchenko2018) but in situ measurements are difficult to implement.
A few studies have conducted continuous, long-term subsurface measurement of temperature in firn in order to capture the release of latent heat from refreezing (Humphrey and others, Reference Humphrey, Harper and Pfeffer2012; Charalampidis and others, Reference Charalampidis2015), or combined upward-looking radar with GPS measurements to determine accumulation and water content (Heilig and others, Reference Heilig, Eisen and Schneebeli2010; Schmid and others, Reference Schmid2015). However, many in situ observational studies cover only short time intervals (e.g. single-point cores (Simonsen and others, Reference Simonsen2013)), and longer term datasets are typically limited to wired sensors that must be connected to the surface (e.g. thermistor string measurements, such as Humphrey and others, Reference Humphrey, Harper and Pfeffer2012; Koenig and others, Reference Koenig, Miege, Forster and Brucker2014). Invasive monitoring can have a substantial impact on firn structure, and may result in altered percolation pathways and formation of ice lenses.
Novel sensing techniques are therefore required to track these phenomena and understand their impact on ice-sheet processes. The development of new methods for the detection of water in firn has been identified as a research priority by the scientific community. A promising solution to this problem is the use of wireless sensors, which require no physical connection to the surface, and can be manufactured in small sizes which reduces disruption to the firn structure on deployment. Wireless sensors have been developed for a variety of glaciological applications (Martinez and others, Reference Martinez, Hart and Ong2004; Hart and others, Reference Hart2006, Reference Hart, Rose, Waller, Vaughan-Hirsch and Martinez2011; Rose and others, Reference Rose, Hart and Martinez2009; Bagshaw and others, Reference Bagshaw2012, Reference Bagshaw2014; Smeets and others, Reference Smeets2012; van de Wal and others, Reference van de Wal2015), and are becoming sufficiently technologically mature to enable reliable operation in extreme polar environments. The key requirements for such sensor platforms are robustness, ease of use, ability to withstand low temperatures and prolonged operation with no external power sources. The sensor suite on board the platform varies according to the measurement requirements, but to date, simple mechanical and electronic sensors have been successfully tested. These include pressure (Bagshaw and others, Reference Bagshaw2012, Reference Bagshaw2014; Smeets and others, Reference Smeets2012; van de Wal and others, Reference van de Wal2015), temperature (Hart and others, Reference Hart2006, Reference Hart, Rose, Waller, Vaughan-Hirsch and Martinez2011; Bagshaw and others, Reference Bagshaw2014), strain (Hart and others, Reference Hart, Rose, Waller, Vaughan-Hirsch and Martinez2011) and electrical conductivity (Rose and others, Reference Rose, Hart and Martinez2009; Bagshaw and others, Reference Bagshaw2014). Electrical conductivity is of particular interest for wet firn applications since it can be used to detect the presence of relatively low volumes of liquid water (<1 kg m−3) (Bagshaw and others, Reference Bagshaw, Tranter, Wadham, Fountain and Mowlem2011), which could be used to monitor the appearance and persistence of subsurface aquifers.
In this paper, we present a new application of wireless sensors to measure physical and hydrological processes within firn, to detect the presence or absence of meltwater, melting and refreezing, and the movement of water within the firnpack. The wireless platform was equipped with three sensors: pressure, temperature and electrical conductivity, which work in tandem to measure subsurface changes within the firn. The sensors’ detection of physical changes in the firn was validated with laboratory and field experiments, and then a suite of sensors was deployed in two contrasting locations on the Greenland Ice Sheet. We used the sensors to assess differences in firn behaviour between two field sites at the centre and the shear margin of a fast flowing ice stream, and to investigate if the differences in ice velocity and strain could be identified in the firn during our 4-week measurement window. We report the results of this proof-of-concept deployment, and discuss how wireless sensors can enhance our understanding of glaciological processes in snow and firn.
METHODS
Field site
The sensor tests were undertaken at the East Greenland Ice Core Project (EGRIP) camp in northeast Greenland (75.6268°N, 35.9915°W, c. 2700 m, Fig. 1). The camp is situated on the North East Greenland Ice Stream (NEGIS), which drains most of the northeastern part of the ice sheet. Over its 600 km length, it reaches velocities of 20 m a−1 <150 km from the ice divide (Joughin and others, Reference Joughin, Smith, Howat, Scambos and Moon2010; Karlsson and Dahl-Jensen, Reference Karlsson and Dahl-Jensen2015). At the field camp, the mean velocity is 57 m a−1, moving horizontally to the north east. The velocities at the shear margin 12 km away are 25 m a−1. The majority of the ice stream's motion is attributed to basal motion rather than internal deformation (Christianson and others, Reference Christianson2014). This rapid movement means that the sides of the ice stream should experience significant shear stresses, which could be expressed in firn as differential densification rates (Alley and Bentley, Reference Alley and Bentley1988; Christianson and others, Reference Christianson2014), or disruption of layering across shear margins (Joughin and others, Reference Joughin, Fahnestock, MacAyeal, Bamber and Gogineni2001; Karlsson and others, Reference Karlsson, Rippin, Bingham and Vaughan2012; Karlsson and Dahl-Jensen, Reference Karlsson and Dahl-Jensen2015).
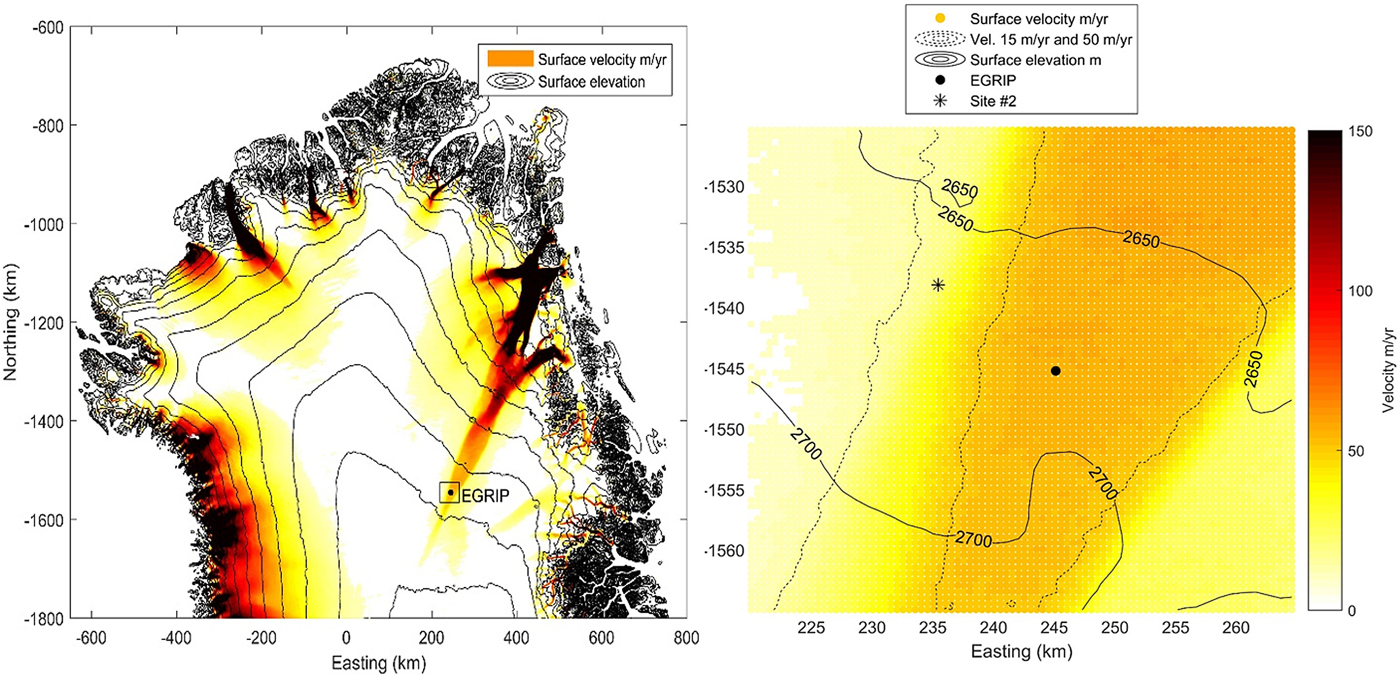
Fig. 1. Location, surface elevation and velocity of EGRIP camp, and the adjacent NEGIS shear margin. Sensors were installed at EGRIP and Site #2. Surface velocities from Joughin and others (Reference Joughin, Smith, Howat, Scambos and Moon2010) and elevation from Bamber and others (Reference Bamber2013).
In 2012, a 67 m-deep test core from the EGRIP site was retrieved and revealed an annual layer thickness of 11 cm ice equivalent (Vallelonga and others, Reference Vallelonga2014), reflecting the overall low accumulation in the region. The firn–ice transition is approximately at 70 m depth (Fujita and others, Reference Fujita2014) and no significant ice lenses were found in the firn column (Vallelonga and others, Reference Vallelonga2014). Local accumulation rates on small spatial scales are not well known in the area, and regional climate models only return smoothly varying accumulation fields where the difference in accumulation rate between the two sites is small. An extensive seismic and radar survey revealed that firn densities in the shear margins were found to be lower in the top 20 m but greater below ~30 m depth, compared with areas outside and in the interior of the ice stream (Christianson and others, Reference Christianson2014). Christianson and others (Reference Christianson2014) attribute this difference to the higher stresses in the shear margins, since the difference in surface elevation is <10 m between the two sites (Bamber and others, Reference Bamber2013).
Sensor platform
The wireless sensor platforms tested were a hybrid of ‘ETracers’ and ‘Cryoeggs’ (Bagshaw and others, Reference Bagshaw2012, Reference Bagshaw2014). These ‘ET + ’ platforms are small, lower temperature versions of the previous sensors (10 to −35°C, rather than 20 to −10°C, respectively), and were formed from 50 mm diameter acrylic spheres in two halves (Fig. 2). Within the sphere, custom-designed circuit boards, sensors and electronic components were fixed in place using epoxy resin (Sicomin) loaded with glass microspheres. The platform was controlled by a PIC16F690 8-bit microcontroller, which enabled the sensors, managed power-saving sleep modes and coordinated data transmission. Each unit was powered by a ½ AA size lithium battery (22 mm length, 10.5 mm diameter), which provided an operational lifetime of ~3 months, depending on the duty cycle of data transmission.
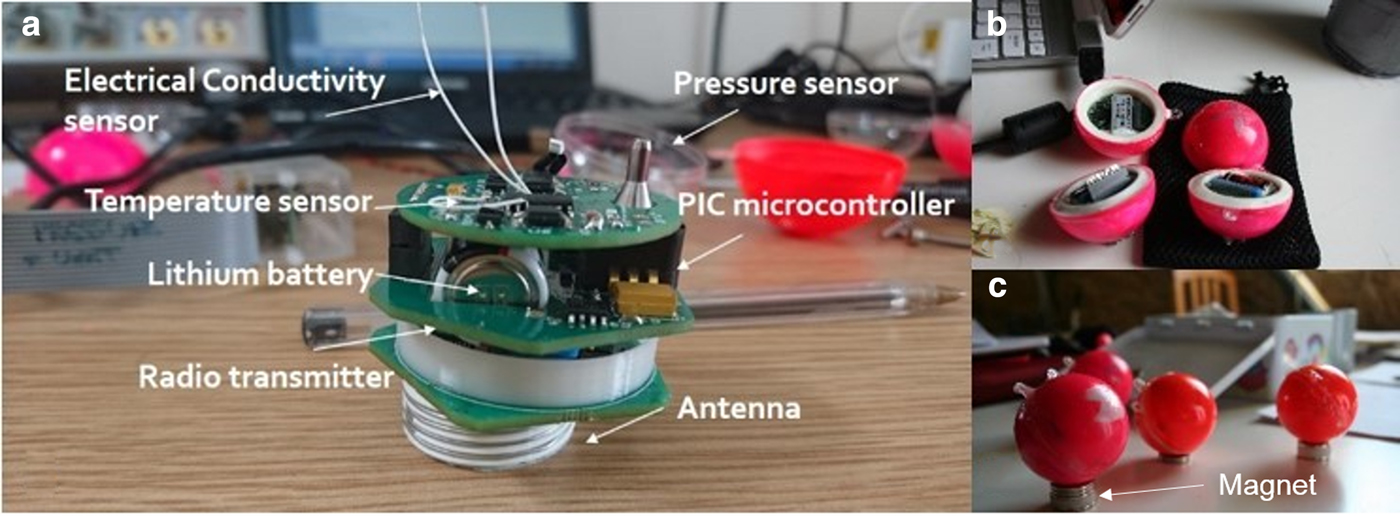
Fig. 2. ET+ platform design, showing the triple stacked circuit boards with sensors and antenna (a), which is later potted into two half-spheres (b) and fixed together with resin prior to deployment (c). Note the magnets in (c) used to switch off the assembled ET+ via a reed switch.
The ET+ platform contained three sensors: for pressure (P), electrical conductivity (EC) and temperature (T), adapted from the ‘Cryoegg’ sensor (Bagshaw and others, Reference Bagshaw2014). Briefly, P was measured by a Honeywell 40PC, which sensed gauge pressure over a range of 0–100 kPa (±2 kPa), T by a PT1000 platinum wire sensor embedded into the ET+ shell, and EC by a voltage divider across two stainless steel bolt electrodes mounted in the shell, excited by a 500 Hz square wave (see Bagshaw and others, Reference Bagshaw2012). The temperature sensor had a range of measurement between −35 and 30°C, with 0.05°C resolution, and the EC sensor was calibrated using KCl solutions of varying concentration, equivalent to 0–200 µS cm−1. The EC sensor was designed to detect significant changes in wetness and/or solution concentration rather than precise changes in conductivity, and was hence accurate to ±2 µS cm−1. The platform was assembled in two half spheres containing circuit boards, battery and sensors, which were fixed together immediately prior to deployment using a water-tight two-part adhesive. The assembled ET+ contained an ‘always closed’ reed switch, which meant they could be powered down using a magnet when not in use.
Data were stored on a 512 kB EEPROM (25AA512) prior to transmission, and sent at fixed intervals using a VHF 50 mW transmitter operating at 151.6 MHz (Radiometrix TX1). On-off frequency shift keying was used to generate a binary representation of ASCII characters stored on the internal EEPROM. The 13-byte data packets included a sensor identifier, followed by measurements of P, EC and T as recorded by the sensors. The platforms included a helical antenna, optimized for fresh water and tested in glacial meltwaters and air (Lishman and others, Reference Lishman2013; Bagshaw and others, Reference Bagshaw2014).
Receivers
Data transmitted by the ET+ were received using two different systems: a WinRadio and an ‘ApRES’ (autonomous phase-sensitive radio-echo sounder) (Nicholls and others, Reference Nicholls2015). Both used a 151 MHz Yagi (Biotrack) as antenna, orientated parallel to the ice surface, with the centre pole directed at the buried sensors. The WinRadio system comprised a WinRadio G305 (http://www.winradio.com) and a tablet computer, running a Matlab GUI to record the encoded intermediate frequency audio output. The station was run on 240 V power at EGRIP camp (mean 0.5 A draw, no sleep modes), but can be adapted for remote operation. The ApRES is a robust instrument specifically designed for long-term, autonomous operation in extremely cold environments (Nicholls and others, Reference Nicholls2015). The instrument is housed in a waterproof plastic case, and the extremely low-power consumption (0.5 A maximum current draw, 100 µA during sleep modes) mean that it is ideal for remote operation in polar climates. The radio receiver in ApRES has an intrinsic lower frequency limit of 120 MHz (scattering matrix |S 11| <−10 dB) at its input port. Since the ET+ operates on 151.6 MHz, its data transmission chirps can be recorded by a specifically programmed ApRES. Both recording systems in the receivers operated in intermittent sleep mode, switching on hourly (WinRadio) or every 2 h (ApRES) to ‘listen’ and record ET+ chirps.
Audio data from both receivers were stored with an associated timestamp on removable memory cards. Data were extracted from the recorded audio files using an automated decoding protocol in a custom-written Python script, which demodulated the data and converted the binary representations of ASCII characters into identifiable data bursts. Since each sensor platform has a unique identifier, the data transmitted by individual sensors could be tracked over time. In addition to the stand-alone receivers, a Biotrack Sika radio tracker was used to assess the received signal strength (RSS, see Bagshaw and others, Reference Bagshaw2014) during performance tests, but was not used for data recording.
Sensor tests
The performance of the EC, T and P sensors was tested via a series of simple tests at EGRIP. The first test aimed to determine whether the ET+ could be used to detect meltwater in snow. Here, the sensors were inserted into the middle (c. 25 cm deep) of a 14 L capacity plastic bucket of cold, dry snow freshly collected from EGRIP camp, onto which 1 L of freshly melted snow (c. 0.5°C, 15 µS cm−1) was poured in a single slug at the beginning of the experiment. The bulk snow did not completely melt, but the meltwater pulse percolated down through the bucket during the 10 h tests. The test was performed at room temperature ~18°C, although this temperature was not kept constant. The sensors took a measurement every 30 s, which was transmitted every 2 min with no averaging prior to transmission. The chirp was recorded hourly by the WinRadio receiver, situated adjacent to the bucket. Recording frequency could be increased to match chirp frequency, but the hourly recording in this case was based on power requirements of the receiver and data storage capacity.
The second test was a series of measurements to establish the transmission range vertically and horizontally of the ET+ through firn. For the vertical tests, a sensor was incrementally lowered into a 60 m-deep borehole on a weighted line, pausing every 5 m for 1 min. The signal strength of the sensor chirps was independently monitored using the portable Biotrack Sika radio-tracking receiver as the sensor was lowered. The data were recorded by the ApRES, situated 5 m from the top of the borehole (Table 1). In the horizontal tests, the range was measured from ET+ sensors buried at 14 m (deep horizontal in Table 1), and also near the surface (0.15 m, shallow horizontal). The range of the ET+ sensor buried at 14 m was assessed with the Sika and ApRES receivers, moving away at 10 m increments. Signal strength and data quality were monitored as the distance from the sensor increased, up to 1 km horizontal from the top of the hole. For the 15 cm shallow ET+ sensor, the WinRadio (which also included a signal strength analyser) was moved across the snow surface. The RSS was recorded as the receiver and antenna were moved away from the sensor in 10 m increments, by up to 200 m in four directions.
Table 1. Range test parameters, showing distance between sensor and surface, sensor and receivers and the total distance over which the various tests were performed

Deployment
Following testing, the ET+ sensors were deployed in two identically sized boreholes nearby EGRIP camp. These 104 mm diameter boreholes were drilled using a hand auger 12 m into the firn, from a 2 m-deep snow pit. The first borehole was situated in the centre of the ice stream, within the EGRIP camp (75.6299°N, −35.987°E), where the ice stream velocity is 57 m a−1. The second borehole was in the shear zone of the ice stream margin (75.7062°N, −36.2979°E), where velocities were much lower at 25 m a−1 (Fig. 1). The difference in shear strain rate between the two sites is at least an order of magnitude (Fahnestock and others, Reference Fahnestock2001). The sensors were left in situ for 28 d and the borehole was not back-filled. The borehole spanned firn and transitional ice up to 400 years old at 67 m depth (Fujita and others, Reference Fujita2014; Vallelonga and others, Reference Vallelonga2014).
The ET+ sensors were placed at the base of the two 14 m-deep boreholes. In the snow pit above the borehole, an ETracer (Bagshaw and others, Reference Bagshaw2012) which measured pressure alone was installed in the wall at ~1 m below the surface to measure gauge pressure at ambient atmospheric conditions. The pits were left open to the atmosphere, and the snow unpacked above the sensors. At the ice stream camp site, the sensors were monitored using the WinRadio receiver. The WinRadio and tablet PC were in a waterproof case installed in an adjacent tent, some 10 m from the top of the borehole. The WinRadio was powered via the EGRIP camp generator, although a lithium battery pack was available on standby. The Yagi antenna was mounted on the outside of the tent at ground level, oriented towards the borehole. At the shear margin site, the sensors were monitored using the ApRES receiver. This was powered by a lead acid battery, trickle-charged by a solar panel. The ApRES was in a waterproof case, stored inside a polystyrene box with the battery, to which the yagi antenna was mounted ~0.5 m above the snow, oriented towards the borehole. The WinRadio remained powered throughout, and recorded audio data once per hour for 5 min. The ApRES, by contrast, was run in power-saving mode to prolong battery life, switching on once every 2 h for 2 min.
RESULTS
Percolation test
All sensors performed well in laboratory calibration, and in field tests. Figure 3 shows the T, EC and P measurements broadcast by the ET+ during overnight snow bucket tests. In the first experiment, the meltwater percolated down through 25 cm snow during the first 4 h of the test, and was detected by the sensor after 240 min. Over the next 4 h, the EC reading gradually increased as the snow surrounding the sensor was wetted. The measurements stabilized between 400 and 500 min, and increased again after 600 min. We hypothesize that this modest jump was because of disturbance to the bucket by personnel arriving in the field laboratory in the morning: a small movement may have prompted settling or redistribution of meltwater within the snow. This was not evident when the experiment was repeated (Fig. 3b). Here, the meltwater reached the sensor more rapidly (by 100 min), possibly because of a preferential flowpath within the packed snow. The temperature and pressure measured by the sensors remained broadly constant throughout the experiment. This, alongside visual observations, indicated that the snow around the sensor did not completely melt, but that water percolated through the snow and was registered by the EC sensor.
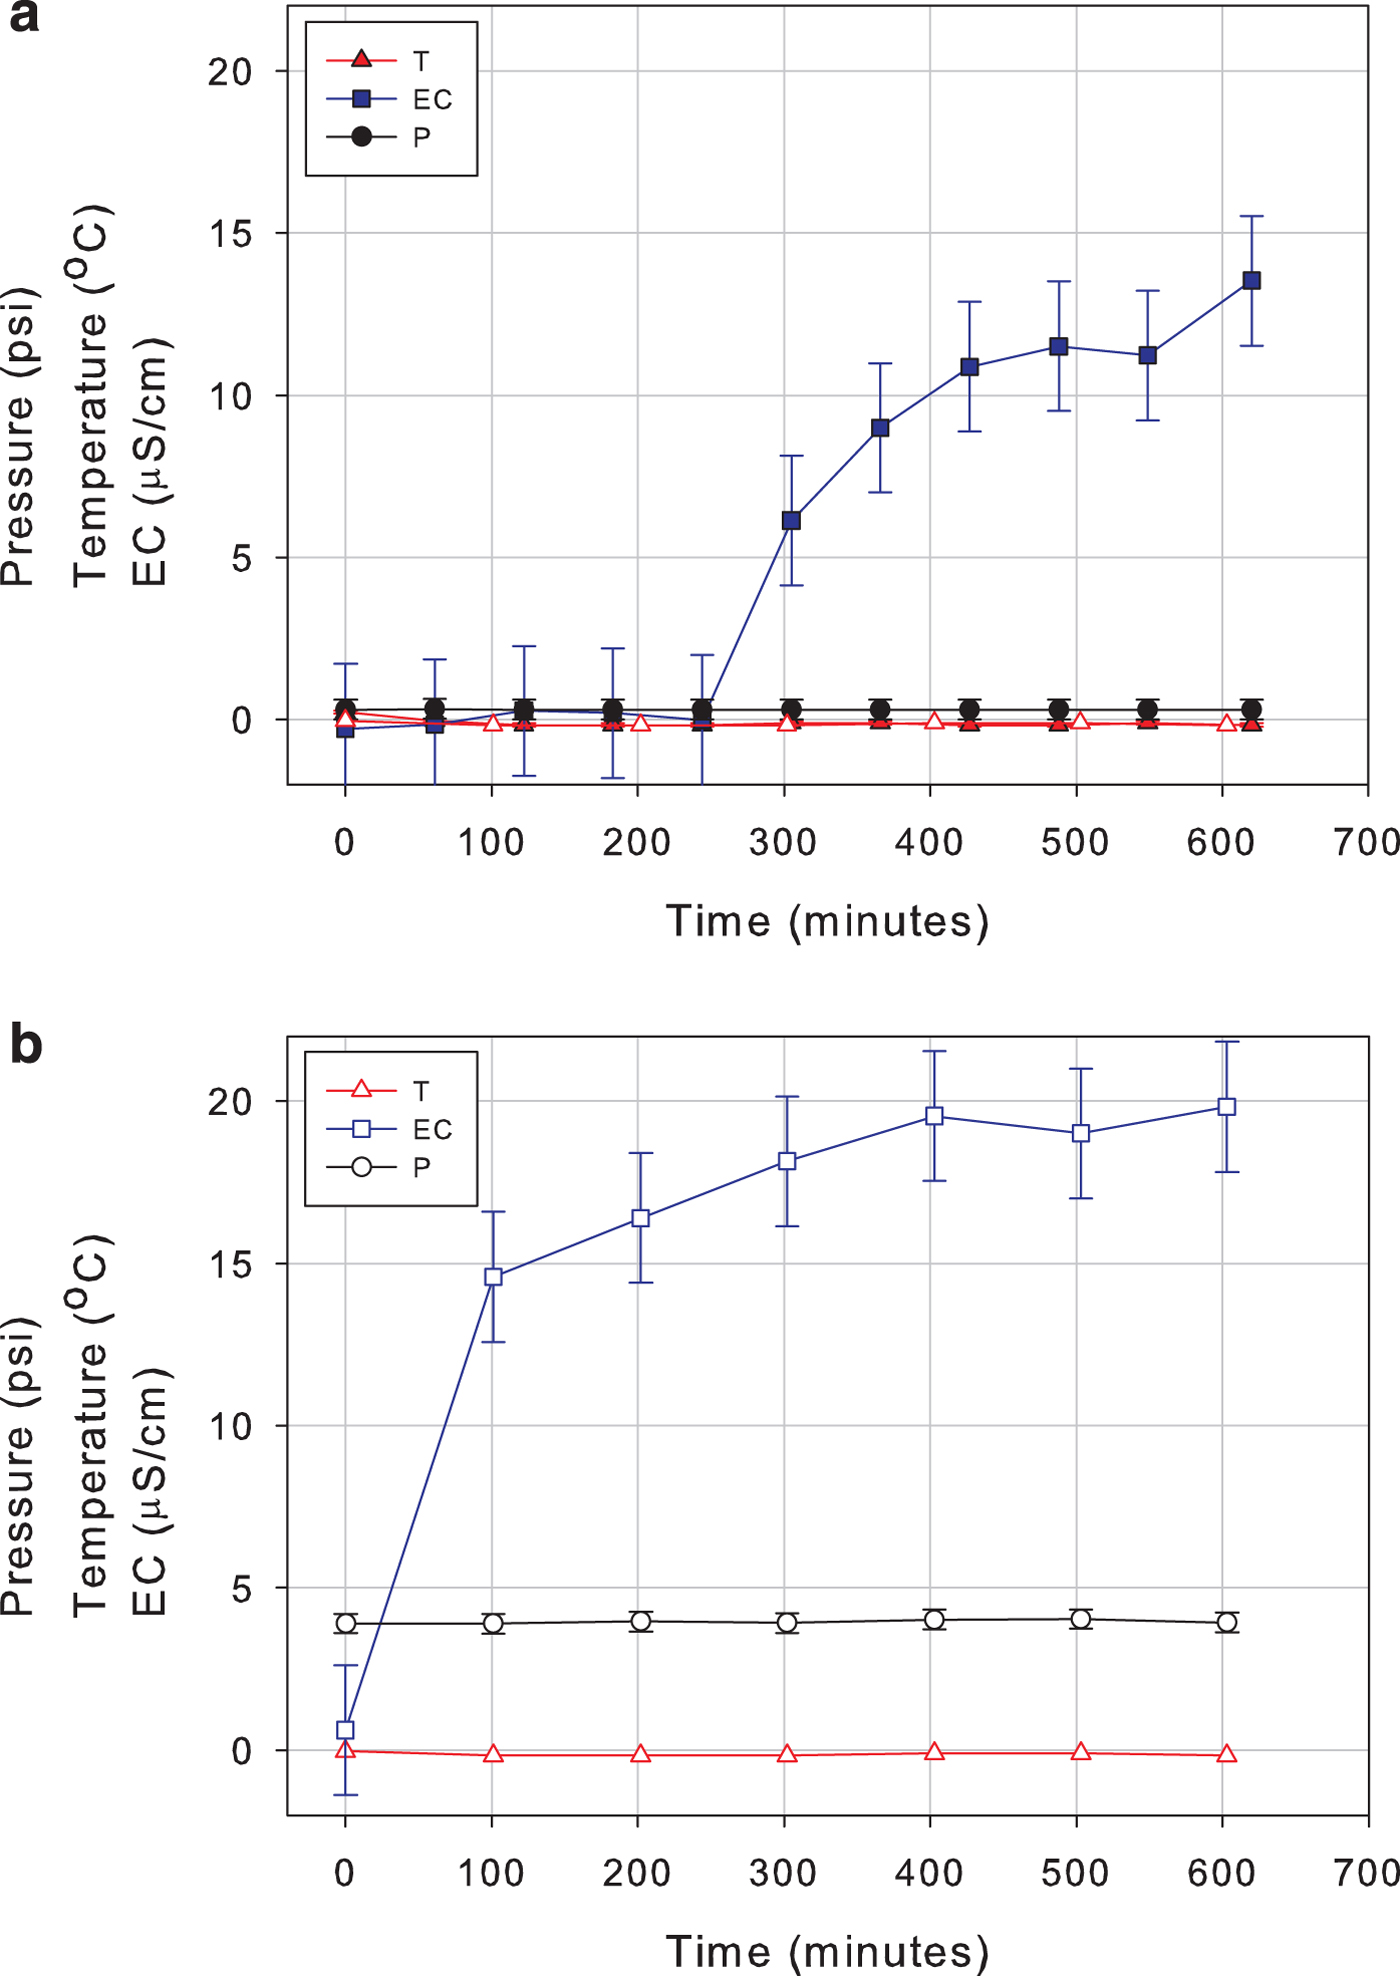
Fig. 3. Temperature, pressure and electrical conductivity transmitted by an ET+ sensor during meltwater percolation experiments. The dots represent hourly averages of the 30 s measurements. In the subsequent second experiment (b), snow was more tightly packed above the sensor and hence pressure readings were slightly elevated. The height of the snow did not change noticeably during the experiments
Range tests
Range tests confirmed that one-way signal attenuation through the firn was much greater (260 dB km−1) than that observed in ice (in the range <40 to 200 dB km−1) (Gogineni and others, Reference Gogineni2001; Oswald and Gogineni, Reference Oswald and Gogineni2008; Lishman and others, Reference Lishman2013; Bagshaw and others, Reference Bagshaw2014; Lewis and others, Reference Lewis2015; MacGregor and others, Reference MacGregor2015). In the 60 m borehole vertical test, good quality signals were received by the ApRES until 50 m (see Fig. 5 and Table 2). The signal transmitted from 60 m was identifiable, but the data could not be extracted without extensive post-processing. Signal quality recorded by the ApRES deteriorated rapidly during the horizontal tests (Table 2) when the sensor was in the 14 m borehole, with few decodable chirps received more than 100 m distant from the top of the borehole. Measurements by the Biotrack Sika, which is optimized for low signal strength operation with −150 dBm minimum detectable signal, showed that the signal remained useable (>−100 dBm) until ~350 m horizontal distance from the top of the borehole. The data could be manually extracted from the signal using the Sika and/or WinRadio, but could not be decoded from the ApRES recordings using our automated extraction protocol. The automatic Python decoding algorithm relies on a complete data chirp, so missing and/or garbled bits mean that the chirp is not correctly identified. Subsequent inspection of missing chirps can reveal non-machine readable characters, which can be manually corrected. During shallow horizontal range tests, when the sensor was buried in 15 cm of snow, the signal again decreased exponentially, until the WinRadio noise floor (−121 dBm) was reached. This occurred between 140 and 160 m from the sensor (Fig. 4, exponential fit R 2 = 0.84, f = −112.6 + 77.94 exp(−0.045×)), corresponding to the attenuation of the order of 260 dBm km−1.

Fig. 4. Received signal strength (RSS) during multidirectional range tests from a sensor buried in shallow (15 cm) firn, using the WinRadio receiver. The different markers represent different radial directions as the receiver was moved away from the sensor, although the exponential fit line is based on all data (r 2 = 0.84), with red lines denoting 95% confidence.
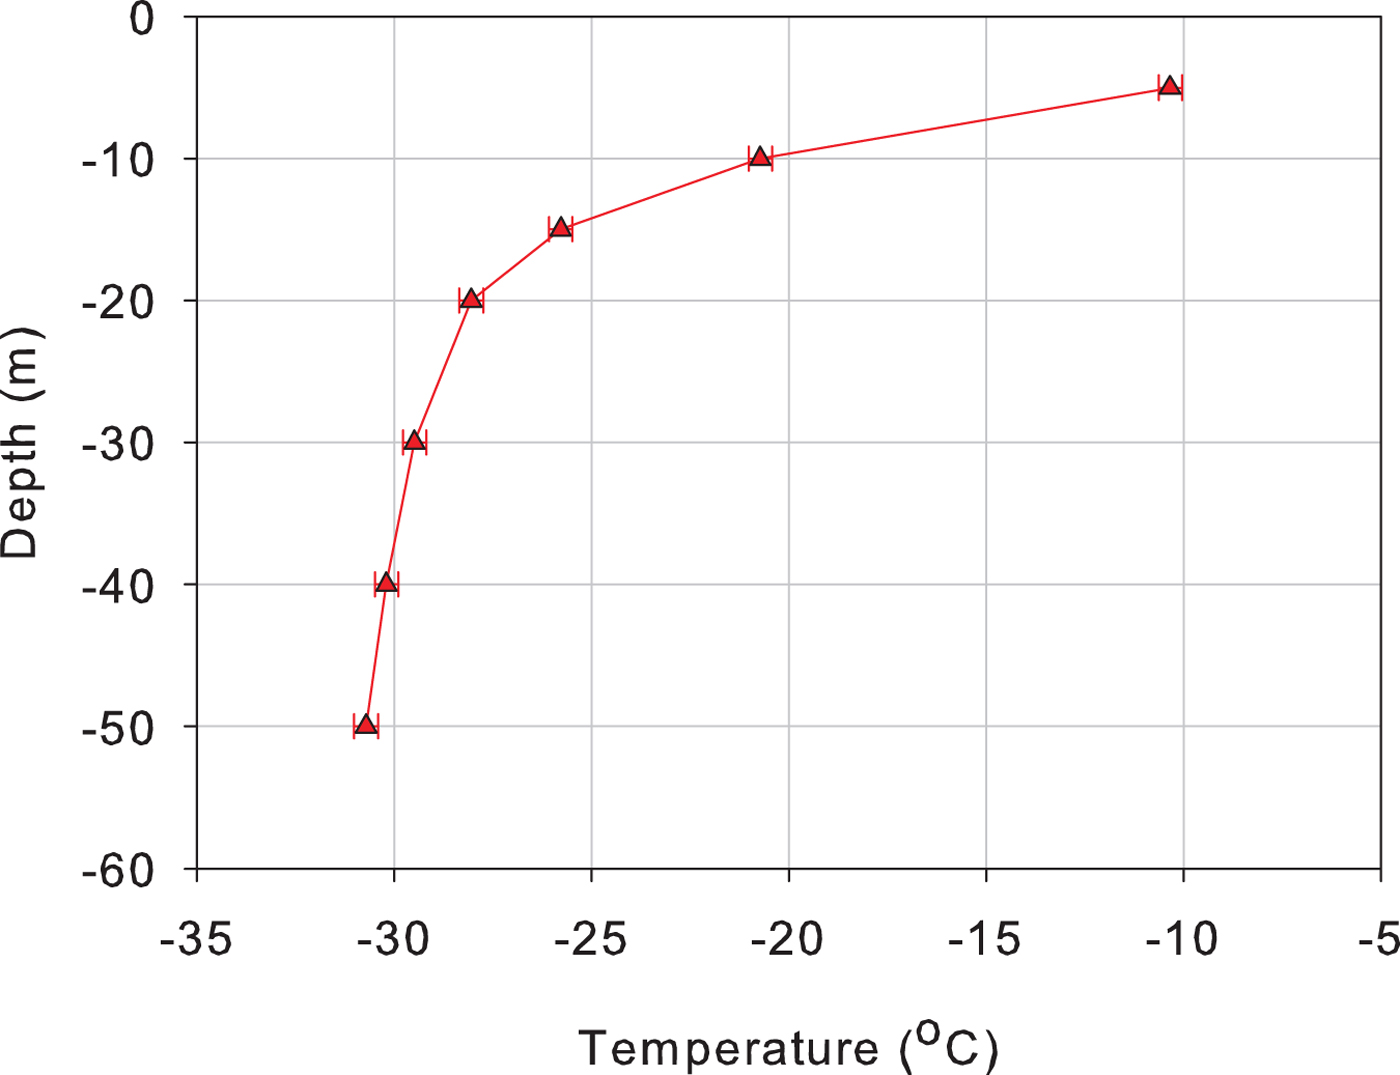
Fig. 5. Temperature transmitted by the ET+, received by the ApRES, during a 60 m borehole log. The sensor remained at each depth for ~5 min, and the plotted temperature is the data point transmitted at the end of this period, after the sensor was allowed to equilibrate.
Table 2. Received signal strength (RSS) measured by the handheld tracking receiver (Sika) and qualitative assessment of signal quality recorded by the ApRES. The Sika signal strength meter is uncalibrated, hence RSS is expressed as a percentage of the maximum signal strength for identical gain settings. The qualitative assessment is based on the ease of data extraction: signals that could be fully decoded by the automated data extraction protocol were deemed ‘good’; those which could be manually decoded were ‘weak’, and the remainder where the signal could not be differentiated from the noise were ‘poor’
Temperature tests
The temperature sensor performed well during the borehole test. Temperature decreased from −10°C at the surface to −31°C at 50 m depth (Fig. 5). At this depth, the temperature should reflect the average annual temperature (e.g. Cuffey and Paterson Reference Cuffey and Paterson2010). Our recorded temperature is in good agreement with 2014–15 measurements by the Greenland Climate Network automatic weather station (see Steffen and others, Reference Steffen, Box and Abdalati1996), which returns an average annual temperature of −29.5°C, and with results from regional climate models that indicate a slightly lower temperature of −32.3°C (Ettema and others, Reference Ettema2009). Our temperature profiling started at 5 m depth and we did not measure the temperature of the seasonal snow layer.
Longer term deployments
Data collected by the sensors during the two longer term (up to 30 d) deployments are shown in Figure 6. The frequency of data collection was higher at the camp site (hourly), in the centre of the ice stream, where data were recorded by the WinRadio, than that recorded by the ApRES at the shear margin (every 2 h). Both sites demonstrated very limited changes in all three parameters measured. The small fluctuations in EC observed at both sites were within the sensor accuracy (±2 µS cm−1). T and P measurements at both sites remained stable throughout the measurement window. There were small fluctuations in T at the ice stream, increasing from −31 to −28°C for single measurements on several days, but the lack of concurrent rise in EC or change in pressure suggests that again, these measurements were erroneous. The gauge pressure recorded by the sensors in the boreholes at both sites remained broadly constant at 1 psi (6.89 kPa), the same as the ETracer installed in the open snow pit. This suggests that the sensors remained in contact with the atmosphere throughout the experiment, and hence the boreholes did not close.
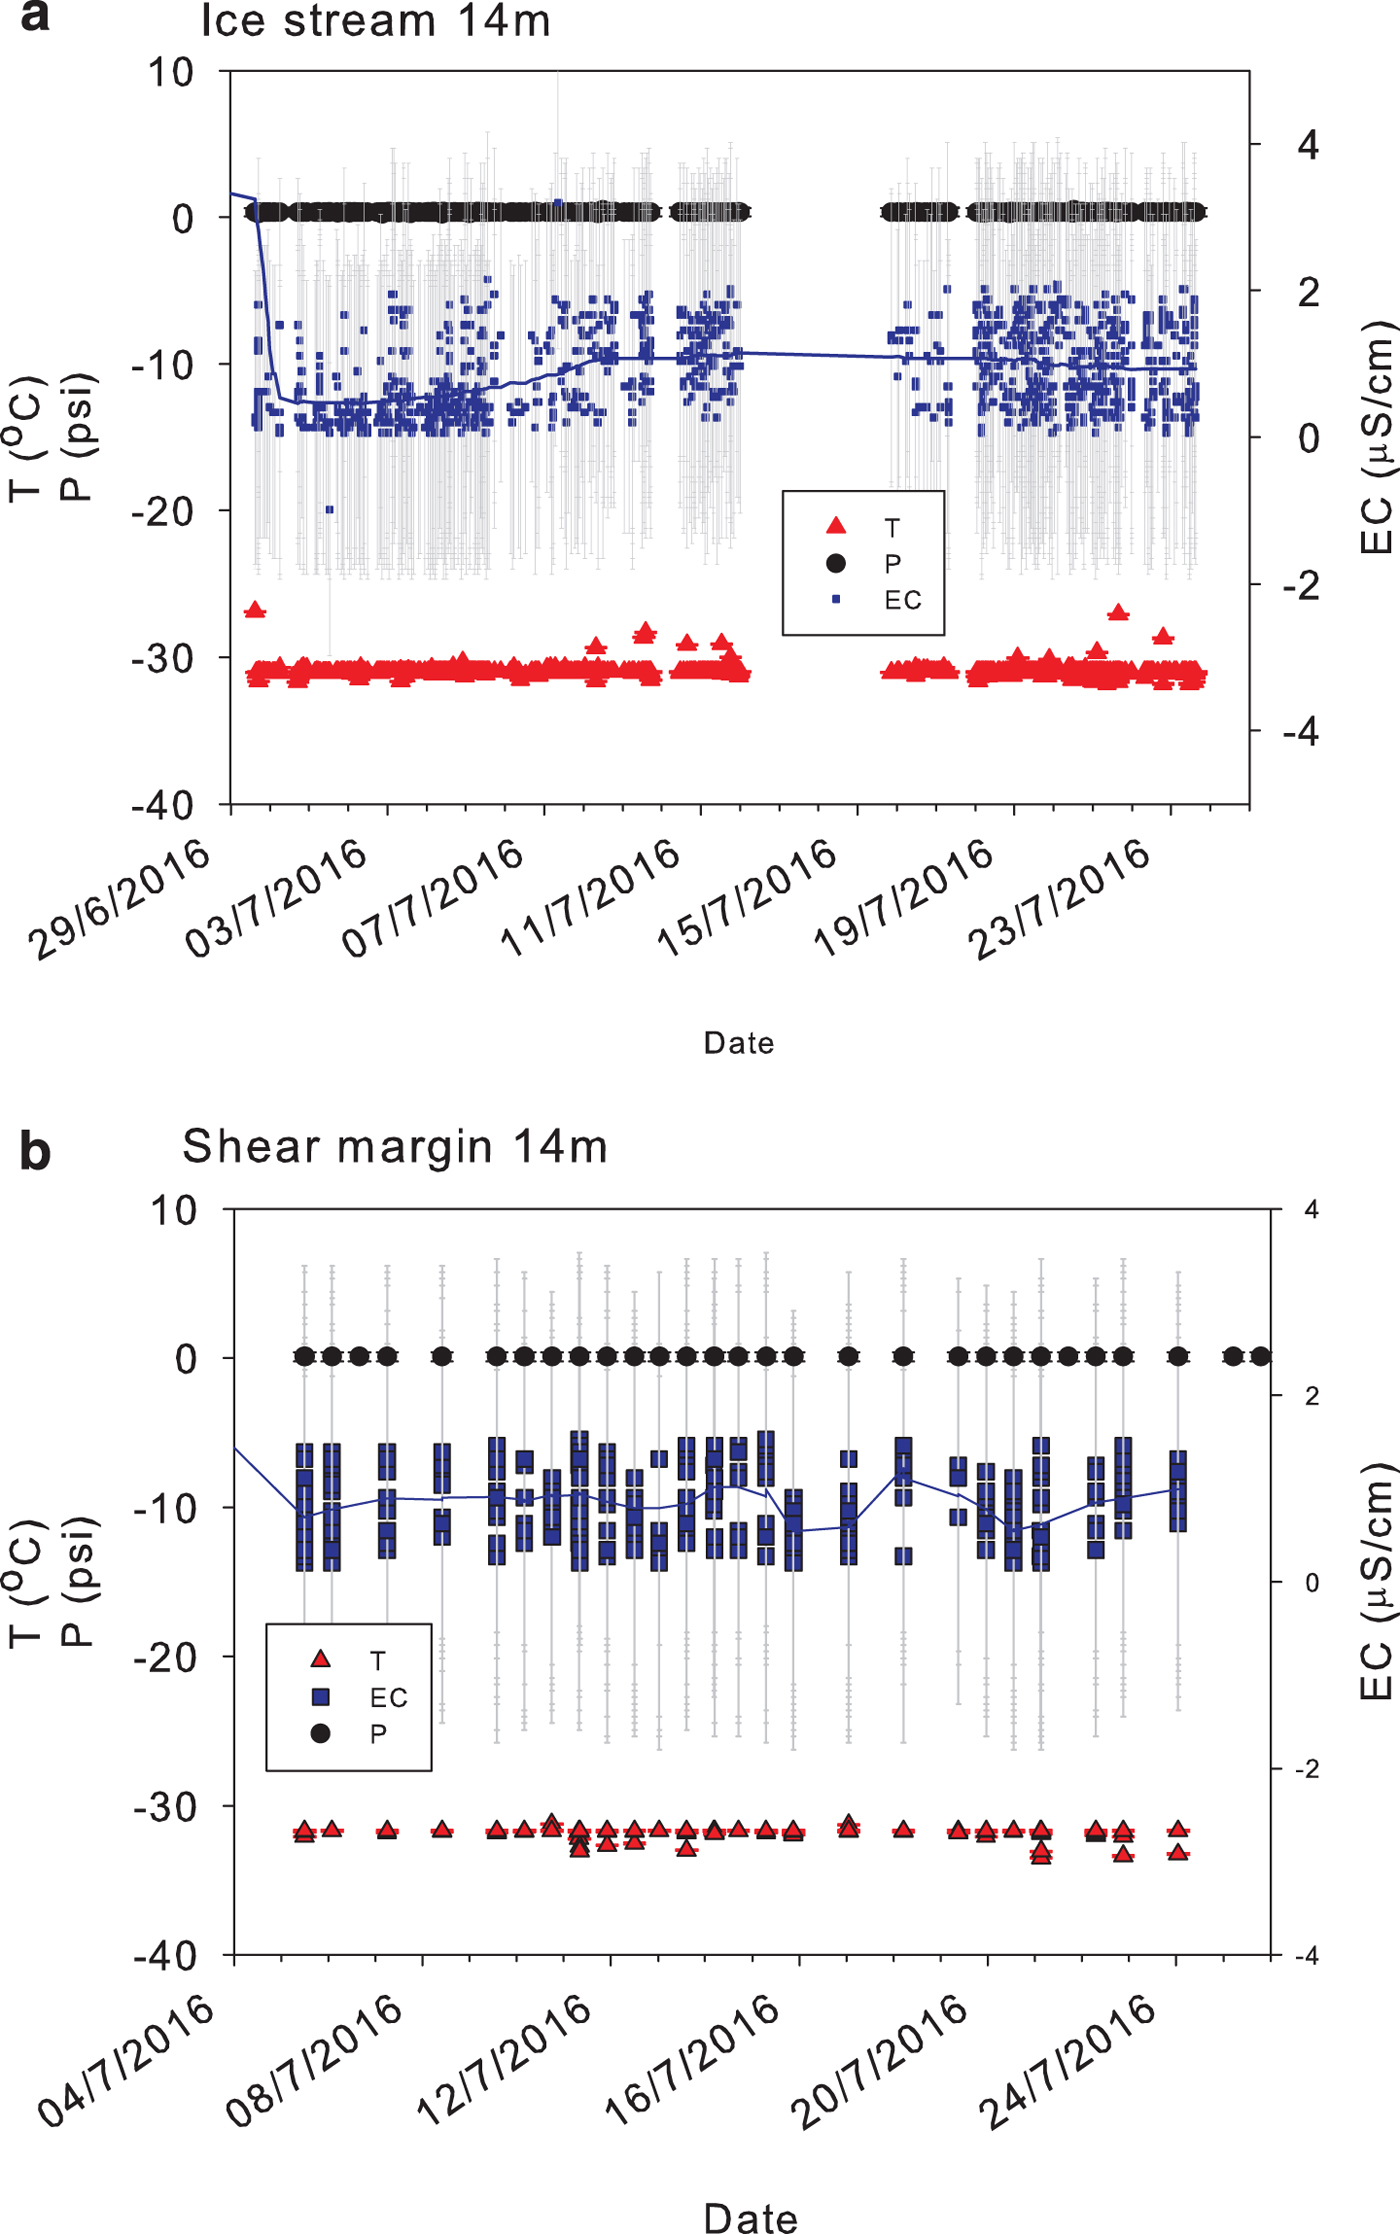
Fig. 6. Electrical conductivity (EC), temperature (T) and pressure (P) data transmitted by ET+ sensors in 12 m-deep boreholes drilled from the bottom of 2 m-deep snowpits, in the centre of the EGRIP ice stream, recorded by WinRadio (a) and at the shear margin, recorded by ApRES (b). Error bars show the precision of each sensor, and the blue line shows the running mean EC. Data gaps are the result of the receiver losing power (a), or because of disruption of the signal path caused by fresh snowfall and/or strong winds disturbing the antenna (b), which reduced the quality of the received signal.
DISCUSSION
Sensing system performance
The ET+ sensors were able to transmit reliably through at least 50 m of firn, and low amplitude signals could be differentiated from noise within transmissions through 150 m (Fig. 4, Table 2). The combination of range tests, both horizontal and vertical (Table 1), showed that the limit of effective transmission through firn at our test sites is of the order of 150 m, which corresponds to one-way attenuation of ~260 dBm km−1 (Fig. 4). This compares with 200 dB km−1 measured through temperate ice at Leverett Glacier, SW Greenland (Bagshaw and others, Reference Bagshaw2014), using the same frequency. We attribute the greater loss through firn to its differing physical properties. In deeper ice, the anisotropic structure of ice and pore spaces has relatively uniform and well-characterized dielectric permittivity (Lewis and others, Reference Lewis2015), but in firn, this structure is in transition, with stronger variations in density and larger, non-uniform pore spaces (Fujita and others, Reference Fujita2014). This distorts the signal path, giving non-uniform attenuation. This can be particularly significant if there is water between any of the grains, or if ice lenses in the signal path cause reflection. The ET+ sensors use 151 MHz, a pragmatic choice with good range, and acceptable limits of attenuation by water and other impurities in the transmission path (and which also has good availability of off-the-shelf, low-cost parts). To reduce attenuation through firn, a lower frequency of transmission could be used (e.g. Smeets and others, Reference Smeets2012) at the expense of larger antenna size. This would be possible for the surface receiver, but the small ET+ package size is optimized for a relatively short helical antenna. In addition, it is useful for the sensor to be able to transmit through a variety of media, since the glacial surface environment is heterogeneous. The use of VHF, in this case 151.6 MHz, therefore represents the best compromise between effective transmission through cold dry ice, firn in the dry snow zone and wet temperate ice or firn.
All the ET+ sensors performed well in tests and in the final deployment. They were able to detect the presence of meltwater within otherwise dry snow (Fig. 3), and to effectively log borehole temperature at a depth of 50 m. They also performed well during the longer deployment, returning data consistently (recorded once per hour/2 h, depending on the receiver) over a 4-week period. Battery voltage was consistent, even at low temperatures (−31°C), and the sensors remained operational throughout (Fig. 6). The small number of erroneous temperature measurements (Fig. 6a) were likely caused by (a) incorrect automatic decoding of the data chirp or (b) poor performance of the temperature-sensing hardware (pt1000) and/or housing. We believe that the sensor housing was the most likely source of the small number of erroneous data, which were identified by their obvious deviation from neighbouring measurements and lack of concurrent change in the other variables. In future iterations of the instrument, the sensor housing will be optimized to ensure there is no interference across the sensor dipole. The bucket tests showed that the sensors provide a viable method for detecting subsurface meltwater in firn, which when combined with temperature measurements, have the potential for detailed, long-term monitoring of melt processes within firn.
The WinRadio was able to decode data from the ET+ more successfully than the ApRES. The WinRadio was specifically tuned so the ET+ frequency was in the centre of the band, whereas the ApRES was repurposed from its primary role in sounding the subsurface (Nicholls and others, Reference Nicholls2015), hence the ET+ frequency lay at the lower edge of the ApRES receiver frequency band. In order to facilitate its use with transmitting sensors such as ET+ (as opposed to the transmit–receive mode for which it is designed), the receiver front-end requires optimisation and the data transmissions should sit closer to the ApRES centre frequency. The ApRES was consequently less sensitive to transmissions from the ET+ than the WinRadio in this configuration: transmissions received were noisier, and our automated decoding software was less able to extract data from the ApRES recordings. The ApRES nevertheless has several advantages over the WinRadio: firstly, it is specifically designed for long-term, low-power operation in extreme cold climates. Previous deployments of the system on many ice shelves both in Antarctica and Greenland demonstrate outstanding reliability and longevity, having collected continuous datasets of up to 4 years long with minimal intervention (Nicholls and others, Reference Nicholls2015). Secondly, there is the potential to combine ET+ measurements with ApRES's radar capability, allowing the simultaneous measurement of subsurface physical properties of ice and firn with radar imaging of internal layering (Nicholls and others, Reference Nicholls2015), to measure, for example, compaction rates. Finally, it is easy to use, and non-specialist operators are able to run and maintain the system. This is in contrast with the WinRadio, which requires a PC with proprietary software to record the received data. Therefore, the ApRES is a desirable alternative to the WinRadio and our tests showed that it was an effective instrument for receiving data from sensors 14 m below the surface (Fig. 6b), but further tuning of the receiver is required to optimize the signal reception.
Glaciological implications
Measuring spatial heterogeneity in firn, without disturbing the surface layer, is crucial for understanding how ice sheets are responding to changing climate (van As and others, Reference van As, Box and Fausto2016). Wireless sensors have the potential to solve this monitoring conundrum (Vilajosana and others, Reference Vilajosana, Llosa, Schaefer, Surinach and Vilajosana2011). Radio transmission through snow and ice has long been used to image features within and beneath the ice (Plewes and Hubbard, Reference Plewes and Hubbard2001), and more recently, to communicate data (Hart and others, Reference Hart2006; Smeets and others, Reference Smeets2012; Bagshaw and others, Reference Bagshaw2014). Attenuation in ice sheets ranges from 40 to 200 dB km−1 (Jacobel and others, Reference Jacobel, Welch, Osterhouse, Pettersson and MacGregor2009; Grimm and others, Reference Grimm, Stillman and MacGregor2015), depending on frequency, ice temperature and structure, although absorption by water molecules and impurities in the ice/snow matrix is the dominant signal extinction factor (Lewis and others, Reference Lewis2015). A pragmatic approach is required in frequency selection for these applications, which takes into account antenna size (both transmitting and receiving), both for portability (receiving) and packaging (transmitting), and the physical properties of the mixed media in the transmission path. Ultra-high frequencies (300 MHz–3 GHz) have been effective for transmission through deep, cold and uniform ice, but the presence of any water in this matrix quickly reduces success (Lishman and others, Reference Lishman2013). Low frequency (30–300 kHz) can be effective (e.g. Mouginot and others, Reference Mouginot, Rignot, Gim, Kirchner and Le Meur2014), but the antenna size can be prohibitively large, and crucially, the data rate is low. Frequency bands HF (3–30 MHz) and VHF (30–300 MHz) have good range through ice, and the wavelength is frequently larger than most englacial water pathways encountered in the majority of percolation areas in polar firn (Smeets and others, Reference Smeets2012).
The greatest potential for this technique is in its use in combination with remote-sensing methods, allowing the combination of high-resolution, in situ measurements with broader scale assessment of physical processes. Upward looking radar can measure accumulation, the lower limit of the penetrating percolation front and layering within the top 5 m (Schmid and others, Reference Schmid2015; Heilig and others, Reference Heilig, Eisen, MacFerrin, Tedesco and Fettweis2018). By combining an upward looking radar and multiple ET+ sensors, firn processes such as compaction may be monitored in high spatial and temporal resolution, and the single-point measurement from the radar directly compared with the spatially distributed sensors. Downward looking radar is used to track the transition of firn to ice and associated densification rates (Lewis and others, Reference Lewis2015), the presence of ice lenses or larger internal melt layers (Machguth and others, Reference Machguth2016), and the continuity (Karlsson and others, Reference Karlsson, Rippin, Bingham and Vaughan2012; Young and others, Reference Young2018) and motion of internal layers (Nicholls and others, Reference Nicholls2015) in 2D. These techniques provide bulk measurements of the entire firnpack, but have insufficient resolution to monitor the progress of percolation fronts and meltwater horizons at the <m scale. The ET+ could be used to detect the progression of vertical percolation, particularly in the very early season when the firn first warms up. The combination of EC and T measurements provides a powerful tool for detecting early melt pulses, particularly if the sensors are left on the snow surface the previous winter and naturally buried by seasonal snowfall. Importantly, the ET+ are comparatively low cost to manufacture (the total costs of the parts is on the order of 60 GBP per sensor), and several sensors can communicate with a single receiver. This allows for the deployment of multiple sensors within the range of one receiver, thus greatly extending the spatial coverage and temporal resolution of a monitoring site.
For deeper snow depths, the data reported here demonstrate that ET+ sensors have the potential to communicate measurements of temperature gradients and percolation of liquid water through the snowpack through 150 m of firn. Combining in situ measurements from the ET+ sensors with radar imaging from, for example, the ApRES would enable the collection of detailed subsurface imagery and concurrent measurements of firn layers. This would give unprecedented insights into the evolution of the firn pack and has the potential to enable detailed, 3D observations of its dynamics. Since the ApRES can be reprogrammed to operate in either imaging (Tx-Rx) and data receiving (Rx) modes, this kind of deployment is already feasible and will be explored in future field seasons. These combined methods represent the most promising solution to tracking the presence of water within firn, validating densification models, and ultimately understanding the evolution of polar ice sheets under a changing climate.
Finally, we note that the sensors were not buried on deployment; instead the holes were left open to the atmosphere. This was done in order to test if the difference in shear stresses at the two sites would result in differing borehole closure rates evidenced through changes in pressure and temperature measurements. However, during the measurement period, the small boreholes did not close. At the NEEM site 450 km northwest of EGRIP, there was a significant structural rearrangement of grains and deformation of internal layers at 21–26 m depth (Fujita and others, Reference Fujita2014), but little change above this depth. As our sensors were well above this zone, firn deformation was likely insufficient during the 4-week experiment to close the boreholes. In order to observe hole closure, the sensors most likely need to be in situ for much longer than 4 weeks, or buried deeper within the firn–ice transition zone (below c. 25 m). Thus, if the sensors are used for investigating shear stress variability, the monitoring period should be extended or the burial depths increased.
CONCLUSIONS
Wireless sensors have the potential to reveal changes in the physical properties of firn without requiring a physical connection to the surface. The ET+ sensors tested here can detect the presence of meltwater within fresh snow, using electrical conductivity sensors in parallel with pressure and temperature sensors. Data were transmitted to the surface up to 150 m through firn. Test deployments in the centre and at the shear margins of a fast flowing ice stream in Greenland showed that the top 12 m firn layer did not deform sufficiently to close 104 mm diameter boreholes in the centre of the ice stream or at the shear margins during our 4-week experiment. The proof-of-concept tests demonstrated good performance of the sensors and reliable reception of data by two receiving systems: a WinRadio and tablet PC, and the ApRES. The WinRadio was specifically tuned to the ET+ frequency (151.6 MHz), hence data reception was clearer than with the broadband ApRES. However, the ApRES is more suited to long-term deployment in challenging polar conditions, so is a better receiver for this application despite the slightly poorer data quality. It also has the potential to combine physical measurements by the wireless sensors with radar imaging of internal layers within ice and firn, in order to build up a 3D picture of the subsurface.
ACKNOWLEDGEMENTS
This work was funded by the Royal Astronomical Society Tomkins Instrument Fund and the Linnean Society Percy Sladen Memorial Fund (to EB and NK), and the Cardiff University International Fund (to EB), with logistics generously supported by the East Greenland Ice Core Project (EGRIP) and AWI. EGRIP is directed and organized by the Center of Ice and Climate at the Niels Bohr Institute, Copenhagen. It is supported by funding agencies and institutions in Denmark (A. P. Møller Foundation, University of Copenhagen), USA (US National Science Foundation, Office of Polar Programs), Germany (Alfred Wegener Institute, Helmholtz Centre for Polar and Marine Research), Japan (National Institute of Polar Research and Artic Challenge for Sustainability), Norway (University of Bergen and Bergen Research Foundation), Switzerland (Swiss National Science Foundation), France (French Polar Institute Paul-Emile Victor, Institute for Geosciences and Environmental research) and China (Chinese Academy of Sciences and Beijing Normal University). We thank Ian Thomas for assistance with the Python decoding algorithm, and Clement Miege and Mike MacFerrin who provided constructive feedback on the paper.


 Open access