 Jian Diao1†
 Ling Ma
- 1Forest Protection, College of Forestry, Northeast Forestry University, Harbin, China
- 2Medicinal Plant, College of Medicine, Heilongjiang University of Chinese Medicine, Harbin, China
Root rot of Populus davidiana × P. alba var. pyramidalis Louche (Pdpap) is caused by Fusarium oxysporum. We used RNA sequencing to study the molecular mechanisms and response pattern of Pdpap infected by F. oxysporum CFCC86068. We cloned the PdpapWRKY28 transcription factor gene and transformed the recombinant vector pBI121-PdpapWRKY28 into Pdpap. The resistance function of PdpapWRKY28 was verified using physiological and biochemical methods. By means of RNA sequencing, we detected 1,403 differentially expressed genes (DEGs) that are common in the different treatments by F. oxysporum. Furthermore, we found that overexpression of the PdpapWRKY28 gene may significantly improve the resistance of Pdpap plants to F. oxysporum. Our research reveals a key role for PdpapWRKY28 in the resistance response of Pdpap to F. oxysporum. Additionally, our results provide a theoretical basis for in-depth research on resistance breeding to combat root rot.
Introduction
Populus davidiana × P. alba var. pyramidalis Louche (Pdpap), as an important greening tree species, has extremely high production and consumption values (Yu and Zhang, 2005; Guo, 2019). Recently, a large-scale outbreak of root rot caused by Fusarium oxysporum has severely hindered the growth and development of Pdpap. Studies have shown that root rot causes radiation-induced disease in plants in a short span of time (Elad and Pertot, 2014). Its pathogenic mechanism has three main approaches: blocking plant ducts (King et al., 2011), secreting toxic substances (Wang et al., 2000; Bani et al., 2014), and expressing pathogenic genes (Ma et al., 2013; Schmidt et al., 2013). Presently, the prevention and control of root rot mostly rely on physical or chemical methods (Duan et al., 2010; Zhang et al., 2012; Tu et al., 2014; Pei et al., 2016). However, pesticide use and physical defenses have limited effects on root rot control and treatment. Therefore, we considered directly studying Pdpap and exploring their responses to F. oxysporum. Finally, in the event of finding or inducing favorable outcomes, we made sure that disease-resistant breeding should be realizable.
Few studies on the response mechanism of Pdpap to F. oxysporum have been conducted, but the functional exploration of plant genes responding to pathogens has been extensive. Studies have shown that the response of Pdpap to a wide range of pathogens was regulated by multiple proteins; among them, transcription factors were closely related to the stress response of the plant (Sakuma et al., 2002). The process by which transcription factors enhance the ability of a plant to resist stress is mainly by increasing the expression level of transcription factors (Ali et al., 2013), which can further regulate the expression of functional downstream genes (Stein et al., 2001; Hou et al., 2009). The WRKY transcription factor was the first transcriptional regulatory factor found in plants (Rushton et al., 2010). It has been isolated from multiple species and was found to play an important regulatory role in plant signal transduction and response to biotic and abiotic stresses (Wei et al., 2012). Studies showed that PtWRKY28 belongs to the subgroup IIb of WRKY proteins (He et al., 2015; Imran et al., 2019) and participates in the regulatory process of plant resistance to pathogens (He et al., 2015). For example, AtWRKY28 is involved in the resistance response of Arabidopsis to the necrotrophic pathogens Botrytis cinerea (Wu et al., 2011) and Sclerotinia sclerotiorum and oxalic acid. Babitha et al. (2013) reported that co-expression of AtWRKY28 and AtbHLH17 in Arabidopsis conferred resistance to abiotic stress such as that produced by sodium chloride (NaCl), polyethylene glycol, and methyl viologen. Chujo et al. (2013) reported that OsWRKY28 overexpression negatively regulated the innate immune responses of rice against rice blast fungus, resulting in reduced resistance. Wang et al. (2020) reported that overexpression of SlWRKY28 could improve the tolerance of P. davidiana × P. bolleana to alkaline salt stress.
In this study, we performed RNA sequencing in wild type (WT) Pdpap and Pdpap treated with F. oxysporum CFCC86068. The results of the RNA sequencing indicated that PdpapWRKY28 may play an important role in the response of Pdpap to F. oxysporum. We cloned the 977 bp cDNA fragment of the PdpapWRKY28 gene from Pdpap. We constructed the recombinant vector pBI121-PdpapWRKY28 for the overexpression of PdpapWRKY28 under the control of the cauliflower mosaic virus (CaMV) 35S promoter. The transcription factor and its promotor were successfully transformed into Pdpap. In addition, evidence based on the analysis of molecular, morphological, and physiological data showed that the PdpapWRKY28-overexpression transformants enhanced resistance to F. oxysporum CFCC86068. The results showed that PdpapWRKY28 had a positive response to root rot, which strongly suggests that PdpapWRKY28 could be used as an effective target for breeding resistance to root rot.
Materials and Methods
Sample Preparation
The WT Pdpap used in this experiment was provided by the Forest Protection Department of the Forestry College of Northeast Forestry University (Harbin, Heilongjiang, China). WT Pdpap seedlings were cultured on 0.5X Murashige and Skoog (MS) medium supplemented with 0.01 mg/ml of 1-naphthaleneacetic acid (NAA). For stable gene transformation, leaves from 1-month-old Pdpap were transferred to a differentiation medium that contained 0.5 mg/ml of 6-benzylaminopurine, 0.1 mg/ml of NAA, and 0.02 mg/ml of Thidiazuron. Tissue-cultured Pdpap was grown in a plant tissue culture room. In order to simulate Pdpap growth under natural conditions, plants at the same growth stage were selected, transplanted into artificial soil, and cultivated in an artificial climate room at a temperature of 22 ± 2°C with a light intensity of 400 lx/m2/s, a photoperiod of 16 h of light and 8 h of dark, and a relative humidity of 65–75% (Lu et al., 2011).
Fusarium oxysporum CFCC86068 was obtained from the China Forestry Culture Collection Center (Beijing, China). The preactivated F. oxysporum was transferred to a potato dextrose agar (PDA) medium and cultured in the dark for 7 days. We used a 9-mm-diameter cork borer to punch holes at the edge of the hyphae and then transferred the punched-out disks into a new PDA medium. After culturing in the incubator at 28°C for 14 days, the spores were washed five times with sterile water. After washing, spores were filtered through eight layers of gauze and collected into a 50-ml centrifuge tube. Spore density calculated using a hemocytometer was about 1 × 10⁵/ml. The spore-bearing medium was then sealed and stored at room temperature for later use. Spores were recultured each day at a sterile workbench.
Two-month-old WT Pdpap plants at the same growth stage were selected. Fifty milliliters of F. oxysporum at a spore density of 1 × 10⁵/ml was poured onto Pdpap roots (Kang et al., 2018). Infection times were 0, 6, 12, 24, or 48 h. The WT Pdpap plants treated with 50 ml of ddH2O were used as control. Every treatment consisted of duplicated samples. Afterward, all samples were immediately transferred to liquid nitrogen for RNA sequencing analysis.
RNA Sequencing
The RNAprep Pure Plant Plus Kit (Tiangen, Beijing, China) protocol was used to extract the total RNA of 20 samples. Three micrograms of RNA per sample were used as input for RNA sample preparation. Sequencing libraries were generated using the NEBNext® UltraTM RNA Library Prep Kit for Illumina (NEB, Beijing, China) following the recommendations of the manufacturer. Library quality was assessed on an Agilent Bioanalyzer 2100 system (Agilent, Santa Clara, CA, USA). After quality inspection, the libraries were pooled according to effective concentration and quantity (Ihle et al., 2014). The library preparations were sequenced on the Illumina HiSeqTM 2500 (Illumina, San Diego, CA, USA) and 125 bp/150 bp paired-end reads were generated. RNA extraction, RNA-seq library construction, and sequencing were performed by Novogene (Beijing, China). The clean reads can be found in the National Center for Biotechnology Information (NCBI) Sequence Read Archive (SRA) repository (https://submit.ncbi.nlm.nih.gov/subs/sra/), and the accession number is PRJNA741264.
Sequencing Data Analysis
Raw data (raw reads) in the FASTQ format were first processed through in-house Perl scripts (Andrews, 2010). In this step, clean data (clean reads) were obtained by removing reads containing adapters, poly-N sequences, and low-quality reads from the raw data. The Q20, Q30, and guanine-cytosine (GC) content of the clean data were calculated. All downstream analyses were based on the clean data. Reference genome and gene model annotation files were downloaded directly from the genome website (https://www.ncbi.nlm.nih.gov/genome/?term=populus$+$trichocarpa). The index of the reference genome was built using Hisat2 (v2.0.5) (Kim et al., 2015) and paired-end clean reads were aligned to the reference genome using the same software. The mapped reads of each sample were assembled using StringTie (v1.3.3b) (Pertea et al., 2015) in a reference-based approach. StringTie uses a novel network flow algorithm and an optional de novo assembly step to assemble and quantitate full-length transcripts representing multiple splice variants for each gene locus. FeatureCounts (v1.5.0-p3) (Liao et al., 2014) was used to count the number of reads mapped to each gene. Then, the fragments per kilobase million (FPKM) for each gene was calculated based on the length of the gene and the read count mapped to the gene. The FPKM refers to the expected number of fragments per kilobase of transcript sequenced (length) per million base pairs sequenced (depth). Differential expression analysis of the two conditions/groups (two biological replicates per condition) was performed using the DESeq2 R package (1.16.1) (Love et al., 2014). DESeq2 provides statistical routines for determining differential expression in digital gene expression data using a model based on the negative binomial distribution. The resulting P-values were adjusted using the approach by Benjamini and Hochberg for controlling the false discovery rate (Madar and Batista, 2016). The genes with an adjusted P-value < 0.05 found by DESeq2 were considered to be differentially expressed. Gene ontology (GO) (Young et al., 2010) enrichment analysis of DEGs was implemented using the cluster profileR R package, in which gene length bias was corrected. The GO terms with corrected P-values < 0.05 were considered significantly enriched. The transcription factor analysis of DEGs was extracted directly from the Plant Transcription Factor Database (PlantTFDB) (https://ngdc.cncb.ac.cn/databasecommons/database/id/307) (Jin et al., 2014).
Validation of DEGs by qRT-PCR
Expression of DEGs obtained through transcriptome sequencing was verified by quantitative real-time PCR (qRT-PCR). Total RNA was extracted from Pdpap according to the method described above. cDNA was synthesized using the PrimeScriptTM RT reagent Kit with gDNA Eraser (Takara, Dalian, Liaoning, China). The procedures used were described in the instructions for the kits. We randomly selected five upregulated and five downregulated DEGs, for which the cDNA molecules were used as templates and verified by qRT-PCR (Xu et al., 2021; Yang et al., 2021). Their specific primers were designed using Primer 5.0 (Supplementary Table 1) (Zhai et al., 2008). Pdpapactin and PdpapEF1-α were used as internal control genes (Supplementary Table 1) (Jiang, 2017). Quantitative RT-PCR was performed on a Stratagene Mx3000P real-time PCR system (Agilent Technologies, Santa Clara, CA, USA) using the 2 × SYBR Green qPCR Master Mix kit (Bimake, Shanghai, China) according to the instructions of the manufacturer. The amplification curve was generated after analyzing the raw data. The cycle threshold (Ct) value was calculated based on a fluorescence threshold of 0.01 (Wang et al., 2012). The reaction systems of qRT-PCR are shown in Supplementary Table 2. The qRT-PCR amplification conditions were as follows: an initial denaturation step at 94°C for 30 s followed by 44 cycles at 94°C for 12 s, 58°C for 30 s, 72°C for 45 s, and 79°C for 1 s. The reaction specificity was determined by performing a melting-curve analysis from 55 to 99°C, with fluorescence readings taken for 1 s for every 0.5°C rise in temperature. The relative expression level of target genes was calculated by 2−ΔΔCt (Livak and Schmittgen, 2001), defined as ΔΔCt = (Ct−target – Ct−control)2 – (Ct−target – Ct−control)1. Three duplicates were made for each gene. After determining the relative expression levels of these genes, the results were compared with their FPKM value from the transcriptome.
Screening of Genes Related to Disease Resistance and the Analysis of Expression Patterns
Based on the transcriptome, DEGs were screened according to the threshold of log2FoldChange > 3 and P adj < 0.05. According to the annotations of gene function, genes whose expression levels increased upon infection with F. oxysporum were selected as candidate genes for study.
To clarify the role of the candidate genes in the process of Pdpap responding to pathogen infection, we analyzed the expression patterns of the candidate genes after infecting Pdpap with F. oxysporum according to the method described above. The primer sequences of the candidate genes are shown in Supplementary Table 3.
RNA Extraction and cDNA Transformation
We took 0.1 g of young leaves from WT Pdpap plants and used a TaKaRa MiniBEST Plant RNA Extraction kit (Takara Bio, Kusatsu, Shiga, Japan) to extract their total RNA. We synthesized the cDNA using the PrimeScript RT reagent Kit with gDNA Eraser (Takara Bio, Kusatsu, Shiga, Japan). The procedures adopted were described in the instructions provided with the kits.
Evolutionary Analysis of the PdpapWRKY28 Gene
In order to better understand the evolution of the PdpapWRKY28 gene, 31 protein sequences thought to be closely genetically related to the PdpapWRKY28 gene were obtained from the NCBI website (https://www.ncbi.nlm.nih.gov/) (Stoesser et al., 2014). Using the MEGA 5.1 software (Tamura et al., 2011), a phylogenetic tree was constructed using neighbor joining (NJ) clustering. When constructing the phylogenetic tree, the relevant parameters were set as follows: The construction of the NJ method used 1,000 iterations of bootstrap resampling using the Poisson model (Poisson bootstrapping). To further verify the evolutionary relationship between the proteins, we used the software program MEGA5 and the JTT (protein mutation data matrix) + F (mutation frequency data) + G (site-specific variations in mutation rate) model of evolution to build a maximum likelihood (ML) phylogenetic tree using the same sequence data.
Differential Tissue Expression of the PdpapWRKY28 Gene
To determine the spatial expression profiles of the PdpapWRKY28 gene, we sampled six tissue types: roots, stems, leaves, and the upper, middle, and lower parts of stems. RNA was extracted from the tissues (each about 5 cm in length) of the 6-month-old WT Pdpap plants. The recovered RNA was subjected to reverse transcription to obtain cDNA. The expression of the PdpapWRKY28 gene in each sample was analyzed by qRT-PCR. The qRT-PCR amplification conditions were as described above. The primer sequences used to amplify PdpapWRKY28 are shown in Supplementary Table 3.
Cloning of and Vector Construction for the PdpapWRKY28 Gene
We used PCR to clone the PdpapWRKY28 gene using the primer sequences listed in Supplementary Table 4. The components of the PCR amplifications are shown in Supplementary Table 5. The amplification procedure for PCR was as follows: 94°C for 3 min followed by 30 cycles of 94°C for 30 s, 58°C for 30 s, and 72°C for 1.5 min, followed by a final extension step of 72°C for 20 min.
The resultant DNA fragments and the pBI121 overexpression vector were digested with restriction endonucleases SpeI and XmaI. Then, the PdpapWRKY28 gene was inserted into pBI121 along with the CaMV 35S promoter. The pBI121-PdpapWRKY28 recombinant vector was transferred to Agrobacterium tumefaciens GV3101 by heat shock transformation (Holsters et al., 1978). A. tumefaciens-mediated transformation was used to introduce PdpapWRKY28 into the Pdpap genome (Guo et al., 2018).
Generating Putative Transformant PdPap
In this study, putative transformant Pdpap lines were obtained using the leaf disc method (Julia et al., 2017). After cutting the youngest leaves of 2-month-old Pdpap plants, leaf discs about 1 cm in diameter were co-cultured with the Agrobacterium strain harboring the pBI121-PdpapWRKY28 recombinant vector. Leaf discs were transferred onto an MS differentiation medium containing 50 mg/L of kanamycin and 200 mg/L of cephalosporin for shoot regeneration. The kanamycin-resistant shoots obtained were rooted on a 0.5X MS medium containing 50 mg/L of kanamycin. After selection by kanamycin, the putative transformants were used for subsequent analysis.
Molecular Detection of Transformant PdPap
The Super Plant Genomic DNA Kit (Polysacchardes and Polyphenolics-rich) (Tiangen, Beijing, China) was used to extract genomic DNA from the PdpapWRKY28-overexpression putative transformant Pdpap lines. Then, PCR detection was performed on the DNA extracted from the putative transformed plants. We used the pBI121-PdpapWRKY28 plasmid as the positive control and WT Pdpap plants and water as the negative control. For molecular detection of recombinant vectors, we used the primer pairs pBI121-F in the pBI121 vector/PdpapWRKY28-R in the gene sequence and PdpapWRKY28-F in the gene sequence/pBI121-R in the vector. The primer sequences are shown in Supplementary Table 4. The PCR amplification conditions were as described above.
Analysis of PdpapWRKY28 Expression Pattern in Transformants
After 2 months of growth, the transformed PdpapWRKY28-overexpression shoots grown in soil were treated with 50 ml F. oxysporum (1 × 10⁵/ml) by perfusion into the root. The infection time was 0, 6, 12, 24, or 48 h, and each experimental group had three biological replicates. The entirety of the transformants were frozen in liquid nitrogen and the total RNA of the plants was extracted and reverse transcribed to obtain cDNA. The expression level of the PdpapWRKY28 gene was determined by qRT-PCR, by, respectively, using WT and transformant cDNA as the template under different pathogen treatment conditions. The primer sequences are shown in Supplementary Table 3. The amplification conditions of qRT-PCR were as described above.
Growth and Physiological Index Measurements
Two-month-old WT and PdpapWRKY28-overexpression putative transformant Pdpap of similar growth statuses were inoculated with F. oxysporum for 0, 5, 10, 15, and 20 days as described above. The value of the fresh weight and root length of the WT Pdpap at 0 d was set to 1. The disease status of each plant infected by F. oxysporum was observed and the relative fresh weight and root length of the plants were measured. The experiment consisted of three biological replicates.
Two-month-old putative transformants and WT Pdpap of similar growth statuses were inoculated with F. oxysporum and sampled at 0, 6, 12, 24, and 48 h. The inoculated plants were immediately frozen with liquid nitrogen after sampling. According to the experimental methods of Cheng (Cheng et al., 2020), the samples were used for the determination of various physiological indicators, including peroxidase (POD) activity, catalase (CAT) activity (Góth, 1991), hydrogen peroxide (H2O2) content, malondialdehyde (MDA) content, and percentage of electrolyte leakage (Nguyen et al., 2016). The experiment consisted of three biological replicates.
Antioxidant Capability Test
Nitro blue tetrazolium and 3,3′-diaminobenzidine staining were used to conduct the histochemical detection of H2O2 and in Pdpap plant tissues (Kumar et al., 2013). Using nitro blue tetrazolium (NBT) can produce insoluble blue products catalyzed by alkaline phosphatase as alkaline phosphatase substrates (Khokon et al., 2011). Darker blue staining indicates that the cells are more damaged by reactive oxygen species (ROS), which means that the antioxidant capacity of the plant cells is relatively lower. On the other hand, 3,3′-diaminobenzidine (DAB) can be dehydrogenated and oxidized to produce a brownish substance through the catalysis of POD (Khokon et al., 2011). In order to assess the damage of F. oxysporum infection to the leaves of Pdpap by ROS, the third to sixth leaves of Pdpap were sampled at 3 days after infection and immediately stained with NBT and DAB according to the experimental methods of Zhou et al. (2020) and Cheng et al. (2020).
Expression Level of Defense-Associated Genes in PdPap
As described above, PdPap was treated with F. oxysporum for 0, 6, 12, 24, and 48 h. We selected two defense-associated genes in salicylic acid (SA) signal transduction pathways and four defense-associated genes in jasmonic acid (JA) signal transduction pathways to perform the qRT-PCR analysis (Huang et al., 2015; Guo et al., 2021). Each experimental group had three biological replicates. The primer sequences are listed in Supplementary Table 6. The amplification conditions of the conducted qRT-PCR were as described above.
Statistical Analysis
The data were analyzed with the Statistical Software Package for Social Science (SPSS) version 17.0 (Bala, 2016). Using the Student's t-test to compare the data, P < 0.05 was considered significantly different (Choi et al., 2012). In the figures displayed throughout this study, significant differences (P < 0.05) are indicated by different lowercase letters.
Results
RNA Sequencing and General Transcription Patterns
Our original data after RNA sequencing contained a few reads with sequencing adapters or low-quality reads. After filtering our sequenced data, 963,059,208 high-quality clean reads were obtained from the 20 samples (Supplementary Table 7). Reads were converted to FPKM. Results of the cluster analysis on duplicated samples in groups and between treatments showed different levels among all samples. The proportion of total reads mapped to the reference genome ranged from 69.28 to 72.55%. Correlation values of duplicated samples within groups were significantly higher than those between treatments (Supplementary Figure 1).
Differential Expression of PdPap Genes in Response to Infection With F. oxysporum
Differentially expressed genes were identified by comparing F. oxysporum-treated WT Pdpap with uninfected WT Pdpap at every time (Supplementary Figure 2; Supplementary Table 8). At 6 h after inoculation with F. oxysporum, 7,823 differentially expressed genes (DEGs) were associated with the infected plants, namely, 4,431 upregulated and 3,392 downregulated genes. At 12 h after inoculation with F. oxysporum, 7,651 DEGs were associated with the infected plants, namely, 4,534 upregulated and 3,177 downregulated genes. At 24 h after inoculation with F. oxysporum, 4,055 DEGs were associated with the infected plants, namely, 2,648 upregulated and 1,407 downregulated genes. At 48 h after inoculation with F. oxysporum, 3,346 DEGs were associated with the infected plants, namely, 2,292 upregulated and 1,054 downregulated genes. The total number of DEGs between infected and uninfected plants was 11,351 across all tested time points (Figure 1). One thousand four hundred three DEGs were common in the four treatment groups (i.e., hours 6, 12, 24, and 48), accounting for 12.36% of the total DEGs. Of the remaining DEGs, 1,956 were uniquely expressed at 6 h (17.23% of the total DEGs); 1,391 DEGs were uniquely expressed at 12 h (12.25% of the total DEGs); 404 DEGs were uniquely expressed at 24 h (3.56% of the total DEGs); 778 DEGs were uniquely expressed at 48 h (6.85% of total the DEGs). The gene expression patterns of the duplicated samples were similar for each time point (the “groups”) but significantly different between them (the “treatments”) (Supplementary Figure 3).
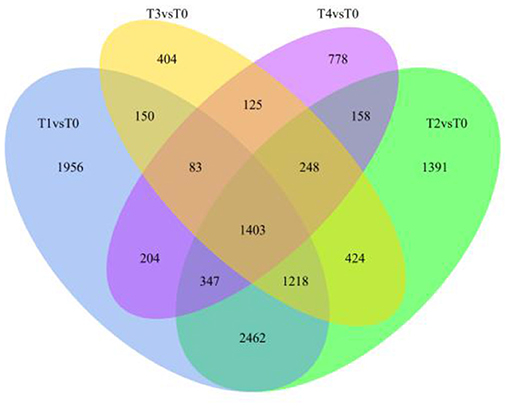
Figure 1. Differential gene Venn map. The sum of the numbers in the Venn diagram represents the total number of differentially expressed genes (DEGs). The overlapping indicates the number of DEGs common in the combinations. T0, T1, T2, T3, and T4 stand for the Fusarium oxysporum-treated Pdpap by 0, 6, 12, 24, and 48 h, respectively. The numbers 1, 2, 3, and 4 after the treatment name stands for four biological repetitions of the same treatment operation.
Gene Ontology Enrichment Analysis
After infection by F. oxysporum for 6 h, GO enrichment analysis revealed that the DEGs associated with GO biological processes were mainly distributed within the following GO terms: the cellular amide metabolic process (232 of the DEGs), the peptide metabolic process (228 of the DEGs), the amide biosynthetic process (225 of the DEGs), the translation process (222 of the DEGs), and the peptide biosynthetic process (222 of the DEGs). The DEGs associated with GO cellular components were mainly distributed within the following GO terms: the non-membrane-bounded organelle (211 of the DEGs), the intracellular non-membrane-bounded organelle (211 of the DEGs), the ribonucleoprotein complex (193 of the DEGs), the intracellular ribonucleoprotein complex (193 of the DEGs), and the ribosome (182 of the DEGs). Finally, the DEGs associated with GO molecular functions were distributed within the following GO terms: structural molecule activity (194 of the DEGs), the structural constituent of ribosome (186 of the DEGs), and cofactor binding (164 of the DEGs) (Figure 2A). After infection by F. oxysporum for 12 h, the DEGs associated with GO biological processes were mainly distributed within the following GO terms: the cellular amide metabolic process (201 of the DEGs), the peptide metabolic process (199 of the DEGs), the amide biosynthetic process (197 of the DEGs), the translation process (195 of the DEGs), and the peptide biosynthetic process (195 of the DEGs). The DEGs associated with GO cellular components were mainly distributed within the following GO terms: the intracellular non-membrane-bounded organelle (194 of the DEGs), the non-membrane-bounded organelle (194 of the DEGs), the ribonucleoprotein complex (178 of the DEGs), the intracellular ribonucleoprotein complex (178 of the DEGs), and the ribosome (166 of the DEGs). Finally, the DEGs associated with GO molecular functions were distributed within the following GO terms: structural molecule activity (177 of the DEGs) and the structural constituent of ribosome (169 of the DEGs) (Figure 2B). After infection by F. oxysporum for 24 h, the DEGs associated with GO biological processes were mainly distributed within the following GO term: the response to oxidative stress process (47 of the DEGs). The DEGs associated with GO cellular components were mainly distributed within the following GO terms: the intracellular non-membrane-bounded organelle (91 of the DEGs), the non-membrane-bounded organelle (91 of the DEGs), the ribonucleoprotein complex (81 of the DEGs), the intracellular ribonucleoprotein complex (81 of the DEGs), and the ribosome (77 of the DEGs). Finally, the DEGs associated with GO molecular functions were distributed within the following GO terms: heme binding (106 of the DEGs) and tetrapyrrole binding (106 of the DEGs) (Figure 2C). After infection by F. oxysporum for 48 h, the DEGs associated with GO biological processes were mainly distributed within the following GO terms: response to the stress process (85 of the DEGs), the cellular carbohydrate metabolic process (42 of the DEGs), and response to the oxidative stress process (38 of the DEGs). The DEGs associated with GO cellular components were mainly distributed within the following GO terms: the cell periphery (33 of the DEGs), the cell wall (27 of D the Egs), and the external encapsulating structure (27 of the DEGs). Finally, the DEGs associated with GO molecular functions were distributed within the following GO terms: transferase activity and transferring glycosyl groups (92 of the DEGs), cofactor binding (91 of the DEGs), heme binding (83 of DEGs), and tetrapyrrole binding (83 of the DEGs) (Figure 2D).
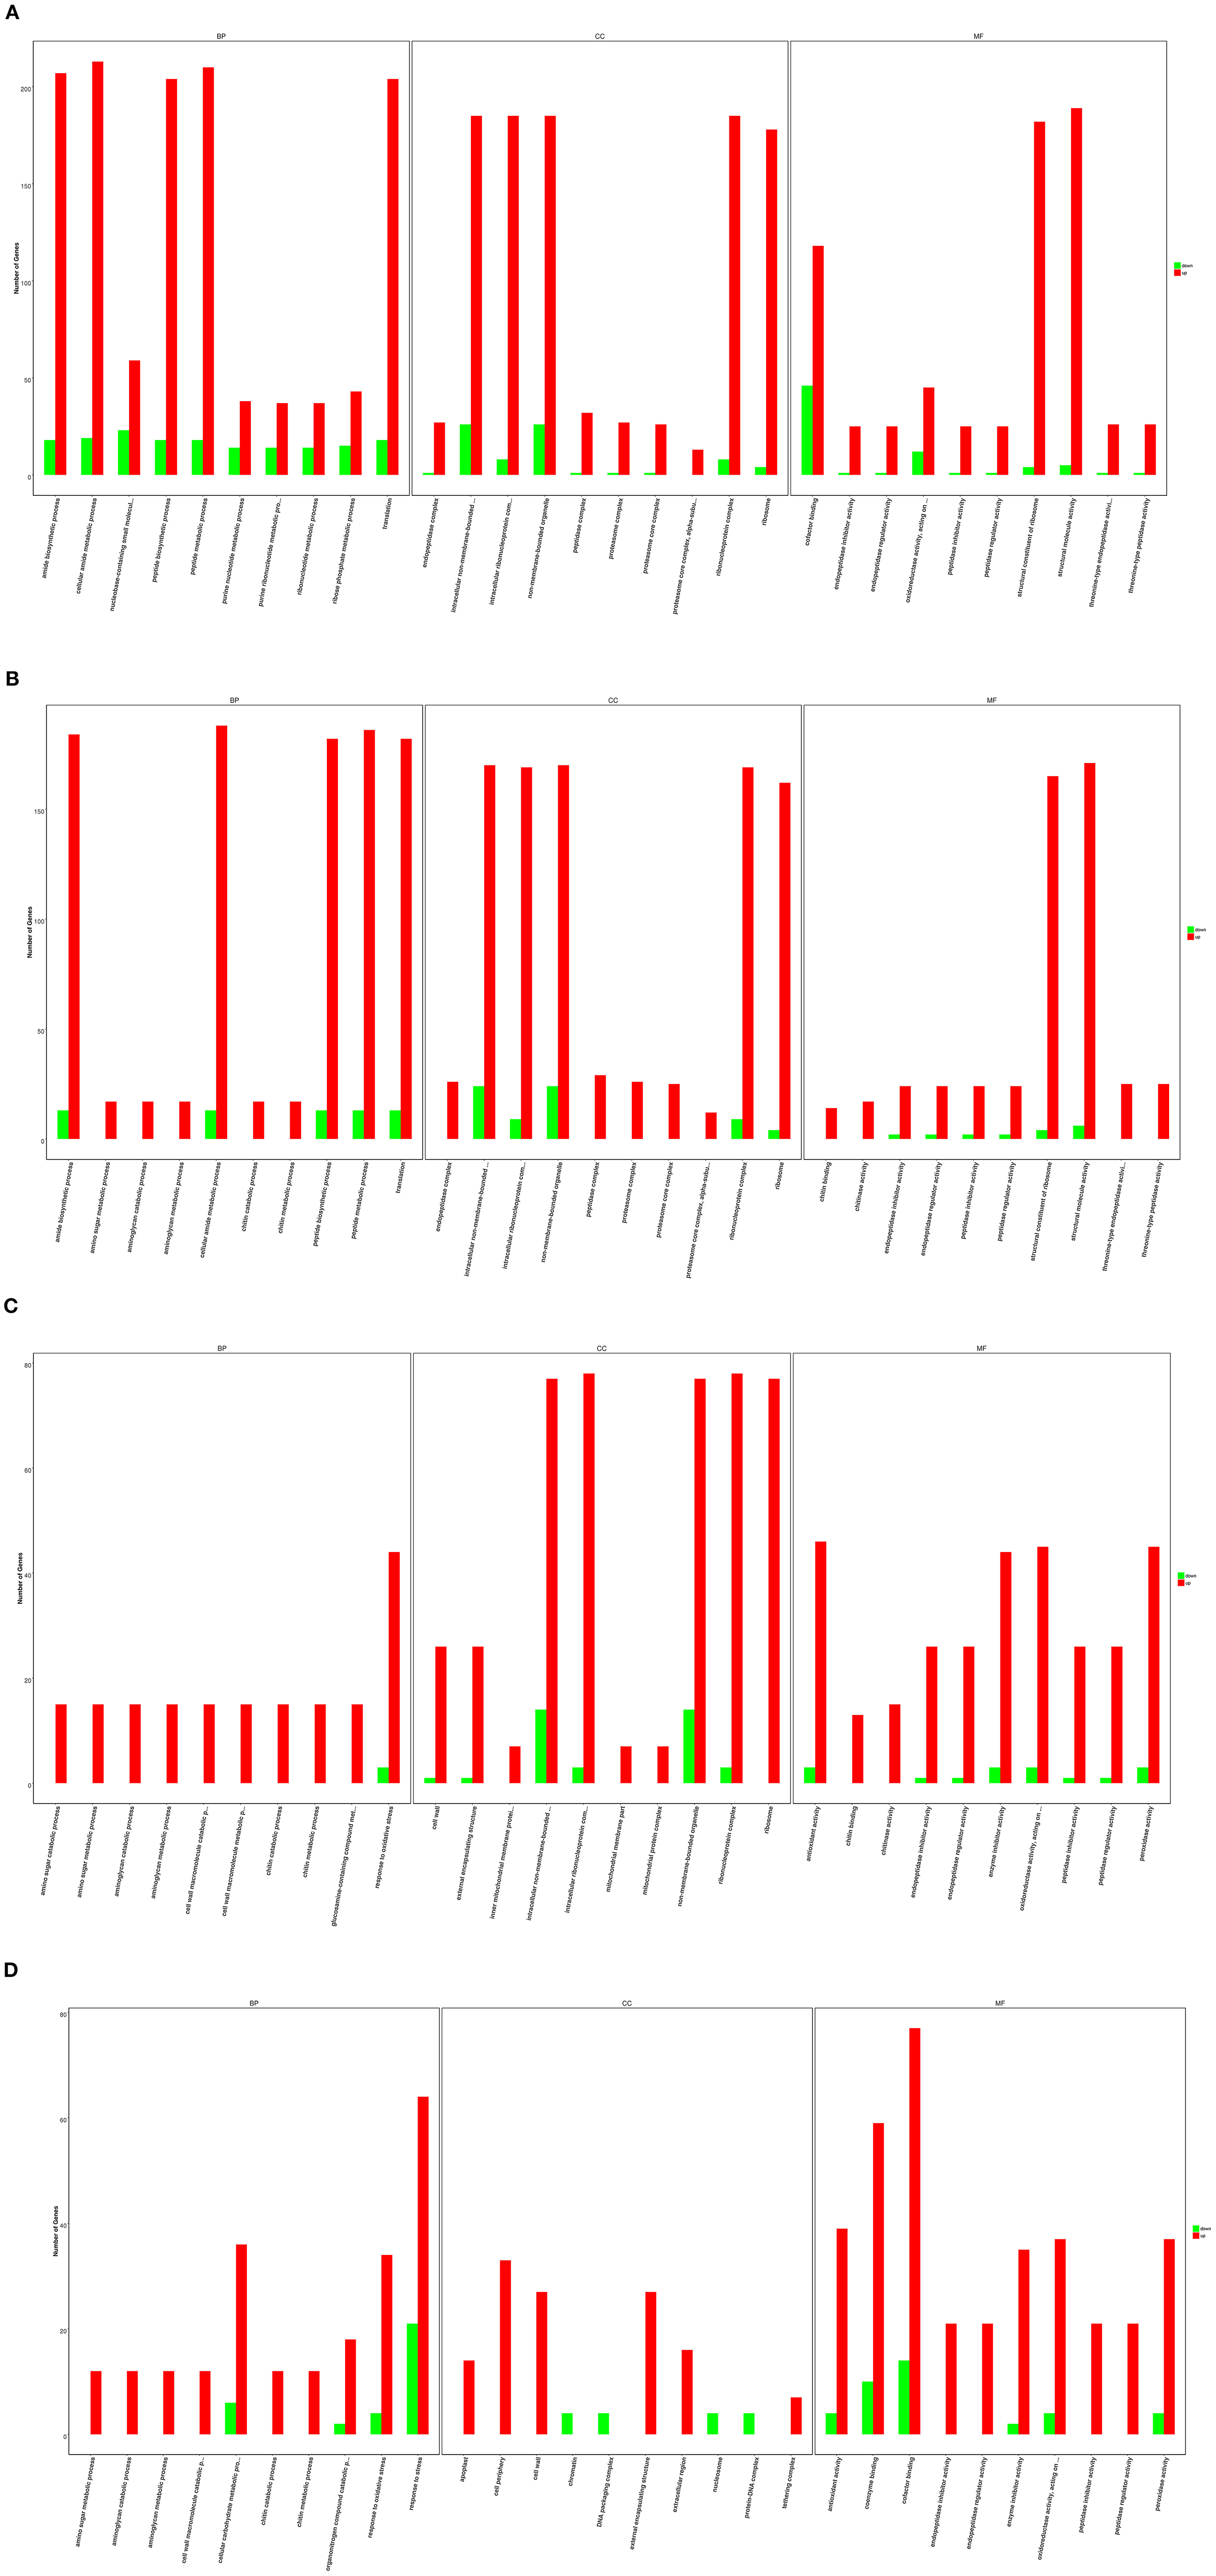
Figure 2. Gene ontology (GO) categories of differentially expressed genes (DEGs) between Fusarium Oxysporum-treated and wild type (WT) Pdpap. (A) T1 and T0. (B) T2 and T0. (C) T3 and T0. (D) T4 and T0. T0, T1, T2, T3, and T4 stand for the F. oxysporum-treated Populus davidiana × P. alba var. pyramidalis Louche (Pdpap) by 0, 6, 12, 24, and 48 h, respectively.
Results showed that infection by F. oxysporum affected the expression of many genes related to stress response (Supplementary Table 9), including four universal stress protein (USP) A-like proteins (LOC18109283, LOC7496605, LOC7464025, and LOC7494517), 9 P450 proteins (LOC7464737, LOC7480159, LOC7463864, LOC7475048, LOC7454262, LOC112326669, LOC18099663, LOC18099865, and LOC18104817), and 10 WRKY proteins (Supplementary Table 10).
Validation of DEGs by qRT-PCR
Five upregulated and five downregulated DEGs were randomly selected for qRT-PCR verification. Results showed that upregulated and downregulated expression patterns of genes were consistent with the patterns obtained by RNA sequencing. Therefore, these qRT-PCR results support the gene expression levels detected during RNA sequencing (Figure 3).
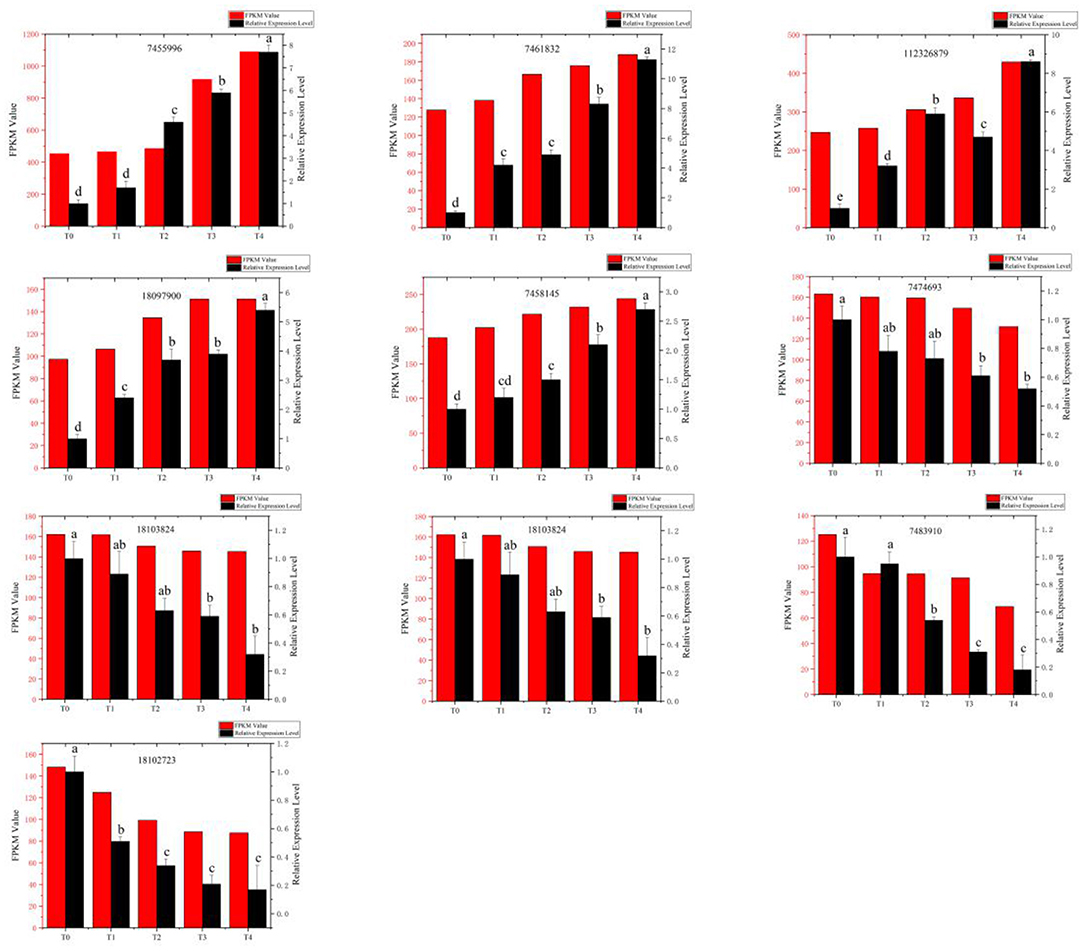
Figure 3. Comparison of relative expression of differential genes detected by RNA-Seq and quantitative real-time polymerase chain reaction (qRT-PCR). Red bars: The change in the fragments per kilobase million (FPKM) value obtained by RNA sequencing (left vertical axis). Black bars: The relative expression level (right vertical axis) obtained by qRT-PCR experiment. T0, T1, T2, T3, and T4 stand for the Fusarium oxysporum-treated Pdpap by 0, 6, 12, 24, and 48 h, respectively.
Screening of Genes Related to Disease Resistance and Expression Pattern Analysis
As previously explained, DEGs were screened according to log2 (FoldChange) > 3 and P adj < 0.05. The genes with increased expression levels during infection by F. oxysporum were obtained (Supplementary Table 11). It can be seen that 36 genes in Pdpap showed a continuously upregulated expression trend upon infection with F. oxysporum. Among these upregulated genes, various transcription factors were obtained, such as ethylene-responsive factors (ERFs), WRKYs, and V-MYB (avian myeloblastosis virus oncogenes).
In order to clarify the role of the transcription factors PdpapWRKY28, PdpapERF6, and PdpapMYB41 in response to F. oxysporum infection of Pdpap, we analyzed expression levels of these three genes in Pdpap treated with F. oxysporum (Supplementary Figure 4). After Pdpap was infected by F. oxysporum, the expression of the PdpapWRKY28 gene continued to significantly increase. Its expression level reached its maximum 48 h after infection. Contrarily, the expression levels of PdpapERF6 and PdpapMYB41 both decreased during different periods. Based on the expression pattern of the PdpapWRKY28 gene after infection with F. oxysporum, combined with the research of Wu et al. (2011) and Chen et al. (2013) on the function of the WRKY28 gene, we speculated that overexpression of the PdpapWRKY28 gene may play an important role in the response of Pdpap to F. oxysporum.
Phylogenetic Tree Analysis
A 977 bp cDNA fragment of PdpapWRKY28 was cloned from WT Pdpap. Sixteen (16) WRKY protein sequences similar to the PdpapWRKY28 gene were downloaded (see the Methods section for more details) and compared. Through the construction of a neighbor joining (NJ) phylogenetic tree, the putative evolutionary relationships among the WRKY sequences were initially revealed. Poisson bootstrap resampling was used to bolster the reliability of the NJ results, the results of which are shown in Figure 4A. In order to further confirm the reliability of the NJ results, we built a maximum likelihood (ML) phylogenetic tree using the same sequence data. The ML phylogenetic tree is shown in Figure 4B. By visually comparing the results of the two phylogenetic trees, the two models have good consistency. Additionally, the PdpapWRKY28 gene shares 100% sequence identity with the WRKY28 gene from P. trichocarpa (XP_006369893.1). The PdPapWRKY28 gene also shares high sequence homology with similar proteins from other species, such as Populus trichocarpa (100%, XP_006369893.1), P. deltoides (99.04%, KAF9867078.1), P. tomentosa (98.4%, KAG6790160.1), (P. tomentosa x P. bolleana) x P. tomentosa (98.08%, ACV92031.1), P. alba var. pyramidalis (97.76%, QFU81036.1), P. alba (97.44%, XP_034932456.1), P. euphratica (97.44%, XP_011008002.1), Salix dunnii (87.58%, KAF9666431.1), S. brachista (86.03%, KAB5521131.1), S. suchowensis (85.71%, KAG5254595.1), Hevea brasiliensis (71.21%, XP_021644344.1), Jatropha curcas (68.81%, XP_012072054.1), Ricinus communis (68.75%, XP_002519733.1), Manihot esculenta (66.67%, XP_021598441.1), Quercus suber (66.25%, XP_023886388.1), Castanea mollissima (65.94%, KAF3966433.1).
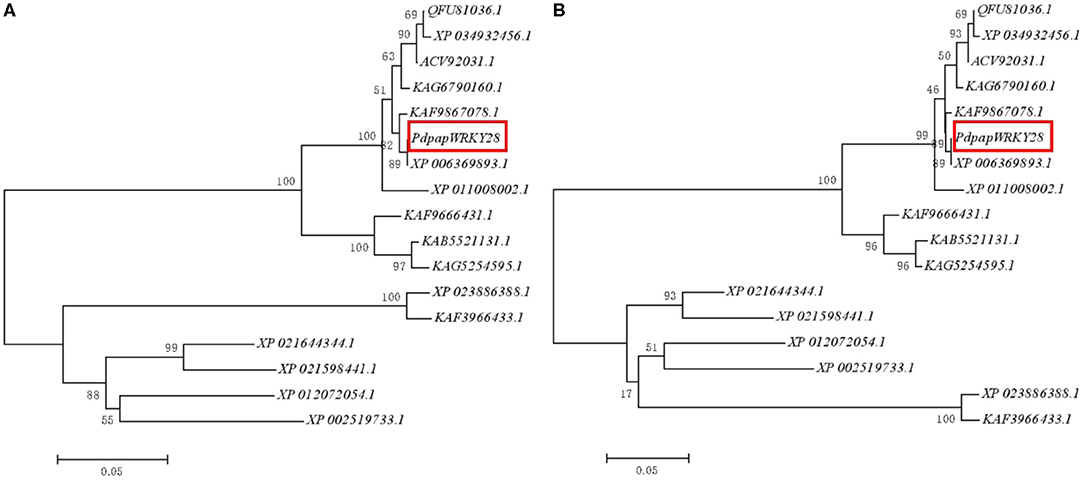
Figure 4. Dendrogram of the PdPapWRKY28 gene family proteins. (A) Neighbor joining (NJ)-phylogenetic tree; (B) Maximum likelihood (ML)-phylogenetic tree. The dendrogram was constructed using the MEGA5 with the neighbor method and Poisson model. The PdPapWRKY28 gene is marked with a red frame, and the results showed the same evolutionary relationship under the two algorithms.
Tissue-Specific Differential Expression of the PdpapWRKY28 Gene
Quantitative RT-PCR was used to analyze the spatial expression profiles of the PdpapWRKY28 gene in the different tissues of the Pdpap plants. From the results of the analysis, it can be seen that the expression level of the PdpapWRKY28 gene is lowest in leaves and highest in stems (Supplementary Figure 5A). We also compared expression levels in different parts of the stems, with the results showing that the expression of the PdpapWRKY28 gene was lowest in the midsection of the stems and highest at the base of the stems (Supplementary Figure 5B).
Molecular Detection of Overexpressing Putative Transformants of PdpapWRKY28
After the overexpression vector of PdpapWRKY28 was transformed into WT Pdpap, a total of five putative transformant lines were obtained. Then, DNA was extracted from the WT and putative transformants and PCR was performed with the primer pairs pBI121-F/PdpapWRKY28-R and PdpapWRKY28-F/pBI121-R. After PCR identification, each line containing DNA fragments was amplified by the two pairs of primers. The detection result is shown in Supplementary Figure 6. It can be seen from the figure that the bands in lanes 1-1 to 5-2 are the same as the bands in lanes “+-1” and “+-2,” and that a single amplified fragment was detected in each lane. There are no amplified bands in lanes “−1,” “−2,” and “w-1” and “w-2.” Gel electrophoresis showed that the sizes of the amplified target bands obtained from the five putative transformant lines were as expected. The recombinant plasmid (positive control) indicated that the gene was only amplified in the transformants but not in the WT Pdpap. This indicates that the pBI121-PdpapWRKY28 vector was successfully transformed into the WT Pdpap. The five transformants detected were found to contain the PdpapWRKY28 gene under the control of the CaMV 35S promoter.
Expression Level Analysis of PdpapWRKY28 in Transformants
Quantitative RT-PCR analysis was performed on five putative PdpapWRKY28-overexpression transformants under different infection conditions. The experimental result is shown in Figure 5. It can be seen that the expression level of the PdpapWRKY28 gene in the putative overexpressing transformants under different infection conditions was about 1.04–4.5 times higher than that in the WT Pdpap. Of these five putative transformants, the overexpression lines OE1 and OE3, with the highest and middle expression levels, respectively, were selected as plant materials for subsequent functional verification.
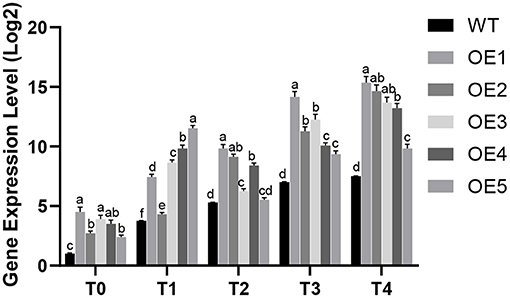
Figure 5. The expression level analysis of PdPapWRKY28 in putative transformants. WT: wild type Populus davidiana × P. alba var. pyramidalis Louche (Pdpap). OE1–OE5: transformant lines. T0–T4: infection time was 0, 6, 12, 24, and 48 h. Error bars represented the standard deviation of the three independent replicates. Significant differences (P < 0.05) were indicated by different lowercase letters.
Resistance Analysis of Transformants to F. oxysporum Infection
To test resistance to F. oxysporum under natural conditions, WT and PdpapWRKY28-overexpression transformants OE1 and OE3 were all inoculated with F. oxysporum and grown in an artificial climate room for 10 d. In Figure 6A, it can be seen that after inoculation, WT Pdpap wilted and died, but the PdpapWRKY28-overexpression transformants (OE1 and OE3) grew well, although there was evidence of slight water loss in their leaf blades and petioles. This experimental result shows that the overexpression of PdpapWRKY28 in Pdpap yields stronger resistance against F. oxysporum infection compared with WT Pdpap.
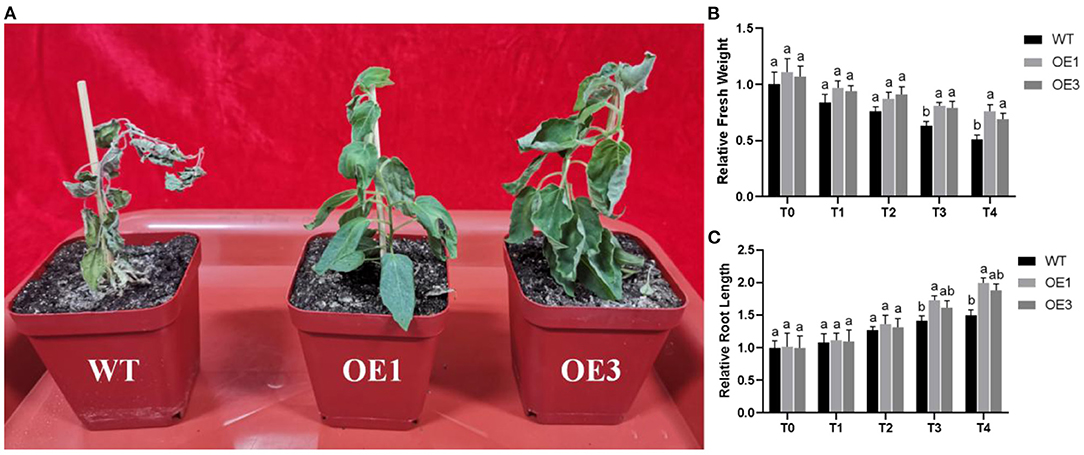
Figure 6. (A) The growth status of WT and PdPapWRKY-overexpression putative transformants OE1 and OE3 lines inoculated with Fusarium oxysporum; (B) Relative fresh weights of WT and transformants treated with F. oxysporum; (C) Root lengths of WT and transformants treated with F. oxysporum. WT: wild type Pdpap; OE1, OE3: transformant lines. T0–T4: infection time was 0, 5, 10, 15, and 20 days. The error bars represented the standard deviation of the three independent replicates. Significant differences (P < 0.05) were indicated by different lowercase letters.
The relative fresh weights and root lengths of WT and transformants inoculated with F. oxysporum at 0, 5, 10, 15, and 20 days were determined, and the weights of WT Pdpap inoculated with F. oxysporum at 0 day were set to 1. The relative fresh weights and root lengths are shown in Figures 6B,C. The relative fresh weights and root lengths of the two transformants were basically consistent with WT Pdpap at T0. In contrast, after being inoculated with F. oxysporum, the transformants were superior to the WT Pdpap under the same infection conditions, indicating that transformants grow better after infection with F. oxysporum. The results show that overexpressed expression of the PdpapWRKY28 gene can enhance resistance to F. oxysporum in the early stages of Pdpap growth.
Physiological Analysis of Transformants Infected With F. oxysporum
The results of our H2O2 measurements are shown in Figure 7A. The experiment included three biological replicates. Prior to infection, the H2O2 content in WT Pdpap was 1 ± 0.04-fold higher than that in the transformants. Under infection with F. oxysporum, the relative differences were 1.13 ± 0.01-fold, 1.22 ± 0.09-fold, 1.30 ± 0.09-fold, and 1.31 ± 0.05-fold at 6, 12, 24, and 48 h, respectively. At T0, the H2O2 content of the two transformants (OE1 and OE3) were similar to that in the WT Pdpap. However, after infection with F. oxysporum, the H2O2 content in PdpapWRKY28-overexpression transformants was lower than that in the Paparchy WT Pdpap under the same treatment conditions. This result indicates that the OE1 and OE3 lines had stronger resistance to F. oxysporum than the WT Pdpap did.
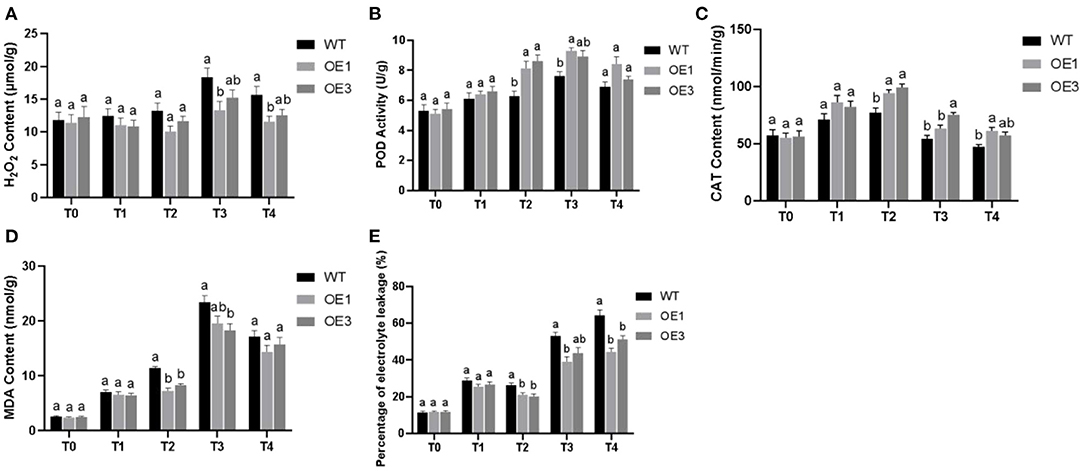
Figure 7. The physiological characteristic analysis of wild type (WT) and PdPapWRKY28-overexpression putative transformants treated with Fusarium oxysporum. Two transformants and WT were used as biological replicates for physiological analysis. (A) The result of hydrogen peroxide (H2O2) content measurements; (B) The result of peroxidase (POD) activity measurements; (C) The result of catalase (CAT) activity measurements; (D) The result of malondialdehyde (MDA) contents; (E) The result of electrolyte leakage percentage. T0–T4: infection time was 0, 6, 12, 24, and 48 h. Error bars represented the standard deviation of the three independent replicates. Significant differences (P < 0.05) were indicated by different lowercase letters.
The results of our POD activity measurements are shown in Figure 7B. The experiment included three biological replicates. Prior to infection, the POD activity of the transformants was 0.99 ± 0.03-fold higher than that of the WT Pdpap. The relative differences were 1.07 ± 0.02-fold, 133 ± 0.04-fold, 1.20 ± 0.03-fold, and 1.15 ± 0.08-fold at 6, 12, 24, and 48 h, respectively. At T0, the POD activity in the transformants is similar to that in the WT Pdpap. After infection with F. oxysporum, the POD activity in transformants was higher than that in the WT Pdpap under the same treatment conditions. This result indicates that PdpapWRKY28-overexpression transformants had greater resistance to the pathogen than the WT Pdpap.
The results of our CAT activity measurements are shown in Figure 7C. The experiment had three biological replicates. Prior to infection, the CAT activity in the transformants was 0.97 ± 0.01-fold higher than that in the WT Pdpap. After infection by F. oxysporum, the relative differences were 1.18 ± 0.03-fold, 1.26 ± 0.04-fold, 1.28 ± 0.11-fold, and 1.26 ± 0.05-fold at 6, 12, 24, and 48 h, respectively. It can be seen that, at T0, the CAT activity in the two transformants is similar to that in the WT Pdpap. However, after infection with F. oxysporum, the CAT activity of the transformants was higher than that of the WT Pdpap in the same infection conditions. This result provides evidence that PdpapWRKY28-overexpression transformants have higher resistance to F. oxysporum than WT Pdpap.
The results of our MDA content measurements are shown in Figure 7D. The experiment included three biological replicates. Prior to infection, the MDA content of the WT Pdpap was 1.06 ± 0.02-fold higher than that in the transformants. Additionally, WT Pdpap was 1.1 ± 0.02-fold, 1.47 ± 0.1-fold, 1.24 ± 0.05-fold, and 1.15 ± 0.05-fold higher than that in the transformants at 6, 12, 24, and 48 h, respectively, after infection by F. oxysporum. It can be seen that, at T0, the MDA content of the transformants was similar to that of WT Pdpap. After infection with F. oxysporum, however, the transformants had consistently lower malondialdehyde content than that of the WT Pdpap subjected to the same infection inoculation dosage and duration. This result indicates that PdpapWRKY28-overexpression transformants had increased resistance to F. oxysporum compared to WT Pdpap.
The percentage of electrolyte leakage is shown in Figure 7E. Prior to F. oxysporum inoculation, electrolyte leakage in the WT Pdpap was 0.97 ± 0.01-fold higher than that in the transformants. After infection with F. oxysporum, the percentage of electrolyte leakage in the transformants was 1.1 ± 0.03-fold, 1.28 ± 0.03-fold, 1.29 ± 0.07-fold, and 1.35 ± 0.1-fold lower than in the WT Pdpap at 6, 12, 24, and 48 h, respectively. It can be seen that, at T0, the percentage of electrolyte leakage in the two transformants was similar to that in the WT Pdpap. After infection with F. oxysporum, however, the percentage of electrolyte leakage in the transformants was lower than that in the WT Pdpap subjected to the same inoculation dosage and duration. This result indicates that PdpapWRKY28-overexpression transformants had stronger resistance to F. oxysporum infection than the WT Pdpap.
Histochemical Staining
The accumulation of superoxide anions () and H2O2 in WT and transformants was analyzed by means of NBT and DAB staining of Pdpap leaves infected with F. oxysporum (Figure 8). From the degree of NBT staining, it could be seen that the leaves of infected PdpapWRKY28-overexpression transformants (Figures 8A-d) were slightly darker than those of uninfected WT Pdpap (Figures 8A-a) and transformants (Figures 8A-c), but the overall appearance was similar. However, the difference in color compared with leaves of WT Pdpap infected by F. oxysporum was striking (Figures 8A-b). Likewise, the degree of DAB staining of the leaves of infected PdpapWRKY28-overexpression transformants (Figures 8B-h) was slightly darker than that of uninfected WT Pdpap plants (Figures 8B-e) and transformants (Figures 8B-g), but the overall appearance was similar. However, the difference in color compared with leaves of WT Pdpap infected by F. oxysporum is obvious (Figures 8B-f). These results indicate that the tissues in transformants showed much less damage than those in WT Pdpap after both were infected with F. oxysporum. It can be seen that leaf cells in transformants have a stronger ability to remove ROS, including O2− and H2O2, thereby reducing cell damage and enhancing plant tolerance. This result is consistent with the POD and CAT activity measurements, which provides further evidence that the overexpression of the PdpapWRKY28 gene in Pdpap likely reduces the accumulation of intracellular ROS. Thus, PdpapWRKY28-overexpression transformants could very effectively enhance the antioxidant capacity of Pdpap plants and improve their resistance to F. oxysporum.
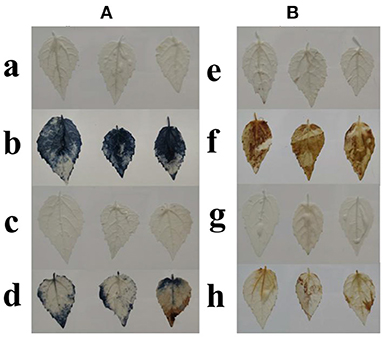
Figure 8. Histochemical staining by nitro blue tetrazolium (NBT) and 3,3′-diaminobenzidine (DAB). (A) NBT staining. a: Leaves of wild type (WT) Populus davidiana × P. alba var. pyramidalis Louche (PdPap) without infection, b: Leaves of WT PdPap with Fusarium oxysporum, c: Leaves of transformants without F. oxysporum, d: Leaves of transformants with F. oxysporum; (B) DAB staining. e: Leaves of WT PdPap without infection, f: Leaves of WT PdPap with F. oxysporum, g: Leaves of transformants without F. oxysporum, h: Leaves of transformants with F. oxysporum. Staining intensities of WT and transformants under infection of F. oxysporum are similar, but greatly increased in WT infected by F. oxysporum.
Differential Expression Analysis of Defense-Associated Genes in PdPap
To further understand the regulatory role of the PdpapWRKY28 gene in response to F. oxysporum infection, we used qRT-PCR to detect expression levels of hormone signal pathway genes related to plant defense (Figure 9).
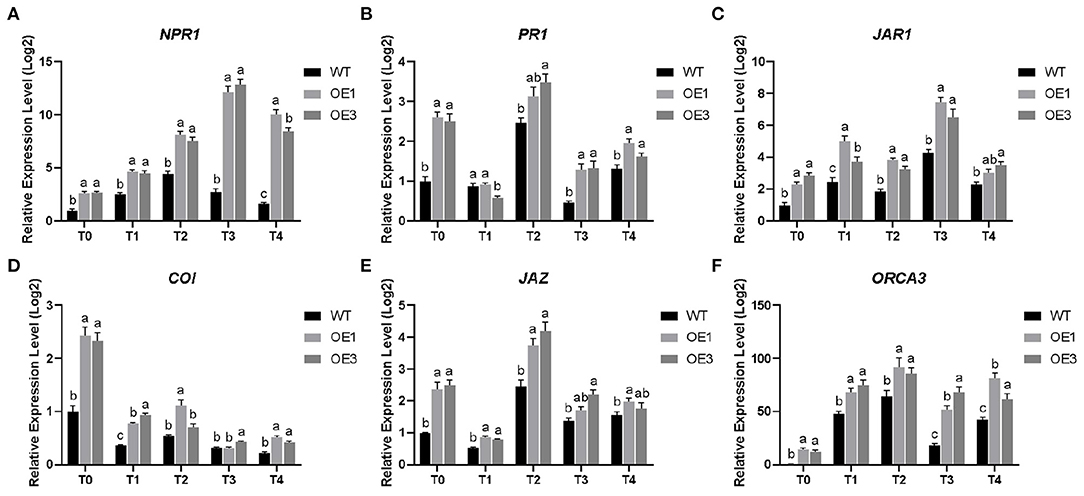
Figure 9. Differential expression level of six defense-associated genes in Populus davidiana × P. alba var. pyramidalis Louche (PdPap) after infection with Fusarium oxysporum. (A) nonexpressor of pathogenesis-related genes (NPR1); (B) pathogenesis-related protein genes (PR1); (C) jasmonic acid resistant gene (JAR1); (D) coronatine insensitive protein gene (COI); (E) jasmonate ZIM-domain gene (JAZ); (F) Octadecaniod-derivative response AP2 domain (ORCA3). T0–T4: Infection time was 0, 6, 12, 24, and 48 h. Error bars represented the standard deviation of the three independent replicates. Significant differences (P < 0.05) were indicated by different lowercase letters. WT: wildtype Pdpap; OE1, OE3: transformant lines.
The SA signal transduction pathway mainly includes the non-expressor of pathogenesis-related genes (NPR1) and pathogenesis-related protein genes (PR1). In this study, the expression level of NPR1 gene showed a trend of upregulation first and then downregulation (Figure 9A). The expression level of the NPR1 gene in the WT Pdpap reached its highest at 12 h and was 4.46-fold higher than that in control. The expression levels of the NPR1 gene in the OE1 and OE3 lines reached their highest at 24 h. They were 12.14-fold and 12.87-fold higher than that in control, respectively. The expression level of the PR1 gene was upregulated during 6–12 h and the later stage of infection and reached its highest at 12 h (Figure 9B). The expression level of the PR1 gene in the WT Pdpap was 2.46-fold higher than that in control. The expression levels of the PR1 gene in the OE1 and OE3 lines were 3.13-fold and 3.48-fold higher than that in control, respectively. Therefore, PdpapWRKY28 gene could induce the SA signal transduction pathway in Pdpap.
The JA signal transduction pathway mainly includes the jasmonic acid resistant gene (JAR1), the coronatine insensitive protein gene (COI), the jasmonate ZIM-domain gene (JAZ), and the Octadecaniod-derivative response AP2 domain gene (ORCA3). After infection by F. oxysporum, the expression level of the JAR1 gene showed an overall trend of upregulation first and then downregulation. It reached highest at 24 h (Figure 9C). The expression level of the JAR1 gene in the WT Pdpap was 4.29-fold higher than that in control. The expression levels of the JAR1 gene in the OE1 and OE3 lines were 7.46-fold and 6.5-fold higher than that in control, respectively. The expression level of the COI gene was downregulated and reached its lowest at 48 h (Figure 9D). The expression level of the COI gene in the WT Pdpap was 0.231-fold lower than that in control. The expression levels of the COI gene in the OE1 and OE3 lines were 0.519-fold and 0.42-fold lower than that in control, respectively. The expression level of the JAZ gene showed an overall trend of upregulation first and then down-egulation. It reached its highest at 12 h (Figure 9E). The expression level of the JAZ gene in the WT Pdpap was 2.46-fold higher than that in control. The expression levels of the JAZ gene in the OE1 and OE3 lines were 3.73-fold and 4.2-fold higher than that in control, respectively. The expression level of the ORCA3 gene was upregulated first and then downregulated. It reached its highest at 12 h (Figure 9F). The expression level of the ORCA3 gene in the WT Pdpap was 64.45-fold higher than that in control. The expression levels of the ORCA3 gene in the OE1 and OE3 lines were 92.04-fold and 85.79-fold higher than that in control, respectively. Therefore, the PdpapWRKY28 gene could induce the JA signal transduction pathway in Pdpap.
Discussion
It is well-supported that the response of plants to adversity requires the joint action of multiple genes (Li et al., 2015). In that regard, the results of this are consistent with previous studies. These previous studies used RNA sequencing methods to understand the response patterns of plants affected by pathogens (Rosli et al., 2013; Zeng et al., 2014; Sucher et al., 2017). However, little is known about the processes and mechanisms of Pdpap responses to F. oxysporum.
Analysis and identification of the genes involved in responses to F. oxysporum are essential for understanding the mechanisms of root rot and adopting effective control strategies for the disease. Under F. oxysporum treatment, changes in transcript levels in Pdpap directly reflect the response of Pdpap to F. oxysporum.
Transcription factors are important for abiotic and biological stress responses (Akhtar et al., 2012). It has been found that transcription factor families such as WRKY, AP2/ERF, NAC, bZIP, and MYB (Pu et al., 2019) affect stress tolerance in plants by regulating downstream stress response genes (Joshi et al., 2016). In particular, WRKY transcription factors are involved in diverse secondary metabolism and plant growth pathways, such as trichome development, tannin production in the seed coat, seed coat development, root development, embryogenesis, and leaf senescence (Johnson et al., 2002; Lagace and Matton, 2004). These WRKYs are also involved in the response of plants to a variety of environmental stresses, such as pathogens, low temperature, salt, and drought (Huang and Duman, 2002; Yoda et al., 2002).
There are several reports on the resistance functions of the PdpapWRKY28 gene in response to pathogens (Ülker and Somssich, 2004; Wu et al., 2011), salt stress (Babitha et al., 2013; Wang et al., 2020), and acids (Chen et al., 2013). These studies established a theoretical foundation for our early prediction and subsequent validation experiments. Studies showed that AtWRKY28 participates in the salicylic acid (SA)-mediated signal pathway of disease resistance and plays an important role in SA metabolism by regulating the expression of isochorismate synthase (ISCI) genes (Verk et al., 2011). Therefore, we hypothesized that the PdpapWRKY28 gene might participate in the regulation of the SA signaling pathway to promote the effective response of Pdpap to F. oxysporum infection.
We observed differential expression levels of PdpapWRKY28 in the transformants. This may have been due to different copy numbers and/or insertion sites of the gene as mediated by the recombinant vector pBI121-PdpapWRKY28. We will analyze the copy numbers and insertion sites of PdpapWRKY28 in putative transformants in a follow-up study. By observing the responses of the PdpapWRKY28-overexpression transformants OE1 and OE3, we thought that the overexpression of the PdpapWRKY28 played a significant role in the growth and health status of the plants after pathogen infection. The overexpression of PdpapWRKY28 could effectively reduce the accumulation of ROS in Pdpap and promote the activities of defense-related enzymes to protect plants from external stress. In the future, we will further study the molecular mechanism of gene regulation and the gene network related to PdpapWRKY28 expression in response to infection by F. oxysporum.
To determine the molecular mechanism of Pdpap in response to F. oxysporum after PdpapWRKY28-overexpression, we analyzed the expression level of hormone signal transduction genes related to plant disease resistance. The SA signal transduction pathway mainly includes NPR1 and PR1 (Shah et al., 1999). The NPR1 gene regulates the transcription of PR1 gene. High transcription level of the PR1 gene can eventually stimulate plants to establish systemic acquired resistance (SAR) (Ali et al., 2017). Furthermore, JA is an important signal molecule of induced systemic resistance (ISR). The JA signal transduction pathway mainly includes JAR1, COI, JAZ, and ORCA3 (Gfeller et al., 2010). By regulating the transcription of JAR1, COI, and JAZ, the expression of ORCA3 can be regulated (Choudhary et al., 2007). Finally, it stimulates the expression of plant defense proteins and synthesis of secondary metabolites, which could stimulate plants to establish ISR (Choudhary et al., 2007). In this study, the expression level of NPR1 and PR1 was negatively correlated during 0–48 h. The regulation of NPR1 inhibited the expression of PR1.Therefore, the overexpression of the PdpapWRKY28 gene did not ultimately stimulate the SA signal in Pdpap. Furthermore, Pdpap did not establish SAR. The expression level of COI was negatively correlated with JAR1 and ORCA3 during 0–48 h. Under the induction of PdpapWRKY28-overexpression, the JAR1 gene was positively regulated. The COI gene was negatively regulated. The expression level of JAZ rose first and then declined. They eventually activated the expression of ORCA3. Therefore, the overexpression of PdpapWRKY28 gene can stimulate the JA signal of Pdpap, thereby establishing ISR in Pdpap.
The focus of this paper was to explore molecular response patterns of Pdpap treated with F. oxysporum. PdpapWRKY28 was identified and its response patterns were verified. The study also provides a theoretical basis for enhancing resistance of Pdpap to F. oxysporum. These findings will provide a critical gene for reference in research on root rot resistance breeding in the future.
Data Availability Statement
The original contributions presented in the study are publicly available. This data can be found here: National Center for Biotechnology Information (NCBI) BioProject database under accession number PRJNA741264.
Author Contributions
JD: investigation, methodology, and writing of the draft. JW: formal analysis, funding acquisition, investigation, and project administration. PZ: formal analysis and validation. XH: formal analysis and methodology. YW: formal analysis. LL: resources. YZ: supervision. WM: writing, including review and editing. LM: funding acquisition, methodology, and project administration. All authors contributed to the article and approved the submitted version.
Funding
This work was supported by the Fundamental Research Funds for the Central 364 Universities (2572019CP01) and the College Student Innovation and Entrepreneurship Training Program (202010225008).
Conflict of Interest
The authors declare that the research was conducted in the absence of any commercial or financial relationships that could be construed as a potential conflict of interest.
Publisher's Note
All claims expressed in this article are solely those of the authors and do not necessarily represent those of their affiliated organizations, or those of the publisher, the editors and the reviewers. Any product that may be evaluated in this article, or claim that may be made by its manufacturer, is not guaranteed or endorsed by the publisher.
Supplementary Material
The Supplementary Material for this article can be found online at: https://www.frontiersin.org/articles/10.3389/fpls.2021.720679/full#supplementary-material
Supplementary Figure 1. General transcription patterns of all samples. Pearson correlation between Fusarium oxysporum-treated and wild type (WT) Populus davidiana × P. alba var. pyramidalis Louche (Pdpap). T0, T1, T2, T3, and T4 stand for the F. oxysporum-treated Pdpap by 0, 6, 12, 24, and 48 h, respectively. The numbers 1, 2, 3, and 4 after the treatment name stand for the four biological repetitions of the same treatment operation.
Supplementary Figure 2. Differential gene volcano map. T0, T1, T2, T3, and T4 stands for the F. oxysporum-treated Populus davidiana × P. alba var. pyramidalis Louche (Pdpap) by 0, 6, 12, 24, and 48 h, respectively. The numbers 1, 2, 3, and 4 after the treatment name stand for the four biological repetitions of the same treatment operation.
Supplementary Figure 3. Heat map of all the differentially expressed genes (DEGs) between the Fusarium oxysporum-treated and wild type (WT) groups of Populus davidiana × P. alba var. pyramidalis Louche (Pdpap). T0, T1, T2, T3, and T4 stand for the F. oxysporum-treated Pdpap by 0, 6, 12, 24, and 48 h, respectively. The numbers 1, 2, 3, and 4 after the treatment name stand for the 4 biological repetitions of the same treatment operation.
Supplementary Figure 4. Expression patterns analysis of candidate genes. The relative expression levels are obtained from the quantitative real-time PCR (qRT-PCR) measurements of Populus davidiana × P. alba var. pyramidalis Louche (Pdpap). Significant differences (P < 0.05) were indicated by different lowercase letters. Error bars represented the standard deviation of the three independent replicates.
Supplementary Figure 5. Tissue-specific differential expression of the PdPapWRKY28 gene. (A) In different tissues of Populus davidiana × P. alba var. pyramidalis Louche (Pdpap); (B) In different parts of stems. The relative expression levels were obtained from the quantitative real-time PCR (qRT-PCR) measurements of Pdpap. Significant differences (P < 0.05) were indicated by different lowercase letters. Error bars represented the standard deviation of the three independent replicates.
Supplementary Figure 6. Molecular detection in the putative transformants Populus davidiana × P. alba var. pyramidalis Louche (Pdpap) of PdPapWRKY28. M: DL2,000 Marker; 1–5: Five overexpressing putative transformant lines were used as amplification templates; +: Positive control using pBI121-PdPapWRKY28 plasmid as template; -, Negative control with water as template; W, Negative control with WT Pdpap as template;−1, PCR detection of putative transformant lines using pBI121-F and PdPapWRKY28-R as primers;−2, PCR detection of putative transformant lines with PdPapWRKY28-F and pBI121-R as primers.
Supplementary Table 1. Primer sequences of quantitative real-time PCR (qRT-PCR).
Supplementary Table 2. Components of quantitative real-time PCR (qRT-PCR) amplifications.
Supplementary Table 3. Primer sequences of quantitative real-time PCR (qRT-PCR).
Supplementary Table 4. Primer sequences of quantitative real-time PCR (PCR).
Supplementary Table 5. Components of PCR amplifications.
Supplementary Table 6. Primer sequences of quantitative real-time PCR (qRT-PCR).
Supplementary Table 7. Statistics analysis of RNA sequencing data from Fusarium oxysporum-treated and wild type (WT) Pdpap.
Supplementary Table 8. Differential expression gene statistics.
Supplementary Table 9. Read counts, fragments per kilobase million (FPKM), and descriptions of differentially expressed genes (DGEs).
Supplementary Table 10. Differential expressed PdpapWRKYs under Fusarium oxysporum treatment.
Supplementary Table 11. Differential expressed genes with more than 3-fold upregulated.
References
Akhtar, M., Jaiswal, A., Taj, G., Jaiswal, J. P., Qureshi, M. I., and Singh, N. K. (2012). DREB1/CBF transcription factors: their structure, function and role in abiotic stress tolerance in plants. J. Genet. 91, 385–395. doi: 10.1007/s12041-012-0201-3
Ali, M. A., Abbas, A., Kreil, D. P., and Bohlmann, H. (2013). Overexpression of the transcription factor RAP2.6 leads to enhanced callose deposition in syncytia and enhanced resistance against the beet cyst nematode Heterodera schachtii in Arabidopsis roots. BMC Plant Biol. 13, 47–64. doi: 10.1186/1471-2229-13-47
Ali, S., Mir, Z. A., Bhat, J. A., Tyagi, A., Chandrashekar, N., Yadav, P., et al. (2017). Isolation and characterization of systemic acquired resistance marker gene PR1 and its promoter from Brassica juncea. 3 Biotech. 8, 10–24. doi: 10.1007/s13205-017-1027-8
Andrews, S. (2010). Babraham bioinformatics -FastQC a quality control tool for high throughput sequence data. Bioinformatics 1, 774–798. doi: 10.12688/f1000research.21142.2
Babitha, K. C., Ramu, S. V., Pruthvi, V., Mahesh, P., Nataraja, K. N., and Udayakumar, M. (2013). Co-expression of AtbHLH17 and AtWRKY28 confers resistance to abiotic stress in Arabidopsis. Transgenic Res. 22, 327–341. doi: 10.1007/s11248-012-9645-8
Bala, J. (2016). Contribution of SPSS in social sciences research. Int. J. Adv. Res. Comput. Sci. 7, 250–254. doi: 10.26483/ijarcs.v7i6
Bani, M., Rispail, N., Evidente, A., Rubiales, D., and Cimmino, A. (2014). Identification of the main toxins isolated from Fusarium oxysporum f. sp. pisi race 2 and their relation with isolates' pathogenicity. J. Agr. Food Chem. 62, 2574–2580. doi: 10.1021/jf405530g
Chen, X. T., Liu, J., Lin, G. F., Wang, A. R., Wang, Z. H., and Lu, G. D. (2013). Overexpression of AtWRKY28 and AtWRKY75 in Arabidopsis enhances resistance to oxalic acid and Sclerotinia sclerotiorum. Plant Cell Rep. 32, 1589–1599. doi: 10.1007/s00299-013-1469-3
Cheng, Z. H., Zhang, X. M., Zhao, K., Zhou, B. R., and Jiang, T. B. (2020). Ectopic expression of a poplar gene NAC13 confers enhanced tolerance to salinity stress in transgenic Nicotiana tabacum. J. Plant Res. 133, 727–737. doi: 10.1007/s10265-020-01213-z
Choi, K. J., Kim, H. B., and Park, S. H. (2012). The comparison of postoperative pain: total laparoscopic hysterectomy versus vaginal hysterectomy. Obstet. Gynecol. Sci. 55, 384–391. doi: 10.5468/KJOG.2012.55.6.384
Choudhary, D. K., Prakash, A., and Johri, B. N. (2007). Induced systemic resistance (ISR) in plants: mechanism of action. Indian J. Microbiol. 47, 289–297. doi: 10.1007/s12088-007-0054-2
Chujo, T., Miyamoto, K., Shimogawa, T., Shimizu, T., Otake, Y., Yokotani, N., et al. (2013). OsWRKY28, a PAMP-responsive transrepressor, negatively regulates innate immune responses in rice against rice blast fungus. Plant Mol. Biol. 82, 23–37. doi: 10.1007/s11103-013-0032-5
Duan, G. R., Shi, Y. X., Xie, X. W., Wang, W. W., and Li, B. J. (2010). Fungicides in vitro and in vivo screening against Fusarium oxysporum f.sp. cucumerinum. China Vegetables 12, 60–65.
Elad, Y., and Pertot, I. (2014). Climate change impacts on plant pathogens and plant diseases. J. Crop Improv. 28, 99–139. doi: 10.1080/15427528.2014.865412
Gfeller, A., Liechti, R., and Farmer, E. E. (2010). Arabidopsis jasmonate signaling pathway. Sci. Signal. 3:cm4. doi: 10.1126/scisignal.3109cm4
Góth, L. (1991). A simple method for determination of serum catalase activity and revision of reference range. Clin. Chim. Acta 196, 143–151. doi: 10.1016/0009-8981(91)90067-M
Guo, R. T. (2019). Mechanism of Systematic Disease Resistance Induced by Trichoderma asperellum xylanases to Populus davidiana × P. alba var. pyramidalis.
Guo, R. T., Ji, S. D., Wang, Z. Y., Zhang, H. F., Wang, Y. C., and Liu, Z. H. (2021). Trichoderma asperellum xylanases promote growth and induce resistance in poplar. Microbiol. Res. 248:126767. doi: 10.1016/j.micres.2021.126767
Guo, R. T., Wang, Z. Y., Huang, Y., Fan, H. J., and Liu, Z. H. (2018). Biocontrol potential of saline- or alkaline-tolerant Trichoderma asperellum mutants against three pathogenic fungi under saline or alkaline stress conditions. Braz. J. Microbiol. 49, 236–245. doi: 10.1016/j.bjm.2018.02.008
He, H. S., Dong, Q., Shao, Y. H., Jiang, H. Y., Zhu, S. W., Cheng, B. J., et al. (2015). Genome-wide survey and characterization of the WRKY gene family in Populus trichocarpa. Plant Cell Rep. 31, 1199–1217. doi: 10.1007/s00299-012-1241-0
Holsters, M., Waele, D., Depicker, A., Messens, E., Montagu, M., and Schell, J. (1978). Transfection and transformation of Agrobacterium tumefaciens. Mol. Gen. Genet. 163, 181–187. doi: 10.1007/BF00267408
Hou, L., Cao, X., Wang, C., and Lu, M. (2009). Effect of overexpression of transcription factors on the fermentation properties of Saccharomyces cerevisiae industrial strains. Lett. Appl. Microbiol. 49, 14–19. doi: 10.1111/j.1472-765X.2009.02615.x
Huang, T., and Duman, J. G. (2002). Cloning and characterization of a thermal hysteresis (antifreeze) protein with DNA-binding activity from winter bittersweet nightshade, Solanum dulcamara. Plant Mol. Biol. 48, 339–350. doi: 10.1023/A:1014062714786
Huang, Y., Mijiti, G., Wang, Z. Y., Yu, W. J., Fan, H. J., Zhang, R. S., et al. (2015). Functional analysis of the class II hydrophobin gene HFB2-6 from the biocontrol agent Trichoderma asperellum ACCC30536. Microbiol. Res. 171, 8–20. doi: 10.1016/j.micres.2014.12.004
Ihle, M. A., Fassunke, J., König, K., Grünewald, I., Schlaak, M., Kreuzberg, N., et al. (2014). Comparison of high resolution melting analysis, pyrosequencing, next generation sequencing and immunohistochemistry to conventional Sanger sequencing for the detection of p.V600E and non-p.V600E BRAF mutations. BMC Cancer 14, 13–27. doi: 10.1186/1471-2407-14-13
Imran, Q. M., Lee, S. U., Mun, B. G., Hussain, A., Asaf, S., Lee, I. J., et al. (2019). WRKYs, the Jack-of-various-Trades, modulate dehydration stress in Populus davidiana—A transcriptomic approach. Int. J. Mol. Sci. 20, 414–440. doi: 10.3390/ijms20020414
Jiang, C. Y. (2017). Transcriptome Analysis of the Auxin Key Genes in Populus davidiana × P. alba var. Pyramidalis Response to Trichoderma asperellum and alternaria alternata.
Jin, J. P., Zhang, H., Kong, L., Gao, G., and Luo, J. C. (2014). PlantTFDB 3.0: a portal for the functional and evolutionary study of plant transcription factors. Nucleic Acids Res. 42, 1182–1187. doi: 10.1093/nar/gkt1016
Johnson, C. S., Kolevski, B., and Smyth, D. R. (2002). TRANSPARENT TESTA GLABRA2, a trichome and seed coat development gene of Arabidopsis, encodes a WRKY transcription factor. Plant Cell Online 14, 1359–1375. doi: 10.1105/tpc.001404
Joshi, R., Wani, S. H., Singh, B., Bohra, A., Dar, Z. A., Lone, A. A., et al. (2016). Transcription factors and plants response to drought stress: current understanding and future directions. Front. Plant Sci. 7, 1029–1039. doi: 10.3389/fpls.2016.01029
Julia, N., Matthias, F., Tobias, B., and Dirk, B. (2017). Old methods rediscovered: application and improvement of two direct transformation methods to hybrid poplar (Populus tremula x P-alba). Plant Cell Tiss. Org. 130, 183–196. doi: 10.1007/s11240-017-1214-7
Kang, P. Z., Bai, X. J., Zhang, L. R., Du, Y. N., and Zhang, Z. K. (2018). Biological characteristics of Fusarium oxysporium (Schl.) f.sp. cucumerinum Owen. Nor. Horticul. 22, 65–69.
Khokon, A. R., Okuma, E., Hossain, M. A., Munemasa, S., Uraji, M., Nakamura, Y., et al. (2011). Involvement of extracellular oxidative burst in salicylic acid-induced stomatal closure in Arabidopsis. Plant Cell Environ. 34, 434–443. doi: 10.1111/j.1365-3040.2010.02253.x
Kim, D., Langmead, B., and Salzberg, S. L. (2015). HISAT: A fast spliced aligner with low memory requirements. Nat. Methods 12, 357–360. doi: 10.1038/nmeth.3317
King, B. C., Waxman, K. D., Nenni, N. V., Walker, L. P., Bergstrom, G. C., and Gibson, D. M. (2011). Arsenal of plant cell wall degrading enzymes reflects host preference among plant pathogenic fungi. Biotechnol. Biofuels 4, 4–18. doi: 10.1186/1754-6834-4-4
Kumar, D., Yusuf, M. A., Singh, P., Sardar, M., and Sarin, N. B. (2013). Modulation of antioxidant machinery in α-tocopherol-enriched transgenic Brassica juncea plants tolerant to abiotic stress conditions. Protoplasma 250, 1079–1089. doi: 10.1007/s00709-013-0484-0
Lagace, M., and Matton, D. P. (2004). Characterization of a WRKY transcription factor expressed in late torpedo-stage embryos of Solanum chacoense. Planta 219, 185–189. doi: 10.1007/s00425-004-1253-2
Li, C. Y., He, L. F., and Wang, A. Q. (2015). New progress in DREB improving antiabiotic stress ability in higher plants. J. Anhui Agr. Sci. 30, 37–38.
Liao, Y., Smyth, G. K., and Shi, W. (2014). FeatureCounts: an efficient general purpose program for assigning sequence reads to genomic features. Bioinformatics 30, 923–930. doi: 10.1093/bioinformatics/btt656
Livak, K. J., and Schmittgen, T. D. (2001). Analysis of relative gene expression data using real-time quantitative PCR and the 2−ΔΔCT method. Methods 25, 402–408. doi: 10.1006/meth.2001.1262
Love, M. I., Huber, W., and Anders, S. (2014). Moderated estimation of fold change and dispersion for RNA-seq data with DESeq2. Genome Biol. 15, 1–21. doi: 10.1186/s13059-014-0550-8
Lu, Y. W., Wang, G. Q., Meng, Q. J., and Zhang, W. H. (2011). Effects of enhanced temperature on chlorophyll content and chlorophyll fluorescence parameters in Populus tomentosa Carr. J. Henan Agr. Sci. 10, 115–119.
Ma, L. J., Geiser, D. M., Proctor, R. H., Rooney, A. P., Donnell, K. O., Trail, F., et al. (2013). Fusarium pathogenomics. Annu. Rev. Microbiol. 67, 399–416. doi: 10.1146/annurev-micro-092412-155650
Madar, V., and Batista, S. (2016). FastLSU: a more practical approach for the Benjamini-Hochberg FDR controlling procedure for huge-scale testing problems. Bioinformatics 32, 1716–1723. doi: 10.1093/bioinformatics/btw029
Nguyen, K. H., Ha, C. V., Nishiyama, R., Watanabe, Y., González, M. A. L., Fujita, Y., et al. (2016). Arabidopsis type B cytokinin response regulators ARR1, ARR10, and ARR12 negatively regulate plant responses to drought. P. Natl. Acad. Sci. USA 113, 3090–3095. doi: 10.1073/pnas.1600399113
Pei, L. F., Lv, P. B., Chai, A. L., Shi, Y. X., Xie, X. W., and Li, B. J. (2016). Control effect of acidic electrogenic functional water on Cucumber root rot. China Plant Protect. 36, 22–24.
Pertea, M., Pertea, G. M., Antonescu, C. M., Chang, T. C., Mendell, J. T., and Salzberg, S. L. (2015). StringTie enables improved reconstruction of a transcriptome from RNA-seq reads. Nat. Biotechnol. 33, 290–295. doi: 10.1038/nbt.3122
Pu, Y. Y., Liu, L. J., Wu, J. Y., Zhao, Y. H., Bai, J., Ma, L., et al. (2019). Transcriptome profile analysis of winter rapeseed (Brassica napus L.) in response to freezing stress, reveal potentially connected events to freezing stress. Int. J. Mol. Sci. 11, 20–24. doi: 10.3390/ijms20112771
Rosli, H. G., Zheng, Y., Pombo, M. A., Zhong, S. L., Bombarely, A., Fei, Z. J., et al. (2013). Transcriptomics-based screen for genes induced by flagellin and repressed by pathogen effectors identifies a cell wall-associated kinase involved in plant immunity. Genome Biol. 14, 139–154. doi: 10.1186/gb-2013-14-12-r139
Rushton, P. J., Somssich, I. E., Ringler, P., and Shen, Q. X. (2010). WRKY transcription factors. Trends Plant Sci. 15, 247–258. doi: 10.1016/j.tplants.2010.02.006
Sakuma, Y., Liu, Q., Dubouzet, J. G., Abe, H., Shinozaki, K., and Shinozaki, K. Y. (2002). DNA-binding specificity of the ERF/AP2 domain of Arabidopsis DREBs, transcription factors involved in dehydration- and cold-inducible gene expression. Biochem. Bioph. Res. Co. 290, 998–1009. doi: 10.1006/bbrc.2001.6299
Schmidt, S. M., Houterman, P. M., Schreiver, I., Ma, L. S., Amyotte, S., Chellappan, B., et al. (2013). MITEs in the promoters of effector genes allow prediction of novel virulence genes in Fusarium oxysporum. BMC Genomics 14, 71–92. doi: 10.1186/1471-2164-14-119
Shah, J., Kachroo, P., and Klessig, D. F. (1999). The Arabidopsis ssi1 mutation restores pathogenesis-related gene expression in npr1 plants and renders defensin gene expression Salicylic Acid dependent. Plant Cell 11, 191–206. doi: 10.1105/tpc.11.2.191
Stein, U., Jürchott, K., Walther, W., Bergmann, S., Schlag, P. M., and Royer, H. D. (2001). Stein UHyperthermia-induced nuclear translocation of transcription factor YB-1 leads to enhanced expression of multidrug resistance-related ABC transporters. J. Biol. Chem. 276, 28562–28569. doi: 10.1074/jbc.M100311200
Stoesser, G., Griffith, M., and Griffith, O. L. (2014). NCBI (National Center for Biotechnology Information). Am. Cancer Soc. 4, 126–136.
Sucher, J., Menardo, F., Praz, C. R., Boni, R., Krattinger, S. G., and Keller, B. (2017). Transcriptional profiling reveals no response of fungal pathogens to the durable, quantitative Lr34 disease resistance gene of wheat. Plant Pathol. 67, 792–798. doi: 10.1111/ppa.12797
Tamura, K., Peterson, D., Peterson, N., Stecher, G., Nei, M., and Kumar, S. (2011). MEGA5: molecular evolutionary genetics analysis using maximum likelihood, evolutionary distance, and maximum parsimony methods. Mol. Biol. Evol. 28, 2731–2739. doi: 10.1093/molbev/msr121
Tu, M. Y., Zhuang, Q. G., Ma, F. X., and Chen, D. (2014). Comprehensive prevention and control technology of Pseudomonas syringae in autumn and winter. Nor. Horticul. 4, 112–112.
Ülker, B., and Somssich, I. E. (2004). WRKY transcription factors: from DNA binding towards biological function. Curr. Opin. Plant Biol. 7, 491–498. doi: 10.1016/j.pbi.2004.07.012
Verk, M. C., Bol, J. F., and Linthorst, H. J. M. (2011). WRKY transcription factors involved in activation of SA biosynthesis genes. BMC Plant Biol. 11, 89–89. doi: 10.1186/1471-2229-11-89
Wang, C. L., Wang, D. M., Huang, W., and Huang, C. F. (2000). Study on the relationship between the fusaric acid, β-1,4Glucoseidase activity and the pathogenicity of Fusarium oxysporum f.sp. niveum on watermelon. J. Xinjiang Agr. Univ. 1, 1–6.
Wang, D. M., Liu, L., Fan, L., Zou, Z. J., Zhang, L. N., Yang, S., et al. (2012). Expression level of DEK in chronic lymphocytic leukemia is regulated by fludarabine and Nutlin-3 depending on p53 status. Cancer Biol. Ther. 13, 1522–1528. doi: 10.4161/cbt.22252
Wang, X., Ajab, Z., Liu, C. X., Hu, S. M., Liu, J. L., and Guan, Q. J. (2020). Overexpression of transcription factor SlWRKY28 improved the tolerance of Populus davidiana × P. bolleana to alkaline salt stress. BMC Genet. 21, 103–103. doi: 10.1186/s12863-020-00904-9
Wei, K. F., Chen, J., Chen, Y. F., Wu, L. J., and Xie, D. X. (2012). Molecular phylogenetic and expression analysis of the complete WRKY transcription factor family in maize. DNA Res. 19, 153–164. doi: 10.1093/dnares/dsr048
Wu, L. T., Zhong, G. M., Wang, J. M., Li, X. F., Song, X., and Yang, Y. (2011). Arabidopsis WRKY28 transcription factor is required for resistance to necrotrophic pathogen, Botrytis cinerea. Afr. J. Microbiol. Res. 5, 5481–5488. doi: 10.5897/AJMR11.781
Xu, F., Chen, P., Li, H., Qiao, S. Y., Wang, J. X., Wang, Y., et al. (2021). Comparative transcriptome analysis reveals the differential response to cadmium stress of two Pleurotus fungi: Pleurotus cornucopiae and Pleurotus ostreatus. J. Hazard. Mater. 416:125814. doi: 10.1016/j.jhazmat.2021.125814
Yang, Z. M., Deng, C. H., Wu, Y. P., Dai, Z. G., Tang, Q., Cheng, C. H., et al. (2021). Insights into the mechanism of multi-walled carbon nanotubes phytotoxicity in Arabidopsis through transcriptome and m6A methylome analysis. Sci. Total Environ. 787:147510. doi: 10.1016/j.scitotenv.2021.147510
Yoda, H., Ogawa, M., Yamaguchi, Y., Koizumi, N., Kusano, T., and Sano, H. (2002). Identification of early-responsive genes associated with the hypersensitive response to tobacco mosaic virus and characterization of a WRKY-type transcription factor in tobacco plants. Mol. Genet. Genomics 267, 154–161. doi: 10.1007/s00438-002-0651-z
Young, M. D., Wakefield, M. J., Smyth, G. K., and Oshlack, A. (2010). Method Gene ontology analysis for RNA-seq: accounting for selection bias. Genome Biol. 11, 14–26. doi: 10.1186/gb-2010-11-2-r14
Yu, X. Y., and Zhang, Y. (2005). The development and breeding technology of Populus davidiana × P. alba var. pyramidalis. For. Sci. Technol. 6, 24–25.
Zeng, X. Q., Luo, X. M., Wang, Y. L., Xu, Q. J., Bai, L. J., Yuan, H. J., et al. (2014). Transcriptome sequencing in a Tibetan barley landrace with high resistance to powdery mildew. Sci. World J. 2014, 594979–594988. doi: 10.1155/2014/594579
Zhai, Z. H., Chen, X. N., and Wang, J. (2008). Primer design with Primer Premier 5.0. Northwest Med. Educ. 4, 695–698.
Zhang, M. Y., Li, W. Q., and Tang, L. X. (2012). Effects of chlorine dioxide on cucumber growth and Fusarium wilt control. China Vegetables 8, 80–84.
Keywords: Fusarium oxysporum tolerance, RNA-seq, pathogen-plant interaction, gene overexpression, genetic transformation, transcription factor
Citation: Diao J, Wang J, Zhang P, Hao X, Wang Y, Liang L, Zhang Y, Ma W and Ma L (2021) Transcriptome Analysis Reveals the Important Role of WRKY28 in Fusarium oxysporum Resistance. Front. Plant Sci. 12:720679. doi: 10.3389/fpls.2021.720679
Received: 04 June 2021; Accepted: 22 July 2021;
Published: 20 August 2021.
Edited by:
Giorgio Gambino, National Research Council (CNR), ItalyReviewed by:
Qari Muhammad Imran, Umeå University, SwedenYuanzhong Jiang, Sichuan University, China
Giulia Malacarne, Fondazione Edmund Mach, Italy
Copyright © 2021 Diao, Wang, Zhang, Hao, Wang, Liang, Zhang, Ma and Ma. This is an open-access article distributed under the terms of the Creative Commons Attribution License (CC BY). The use, distribution or reproduction in other forums is permitted, provided the original author(s) and the copyright owner(s) are credited and that the original publication in this journal is cited, in accordance with accepted academic practice. No use, distribution or reproduction is permitted which does not comply with these terms.
*Correspondence: Ling Ma, maling63@163.com; Wei Ma, mawei@hljucm.net
†These authors have contributed equally to this work