
Abstract
In order to improve the strength and work hardening capacity of high manganese steel, the effects of alloying elements on the stacking fault energy (SFE) and driving force of fcc→hcp transformation in Fe-Mn-C-Cr-Si high manganese steels were explored in detail. Based on the thermodynamic calculations, the Fe-0.6C-15Mn-(4,6)Cr-(0,3)Si (wt.%) steels were prepared to investigate the microstructure and mechanical properties. The calculated results show that the Cr reduces the SFE of Fe-C-Mn-Cr high Mn steels linearly and the reduction rate of SFE is greater as the C content increasing. With increasing the Si concentration, the SFE of Fe-C-Mn-Si steels decreases when the Mn content is higher than 18 wt.%. However, when carbon content is less than 1 wt.% and Mn content less than 18 wt.%, the SFE reaches to a maximum value and then declines with the increase of Si content. The combined effect of Cr and Si on the SFE of Fe-C-Mn-Si-Cr steels appears the similar behaviors to that of Si. Generally, the value of driving force, of fcc→hcp transformation in Fe-Mn-C-2Cr-Si (wt.%) steels increases with the increase of C and Mn and decreases with the Si content increasing. However, for 0.6 wt.% C and 7 wt.% Mn steels, the value of
  first increases and then decreases with the increase of Si content. The results of tensile test indicated that the Fe-15Mn-0.6C-6Cr-3Si (wt.%) high manganese steel demonstrates a better combination of the ultimate strength of 987 MPa, yield strength of 470 MPa, fracture elongation of 41.5% and high work hardening capacity because of the ε-martensitic transformation caused by the great
  (large negative value) and low SFE under stress.
Export citation and abstract BibTeX RIS

Original content from this work may be used under the terms of the Creative Commons Attribution 4.0 licence. Any further distribution of this work must maintain attribution to the author(s) and the title of the work, journal citation and DOI.
1. Introduction
Hadfield steels were delivered by Robert Hadfield in 1888 [1], also traditionally called high manganese steels. The traditional Hadfield steels have the typical chemical composition of 1.1–1.4 wt.% C and 10-14 wt.% Mn. After solution treatment and water quenched, the Hadfield steel can be composed of full austenitic microstructure which belongs to face centered cubic (FCC) crystal structure. It has been reported that Hadfield steels possess excellent strain hardening capacity (strength increment: ∼452–586 MPa [2–5], high toughness (Akv, 169 J) [2], good ductility (elongation: 28-50%) [2, 3, 5] and excellent abrasive wear resistance [6, 7], which makes them extensively applied in mining, mineral and coal crushing components [8–10], railroad crossings [11, 12], and dipper bucket teeth etc [13]. However, Hadfield steels exhibit good wear resistance only under the heavy stress because of obtained more significant work hardening effect, whereas the wear resistance will be reduced under the low load condition. Alloyed by Cr, Mo, Si, Al, Ti, V, N etc on the basis of traditional Hadfield steels has been considered to be a useful method to improve the yield strength and working hardening capacity at low stress condition [4, 14, 15].
It has been known that the excellent work hardening capacity of high manganese steels is mainly ascribed to deformation twins and slip-twin interaction [3, 5], dislocation slip accumulation [16, 17] and stress induced γ→ε transformation [18, 19]. The slip-twin interaction means that the twins boundaries formed under stress can act as obstacles to impede the dislocation slip. Increasing in twin boundaries results in the reduction of the mean free path of dislocation glide. As a result, the resistance of dislocation glide will be enhanced, resulting in great strain hardening [3, 5]. The contribution of dislocation slip to work hardening is related to the dislocation accumulation, which mainly results from interaction of dislocation slip with the interstitial atoms [16]. In addition, the dislocation walls formed by dislocation motion provide the obstacles to dislocation glide under the further deformation [16, 20]. The stress induced ε-martensite is also considered as strong obstacles to dislocation motion during deformation, leading to enhanced work hardening capacity [21].
The work hardening behavior in high manganese steels is dependent on the plastic deformation mechanism of steel. The previous works reported that the deformation mechanism is governed by the values of SFE of steels [22–24]. As stated by literatures [23, 24], when the SFE is below 18 mJ m−2, the ε-martensite is easy to form during deformation. The deformation twinning occurs in austenitic microstructure at the SFE between 18-45 mJ m−2, which corresponds to best hardening rate. If the SFE is more than 45 mJ m−2, the deformation behavior depends on dislocation glide. Therefore, the SFE is a critical physical parameter for deformation mechanism in high manganese steels. However, besides these SFE ranges, there are different values given by other literatures [22, 25–27] due to different chemical composition, deformation temperature and calculation model.
Stacking fault is an important crystal defect, which is formed by a perfect dislocation dissociating into two partial dislocations in the face-centered cubic (fcc) structure. As a result, the normal crystal stacking sequence on the (111) plane is disrupted [28]. The stacking fault energy (SFE) originates from the change in crystal stacking sequence and is related to the equilibrium separation distance between the two partial dislocations [29]. Therefore, as stated above, the SFE demonstrates an important role in the plastic deformation behavior in fcc alloys. In addition, the SFE also affects the driving force for γ→ε martensitic transformation in high Mn austenitic steel. The reason is γ→ε martensitic transformation relating to the movement of the partial dislocations in stacking fault [30].
The SFE is mainly influenced by the composition in steels, but the temperature has also an impact on the SFE in the austenitic steels [31–33]. In general, the SFE increases with the increase of temperature when the temperature is over Néel temperature due to the magnetic contribution decreasing to zero beyond Néel temperature [22, 34]. Thus, the contribution of chemical element to SFE is dominated. It was reported that the SFE increases linearly with the increase of C and N contents [35–40], whereas the increasing effect of N on SFE is less than that of C [38]. However, Lee [41] and Stoltz [42] indicated that the N addition reduces the SFE in the Fe-Mn-N alloys and Fe-Cr-Ni-Mn alloys, respectively. The work reported by Yakubtsov et al [43] indicated that the SFE presents a decreased trend only at low nitrogen contents in fcc iron-based alloys. The high N concentration (0.5 wt.%) enhances the SFE. Al addition in high Mn steel increases the SFE with an increment of 7 mJm−2 per 1 wt.% Al, leading to more stabilization of austenite [44–46]. Si can significantly enhance the strength of austenitic steels by solid solution strengthening effect. In addition, Si decreases the SFE of Fe-Mn-Si-C high Mn steels in the antiferromagnetic state [47]. However, according to thermodynamic calculation, it was reported by Dumay et al [44] that the SFE first increases and then decreases with the increasing Si content, the maximum value can be reached when the Si content is about 4 wt.%. Xiong et al [39] reported that the SFE in Fe-Mn-Si alloys firstly increased with the increase of Si content in the range of 13-17 wt.% Mn content and then kept a constant. But C addition in Fe-Mn-Si alloys reduces the SFE as Si is over 3 wt.%. With the increase in Mn content in Fe-Mn-Si alloys, the SFE linearly decreases with the increase of Si content. The influence of Cr on the SFE shows the different behaviors. Dumay et al [44] indicated that the Cr addition in Fe-22Mn-0.6C alloy linearly reduces the SFE. However, Wu et al [48] reported that the SFE increases with the increase of Cr content for Fe-17Mn damping alloy based on the thermodynamic calculation. The work reported by Lee et al [40] demonstrated that Cr linearly reduces the SFE of Fe-10Mn-xCr steels. However, as Mn concentration was over 15 wt.%, the SFE firstly increased with the increase of Cr concentration to a critical value and then slightly declined with Cr concentration further increasing. As stated above, the effect of Si and Cr on the SFE is considered depending on the Mn or C contents in the steels.
Recently, to improve the strength and wear resistance of traditional Hadfield high Mn steels, some alloying elements were added into the steels. Among these alloying elements, the Cr is usually adopted to enhance the strength by solid solution strengthening. However, traditional Hadfield steel contains the high carbon and high manganese, which has SFE value of about 23 mJ m−2 [12, 39] or 46 mJ m−2 [49] at 25 °C. The plastic deformation mechanism should correspond to deformation twinning and twinning/dislocation glide. Therefore, in order to enhance the strength and strain hardening capacity of traditional Hadfield steel, the present work adopted the thermodynamic model given by Cohen and Olson [50] to investigate the effect of alloying elements on SFE of high Mn steels, especially effect of combined addition of Cr and Si on the SFE. And according to the calculation results, the experimental steels were prepared. The microstructure, mechanical properties and deformation behaviors of experimental steels were investigated.
2. Experimental procedure
The experimental steels were prepared in vacuum induction furnace by using pure metals and the composition of the steels is given in table 1. The cast ingots about 20 kg in weight were homogenized at 1200 °C for 180 min, followed by forged into a billet with 65 mm width and 25 mm thickness. The specimens for microstructure and mechanical properties examination were cut from the billet. The solution heat treatment process was caried out at 1100 °C for 1 h and after that the solution treated specimens were quenched in water. The tensile tests were conducted using an electronic material testing machine (DDL100) with a strain rate of 1.7 × 10⁻³ s−1 at room temperature. The specimens for tensile test have a gauge length of 35 mm and a gauge diameter of 8 mm. The electron backscatter diffraction (EBSD) examination was performed to analysis the microstructure after deformation by a field emission SEM (FE-SEM, FEI Quanta 450, USA) with accelerating voltage of 20 kV, step size of 1 μm.
Table 1. Chemical compositions of the tested steels (wt.%).
| Steels | C | Mn | Si | Cr | Fe |
|---|---|---|---|---|---|
| Fe-0.6C-15Mn-4Cr-3Si | 0.60 | 15.0 | 3.0 | 4.0 | Bal |
| Fe-0.6C-15Mn-6Cr-3Si | 0.60 | 15.0 | 3.0 | 6.0 | Bal |
| Fe-0.6C-15Mn-4Cr | 0.60 | 15.0 | — | 4.0 | Bal |
3. Thermodynamic calculation of the SFE
Olson and Cohen [39] proposed in their work that the SFE in fcc crystal structure is considered commonly as intrinsic stacking fault energy. The intrinsic stacking fault can be produced by sliding of a single Shockley partial dislocation on a close packed plane {111} in fcc structure, resulting in formation of hexagonal close packed (hcp) crystal structure (ε phase) with two atomic layers in thickness. Based on stacking fault structure, the intrinsic SFE can be calculated by following formula proposed by Olson and Cohen [50]:

where  represents the intrinsic stocking fault energy, mJ m−2, ρ is the molar surface density along the atomic {111} planes in fcc crystal, which is determined by the equation (4)/(
 ), where
  is a lattice parameter of fcc structure and
  is Avogadro constant. Assuming that the lattice constant is independent of temperature, taking
  = 3.60 Å [51].
 is the molar Gibbs free energy difference for the γ(fcc)→ε(hcp) phase transformation and
  is the interfacial energy per unit area of the γ and ε phases boundaries.
According to the regular solution model, the term  in the equation (1) can
be expressed by the following equation [48]:

where  and
and are the molar chemical and magnetic free energy difference of γ to ε phase transformation, respectively.
  represents the free energy difference relating to the Suzuki effect between γ and ε phases.
  is usually ignored in the calculation of SFE due to very low value at 300 K [52].
  shown in equation (2) can be considered as the contribution of all the pure elements in alloys to the molar free energy difference of phase transformation from γ to ε phase. It can be indicated as follows [31]:

Thus, from the equations (3), (2) can be expressed as equation (4)

where  and
and  express the molar fractions of the pure alloying element i and j, respectively.
  is the molar free energy difference of pure element i in the γ and ε phases.
  indicates the excess free energy, which refers to the interaction energy between pure elements i and j.
Among the excess free energy contributions of all elements, the interactions between Fe and another element were merely considered owing to their more contributions to  The ternary and higher interactions of all elements can be ignored due to their minor effect on
 [53]. Therefore, according to the regular solution model, the
  of the present Fe-Mn-C-Cr-Si steels can be expressed as:

The magnetic free energy difference of γ to ε phase transformation  is magnetic contribution to
  due to the paramagnetic to antiferromagnetic transition of each phase, i.e., Néel transition. The magnetic free energy difference can be calculated using the following formula [40]:

where  and
and  are the magnetic contributions to Gibbs free energy of the γ and ε phases, respectively. According to model proposed by Inden [54], and modified by Hillert and Jarl [55],
  of each phase can be demonstrated as follows:


where R and T are the gas constant and temperature (K), respectively.  expresses the magnetic moment of phase φ divided by the Bohr magneton
  that is
 is the Néel temperature of phase
 is a polynomial function of
  which can be expressed by following equations according to the conditional statement [56].


where parameter p means the fraction of the magnetic enthalpy absorbed above the Néel temperature. The value of p is crystal structure dependent. For fcc and hcp phases, the value for p is 0.28. The value of magnetic moment  for pure elements can be expressed for γ phase by equation (12), in which the influence of carbon for magnetic moment is taken into consideration [44, 57].

where 
 and
and  are considered the empirical parameter values for the pure elements and the
  is second-order term.
  for ε phase of pure elements can be calculated by equation (13) proposed by Dumay et al [44].

The empirical equation for calculation of the Néel temperature as a function of composition for γ phase can be adopted according to the equation proposed by Zhang et al [58], as follows:

And for ε phase, the Néel temperature  is as follow [51]:

The thermodynamic data required for the calculations of the SFE were obtained from the literatures [39, 44, 51, 56, 57, 59]. Table 1 lists these thermodynamic parameters used in the present study.
As stated above, using the parameters in table 2 and related equations, the stacking fault energy (SFE) and the Gibbs free energy difference for the γ(fcc)→ε(hcp) phase transformation can be calculated by using equations (1) and (4) or (5).
Table 2. Thermodynamic function for calculating the SFE used in present study.
| Parameter | Function | References |
|---|---|---|

| −2243.38 + 4.309T (J mol−1) | [51, 59] |

| −1000 + 1.123T (J mol−1) | [59] |

| −22166 (J mol−1) | [59] |

| 1370-10T (J mol−1) | [44] |

| −560-8T (J mol−1) | [57] |

| 2873-717 ( ) (J mol−1) ) (J mol−1) | [59] |

| 2095 (J mol−1) | [48] |

| 2850 + 3520 ( ) (J mol−1) ) (J mol−1) | [51] |

| 42500 (J mol−1) | [39] |

| 26910 (J mol−1) | [39] |
4. Results and discussion
4.1. The influence of Cr and Si elements on the SFE
Figure 1 shows the SFE of Fe-Mn-C-xCr alloys as a function of Cr contents. As shown in the figure1, Cr element decreases the SFE significantly for alloys with different Mn and C contents. However, it is worth noting that the degree of SFE reduction is promoted by the increase of C content. Wu et al [48] reported that the SFE of Fe-17Mn-xCr alloys increases with the increase of Cr contents in the range of less than 12 wt.%. The previous result reported by Lee et al [40] indicated that the SFE of Fe-20-25Mn-xCr alloys without carbon or with 0.3 wt.% carbon increases with the increase of Cr contents until 20 wt.%, then SFE decreases as Cr content is more than 20 wt.%. The alloys with low Mn contents (less than 20 wt.%) exhibited declining trend of SFE with the increase of Cr contents. Therefore, it can be inferred that the effect of the Cr on the SFE of high Mn steels should depend on the C contents in alloys. Although the SFE of high Mn steels containing high carbon contents decreases faster with the increase of Cr contents, the SFE values is still higher than that of high Mn steels with low carbon contents.

Figure 1. Effect of Cr on the SFE of high Mn steels with different carbon contents.
Download figure:
Standard image High-resolution imageFigure 2 demonstrates the influence of Si on the SFE of steels with different Mn and C contents. As seen from the figure 2, the SFE exhibits different variation trend as a function of Si contents due to other alloying variation in steels. When Mn content is more than 18 wt.%, the SFE decreases with the increase of Si contents. However, for steels with 0.6 wt.% carbon and less than 18 wt.% Mn, such as 7 wt.% Mn steels, the SFE increases to a maximum value and then declines, whereas the SFE of the 13 wt.% Mn steels remains stable value and then begins to decrease as the Si content reaches about 3 wt.%, as shown in figure 2a. As exhibited in figure 2b and c, it is found that the SFE decreases dramatically against Si contents under the condition of the increase of C and Mn contents in steels. And the difference of SFE between the present steels becomes smaller with the increase of Si and C contents. For the steels containing 1.4 wt.% C, the SFE curves of steel with different Mn contents show an intersection at about 7 wt.% Si. According to the present results, it can be understood that the effect of Si on the SFE depends on the Mn and C contents in the steels.
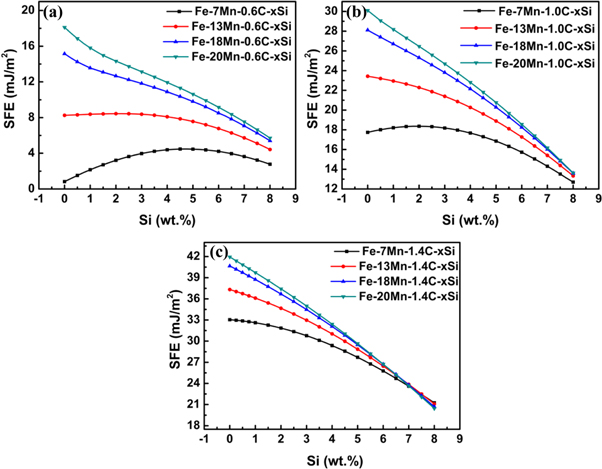
Figure 2. Effect of Si contents on the SFE of steels with different C and Mn contents.
Download figure:
Standard image High-resolution imageTo further understand the combined influence of Cr and Si on the SFE in high Mn steels, the SFE of steels with different Cr, Si and C contents was calculated. According to the calculated results, it is found that the SEF changing trend caused by Cr and Si is almost similar. Therefore, figure 3 only exhibits the calculated SFE of 0.6C (wt.%) and 1.4C (wt%) steels containing 2 wt.% Cr and 6 wt.% Cr as a function of Si contents. These results shown in figure 3 indicated that for the combined addition of Cr and Si in high Mn steel, SFE exhibits the similar change trend to the results shown in figure 2. It is suggested that SFE of steel containing Cr and Si in high Mn steels is mainly dominated by Si contents.

Figure 3. Effect of Si contents on the SFE of steels with different C, Mn and Cr (a), (b) 0.6C, (c), (d) 1.4C.
Download figure:
Standard image High-resolution imageAccording to the above calculated results, it can be summed that the carbon and manganese elements enhance the SFE of the high Mn steels, whereas Cr element decreases the SFE. However, the effect of Si on the SFE depends on Mn and C contents. The results demonstrate that the SFE decreases with increase of Si contents when the Mn content is more than 13 wt.%. Moreover, the SFE of 0.6 wt.% C steels containing less than 13 wt.% Mn increases with the increase of Si contents (<4 wt.%) and then decreases with Si contents further increasing. As for the high Mn steels containing Si and Cr, the SFE exhibits the similar changing trend to the effect of Si contents on the SFE.
4.2. The effect of composition on the driving force of γ→ε martensitic transformation
As demonstrated by equation (2),  presents the driving force of γ→ε martensitic transformation, which is composed of chemical free energy difference,
  and magnetic free energy difference,
  for γ and ε phases during martensitic transformation. Based on the results of the SFE presented above, the effect of multiple element additions in high Mn steels on the driving force of γ→ε martensitic transformation were calculated, here taking Fe-Mn-C-2Cr-xSi steels as an example. Figure 4 demonstrates that the relation of
 and
and  of Fe-Mn-C-2Cr-xSi steels with different C and Mn contents as a function of Si content. As exhibited in figure 4, the
  declines to zero gradually with the increase of Si contents. It means that the contribution of magnetic free energy difference to driving force of γ→ε martensitic transformation is nearly not existence with the increase of Si contents to about 3 wt.%. For low C steels containing 2 wt.% Cr,
  and
and  first increase and then decline with the increase of Si contents. The values of them are all negative in the range of Si contents adopted by present calculation. However, the value of driving force increases with the increase of C content in steels as Si content increasing. When the C content reaches 1.4 wt.%, the value of driving force shows the positive values, which means that the austenitic stability is enhanced and the martensite transformation becomes difficult.

Figure 4. Effect of Si-Cr combined addition on the driving force of Fe-Mn-C-2Cr-xSi steels with different C and Mn contents.
Download figure:
Standard image High-resolution image4.3. Strength and martensitic transformation of experimental steels
According to the SFE and driving force obtained by calculation, the Fe-15Mn-0.6C-4Cr, Fe-15Mn-0.6C-4Cr-3Si and Fe-15Mn-0.6C-6Cr-3Si steels were prepared to investigate the martensitic transformation and strength of present alloys. These steels can be simply denoted by 4Cr(0Si), 4Cr(3Si) and 6Cr(3Si), respectively. Figure 5 presents the engineering stress-strain curves and true stress-strain curves of experimental steels containing different Cr and Si contents. The corresponding strength and ductility are listed in table 3. The results indicated that co-addition of Si and Cr to steels significantly enhances the yield strength, which has a great increment with the increase of Cr contents. However, the ductility of steels is decreased by Si addition, which is reduced by about 60% compared with that of steel without Si, as exhibited in figure 5 and table 3.

Figure 5. Engineering stress-strain curves and true stress-strain curves of Fe-0.6C-(4,6)Cr-(0,3)Si steels.
Download figure:
Standard image High-resolution imageTable 3. Mechanical properties of the present steels.
| Steels | UTS (MPA) | YS (MPA) | EL (%) |
|---|---|---|---|
| 4Cr(3Si) | 855 ± 25 | 393±24 | 31.0±5 |
| 6Cr(3Si) | 987 ± 13 | 470 ± 28 | 41.5 ± 4 |
| 4Cr(0Si) | 992 ± 8 | 365 ± 26 | 74.8 ± 5 |
| Hadfield steel [2] | 869 ± 10 | 352 ± 5 | 28.8 ± 3 |
Figure 6 shows the strain-hardening rate of present steels. It can be seen from figure 6 that the strain-hardening rate of steels slightly increases with the increase of true strain until fracture. The Fe-15Mn-0.6C-6Cr-3Si steel has higher strain-hardening rate than those of other steels. It indicated that the co-addition of Cr and Si can improve the strain-hardening rate and the strain-hardening rate will be further raised by increasing Cr content.
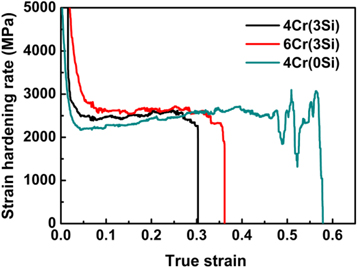
Figure 6. The strain-hardening rate of experimental steels.
Download figure:
Standard image High-resolution imageFigure 7 shows the fraction of different phases in steels with different Cr and Si contents after deformed by tensile deformation of 20% to confirm the existence of martensite induced by strain. According to the statistical results from the EBSD images, the fraction of ε-martensite is about 22%, 29% and 7% in Fe-15Mn-0.6C-4Cr-3Si, Fe-15Mn-0.6C-6Cr-3Si and Fe-15Mn-0.6C-4Cr steels, respectively. The high fraction of ε-martensite in Fe-15Mn-0.6C-6Cr-3Si steel can be ascribed to the large driving force (-174 J mol−1) and low SFE (5.7 mJ m−2), which also means that the γ→ε transformation of steel easily take place after plastic deformation. The  (K) of present steels was estimated by following equation (16) [27]. The
  is 122 K, 103 K and 109 K of Fe-15Mn-0.6C-4Cr-3Si, Fe-15Mn-0.6C-6Cr-3Si and Fe-15Mn-0.6C-4Cr steels, respectively. The driving force for γ→ε transformation,
  and SFE of experimental steels are given in table 4.


Figure 7. EBSD phase image of present steels deformed by 20% (a) Fe-15Mn-4Cr-3Si steel, (b) Fe-15Mn-6Cr-3Si steel, (c) Fe-15Mn-4Cr steel. In phase maps, red region denotes austenite, green region denotes ε-martensite.
Download figure:
Standard image High-resolution imageTable 4.

 and SFE of the present steels.
| Steels |
 (K) (K) |
 (J mol−1) (J mol−1) | SFE (mJ m−2) |
|---|---|---|---|
| 4Cr(3Si) | 122 | −155 | 7.1 |
| 6Cr(3Si) | 103 | −174 | 5.7 |
| 4Cr(0Si) | 109 | −122 | 8.8 |
| Hadfield steel [2] | −33 | 128 | 23.5 |
As exhibited in table 4, the steels only consist of austenite phase without formation of ε phase after solid solution treatment due to the  being below the 0 °C.
Therefore, it can be considered that the high strength of experimental steels can be attributed to two reasons: one is solid solution strengthening by Cr and Si [4], as the mechanical results shown in table 3. The increment of solid solution strengthening by Cr is greater than that of Si element. Another reason is more ε-martensite induced by strain. It was reported that work hardening rate is proportional to the ε-martensite content, which can act obstacles for dislocation motion, resulting in enhancement of the work hardening rate and the strengthening of the steel [2].
5. Conclusion
The SFE and driving force,  of fcc→hcp transformation in Fe-Mn-C-Cr-Si steels were calculated in this work. Based on the calculated results, Fe-0.6C-15Mn-(4, 6)Cr-(0, 3)Si high Mn steels were prepared and the fcc→hcp phase transformation and mechanical properties of tested steels were investigated to obtain the modified Hadfield steel with high strength and high work hardening rate. The conclusions obtained from the present work can be summarized as below:
- (1)The SFE of Fe-C-Mn-Cr high Mn steels linearly decreases with increase of Cr contents, which is independent of Mn and C contents. The reduction rate of SFE is great as the C content increasing. However, the value of the SFE is enhanced by increasing the Mn and C contents.
- (2)The effect of Si on the SFE of Fe-C-Mn-Si steels depends on the Mn and C contents. Only when Mn content is higher than 18 wt.%, the SFE of Fe-C-Mn-Si steels decreases with the increase of Si concentration, which is independent of C content. When carbon content is less than 1 wt.% and Mn less than 18 wt.% in steels, the SFE increases to a maximum value and then declines with the increase of Si contents. Generally, Si addition in steels decreases the SFE values of Fe-C-Mn-Si high Mn steels.
- (3)The combined effect of Cr and Si on the SFE of Fe-C-Mn-Si-Cr steels as a function of Si content appears the similar behaviors to that of Si. And the increasing Mn and C contents in steels enhances the reduction rate of the SFE against Si content.
- (4)The value of driving force
 of fcc→hcp transformation in Fe-Mn-C-Cr-Si steels increases with the increase of C and Mn contents and significantly decreases with the Si content increasing. And slightly decreases with increase of Cr contents. For the steels with low C and Mn less than 18 wt.%, the first increases and then decreases with the increase of Si contents.
 - (5)The Fe-15Mn-0.6C-6Cr-3Si steel possesses the high tensile strength of 987 MPa, yield strength of 470 MPa and good work hardening capacity due to large negative values of and low SFE, which promotes the ε-martensitic transformation under stress. The strength is higher than that of traditional Hadfield steel.


Acknowledgments
The authors are grateful for the financial support from the National Natural Science Foundation of China (No. 52003181), the Sichuan Science and Technology Program (No. 2021YJ0555), the Open Research Subject of Key Laboratory of Fluid and Power Machinery (Xihua University), Ministry of Education (No. LTDL2021-006) and the Opening Project of Material Corrosion and Protection Key Laboratory of Sichuan province (No. 2021CL16).
Data availability statement
All data that support the findings of this study are included within the article (and any supplementary files).