
Abstract
Ultrasonic additive manufacturing (UAM) is an advanced additive manufacturing technique that utilizes ultrasonic energy to rapidly joining thin metal tapes into solid parts in a layer accumulating manner. In this study, the effects of processing parameters on the bond properties of UAM samples were investigated via peel tests, linear weld density (LWD) measurements, microhardness tests and EBSD. The results reveal that, in terms of the overall tendency, the peeling strength and LWD increase with the increasing amplitude and normal force settings. However, a parameter threshold phenomenon and two different mechanisms that affect the bond properties were also observed. Furthermore, the microstructure evolution results show that the development of the interface is closely related to the applied parameters, which can also well explain the bond property variations and the parameter threshold phenomenon.
Export citation and abstract BibTeX RIS

Original content from this work may be used under the terms of the Creative Commons Attribution 4.0 licence. Any further distribution of this work must maintain attribution to the author(s) and the title of the work, journal citation and DOI.
1. Introduction
Ultrasonic additive manufacturing (UAM) is a novel solid-state freeform fabrication process that utilizes ultrasonic energy to merge similar/dissimilar metal tapes [1–8]. Metallurgical bonding can be achieved instantaneously between the metal tapes once the sonotrode rotates through. Cooperating with the computer numerically controlled (CNC) milling, workpieces or functional components can be fabricated directly [9–14]. However, the UAM mechanism, as well as the effects of processing parameters on the bond formation process, still remain not clearly understood.
It is well established that, ultrasonic amplitude, normal force and sonotrode speed are considered as the key parameters that are usually adjusted to determine the optimum manufacturing process in UAM [15–17]. The bond quality of an ultrasonically consolidated part is usually characterized by the bond strength and effective percentage of the bonded interface, which are evaluated by the peel test and linear weld density (LWD) measurement, respectively [18, 19]. Generally, higher amplitude, higher normal force and lower sonotrode speed can lead to the higher bond strength and higher LWD [20, 21]. Kulakov and Rack [16] revealed that the amplitude and normal force exhibited significant effects on LWD. They suggested that the LWD was controlled by the combination of multiple processing parameters rather than any single one. Ram et al [22] studied the ultrasonic consolidation process, and they suggested that the parameters that result in plastic flow is beneficial for the UAM process. However, there are still many argues on the relationship between the processing parameters and the corresponding bond quality. For example, Kong et al [23] found that low peel strength would be obtained for any amplitude setting at a low normal force. Also, a slight reduction in LWD might occur when the normal force increased to a relatively high level, which is called the parameter threshold phenomenon [15]. Ram et al [22, 24] suggested that a threshold could be reached when the material was subjected to be work-hardened, as which would raise the resistance of material flow. Li and Soar [25] investigated the influence of sonotrode texture on the bond quality of Al-3003 and found that a threshold of ultrasonic amplitude existed at the low texture sonotrode. They suggested that this threshold effect was due to the oscillation energy loss between the sonotrode and metal tape. Similarly, Schick et al [26] revealed that the threshold effect was most likely due to the lack of power delivering efficiency at higher amplitude and normal force level. To sum up, along with the investigations of the effect of processing parameters on the bond quality, the parameter threshold phenomenon has been constantly mentioned with many uncertain explanations.
Besides the peel test and LWD measurement, the microhardness test is also managed to evaluate the bond property of UAM built samples. Kong et al [21] reported that the bonding interface of Al-6061 had a higher microhardness compared with the surrounding regions, and suggested that the microhardness had a positive linear relationship with the bond strength. Schick et al [26] found that the average microhardness of the consolidated Al-3003 specimens was higher than the original tape. Wang et al [27] also observed that the microhardness attached to the interface edge was slightly increased. In contrast, Sriranman et al [28] found that the hardness values throughout the built sample were lower than the original material after UAM, which exhibited a uniformly softening phenomenon. Yang and Cao [29] reported a similar result that the bonding interface was softer than the raw metals. These conflicting findings in the microhardness variation during UAM process have many commons with the arguments associated with the parameter threshold phenomenon, and an in-depth explanation is still missing.
The microstructure of the bonded interface is also a key factor that used to characterize the bond properties. Mariani et al [30] observed significant grain size reduction within the bonding zone resulting from dynamic recrystallization during UAM. Sriraman et al [28] investigated the ultrasonic consolidation process of copper, and they suggested that the metallurgical bonding between the layers is due to the occurrence of recrystallization and the consequently movement of grain boundaries across the interface. Dehoff and Babu [31] characterized the interfacial microstructures of the ultrasonically consolidated Al-3003 blocks. They observed the recrystallization and grain growth across the interface and suggested that was due to the localized plastic deformation. Shimizu et al [32] also reported the observation of fine and equiaxed grains that were resulting from recrystallization at the bonded interface regions. However, the microstructure and texture evolution under various processing parameters is barely investigated.
The objective of this study is to reveal as much information as the metallurgical bonding developing under different levels of ultrasonic energy input via a systematic and comprehensive study on the effect of multiple parameters and processing conditions. To that end, the samples are fabricated under a considerably parameter range and multiple combinations. The peel strength, LWD, microhardness distributions and microstructure evolution results are obtained under various processing conditions. The effect of processing parameters on the bond quality and microstructure evolution has been thoroughly discussed. Furthermore, the relationship between the mechanical properties and microstructure evolution of the bonded interface has been also discussed.
2. Experimental procedures
In this study, the specimens were fabricated with a 9 kW UAM machine developed by Harbin Engineering University. As shown in figure 1(a), The ultrasonic generating mechanism is designed as a dual-transducers system. The rotating sonotrode is able to provide an amplitude range from 20 μm to 40 μm with 20 kHz frequency. The maximum normal force of this machine is 25 kN, and the maximum rolling speed of the sonotrode is 80 mm s−1. The commercial Al-1100 tapes with a thickness of 200 μm and a width of 24.5 mm were consolidated on Al-6061 substrates (170 mm (length) × 110 mm(width)). Samples fabricated with five layers of Al-1100 tapes were prepared for each process condition. The amplitude varied between 20 μm and 40 μm with a 5 μm increment. The static normal force was set to be 800 N, 1000 N, 1200 N and 1600 N, respectively. Weld speed was fixed at 25 mm s−1. The consolidation process was conducted at room temperature. Before fabrication, the Al-1100 tapes were cleaned by the alcohol-soaked non-woven fabrics to remove the surface contaminations, but no oxide layer disposal treatment was conducted. Figure 1(b) shows a picture of three ultrasonically consolidated Al-1100 specimens on a substrate.
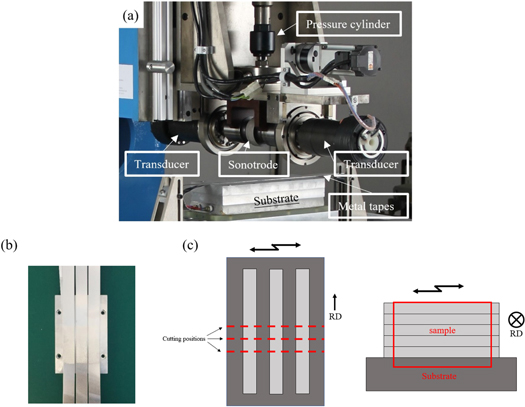
Figure 1. (a) Picture of the dual-transducers ultrasonic generating system; (b) Ultrasonically consolidated Al tapes on the substrate; (c) Schematic diagrams of sample positions cut from the as-fabricated specimens. RD: travel direction of the sonotrode.
Download figure:
Standard image High-resolution imagePeel tests were performed on an Instron 5500 R servo-hydraulic load frame in accordance with ASTM D3167. Figure 2 shows a picture of the peel test fixture apparatus. The peeling speed was set as 15 mm min−1. Repeated experiments for each parameter combination were conducted at least three times to ensure the data accuracy.
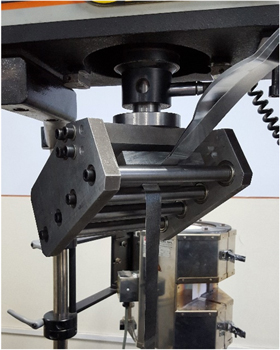
Figure 2. Picture of the peel test fixture apparatus.
Download figure:
Standard image High-resolution imageSamples prepared for the LWD measurement, microhardness test, and EBSD analysis were cut in the central region using an electrical discharge machine. Figure 1(c) shows the schematic diagrams of the cutting positions that were chosen from the fabricated specimens.
The linear weld density (LWD) is defined as the ratio of bonded area length to the total length of the interface [21]:

where Ld is the length of unbonded and defective areas, and L is the total length of the interface. The interface between the bottom layer and the substrate was not considered in this test.
Microhardness tests were conducted by a Vickers hardness tester using a 15 g load for 30 s. Figure 3 shows the schematic diagram of the testing points. The microhardness of each sample was measured from the edge of the substrate to the top of the third layer in the stacking direction with a 30 μm step.
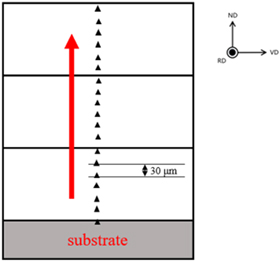
Figure 3. The schematic diagram of microhardness testing points.
Download figure:
Standard image High-resolution imageThe electron backscatter diffraction (EBSD) analysis was performed to study the microstructural evolution during the UAM process. EBSD observation was performed on a Hitachi S-3400N SEM equipped with an HKL-EBSD system operating at 20 kV. Samples were ground with silicon carbide paper through 800 grits to 3000 grits and polished to 0.5 μm with the Al2O3 paste. Afterward, vibratory polishing was conducted for 6 h. The step size of 0.429 μm was used. The bonding interfaces of samples were observed in cross-sectional views perpendicular to the rotating direction of the sonotrode (RD).
3. Results and discussions
3.1. The effect of processing parameters on peeling strength variation
Figure 4 shows the average maximum peeling load for the samples fabricated within the parameter ranges of 20–40 μm amplitude, 800–1600 N normal force, and 25 mm s−1 sonotrode speed. The maximum peeling load data were derived from the load-displacement results, which are recorded directly by the load frame. As shown in figure 4, the maximum peeling load increases significantly with increasing amplitude. The high slope of the load versus amplitude curve indicates a great positive effect of ultrasonic amplitude on the bond strength. However, when the applied amplitude raises above 35 μm, the growth trend of the maximum peeling load is largely weakened. Furthermore, despite of what reason causes the weakening of growth rate, it seems that this influence extends with increasing normal force. The 1600 N samples approached their highest peeling load at 30 μm amplitude, which indicates the amplitude threshold has been reached [23]. On the other hand, the effect of normal force on the maximum peeling load seems not as much as the amplitude provides. It can be seen that the 1000 N, 1200 N and 1600 N force curves intersect with each other within this processing parameter range, but an apparent gap has been observed between the 800 N curve and the other normal force curves (without considering the 1600 N curve after the threshold).
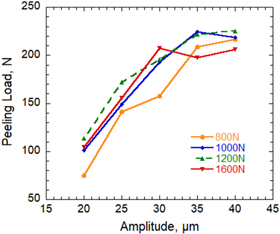
Figure 4. The maximum peel loads under various amplitude and normal force settings.
Download figure:
Standard image High-resolution imageFrom the results of peeling test as shown in figure 4, the parameter threshold phenomenon has been observed in two different forms. Firstly, extremely low normal force (≤800 N) usually induces in relatively low peel strength, i.e. the poor bond quality. However, when the applied normal force approaches a certain value, the influence of normal force becomes minor. Secondly, when the applied amplitude is too high, the strong positive effect of the amplitude is also largely weakened, which causes the saturation of the bond strength and reaches a plateau.
3.2. The effect of processing parameters on linear weld density (LWD) variation
Figure 5 shows a typical cross-section overview image of the UAM sample with five layers of Al-1100 tapes (dark region) on an Al-6061 substrate (light region). The length of the defects was measured for calculating the average LWD according to equation (1).
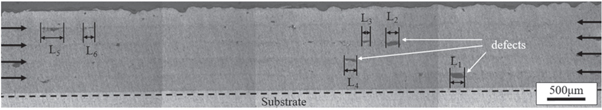
Figure 5. A typical cross-section of the five-layered sample. The lower dashed line shows the interface between Al-1100 tape and the substrate that was excluded from the LWD calculation. The single arrows indicate the locations of the interface.
Download figure:
Standard image High-resolution imageFigure 6 shows the average LWDs of the samples fabricated at the same parameter range as the peeling test. It can be seen that the variation of LWD has a lot in common with the peel strength results. Relatively high LWDs are obtained under the selected parameter range and approach the saturate value (∼95%) at 30 μm amplitude. However, the same parameter threshold still exists as mentioned in the peeling test section. Extremely low normal force (≤800 N) induces in relatively low LWD (∼90%). The gap of LWD between 800 N curve and the other curves is more apparent than that in the peel strength results, however, no apparent LWD loss with increasing amplitude under any normal force conditions. More importantly, the saturating amplitude approached earlier than that in the peeling test. The 1600 N curve reached its saturating LWD at 25 μm amplitude, while the 1000 N and 1200 N curves saturated at 30 μm amplitude [15].
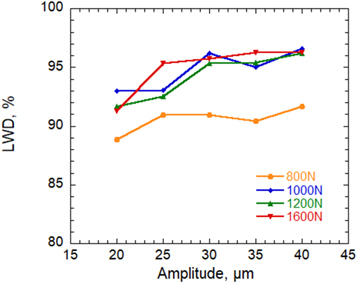
Figure 6. The average LWD results for the samples fabricated under various amplitudes and normal forces.
Download figure:
Standard image High-resolution image3.3. The effect of processing parameters on microhardness distribution
In consideration of the prior maximum peeling strength and LWD results, four typical processing conditions are employed to fabricate the samples for studying the effect of processing parameters on the microhardness variation. For a more concise presentation, the 25 μm amplitude is defined as the low amplitude (LA) condition, the 35 μm amplitude is defined as high amplitude (HA) condition, and the low normal force (LNF) and high normal force (HNF) conditions are referred in particular to the 1000 N and 1600 N normal force settings, respectively. Figure 7 shows the microhardness distribution maps of the samples fabricated under these four typical processing conditions. In each figure, the transverse dash line represents the microhardness value of original Al-1100 tape (40.1 HV). The longitude dash lines represent the approximate locations of the bonded interface (the Al-1100 tapes used in this study have a thickness of 200 μm).

Figure 7. The microhardness distribution results obtained under the four typical processing conditions (amplitude, normal force): (a) LA/LNF; (b) HA/LNF; (c) LA/HNF; (d) HA/HNF.
Download figure:
Standard image High-resolution imageAs shown in figure 7, very pronounced interface softening phenomenon was observed in all the tested samples which were fabricated under these four typical processing conditions. However, a uniformly hardening of the bulk and interface regions was observed in HA/LNF samples (figure 7(b)), which indicates the bulk region in each layer was affected by the large strain that introduced from the interfacial plastic deformation [23, 33]. As shown in figures 7 (a) and (c), except for the interface regions, the bulk regions of the Al-1100 tape still keeps their original hardness approximately. It indicates the plastic deformation only occurs at the interface region and only has a minor effect on the bulk regions under the LA/LNF and LA/HNF conditions [34, 35]. For the third case, as shown in figure 7(d), the softening area is much larger than figures 7(a) and (c), however, hardening has also been observed in some particular areas [36]. These results can be summarized as: (I) under the LA conditions, only the interface softening phenomenon was observed and the inside regions keep the same hardness as the starting material; (II) When the samples are fabricated under the HA/LNF condition, the built samples are uniformly strain hardened; (III) When the HA/HNF are applied, there are signs of both strain hardening and interface softening. According to the former studies [36], the severe plastic deformation occurred during the UAM process may induce residual stress at the interface region. However, the dynamic recrystallization and the additional adiabatic heating and friction heating are assumed to provide the driving force on the dislocations and misorientations that release internal stress [4, 37]. Therefore, it can be inferred that the softening and hardening during UAM is a dynamic process that significantly depends on the processing parameters.
3.4. The effect of processing parameters on microstructure evolution
The EBSD tests were performed around the bonded interface region of the third and fourth layer. The specimens were fabricated under the four typical processing conditions as applied in the microhardness tests. Figure 8 shows the inverse pole figure (IPF) maps of the bonded interface region. The grain orientation can be identified from the color scale and the black lines marked the high-angle boundaries in each figure. It is noted that the grains at the upper and lower bulk regions still keep originally elongated microstructures along the rolling plane. In the middle of each IPF map, the recrystallized fine and equiaxed grains are observed in the interface region of the samples fabricated under these four typical processing conditions. The difference in terms of the recrystallization range, grain morphology and textures indicate that the new developed microstructure is also strongly depended upon the processing conditions. The narrow and straight interface microstructure is observed in the samples fabricated under the HA/LNF and the LA/HNF conditions, as shown in figures 8 (b) and (c). In contrast, large and expanded areas of recrystallization are observed in the samples fabricated under the LA/LNF and the HA/HNF conditions, as shown in figures 8 (a) and (d). Furthermore, evident signs of plastic flow are found in the HA/HNF sample (marked by the curved arrow in figure 8(d)), which indicates the occurrence of intense relative movement and severe plastic deformation in the interface region [32, 34]. As shown in figures 8 (a) and (d), abnormally grown grains marked by the white arrows are observed between the bulk region and the recrystallized interface fine grains in the LA/LNF and HA/HNF samples, which are probably induced by the adiabatic heating during the development of metallurgical bonding [31, 38].
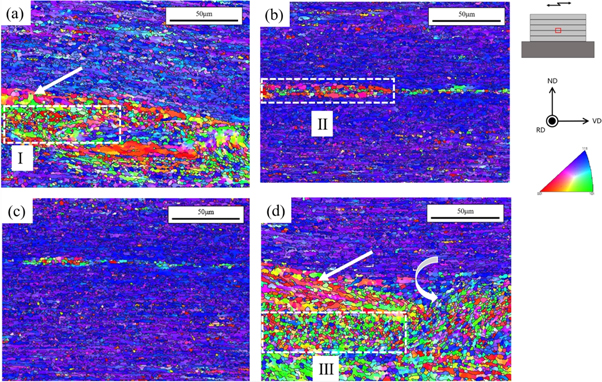
Figure 8. Inverse pole figure (IPF) maps of the bonded interface areas fabricated under three typical processing parameter combinations: (a) LA/LNF; (b) HA/LNF; (c) LA/HNF and (d) HA/HNF.
Download figure:
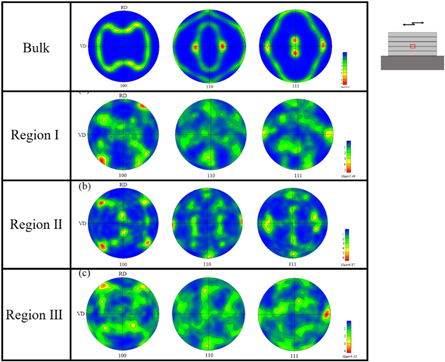
Standard image High-resolution imageFigure 9 shows the pole figures derived from the bulk region and the recrystallized interface regions (Region I, II, and III) that are enclosed by the white dotted boxes in figures 8 (a), (b) and (d). Unfortunately, the pole figure of the LA/HNF sample shown in figure 8 (c) is not presented with respect to the lack number of the recrystallized grains. The texture of the bulk region (shown in figure 9, Bulk) shows a typical {112}〈111〉 rolling texture that occurs commonly in the rolled Al alloys, which coincides with the processing technique of the raw material. The pole figures derived from Region I show the texture components that contain the rotated cube texture {100}〈110〉 and the brass texture {110}〈112〉. The pole figures derived from Region II show a strong texture component close to the rotated cube texture {100}〈110〉 that usually revealed as a typical texture retained from shear deformation. The {100} slip planes and 〈110〉 slip directions of grains lie on the plane as a result of the shear deformation that takes place between the upper and lower tapes [7, 32, 39]. Different from Region I, the pole figures derived from Region III show a dominating texture component of the brass texture {110}〈112〉, in which the rotated cube texture is absent or vanished. Additionally, the grown-up grains, which are observed only under the low amplitude/low normal force and high amplitude/high normal force conditions, show a strong R orientation {124}〈211〉 component [40]. It is evident that the recrystallization texture evolution is also closely related to the applied processing parameter conditions.
Figure 9. {100}, {110}, {111} pole figures derived from the bulk region and the selected areas, as shown in figure 8 (the white dotted boxes selected areas).
Download figure:
Standard image High-resolution image
3.5. The evaluation of bond quality in ultrasonic additive manufacturing
Accordingly, the bond quality of the fabricated UAM specimens is generally evaluated by these two commonly used methods [19]. Combining the results of peel test and LWD measurement, two key parameters can be obtained in the investigations of ultrasonic consolidation, which are the interfacial bonding strength and effective percentage of the bonded interface. Although these two methods represent two different evaluation properties, they have many direct relationships in estimating the bond quality. For example, low peel strength and LWD usually represent a poor bond quality. On the other hand, low peel strength generally accompanies with low LWD, but the inverse is not. As shown in figures 4 and 6, the low peel strength and LWD of the 800 N normal force samples indicate the poor bond quality under the extremely low normal force condition. If one only refers to the peeling test results, the evaluation of the bond quality of the 800 N samples would cause the deviation.
A simple model that depicts a bonded interface as made up by a finite number of micro-bonds has been accepted by many researchers in the study of ultrasonic consolidation [32, 34]. Thus, the peeling strength can be regarded as the resultant force of peeling each micro-bond off, and the LWD value scales the number of the finite micro-bonds in a cross-section. According to that, it is easy to figure out that a low peeling strength can be leaded by two factors: (1) a lower joining strength of each micro-bond, and/or (2) a smaller number of the micro-bonds. However, the LWD results are only concerned with the quantity of micro-bonds rather than their strength. This is the reason that a low peeling strength usually comes with a poor LWD, but not always conversely. Unfortunately, there is still no effective method to measure the joining strength of a single micro-bond or eliminate quantity influence, which makes it quite necessary to evaluate the bond property by comprehensive ways of methods. The microhardness variation and distribution in the tested samples can be used to reflect the bond strength referring to the strength of each micro-bond, especially when the difference between LWD is not significant. As shown in figures 7(b) and (d), very evident hardening and softening are observed in the tested sample fabricated under HA/LNF and HA/HNF processing conditions, respectively. For these two processing conditions, the obtained LWD is nearly the same, ∼95%, which are negligible. However, as shown in figure 4, the peeling strength of HA/LNF sample is much higher than the HA/HNF sample. It indicates that the microhardness variation can also significantly influence the peeling strength results. It is the reason that the 800 N samples have the extremely low LWD but high peeling strength at high amplitude conditions.
As shown in figure 8, according to the EBSD results, morphology of the recrystallization microstructure can be classified into two categories, the narrow and straight bonded interface with limited equiaxed grains, and the large area of recrystallized grains with apparent signs of plastic flow. Generally speaking, the latter type of recrystallized interface indicates an ideal metallurgical bonding interface in UAM [32, 41]. However, the results show that under the HA/HNF condition, the recrystallized microstructure results in lowering the maximum peeling strength and a large range of the abnormal grown grains, which might be also signs of reducing the bond quality. This can be seen as an overdeveloped interface state. When referring to the HA/LNF and LA/LNF conditions, as shown in figures 8 (b) and (c), these can be seen as the underdeveloped states. Under the HA/LNF condition, the high amplitude and low normal force result in excessive sliding friction at the interface rather than providing sufficient plastic deformation and plastic flow at the interface region. For the other case, under the LA/HNF condition, the low amplitude and high normal force also cannot provide sufficient driving force for plastic deformation and plastic flow at the interface region as a result of low ultrasonic energy input. In contrast, the LA/LNF condition seems to be able to provide a better interface condition than the higher parameters for metallurgical bonding. Furthermore, when combining the IPF results with the microhardness results, it can be found out that the variation of microhardness distribution and the microstructure evolution are also closely related. The wide range of softening areas usually indicates the sufficient or overdeveloped interface recrystallization. The obvious strain hardening of the whole bulk region usually indicates too much relative movements between the faying surfaces.
3.6. The effect of parameters interaction on the performance of UAM process
In UAM, each processing parameter plays a major role during this process. However, the appropriate parameter combination shows more significant influence on the bond properties as an integration effect on the performance of the UAM process. In the ultrasonic energy related studies, the ultrasonic vibration can induce several internal effects such as the ultrasonic heating [42] and the acoustic softening [43, 44]. Furthermore, the introducing of ultrasonic vibration into the pressureless sintering process has been also proven to enhance the local heating and accelerate the whole reaction process [45, 46]. It indicates that these unique and significant effects of ultrasonic energy can also react and be explored during the UAM process. However, as a rapid joining and manufacturing process, the primary goal in UAM is to merge the similar/dissimilar metal tapes by developing the metallurgical bonding at the faying surfaces. Thus, the normal force is necessary by supplying the sufficient contact pressure [32]. It is well established that the severe plastic deformation is the driving force for the dynamic recrystallization which relies on the sufficient shear stress and the intimate contact between the layers [22, 34]. Hence, it can be inferred that both the amplitude and normal force have the positive influence on the bond quality. However, it is evident that the ultrasonic amplitude and normal force also show the mutual restraint tendency according to the slip-stick transition mechanism [47]. During the UAM process, the ultrasonic amplitude act as the primary energy source, which introduces the shear stress and the ultrasonic internal effects. At the same time, the normal force creates intimate contact of the faying surfaces and promotes the transition from relative motion to a stick phase. As shown in former sections, when the amplitude and normal force settings are not compatible with each other, either the high amplitude/low normal force condition or the low amplitude/high normal force condition can lead to a poor bond quality and an underdeveloped recrystallized interface.
4. Conclusions
In the present study, the Al-1100 tapes with a thickness of 200 μm have been successfully consolidated with various processing parameter combinations via very high power ultrasonic additive manufacturing (VHP UAM). Thoroughly investigations were performed to reveal the effect processing parameters on the bond quality variation and microstructure evolution. The chief conclusions obtained are as follows:
- (1)Both the amplitude and normal force have positive effects on the bond quality on the premise of suitable combination. The combination of high amplitude and low normal force may tend to result in an unstable interface state, and the combination of low amplitude and high normal force may tend to result in insufficient driving force for metallurgical bonding.
- (2)The bond properties of the UAM specimens should be evaluated comprehensively. The results of peeling strength, LWD, microhardness variation and microstructure evolution are all the important factors for evaluating the bond property. Only considering part of them may lead to incomplete results.
- (3)The parameter threshold phenomenon was observed in two different forms. In the first case, when the normal force is extremely low, the sonotrode cannot provide sufficient contact pressure for generating superior metallurgical interface. In the second case, when the amplitude and normal force are too high, the overdeveloped recrystallized interface can lower the bond strength as a result of material softening.
Acknowledgments
The authors gratefully acknowledge the financial support of this study by the National Key Research and Development Program of China (No. 2020YFB2008503); the National Natural Science Foundation of China (No. 51671065); and Fundamental Research funds for the Central Universities (3072020CFT1003).