

Abstract
The importance of green water (moisture from rain stored in soils) for global food and water security is widely recognized, with process-based simulation models and field-level studies demonstrating its role in supporting rainfed agriculture. Despite this evidence, the relationship between green water anomalies and rainfed agriculture has not yet been investigated using statistical models that identify a causal relationship between the variables. Here, we address this gap and use disaggregated statistical regression (panel data analysis) at the 30 arc-min grid level to study the response of observed yields (1982–2010) of four main crops (maize, rice, soybean and wheat) to green water anomalies globally over rainfed areas. Dry green water anomalies (1 or 2 standard deviations below long-term average) decrease rainfed crop yields worldwide. This effect is more pronounced for wheat and maize, whose yields decline by 12%–18% and 7%–12% respectively. Globally, agricultural production benefits from wet green water anomalies. This effect is intensified in arid climates and weakened in humid climates where, for wheat, soybean and rice, periods of green water availability 2 standard deviations above long-term averages lead to declines in crop yield. This confirms existing evidence that excess soil moisture is detrimental to crop yield. These findings (1) advance our understanding of the impact of green water on rainfed food production and (2) provide empirical evidence supporting arguments for better management of local green water resources to reduce the impact of agricultural drought and waterlogging on rainfed crop production and capture the yield increasing effects of positive green water anomalies.
Export citation and abstract BibTeX RIS

Original content from this work may be used under the terms of the Creative Commons Attribution 4.0 license. Any further distribution of this work must maintain attribution to the author(s) and the title of the work, journal citation and DOI.
1. Introduction
Agriculture is under significant pressure. At least 800 million people are chronically undernourished, population growth and changes in consumption patterns are projected to increase global food demands, and climate change is already affecting agricultural production (FAO 2017). Against this backdrop, eradicating chronic food insecurity and malnutrition as part of the Sustainable Development Goals and meeting global food demands requires various measures to sustainably secure food supplies, including reduced food losses, diet change and yield gap closure (Kummu et al 2017).
Water resources are at the center of this food security challenge and improved farm water management is an important part of closing yields gaps (Jägermeyr et al 2016). Increased competition for scarce surface and groundwater resources (known as 'blue' water) limits the potential to expand irrigation (Strzepek and Boehlert 2010) and blue water depletion could cause the conversion of agricultural production from irrigated to rainfed (Elliott et al 2014). Climate change, through increases in hydro-climatic variability and extremes, will also pose challenges to agricultural production (Schmidhuber and Tubiello 2007, Porter et al 2014).
In this context, supporting rainfed agriculture and understanding its vulnerabilities to hydro-climatic variability are essential to ensure stability of food supplies under climate change (Cooper et al 2008, Rockström and Falkenmark 2015). Given the share of the world's smallholder farmers who rely on rainfed agriculture for their livelihoods, advancing our understanding of its vulnerabilities is also important to improve nutritional outcomes and livelihood opportunities for the rural poor (Rockström et al 2010). In addition, more stable rainfed agricultural production can reduce demand for irrigated production and allow for a reduction of irrigation water withdrawals, thus relieving pressures on scarce 'blue' water resources (Unver et al 2017).
Rainfed crop production depends on green water, which is here defined as moisture from rain stored in soils, following Rockström and Falkenmark (2015). Since the landmark work of Falkenmark and Rockström (Falkenmark and Rockstrom 2006), several studies have called for improved green water management—for instance through water harvesting and conservation tillage practices—to increase food security and improve rural livelihoods (Rockström et al 2007, Rost et al 2009, Sposito 2013, Rockström and Falkenmark 2015, Schyns et al 2019). So far, the importance of green water for crop yield has primarily been assessed using process-based simulation models, which dynamically reproduce processes affecting crop yields, and agronomic field studies.
Process-based crop simulation models have been applied to demonstrate that green water is the dominant source of water used in food production (Rost et al 2008, Rockström et al 2009a) and show that green water contributes about 90% of all water consumed by agriculture (Rost et al 2008, Liu et al 2009). Crop simulation models have also been used to assess the impacts of climate change and agricultural technologies on rainfed agriculture (Kang et al 2009, Calzadilla et al 2013, Rosegrant et al 2014). Siebert and Döll (2010) use a global crop water model to assess the amount of green water embedded in crop production, confirming the dominance of green water in agricultural water use worldwide. The relationship between crop yield and green water has also been studied in agronomic and field studies carried out in different parts of the world; for instance, in east and southern Africa (Rockström et al 2009b), China (Zhang et al 2004) and Spain (Lampurlanes et al 2016).
Despite this extensive body of work using process-based crop models, there is a limited understanding of the relationship between green water and crop yield using statistical models that are equipped to identify a causal relationship between the variables. While process-based crop models allow for attributing yield change to specific environmental factors, they are not directly based on observational data so they might not fully reflect yield responses under real-world conditions farmers face (Ortiz-Bobea et al 2019). Hence, integrating findings from crop models with evidence from statistical models can provide additional insights on the impacts of hydroclimatic variables on agriculture (i.e. they are complementary methods, see Lobell and Asseng 2017, Leng and Hall 2020). A number of studies have used statistical models to show the effects of rainfall variability and other hydroclimatic variables on agricultural production (Lobell and Asseng 2017, Damania et al 2017, Zaveri et al 2020). Ortiz-Bobea et al (2019) and Rigden et al (2020) improve upon previous statistical characterizations of the yield-water relationship by highlighting the critical role of soil moisture in explaining variation in US crop yields. In this paper, we provide, to our knowledge, the first global-level estimate of the sensitivity of rainfed crop yields to green water anomalies (deviations from long-term average green water availability) using statistical models. Compared to rainfall, green water is a more precise indicator of root-zone soil moisture available for uptake by plants and is thus a better indicator of water directly available for plant growth and its impact on crop production (Falkenmark 2013).
We use disaggregated statistical regression (panel data analysis) analysis to assess how much of the observed historical interannual variation in rainfed crop yield is associated with green water anomalies. This allows us to quantify where, and how strongly, maize, rice, soybean and wheat yields respond to green water anomalies. The findings shed light on the relative importance of green water anomalies, and thus green water management, on rainfed agricultural production.
2. Data
2.1. Green water data
Following previous studies (Rockström et al 2009a, Kummu et al 2014), we use model-based estimates from the Lund-Potsdam-Jena managed Land model (LPJmL) to quantify green water. The LPJmL model was forced with the PGMFD (Princeton's Global Meteorological Forcing Dataset) global reanalysis and observation dataset (Sheffield et al 2006), and the simulated green water data were accessed through the Inter-Sectoral Impact Model Intercomparison Project (ISI-MIP) portal. The process-based, dynamic global vegetation and water balance model LPJmL simulates green water consumption at a daily time step on a global 0.5° × 0.5° grid (Bondeau et al 2007, Rost et al 2008). LPJmL simulates green water consumption over both rainfed and irrigated lands. On rainfed areas, all consumed water is green water by definition so that green water consumption equals green water availability (Kummu et al 2014). On irrigated areas, the available green water is defined as total evapotranspiration minus the evapotranspiration of irrigation water (i.e. blue water). Thus, to isolate the effects of green water availability on rainfed crop yield and avoid taking into account the effects of irrigation (blue water), irrigated areas are not considered in this study (see section 2.2).
To study the effects of changes in green water on rainfed crop yield, we define a green water anomaly using annual green water z-scores for each gridcell, calculated over the time period (1982–2010). A dry (wet) green water anomaly in a given year occurs if green water availability in that year is at least one standard deviation lower (higher) than the long-term mean for that cell. Agricultural green water consumption refers to the water that is transpired or incorporated by the plant as well as the water that evaporates directly from the soil or leaves. Hence, a waterlogging situation can result in a positive green water anomaly due to increased availability of evaporative water. Values of −1 and 1 standard deviations are used as thresholds to define dry and wet anomalies respectively. We also examine the impact of more extreme dry and wet green water anomalies, defined using thresholds of −2 and 2 standard deviations respectively (i.e. an anomaly that is at least two standard deviations lower or higher than the long-term mean for that cell). Finally, we employ data on temperature at the grid level from Willmott and Matsuura (2001). While we do not focus on the impacts of temperature, we include it in the analysis in order to obtain unbiased estimates of the effects of green water anomalies as explained in section 3.
2.2. Rainfed crop yields
We use annual rasterized (0.5° × 0.5° grid) maize, rice, soybean and wheat yield (ton per hectare) data, GDHYv1.2, obtained from the Japanese Data Integration & Analysis System for years 1982–2010 (Iizumi et al 2014b). The crop yield data used here are based on country level agricultural statistics, which are downscaled to grid cells utilizing satellite-based net primary productivity estimates. This data set has already been used in several studies about crop yield variability (Iizumi et al 2014a, Iizumi and Ramankutty 2016, Iizumi et al 2018). Since the green water data from LPJmL (section 2.1) is mainly for a single growing season, we use crop yield data for the major growing season for maize and rice. For wheat, we use data for both spring and winter growing season, as they are mostly grown in different places, while for soybean, crop yield data is provided for a single growing season only.
To isolate crop yield data in rainfed areas, we mask the global crop yield data using information about rainfed and irrigated harvested areas from MIRCA2000 (Portmann et al 2010). To account for temporal changes in irrigated areas, we scale the proportion of irrigated harvested areas with information about changes (relative to year 2000) in all irrigated areas using Historical Irrigation Dataset (HID) (Siebert et al 2015), assuming no significant changes after year 2005, which is the last year of the data set. If the extent of annual irrigated crop specific harvested area was less than 10% of total harvested area, we consider the raster cell to be rainfed during that year. Figure 1 shows the resulting rainfed cropland on a global 0.5° × 0.5° grid for year 2000.
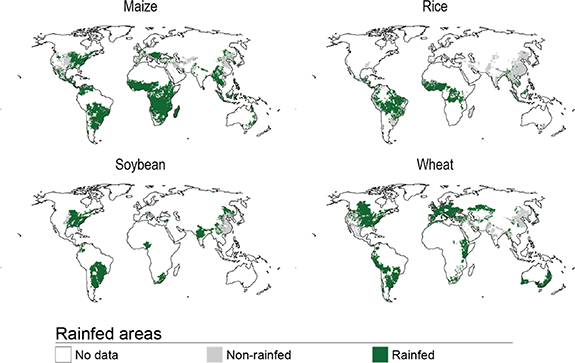
Figure 1. Global distribution of rainfed and non-rainfed maize, rice, soybean and wheat for the year 2000 based on data from Portmann et al (2010) and Iizumi et al (2014b).
Download figure:
Standard image High-resolution image2.3. Aridity classification
We complement the crop yield and green water data with information on aridity data of each gridcell. This allows us to classify grid cells depending on their aridity index and explore the sensitivity of crop yield to green water anomalies under different aridity conditions. To differentiate grid cells based on their aridity, we use the Global Aridity Index and Potential Evapotranspiration Climate Database (Trabucco and Zomer 2019). The aridity index represents the ratio of mean annual precipitation over mean annual potential evapotranspiration for the 1970–2000 period. We define three aridity classes, as shown in figure 2.
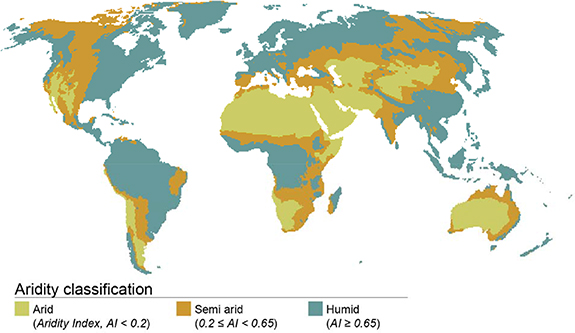
Figure 2. Aridity classification based on data from Trabucco and Zomer (2019).
Download figure:
Standard image High-resolution image3. Methods
We use panel data analysis (i.e. disaggregated statistical regression) to understand how green water anomalies impact rainfed crop yield of maize, rice, soybean and wheat under arid, semi-arid and humid moisture regimes. Panel data analysis is a statistical method to analyze the relationship between 2D data sets consisting of multiple observations (time series data on rainfed crop yield and green water in this case) recorded over the same sampling unit (grid cells in this case). Panel data analysis has been widely used to study the links between hydroclimatic variables and crop yields (Schlenker et al 2006, Dell et al 2014, Fishman 2016, Damania et al 2017, Blanc and Schlenker 2017, Zaveri and Lobell 2019, Ortiz-Bobea et al 2019) and also the impact of hydroclimatic variability on economic growth (Barrios et al 2010, Brown et al 2011, Hall et al 2014, Sadoff et al 2015, Khan et al 2017, Gilmont et al 2018, Russ 2020, Damania et al 2020).
Our method relies on the fact that green water anomalies (the independent variable) can be considered as exogenous with respect to crop yield (the dependent variable). This holds because following standard practice in the literature, the model includes cell-fixed effects that account for unobserved, time-invariant factors that are specific to each grid cell such as soil type or other time- invariant geographic and socio-economic characteristics. It also includes time fixed effects to account for any common trends such as economic or population growth. In certain specifications (see table S2 (available online at https://stacks.iop.org/ERL/15/124030/mmedia)), it also includes country-specific time trends to reflect the substantial variation in technological progress across countries as well as other country-level trends. In this way, the estimation is based on random deviations of green water from its long-term mean within each grid cell, which facilitates causal inference. In order to understand the impact of green water anomalies on crop yield, the analysis estimates a log-linear model in which the outcome variable is the logarithm of yield. We estimate the following equation:
where  is the log of rainfed crop yield in grid cell i in year t,
  (
( ) is a binary variable indicating if green water was at least 1 standard deviation below (above) the long-run mean in grid cell i and year t,
  are country-specific time trends,
  are the year fixed effects and
  are the grid cell fixed effects and
  is a vector of control variables which includes log of population, and a quadratic term for mean annual temperature (oC).
  represents the stochastic error term that captures variation in crop yield unexplained by the other factors in the equation. In order to obtain unbiased estimates of the effects of green water anomalies, we control for temperature. This is important since temperature has been shown to impact crop yield and the agricultural sector in general (Schlenker et al
2006, Schlenker and Lobell 2010, Zaveri and Lobell 2019). For each coefficient we estimate standard errors through the robust covariance matrix estimation to account for heteroskedasticity, serial correlation and cross-sectional dependence. To estimate the impact of extreme dry and wet green water anomalies, we modify this setup slightly so that
represents the stochastic error term that captures variation in crop yield unexplained by the other factors in the equation. In order to obtain unbiased estimates of the effects of green water anomalies, we control for temperature. This is important since temperature has been shown to impact crop yield and the agricultural sector in general (Schlenker et al
2006, Schlenker and Lobell 2010, Zaveri and Lobell 2019). For each coefficient we estimate standard errors through the robust covariance matrix estimation to account for heteroskedasticity, serial correlation and cross-sectional dependence. To estimate the impact of extreme dry and wet green water anomalies, we modify this setup slightly so that  (
( ) becomes a binary variable indicating if green water was at least 2 standard deviation below (above) the long-run mean in grid cell i and year t. Summary statistics for these variables are given in table S1.
4. Results and interpretation
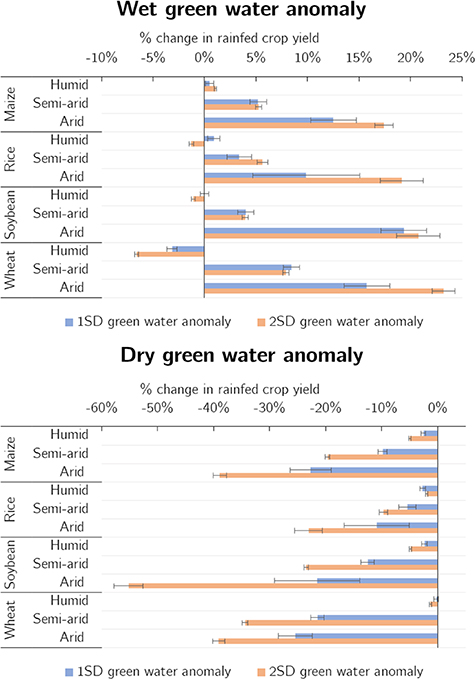
We examine where and by how much green water anomalies impact rainfed crop yields. At the global level, we find that rainfed crop yields increase in response to wet green water anomalies and decrease with dry green water anomalies across the four crops considered, as shown in figure 3. These effects are statistically significant for both wet and dry anomalies and are robust to alternate specifications, meaning that the significance of the impact and magnitude of the coefficient remains largely unchanged in the specifications (see table S2). Wheat and maize show the stronger sensitivity to both wet and dry anomalies compared to rice and soybean. This provides empirical evidence to support the arguments that green water deficit (i.e. agricultural drought) damages rainfed agricultural production and food security globally, and that additional soil moisture enhances crop yields (Rockström and Falkenmark 2015).
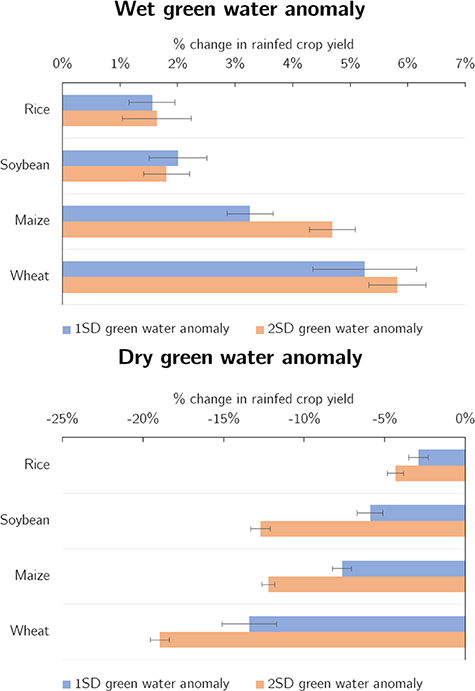
Figure 3. Impact of green water anomalies on crop yield, regression coefficients for wet (top) and dry (bottom) green water anomalies defined as 1 and 2 standard deviations (SD) above or below the long-run mean. Error bars represent 95% confidence intervals.
Download figure:
Standard image High-resolution imageThe effects of green water anomalies vary under aridity conditions. For all four crops, the negative effect of dry anomalies is weakened for the humid areas and intensified for the semi-arid and arid areas, as shown in figure 4 and table S3. Similarly, the effect of wet anomalies is greater for the arid and semi-arid areas. This suggests that additional green water is beneficial to crop yields especially in arid regions, which also explains the widespread use of supplementary irrigation in these areas. For the humid sample, we find a null or slightly positive effect of 1 standard deviation wet anomalies on crop yields except for wheat that shows negative effect (figure 4). When we examine extreme wet anomalies in humid regions (2 standard deviations above long-run mean), we find a negative effect on crop yields for wheat, soybean and rice. At first, this result may seem counterintuitive as increased soil moisture availability, and thus water uptake by plants, is anticipated to increase crop yield. However, excess soil moisture can have negative direct and indirect effects on crop growth in humid climates. Excess soil moisture (so a wet green water anomaly) can be directly damaging to crops because it creates anoxic conditions in soils, and it can also have indirect effects, increasing the risk of plant diseases and pests and delaying farmers' planting and harvesting activities (Rosenzweig et al 2002). These results are aligned with crop-specific findings in the literature which we discuss next.
Figure 4. Impact of green water anomalies on yields by crop and aridity class, regression coefficients for wet (top) and dry (bottom) green water anomalies defined as 1 and 2 standard deviations (SD) above or below the long-run mean. Error bars represent 95% confidence intervals.
Download figure:
Standard image High-resolution image
4.1. Maize
We find that dry green water anomalies have a statistically significant negative (decreasing) effect on rainfed maize yields globally (figure 3). When we disaggregate the results by aridity class (figure 4), we find that the negative (decreasing) effects of dry green water anomalies on maize yield are particularly pronounced in arid and semi-arid regions (23%–39% reduction in yields). Field studies from several arid countries confirm our finding that rainfed maize yield in arid areas is highly sensitive to below-average soil moisture levels (e.g. Rockström et al 2009b). In semi-arid parts of China, simulation studies demonstrate the impact of water shortage on rainfed maize, highlight the increasing importance of water as a limiting factor partly because of the shift to longer-maturing maize varieties and agronomic practices (e.g. plant density which increase water demand) (Meng et al 2016). Finally, our finding that dry green water anomalies negatively impact maize yields in humid climates is in agreement with statistical (Rigden et al 2020) and modelling (Andresen et al 2001) analyses from Midwest USA and also, Germany (statistical analysis from Peichl et al 2018), which both fall within our humid climate category (see figure 2).
4.2. Wheat
When green water is 1 standard deviation below the long-run mean, rainfed wheat yield decreases globally by 12%–15% (figure 3). This effect is larger in arid and semi-arid areas (figure 4), in agreement with Daryanto et al (2016)'s global synthesis, where wheat sensitivity to drought in arid areas is found to be greater than in humid areas. Given the low relative humidity and high potential evapotranspiration in arid areas, this finding is not surprising. As shown in figure 4, wheat also shows the lowest sensitivity to dry green water anomalies in humid areas across the four crops considered. This could be in part attributed to the differences in origin and traits between wheat and the other crops, such as maize. While maize is thought to originate from humid areas (Van Heerwaarden et al 2011), wheat originates from dry regions (Charmet 2011), and could thus show lower sensitivity to drought in humid regions (Daryanto et al 2016).
Globally, additional green water has a positive effect on rainfed wheat yields, with a 1 standard deviation wet anomaly increasing yield by 5% (figure 3). This is line with evidence suggesting that higher yields are obtained when wheat is irrigated (e.g. more than double under certain conditions, Cao et al 2014) or grown under soil moisture conservation practices (e.g. mulching in no-till fields, Rahman et al 2005, Guo et al 2019). However, the positive effect of excess green water is reversed in humid countries especially for extreme wet anomalies (2 standard deviations above the long-term mean) which reduce yield by 7% (figure 4). In humid regions, this effect is larger than the effect of droughts, suggesting that excess soil moisture is a key factor explaining rainfed wheat yield changes in areas such as the eastern USA and parts of South America. This latter effect is in agreement with other assessments of wheat sensitivity to hydroclimatic shocks; for instance, Zampieri et al (2017) using a statistical approach based on historical data found that excess water availability negatively affects wheat production in humid areas of the world.
4.3. Soybean
At the global level, soybean is sensitive to green water anomalies (figure 3). This confirms evidence from agronomic studies (Foroud et al 1993, Wijewardana et al 2018) and also crop models (e.g. Bhatia et al 2008) showing that soil moisture is a major factor limiting yield of rainfed soybean. Globally, a dry green water anomaly leads to soybean yield reductions between 6% to 12%, depending on the size of the anomaly. This confirms other statistical assessments of the effects of drought on observed soybean yields (e.g. Troy et al 2015, Leng et al 2016, Zipper et al 2016).
Additional soil moisture boosts rainfed soybean yields, as also suggested by field studies (Dass and Bhattacharyya 2017). However, in humid areas, when excess soil moisture is 2 standard deviations higher than the long-term average, yields show a modest (−1%) decrease. This confirms soybean sensitivity to water-logging, and can be explained by considering the direct and indirect effects of excess soil moisture on crop growth and farmers' decisions (e.g. delaying farmers' planting and harvesting activities) (Rosenzweig et al 2002, Rhine et al 2010).
4.4. Rice
Globally, rice shows the lowest sensitivity to green water anomalies among the four crops considered (figure 3). For both dry and wet anomalies in soil moisture, the magnitude of the effect on rainfed rice yield is similar, at about 2%. However, the magnitude of this effect increases sizably when we disaggregate the results by aridity (figure 4). In arid and semi-arid areas, agricultural drought reduces rice yields by 5%–23%, under a 1 and 2 standard deviation anomaly, respectively. This is not surprising because under rainfed conditions in arid and semi-arid climates (e.g. some parts of Nigeria and China for example) rice fields are intermittently flooded depending on water availability (Steduto et al 2012), making rainfed rice yield particularly sensitive to water deficit (Lilley and Fukai 1994, Pandey et al 2000). We also find that low soil moisture leads to declines in rainfed rice yields in humid areas, in agreement with findings from humid countries (e.g. observed data from Philippines in Stuecker et al 2018).
Unlike the other cereals considered in this study, rice grows well in paddy fields and is known to be tolerant to excess water. We find that moderate excess water (positive 1 standard deviation anomaly) has a positive effect on rainfed rice yields under all aridity conditions (figure 4). This positive effect is also observed for the 2 standard deviation positive anomaly, apart for humid areas, where it becomes negative. This suggests that, despite having tolerance for excess water, rainfed rice is still sensitive to excess green water in humid areas (i.e. severe waterlogging associated with floods). Potential mechanisms to explain this result include elongation growth during flash flooding which competes with maintenance processes requiring carbohydrates and energy, thus negatively affecting plant growth and survival (Ram et al 2002).
5. Discussion and conclusions
This study presents the first global statistical analysis of the effects of green water anomalies on observed crop yields for four major crops. The results show that dry green water anomalies (soil moisture deficit) have a statistically significant negative (decreasing) effect on rainfed crop yields globally. This effect is larger than that of wet green water anomalies, which globally have a positive (increasing) effect on yields. The analysis demonstrates the greater sensitivity of certain crops to green water variability, with wheat and maize showing the greatest sensitivity to dry green water anomalies and wet green water anomalies compared to soybean and rice. Excess soil moisture has a negative impact on rainfed wheat and soybean crop yields, highlighting the importance for research to focus not just on green water impacts under droughts but also under extreme wet conditions.
As all statistical assessments of the effects of hydroclimatic variables on crop production (e.g. Vogel et al 2019), our results hinge upon our data and methodological choices. The temporal resolution for the crop yield and green water data is growing season, which may be too low to model specific green water and crop growth relationships. This means that we are unable to understand if green water anomalies are only important during particular phases of the plant's growing season. We did not explore the sensitivity of crop yields to green water anomalies for specific stages of crop growth and for different crop growth processes, which are known to be important factors in determining crop yield responses (Siebert et al 2017a). To address these limitations, future research should seek to complement the empirical results presented in this study with process-based crop model simulations to differentiate among drivers (e.g. Heino et al 2018) and also test the effects of improved green water management practices and adoption of technologies on reducing crop yield fluctuations (e.g. Frieler et al 2017, Siebert et al 2017b). Advancing this understanding is a key to support efforts aimed at improving food security and incomes of the millions of people living in rainfed areas.
Our findings provide empirical evidence to support arguments that green water management is important for global food production and can enhance agricultural resilience to dry spells (Rockström and Falkenmark 2015). Measures to retain more water in soils (e.g. use of cover crops, no-till systems, soil water management practices such as terraces), thus artificially augmenting green water, would contribute to making rainfed crop production more stable in the face of green water deficit and agricultural drought (Basche et al 2016, Lampurlanes et al 2016, Kosmowski 2018). Despite the positive effects of these measures on yields (Rockström and Falkenmark 2015), their benefits often depend on a host of other factors and other measures such as crop rotation, residue retention, and aridity (Pittelkow et al 2015), which have to be considered when promoting green water management practices.
Acknowledgments
We acknowledge ISI-MIP for providing and sharing the green water data used in this study. MK received financial support from Strategic Research Council (SRC) through project 'From Failand to Winland', Emil Aaltonen foundation through project 'eat-less-water', European Research Council (ERC) under the European Union's Horizon 2020 research and innovation programme (Grant agreement No. 819202), and Academy of Finland funded project WATVUL (Grant No. 317320). MH was financially supported by Maa- ja vesitekniikan tuki ry, the Vilho, Yrjö and Kalle Väisälä Foundation and AaltoENG doctoral programme. We thank three reviewers for their comments which helped to greatly improve the paper. The processing scripts are available from: https://github.com/matheino/greenwater.
Data availability statement
The data that support the findings of this study are openly available at the following URL/DOI: https://github.com/matheino/greenwater.