Article

Tree Allergen Pollen-Related Content as Pollution Source in the City of Ourense (NW Spain)

by
Sabela Álvarez-López
,
María Fernández-González
,
Estefanía González-Fernández
,
Alejandro Garrido
and
Fco. Javier Rodríguez-Rajo
*
CITACA, Agri-Food Research and Transfer Cluster, University of Vigo, 32004 Ourense, Spain
*
Author to whom correspondence should be addressed.
Forests 2020, 11(11), 1129; https://doi.org/10.3390/f11111129
Submission received: 21 September 2020 / Revised: 14 October 2020 / Accepted: 22 October 2020 / Published: 23 October 2020
(This article belongs to the Special Issue Trees, Pollen and Allergies in Urban Areas)

Abstract

:
Allergies became a major public health problem, identified as an important global pandemic with a considerable impact on the worldwide economy. In addition, a higher prevalence of pollen Type I sensitization cases in urban environments in comparison with the rural territories was detected. Our survey sought to assess the main biological pollution episodes caused by the aeroallergens of the major allergenic tree species in urban environments. A Hirst-type volumetric device was used for pollen sampling and a Burkard Cyclone sampler for the detection of tree atmospheric allergens over two years. The main allergens of Alnus, Fraxinus, Betula, Platanus and Olea, were detected in the atmosphere. Three peaks of important pollen concentrations were recorded throughout the year. The developed regression equations between pollen counts and allergen proteins registered great R2 values. The number of days with probability of allergenic symptoms was higher when the pollen and allergen data were assessed altogether. Fraxinus allergens in the atmosphere were detected using Ole e 1 antibodies and the Aln g 1 allergens with Bet v 1 antibodies, demonstrating the cross-reaction processes between the principal allergenic proteins of the Oleaceae and Betulaceae families. Long Distance Transport processes (LDT) showed that pollen from Betula populations located in mountainous areas increased the secondary peaks of pollen and allergen concentrations, and air masses from extensive olive orchards of North-Eastern Portugal triggered the highest concentrations in the atmosphere of Olea pollen and Ole e 1 allergens.

Graphical Abstract

1. Introduction

An ongoing global intensification of the incidence of pollen allergy diseases over the last half century was observed [1]. Allergies became a major public health problem in the urban atmosphere of the industrialized and emergent countries, recognized as an important global pandemic with a considerable impact on the worldwide economy [1,2]. In Europe, it was estimated that 20% of the citizens suffer from pollen Type I sensitive reactions [3], which increased in the most developed countries with incidences above 30% [4,5]. In addition, a higher prevalence of pollen-related sensitization cases in urban environments in comparison with rural spaces was detected [6,7]. Among the possible causes that have enlarged the allergenic content in the air of the urbans areas, the “heat island effect” of the cities prompts an increase of plants’ pollen production and shifts pollen seasons to an earlier onset and lengthier durations [8]. Furthermore, urban atmospheric chemical contaminants favor a higher vegetal biomass growth and the increase of the allergenic protein content on pollen grains [9,10,11]. The greater occurrence and intensity of pollen allergic symptomatology in hypersensitized people during recent years was related with the increase of pollen production by plants [1,10]. Additionally, this situation is aggravated by the allergy problems derived from an inappropriate ornamental vegetation planning and design of green areas in cities [12]. The ornamental flora planted at gardens, parks or streets present a low biodiversity with a massive use of few species from the same families, mainly Oleaceae and Betulaceae in the case of Ourense, which can lead to cross-reaction processes between their allergens in sensitized people [12,13]. Besides the abovementioned, the assessment of pollen emissions from forestry or cultivations surrounding the urban environment should be also considered [14].
The most important allergenic taxa of the Ourense city, which constitute the 50% of the total of airborne pollen, are arboreal species from Alnus, Fraxinus, Platanus, Betula and Olea genus, which flower in winter and spring. Alnus glutinosa (L.) Gaertner is a widely represented tree in the riverside forests of Northern Spain. The pollen from alder causes the first occurrence of allergy symptoms along the year due to their major allergen Aln g 1 [15]. Alnus pollen type has been reported to be one of the main causes of pollinosis in Central and Northern Europe [16], with an increased rate of sensitization against their main allergen Aln g 1 during recent years [17]. In Northwestern Spain between 9% and 20% of hay fever sufferers are allergic to Alnus pollen [18]. Fraxinus angustifolia Vahl belongs to the Oleaceae family and is a tree largely extended in the North-Western Spain as natural species of river-bank vegetation [19] and as ornamental plants in green urban spaces [20]. In temperate zones of North and Central Europe the sensitization to ash pollen is a recognized problem, even more important than birch in some areas [21]. Around 18–34% of allergy sensitization rates can be attributed to the ash tree in Central Europe [22]. Fra e 1 is the main allergen for the ash sensible people [23]. Platanus hispanica Miller ex Münchh is the main source of the low biodiversity in urban areas since it is broadly planted as ornamental species in urban green areas and streets of the South European cities [24]. The plane pollen allergenic capacity has been attributed to the expression of their major allergen Pla a 1 [24]. Plane trees have an important allergological interest in Central and Southern European cities [16,25,26]. In Spain the prevalence of positive skin pick test varies from the 8–9% sensitized people in the Northern cities [27] to the 52–56% in Madrid [28]. Pollen from Betula pendula Roth represents one of the main sources of spring hay fever and asthma in Europe [29]. A study conducted in the Northwestern Spain noted that of 41.89% patients with a positive SPT (skin-prick-test) for Betula alba L. allergens, 10.75% were monosensitized [28]. Increases in allergen-specific therapy demand have been observed in years with Betula pollen in high concentrations [30]. The principal allergen of the birch pollen is the Bet v 1 protein [31]. In addition, it is demonstrated that people suffering oral allergy syndrome (OAS) showed oral symptoms before Betula pollinosis symptoms [32]. A large number of children are polysensitized to birch, ash and grass pollen in central Europe [33]. Important rates of olive pollen sensitization up to 29.7% of the allergic patients are recorded along the Mediterranean basin [34]. The northern limit of the olive tree distribution in the Iberian Peninsula is the Eurosiberian bioclimatic region where only 8% of the pollinosis people show positive effects to Olea pollen [35]. Common olive group 1 was the major allergen with 16-kDa [36]. The urban allergic population to the Betula and Olea pollen could display allergy responses in the winter months (as consequence of ash and alder pollen allergens), in the early spring because the Bet v 1 allergens or late spring due to Ole e 1 tree pollen related allergens.
The pollen concentration in the aerosol and their time-based sequence are the most traditional information offered for pollinosis patients [37]. Nevertheless, mismatches between the symptoms’ appearance and the period of pollen presence in the atmosphere were detected in recent years at different regions [38]. Allergy symptoms can be triggered even at low pollen concentrations, so that several investigations highlighted the assessment of pollen and aeroallergens as a necessary instrument to establish the actual airborne allergenic load [10,39].
Our study sought to evaluate the tree-related aeroallergen content as a source of pollution in urban atmospheres with the aim to assess the real load of allergens in the air and the causes of potential allergenic hazard episodes for sensitized people.

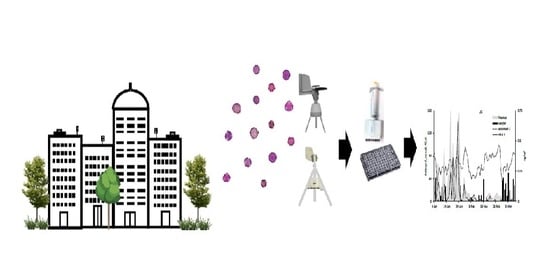
2. Materials and Methods

The research was conducted in the city of Ourense located in the North-Western part of the Iberian Peninsula, an altitude of 454 m a.s.l. and a geographical location 42°20′ N–7°52′ W. The climate of this area is described as Oceanic with Mediterranean features, with an annual average temperature of 14 °C and a total precipitation of 772 mm in a year [40].
Aerobiological sampling of tree pollen and allergens during the years 2017 and 2018 was conducted using two volumetric traps placed on the roof of the Science Faculty building, approximately at 15 m above the ground level and near to the town center. Pollen was monitored using a Hirst-type Lanzoni VPPS-2000 volumetric sampler (Lanzoni s.r.l., Bologna, Italy) [41] with a pressure flow rate of 10 L/min, simulating the human breathing. Melinex adhesive tape was used as a pollen grain capture surface. Pollen quantification was conducted applying the methodology proposed by the Spanish Aerobiological Network (REA) [42], based on four longitudinal transects along the slides. The Main Pollen Season (MPS) was stablished using the Andersen method [43], which defines the MPS as the period from the day 2.5% of total annual pollen concentrations were reached to the date when 97.5% is accomplished. The classification recommended by the REA [30] was followed to categorize the pollen concentrations, as well as for the calculation of the thresholds of allergy hazard. For the quantification of the allergenic fraction, a Burkard Multi-Vial Cyclone Sampler (Hertfordshire, UK) with 16.5 L/min of aspiration flow rate was used. The bioaerosol particles were sampled into Eppendorf vials every 24 h and analyzed with the Takahashi et al. method [44] modified by the Moreno-Grau et al. method [45]. The 2-site ELISA methodology was used for the quantification of the aeroallergen content in the bioaerosol samples in four steps [12,46]. The antibodies Ole e 1 and Pla a 1 (Roxall S.A) were used for the determination of the allergen content of Fraxinus, Olea and Platanus allergens, and the Bet v 1 specific monoclonal antibody (ALK-Abelló) was used to quantify the Betula and Alnus allergen content in the aerosol. The absorbance was measured at 492 nm.
Meteorological data were acquired from the Galician Institute for Meteorology and Oceanography METEOGALICIA “Ourense” station, placed at 300 m of the pollen and allergen samplers. The measured parameters were temperature (°C), relative humidity (%), precipitation (mm) and wind speed (km/h) (Figure 1).
Spearman’s non-parametric correlation test and Principal Component analysis (PCFA) were applied to evaluate the association between the pollen and the allergen concentrations in the air with the main weather parameters. A regression equation between the pollen and allergen data was conducted in order to obtain the aeroallergens thresholds and the amount of days with potential hazard of allergy prompted, both for pollen and allergens. The STATISTICA 7 program was used for the statistical analysis.
HYSPLIT back trajectories were assessed to study the daily pollen and allergen higher concentrations. The models led us to stablish the provenance (latitude, longitude and elevation) in the selected days of air masses using meteorological data at the 250, 500 and 700 m heights from the earth surface [47].

3. Results

Two periods of important tree pollen concentrations were recorded throughout the studied year (Figure 2). The first was consequence of the Alnus and Fraxinus blooms during January and February. The second, the quantitatively most important period, was mainly due to the pollination of Betula, Platanus and Olea during the spring months. The last period had a great impact on sensitization processes due to the flowering of trees with a high recognized allergy potential mainly in urban environments.
The occurrence of Alnus pollen in the Ourense atmosphere was observed from the second fortnight of January to the end of February. We registered a total airborne pollen of 2692 and 6368 pollen grains in 2017 and 2018, respectively, during a MPS with a length of 40 and 52 days. The highest alder pollen value was recorded on 24 January with 867 pollen/m3. The total annual integral of Aln g 1 was 9.200 ng and 7.386 ng in 2017 and 2018, respectively, with a peak observed on 1 February 2017 with 1.868 g/m3, one day after the pollen peak. Although both peaks were recorded during a period of lack of rainfall, the Aln g 1 peak was observed during an increase (2.5 °C) in maximum temperatures (Table 1, Figure 2). The Fraxinus flowering occurred from January to early March. A total amount of 563 and 1575 pollen grains were recorded in 2017 and 2018, respectively, during the flowering period, with a duration of 57 and 66 days. The peak pollen concentration occurred on 17 January 2018 with 160 pollen and the allergen peak was recorded on 23 January 2018 with 0.660 ng/m3, 6 days after the pollen maximum values. A period of rainfall absence and low temperatures coincided with the pollen and allergen maximums around 14.7 °C (Table 1, Figure 2).
The Betula pollen was detected in the atmosphere from the second fortnight of April until the first of May with a short MPS of 33 and 28 days in 2017 and 2018, respectively. The total airborne pollen was 3103 and 8397 pollen grains in 2017 and 2018, respectively, recording the pollen peak on 25 April 2018 with 1283 pollen/m3. The annual integral of Bet v 1 allergen was 9.513 ng and 8.354 ng in 2017 and 2018, respectively, with a maximum concentration of 0.925 ng/m3 on 19 April 2017. Both peaks are coincident with a period of rainfall absence; however, the Bet v 1 peak also coincided with a maximum temperature rise (from 22 °C on 14 April to 27 °C on Bet v 1 peak day) (Table 1, Figure 2). The Platanus MPS was also short from early April to early May. The seasonal plane pollen integral varies from 7290 in 2017 to 5399 in 2018, with a pollen peak registered on March 29th where 1549 grains/m3 were registered in 2017. A total of 13.927 ng and 5.072 ng of Pla a 1 were detected during 2017 and 2018, respectively, in the atmosphere, and the maximum concentration was identified on 21 March 2017 with 1.157 ng/m3. Both peaks coincided with the presence of precipitations and a decline of the maximum temperature around of 17 °C (Table 1, Figure 2).
The Olea flowering took place from the latest May until early July with a MPS length of 32 and 41 days in the two years of study. Wide variations in the annual pollen and allergen integral were detected between the two years of study with an amount of 1389 and 233 pollen grains and 0.604 ng 0.117 ng in 2017 and 2018, respectively. During the year 2018 both maximum allergen and pollen diurnal peaks were detected in the same day, whereas in 2017 with a difference of 15 days (Table 1, Figure 2).
With the aim of determining the effect of the meteorological parameters in the pollen and allergen airborne content, a non-parametric Spearman’s correlation test was conducted. Generally, spring-flowering trees showed positive correlations between airborne pollen and allergen concentrations and temperature, and negative with relative humidity (p < 0.01) (Table 2). Overall, the highest significant correlation coefficients were obtained among the allergen or the pollen and the average temperatures, with the greatest positive degree of association for the Olea pollen and the Ole e 1 allergen (p < 0.01). In addition, negative significant correlations between pollen concentrations with mean, maximum and minimum temperatures and positive with relative humidity were recorded with Alnus and Fraxinus pollen, as well as with Aln g 1 and Fra e 1 allergens, the winter bloom trees. For the rest of the studied parameters, we obtained positive significant correlations between pollen and allergens of Betula, Olea and Platanus and wind speed (Table 2).
Furthermore, a principal component analysis (PCFA) was conducted with the aim to better understand the meteorological influence in the pollen and allergen airborne concentrations as PCFA showed the influence of all consider weather variables as a whole. The purpose of the analysis is to obtain a small number of linear combinations of the selected variables which account for most of the variability in the data. Three components have been extracted for each taxon, since they had eigenvalues greater than or equal to 1.0 and they account for together between 79% and 84% of the variability in the original data. The three PCs were correlated as follows: Component 1 temperatures and relative humidity, Component 2 pollen and allergen values and Component 3 wind speed and rainfall (Figure 3). To better understand the relationship between pollen/allergens and meteorological parameters, a plot with the PC explaining the higher variability PC1 vs. PC2 was conducted (Figure 3). The results obtained reinforced the correlation analysis results registering a high positive degree of association between the pollen counts and the allergen levels (Figure 3).
The Pollen Allergen Potency (AP) index was calculated for each taxon, which represented the rate between the allergen and pollen grain concentrations. The highest value was 0.004 ng/pollen registered for Fraxinus and the lowest for Olea with 0.0004, both during the first year of study (Table 1).
Regression equations were performed to identify the aeroallergen thresholds for low, moderate and high hazard of symptomatology appearance on sensitized people (Table 3).
The pollen threshold concentrations suggested by the REA were followed to obtain the equivalent aeroallergens thresholds (Table 4). Values of the adjusted R2 coefficients in the performed equations oscillated between 0.289 for Alnus and 0.737 for Olea (Table 3) The obtained thresholds were applied in order to ascertain the number of days with possible allergy hazard for sensitive patients. Considering the pollen data, the taxa that registered a higher quantity of days with moderate potential hazard for allergenic suffers were Alnus and Platanus with a sum of 22 and 27 days in both years, respectively (Table 4). In the case of the allergen airborne moderate levels, the great amount of days was registered for Platanus and Betula with a total of 30 and 31 days, respectively, during the two years of study (Table 4). Some discordances were also observed in the case of the episodes of high potential hazard on sensitive patients. Alnus and Betula registered the most important quantity with a sum of 55 and 58 days detected for the Aln g 1 and Bet v 1 allergen concentration during the period of the study (Table 4).
Furthermore, a back-trajectory analysis was conducted to explain the timing discrepancies observed between the pollen and allergen peaks for all taxa. Only special situations were observed in the case of Betula and Olea (Figure 4). The analysis led us to detect that the second pollen and allergen Betula peaks were coincident with air masses from the high mountainous areas around the city of Ourense. In the case of Olea and Ole e 1, the pollen and allergen maximum peaks were influenced by continental air masses coming from the North of Portugal (Figure 4).

4. Discussion

The occurrence of pollen grains in the atmosphere was recognized as a cause of important pollution problems such as allergies to human health [48]. The most important tree allergenic taxa of the city, which constituted the 50% of the total of airborne pollen, were studied to determine their importance in the atmospheric allergenic load. Regarding the pollen season, Alnus and Fraxinus are arboreal species that flower in winter whereas Betula, Olea and Platanus with spring flowering. Several studies reported similar findings for Alnus in the same area and for other countries regarding the start, end date and duration of the MPS, but with differences in the total amount of annual pollen [10,49,50]. Some authors found that meteorological parameters, as mean temperature during the previous months to pollination, affect the annual airborne pollen sum [51]. We registered a shorter birch pollen season duration with higher total pollen amount than those reported by several studies for the same area [10,49] or in other European countries like Portugal [47], Poland [51], Sweden [52] and Romania [53]. In the case of Olea, a similar MPS duration was registered regarding the reported by studies carried out in the same area [54] or in Portugal [47,55]. However, longer MPS with higher pollen number was observed in Mediterranean areas because of the olive crops [56].
The classically information for hyper sensitized patients is the concentration of pollen grains in the atmosphere and their timing [24]. Nevertheless, in the last years the period of pollen exposure often did not coincide with the symptoms’ appearance in different regions [16,25]. In the present study we detected a high atmospheric allergenic load [10] in the atmosphere coinciding with low levels of airborne pollen because the presence of pollen allergens in the air. Although pollen allergens are firstly carried in the atmosphere by pollen grains [37], they may also could be detected in the microaerosol suspension which could remain for longer periods in the atmosphere [57]. Our results reinforced the fact that pollen concentration data must be combined with the aeroallergen detection in order to determine the real load of atmospheric allergenic particles and the development of complete and lasting systems aimed to observe and gather environmental pollution information [11,47]. In spite of regression equations between pollen counts and allergen protein registered high R2, several discordances were detected between the days of aeroallergen and pollen allergy risk, as in some cases did not coincide. Considering both together, the Alnus pollen and allergen data, the number of days with high allergenic hazard raised to 64 compared with their assessment separately. For Fraxinus, when the pollen and allergen concentrations were combined, the number of episodes with potential hazard raised to 16 for high risk of symptomatology appearance. Additionally, lower discrepancies were observed in the case of Platanus and Betula as the number of days with high potential hazard of allergy increased to 34 and 59, respectively, when the pollen and allergen data were considered together. No differences were observed in the case of Olea. The developed innovative tools for quantification of the atmospheric allergenic load are especially useful and necessary for complementing the classic pollen counts to attain an improvement and optimization of the clinical allergy treatments administration and a decrease in medication consumption by the sensitized-to-pollen population [11,47]. The establishment of new periods of allergen presence in the atmosphere will highlight novel perspectives in the epidemiological study of respiratory allergy-related disorders and the biological pollution.
In addition, a great prevalence of pollen related incidence of allergy in urban environments compared with the rural areas was detected [6]. It is noteworthy that the allergy incidence was prompted by an inaccurate planning and design of the urban tree vegetation, with several plants of the same family that can develop cross-reactions processes between their allergens, enhancing sensitizations in sensitive people [12]. One of the major results of our study was the detection of the Fraxinus and Alnus pollen related allergens in the air by using antibodies from another genus. This finding evidences the cross-reactivity between the principal allergens of the Oleaceae and Betulaceae tree families, referred as the capacity of several IgE antibodies to recognize diverse antigens [58]. Due to their resilience and tolerance to adapt to urban conditions, both tree families are broadly planted as tree ornamental vegetation in green areas of urban settings [59]. The urban allergic population to the Betula and Olea pollen could display allergy responses in the winter months (as a consequence of ash and alder pollen allergens), in the early spring because the Bet v 1 allergens or late spring due to Ole e 1 tree pollen related allergens. Some authors pointed out that the people with oral allergy syndrome (OAS) showed oral symptoms before Betula pollinosis symptoms [32], and this symptomatology may lead to people think that with a lower concentration of Bet v 1 allergen there are symptoms. Patients allergic to birch have previously suffered from the symptoms during the flowering of the alder, which is known as priming effect.
Moreover, Long Distance Transport processes (LDT) could also justify that airborne pollen concentrations are not always related with the actual exposure to their main allergens [60,61]. In the case of Betula, the first peak of the pollen curve matched with the flowering of the birch populations in the surroundings of the city, whilst the secondary was registered when the nearest Betula tree had finished its flowering period [62]. Topographical characteristics must also be taken into account when considering pollen transport. The HYSPLIT models showed that pollen originating from Betula populations located in mountainous areas even at some distance from the city, which flowers some weeks later due to its higher altitudinal distribution, could be transported through the channels formed by the river crossing the Ourense city, increasing the secondary peaks of pollen and allergen concentration. During the year 2017, the second peak pollen potency seems higher compared to the first peak, possibly related to a possible transport of high-potency birch pollen from the most elevated areas of the region, as it was observed for the olive pollen in South of Europe [60]. In addition, the back trajectories during the maximum concentrations of olive and Ole e 1 in the air noticed the influence of the air masses from the widespread olive orchards of North-Eastern Portugal in the amount of olive related bio particles in the atmosphere. Betula and Olea pollen morphology favors its transport over medium or long distances [60,63,64].
The analysis of the main meteorological variables, pollen and aeroallergen concentrations showed different results depending on the taxa. In the spring flowering trees, a statistically significant positive correlation between pollen or allergen occurrence and temperature [54] and wind speed was observed. On the contrary, the association degree was positive with relation to humidity in the case of the winter flowering trees and negative with temperatures, which presented negative correlations with temperatures. Therefore, weather-related factors, such as mild temperatures, influenced the dispersion of spring and fall pollen and allergens, as previously described by other authors [10,65,66].

5. Conclusions

The major allergens of Alnus, Fraxinus, Betula, Platanus and Olea were detected in the atmosphere of the Ourense city. Two peaks of important pollen concentrations were recorded throughout the year. One of the major findings of our study was the detection of the Fraxinus and Alnus pollen related allergen proteins in the air using antibodies from another genus, demonstrating the cross-reactivity processes between the principal allergenic proteins of the Oleaceae and Betulaceae families. The developed regression equations between pollen counts and allergen proteins registered high R2 values. We observed high atmospheric allergenic load in the atmosphere coinciding with low levels of airborne pollen because of the presence of pollen allergens in the air. The number of days with a moderate and high hazard of allergy was higher when the pollen and allergen data were assessed together. Considering the pollen data individually, the number of episodes of high allergy symptomatology hazard were understated. The combination of pollen and allergen information should be evaluated to ascertain the real biological pollution in the atmosphere and the actual potential risk episodes for the sensitized population. Long Distance Transport processes (LDT) also explain that airborne pollen levels could not appropriately represent the exposure to their main allergens. The applied back trajectory analysis showed that pollen from Betula populations located in mountainous areas increased their secondary peaks of pollen and Bet v 1 concentrations and southern air masses from intensive plantations caused the highest airborne Olea concentrations.

Author Contributions

Conceptualization, F.J.R.-R. and M.F.-G.; methodology, F.J.R.-R. and M.F.-G.; software, E.G.-F. and A.G.; validation, S.Á.-L., F.J.R.-R. and M.F.-G.; formal analysis, S.Á.-L., F.J.R.-R. and M.F.-G.; investigation, S.Á.-L., F.J.R.-R. and M.F.-G.; resources, E.G.-F. and A.G.; data curation, S.Á.-L., E.G.-F. and A.G.; writing—original draft preparation, S.Á.-L., F.J.R.-R. and M.F.-G.; writing—review and editing, S.Á.-L., F.J.R.-R. and M.F.-G.; visualization, F.J.R.-R.; supervision, F.J.R.-R.; project administration, F.J.R.-R.; funding acquisition, F.J.R.-R. All authors have read and agreed to the published version of the manuscript.

Funding

This research received no external funding.

Acknowledgments

Partnership (ED431E 2018/07) and BV1 research group (ED431C 2017/62-GRC) and the grant number AGL2014-60412-R of the Economy and Competence Ministry of Spain Government. González-Fernández E. was supported by the FPU grant from the Ministry of Science, Innovation and Universities, Spain (FPU15/03343).

Conflicts of Interest

The authors declare no conflict of interest.

References

  1. Damialis, A.; Traidl-Hoffmann, C.; Treudler, R. Climate Change and Pollen Allergies. In Biodiversity and Health in the Face of Climate Change; Marselle, M., Stadler, J., Korn, H., Irvine, K., Bonn, A., Eds.; Springer: Cham, Switzerland, 2019. [Google Scholar]
  2. Traidl-Hoffmann, C. Allergy-an environmental disease. Bund. Gesund. Gesund. 2017, 60, 584–591. [Google Scholar] [CrossRef] [PubMed]
  3. World Allergy Organization. The WAO White Book on Allergy; Pawankar, R., Canonica, G.W., Holgate, S.T., Lockey, R.F., Blaiss, M., Eds.; World Allergy Organization: Milwaukee, WI, USA, 2013; p. 20. [Google Scholar]
  4. Cecchi, L. Introduction. In Allergenic Pollen: A Review of the Production, Release, Distribution and Health Impacts; Sofiev, M., Bergmann, K., Eds.; Springer: Berlin/Heidelberg, Germany, 2012; pp. 1–8. [Google Scholar]
  5. Pawankar, R. Allergic diseases and asthma: A global public health concern and a call to action. World Allergy Organ. J. 2014, 7, 12. [Google Scholar] [CrossRef] [PubMed] [Green Version]
  6. Nicolaou, N.; Siddique, N.; Custovic, A. Allergic disease in urban and rural populations: Increasing prevalence with increasing urbanization. Allergy 2005, 60, 1357–1360. [Google Scholar] [CrossRef] [PubMed]
  7. Bosch-Cano, F.; Bernard, N.; Sudre, B.; Gillet, F.; Thibaudon, M.; Richard, H.; Badot, P.M.; Ruffaldi, P. Human exposure to allergenic pollens: A comparison between urban and rural areas. Environ. Res. 2011, 111, 619–625. [Google Scholar] [CrossRef] [PubMed] [Green Version]
  8. Ziello, C.; Sparks, T.H.; Estrella, N.; Belmonte, J.; Bergmann, K.C.; Bucher, E.; Brighetti, M.A.; Damialis, A.; Detandt, M.; Galán, C.; et al. Changes to airborne pollen counts across Europe. PLoS ONE 2012, 7, e34076. [Google Scholar] [CrossRef] [PubMed]
  9. Suárez-Cervera, M.; Castells, T.; Vega-Maray, A.; Civantos, E.; del Pozo, V.; Fernández-González, D.; Moreno-Grau, S.; Moral, A.; López-Iglesias, C.; Lahoz, C.; et al. Effects of air pollution on cup a 3 allergen in Cupressus arizonica pollen grains. Ann Allergy Asthma Immunol. 2008, 101, 57–66. [Google Scholar] [CrossRef]
  10. Rodríguez-Rajo, F.J.; Jato, V.; González-Parrado, Z.; Elvira-Rendueles, B.; Moreno-Grau, S.; Vega-Maray, A.; Fernández-González, D.; Suárez, M. The combination of airborne pollen and allergen quantification to reliably assess the real pollinosis risk in different bioclimatic areas. Aerobiologia 2011, 27, 1–12. [Google Scholar] [CrossRef]
  11. Zhao, F.; Durner, J.; Winkler, J.B.; Traidl-Hoffmann, C.; Strom, T.M.; Ernst, D.; Frank, U. Pollen of common ragweed (Ambrosia artemisiifolia L.): Illumina-based de novo sequencing and differential transcript expression upon elevated NO2/O3. Environ. Pollut. 2017, 224, 503–514. [Google Scholar] [CrossRef]
  12. Vara, A.; Fernández-González, M.; Aira, M.J.; Rodríguez-Rajo, F.J. Oleaceae crossreactions as potential pollinosis cause in urban areas. Sci. Total Environ. 2016, 542, 435–440. [Google Scholar] [CrossRef]
  13. Fernández-González, M.; Álvarez-López, S.; González-Fernández, E.; Aira, M.J.; Rodríguez-Rajo, F.J. Cross-reactivity between the Betulaceae family and fallout in the real atmospheric aeroallergen load. Sci. Total Environ. 2020, 715, 136861. [Google Scholar] [CrossRef]
  14. Velasco-Jiménez, M.J.; Alcázar, P.; Cariñanos, P.; Galán, C. Allergenicity of the urban green areas in the city of Córdoba (Spain). Urban For. Urban Green. 2020, 49, 126600. [Google Scholar] [CrossRef]
  15. Rodríguez-Rajo, F.J.; Dopazo, A.; Jato, V. Environmental factors affecting the start of pollen season and concentrations of airborne Alnus Pollen in two localities of Galicia (NW Spain). Ann. Agric. Environ. Med. 2004, 11, 1–10. [Google Scholar]
  16. D’Amato, G.; Cecchi, L.; Bonini, S.; Nunes, C.; Annesi-Maesano, I.; Behrendt, H.; Liccardi, G.; Popov, T.; van Cauwenberge, P. Allergenic pollen and pollen allergy in Europe. Allergy 2007, 62, 976–990. [Google Scholar] [CrossRef] [PubMed]
  17. Belmonte, J.; Roure, J.M.; March, X. Aerobiology of Vigo, North-Western Spain: Atmospheric pollen spectrum and annual dynamics of the most important taxa and their clinical importance for allergy. Aerobiologia 1998, 14, 155–163. [Google Scholar] [CrossRef]
  18. Gehrig, R.; Gassner, M.; Schmid-Grendelmeier, P. Alnus × spaethii pollen can cause allergies already at Christmas. Aerobiologia 2015, 31, 239–247. [Google Scholar] [CrossRef]
  19. Costa, M.; Morla, C.; Sainz, H. Los bosques Ibéricos; Planeta: Barcelona, Spain, 1998. [Google Scholar]
  20. Vara, A.; Fernández-González, M.; Aira, M.J.; Rodríguez-Rajo, F.J. Fraxinus pollen and allergen concentrations in Ourense (South-western Europe). Environ. Res. 2016, 147, 241–248. [Google Scholar] [CrossRef] [PubMed]
  21. Schmid-Grendelmeier, O.; Peeters, A.G.; Wahl, R.; Wüthrich, B. Zur Be-deutungder Eschenpollenallergie. Allergologia 1994, 11, 535–542. [Google Scholar]
  22. Poncet, P.; Senechal, H.; Clement, G.; Purohit, A.; Sutra, J.P.; Desvaux, F.X.; Wal, J.M.; Pauli, G.; Peltre, G.; Gougeon, M.L. Evaluation of ash pollen sensitizationpattern using proteomic approach with individual sera from allergic patients. Allergy 2010, 65, 571–580. [Google Scholar] [CrossRef]
  23. Barderas, R.; Purohit, A.; Rodriguez, R.; Pauli, G.; Villalba, M. Isolation of the main allergen Fra e 1 from ASH (Fraxinus excelsior) pollen: Comparison of the natural and recombinant forms. Ann. Allerg. Asthma Immunol. 2006, 96, 557–563. [Google Scholar] [CrossRef]
  24. Fernández-González, M.; Guedes, A.; Abreu, I.; Rodríguez-Rajo, F.J. Pla a_1 aeroallergen immunodetection related to the airborne Platanus pollen content. Sci. Total Environ. 2013, 463, 855–860. [Google Scholar] [CrossRef]
  25. Gonianakis, M.I.; Baritaki, M.A.; Neonakis, I.K.; Gonianakis, I.M.; Kypriotakis, Z.; Darivianaki, E.; Bouros, D.; Kontou-Filli, K. A 10-year aerobiological study (1994–2003) in the Mediterranean island of Crete, Greece: Trees, aerobiologic data, and botanical and clinical correlations. Allergy Asthma Proc. 2006, 27, 371–377. [Google Scholar] [CrossRef] [PubMed]
  26. Nowak, M.; Szymanśka, A.; Grewling, Ł. Allergic risk zones of plane tree pollen (Platanus sp.) in Poznan. Postepy Dermatol. Alergol. 2012, 29, 156–160. [Google Scholar]
  27. Iglesias, I.; Rodríguez-Rajo, F.J.; Méndez, J. Behaviour of Platanus hispanica pollen, an important spring aeroallergen in Northwestern Spain. J. Investig. Allergol. Clin. Immunol. 2007, 17, 145–156. [Google Scholar]
  28. Varela, S.; Mendez, J.; González de la Cuesta, C.; Iglesias, I.; González, C.; Menéndez, M. Characteristics of pollinosis caused by Betula in patients from Ourense (Galicia, Spain). J. Investig. Allergol. Clin. Immunol. 2013, 13, 124–130. [Google Scholar]
  29. Gomes, C.C.I. Inhalant Allergens in Portugal. Int. Arch. Allergy Immunol. 2007, 172, 67–88. [Google Scholar] [CrossRef]
  30. Minić, R.; Josipović, M.; Spirić, V.T.; Gavrović-jankulović, M.; Popadić, A.P.; Prokopijević, I.; Ljubičić, A.; Stamenković, D.; Burazer, L. Impact of tree pollen distribution on allergic diseases in serbia: Evidence of implementation of allergen immunotherapy to Betula Verrucosa. Medicina 2020, 56, 59. [Google Scholar] [CrossRef] [Green Version]
  31. Mogensen, J.E.; Ferreras, M.; Wimmer, R.; Petersen, S.V.; Enghild, J.J.; Otzen, D.E. The major allergen from birch tree pollen, Bet v 1, binds and permeabilizes membranes. Biochemistry 2007, 46, 3356–3365. [Google Scholar] [CrossRef]
  32. Osawa, Y.; Ito, Y.; Takahashi, N.; Sugimoto, C.; Kohno, Y.; Mori, S.; Morikawa, T.; Kato, Y.; Okamoto, M.; Kanno, M.; et al. Epidemiological study of oral allergy syndrome in birch pollen dispersal-free regions. Allergol. Int. 2020, 69, 246–252. [Google Scholar] [CrossRef]
  33. Gassner, M.; Schmid-Grendelmeier, P.; Clot, B. Ash pollen allergy and aerobiology. Allergo. J. Int. 2019, 28, 289–298. [Google Scholar] [CrossRef] [Green Version]
  34. Feo Brito, F.; Mur, P.; Carnés, J.; Martín, R.; Fernández-Caldas, E.; Lara, P. Olea europea pollen counts and aeroallergenlevels predict clinical symptoms in patientsallergic to olive pollen. Ann. Allergy Asthma Immunol. 2011, 106, 146–152. [Google Scholar] [CrossRef]
  35. Fernández-González, M.; González-Fernández, E.; Fernández-González, D.; Rodríguez-Rajo, F.J. Secondary Outcomes of the Ole e 1 Proteins Involved in Pollen Tube Development: Impact on Allergies. Front. Plant Sci. 2020, 11, 974. [Google Scholar] [CrossRef] [PubMed]
  36. Palomares, O.; Swoboda, I.; Villalba, M.; Balic, N.; Spitzauer, S.; Rodriguez, R.; Valenta, R. The major allergen of olive pollen ole e 1 is a diagnostic marker for sensitization to Oleaceae. Int. Arch. Allergy Imm. 2006, 141, 110–118. [Google Scholar] [CrossRef]
  37. D’Amato, G. Airborne paucimicronic allergen-carrying particles and seasonal respiratory allergy. Allergy 2001, 56, 1109–1111. [Google Scholar] [CrossRef] [PubMed]
  38. Pulimood, T.B.; Corden, J.M.; Bryden, C.; Sharples, L.; Nasser, S.M. Epidemic asthma and the role of the fungal mold Alternaria alternate. J. Allergy Clin. Immunol. 2007, 120, 610–617. [Google Scholar] [CrossRef] [PubMed]
  39. Buters, J.; Prank, M.; Sofiev, M.; Pusch, G.; Albertini, R.; Annesi-Maesano, I.; Antunes, C.; Behrendt, H.; Berger, U.; Brandao, R.; et al. HIALINE working group. Varia-tion of the group 5 grass pollen allergen content of airborne pollen in relation to geographic location and time in season. J. Allergy Clin. Immunol. 2015, 136, 87–95. [Google Scholar] [CrossRef] [PubMed]
  40. Martínez-Cortizas, A.; Pérez-Alberti, A. Atlas Climático de Galicia; Galicia, X., Ed.; Xunta de Galicia: Santiago de Compostela, Spain, 1999; pp. 77–105. [Google Scholar]
  41. Hirst, J.M. An automatic volumetric spore trap. Ann. Appl. Biol. 1952, 39, 257–265. [Google Scholar] [CrossRef]
  42. Galán, C.; Cariñanos, P.; Alcázar, P.; Domínguez, E. Spanish Aerobiology Network: Management and Quality Manual; University of Córdoba: Córdoba, Spain, 2007; pp. 1–61. [Google Scholar]
  43. Andersen, T.B. A model to predict the beginning of the pollen season. Grana 1991, 30, 269–275. [Google Scholar] [CrossRef] [Green Version]
  44. Takahashi, Y.; Ohashi, T.; Nagoya, T.; Sakaguchi, M.; Yasu-eda, H.; Nitta, H. Possibility of real-time measurement of an airborne Cryptomeria japonica pollen allergen based on the principle of surface plasmon reso-nance. Aerobiologia 2001, 17, 313–318. [Google Scholar] [CrossRef]
  45. Moreno-Grau, S.; Aira, M.J.; Elvira-Rendueles, B.; Fernández-González, M.; Fernández-González, D.; García-Sánchez, A.; Martínez-García, M.J.; Moreno, J.M.; Negral, L.; Vara, A.; et al. Assessment of the Olea pollen and its major allergen Ole e 1 concentrations in the bioearosol of two biogeographical areas. Atmos. Environ. 2016, 145, 264–271. [Google Scholar] [CrossRef]
  46. García-Sánchez, J.; Trigo, M.D.M.; Recio, M. Extraction and quantification of Ole e 1 from atmospheric air samples: An optimized protocol. Chemosphere 2019, 225, 490–496. [Google Scholar] [CrossRef]
  47. Fernández-González, M.; Ribeiro, H.; Pereira, J.; Rodríguez-Rajo, F.J.; Abreu, I. Assessment of the potential real pollen related allergenic load on the atmosphere of Porto city. Sci. Total Environ. 2019, 668, 333–341. [Google Scholar] [CrossRef] [PubMed]
  48. Oteros, J.; Galán, C.; Alcázar, P.; Domínguez-Vilches, E. Quality control in bio-monitoring networks, Spanish Aerobiology Network. Sci. Total Environ. 2013, 443, 559–565. [Google Scholar] [CrossRef]
  49. Jato, M.V.; Rodríguez-Rajo, F.J.; Aira, M.J.; Tedeschini, E.; Frenguelli, G. Differences in atmospheric trees pollen seasons in winter, spring and summer in two European geographic areas, Spain and Italy. Aerobiologia 2013, 29, 263–278. [Google Scholar] [CrossRef]
  50. Uguz, U.; Güvensen, A.; Sengonca tort, N.; Esiz Derevoylu, A.; Baran, P. Volumetric analysis of airborne pollen grains in the city of Usak, Turkey. Turk. J. Bot. 2018, 42, 57–72. [Google Scholar] [CrossRef]
  51. Weryszko-Chmielewska, E.; Puc, M.; Piotrowska, K. Effect of meteorological factors on Betula, Fraxinus and Quercus pollen concentrations in the atmosphere of Lublin and Szczecin, Poland. Ann. Agric. Environ. Med. 2006, 13, 243–249. [Google Scholar]
  52. Holmquist, L.; Ekebom, A.; Alm Kübler, K.; Vesterberg, O. Airborne birch and oak pollen grains and birch pollen allergens at a common sampling station in Stockholm. Grana 2005, 44, 104–107. [Google Scholar] [CrossRef]
  53. Leru, P.M.; Eftimie, A.M.; Anton, V.F.; Thibaudon, M. Five-year data on pollen monitoring, distribution and health impact of allergenic plants in Bucharest and the southeastern region of Romania. Medicina 2019, 55, 140. [Google Scholar] [CrossRef] [Green Version]
  54. Moreno-Grau, S.; Elvira-Rendueles, B.; Moreno, J.; García-Sánchez, A.; Vergara, N.; Asturias, J.A.; Arilla, M.C.; Ibarrola, I.; Seoane-Camba, J.A.; Suárez-Cervera, M. Correlation between Olea europaea and Parietaria judaica pollen counts and quantification of their major allergens OLE e 1 and par j 1-Par j 2. Ann. Allergy Asthma Immunol. 2006, 96, 858–864. [Google Scholar] [CrossRef]
  55. Ribeiro, H.; Abreu, I. A 10-year survey of allergenic airborne pollen in the city of Porto (Portugal). Aerobiologia 2014, 30, 333–344. [Google Scholar] [CrossRef]
  56. Puljak, T.; Mamic, M.; Mitic, B.; Hrga, I.; Hrusevar, D. First aerobiological study in Mediterranean part of Croatia (Dalmatia): Pollen spectrum and seasonal dynamics in the air of Split. Aerobiologia 2016, 32, 709–723. [Google Scholar] [CrossRef]
  57. Solomon, W.R.; Burge, H.A.; Muilenberg, M.L. Allergen carriage by atmospheric aerosol, I: Ragweed pollen determinants in smaller micronic fractions. J. Allergy Clin. Immunol. 1983, 72, 443–447. [Google Scholar] [CrossRef]
  58. Biedermann, T.; Winther, L.; Till, S.J.; Panzner, P.; Knulst, A.; Valovirta, E. Birch pollen allergy in Europe. Allergy 2019, 7, 1237–1248. [Google Scholar] [CrossRef] [PubMed] [Green Version]
  59. Cariñanos, P.; Casares-Porcel, M. Urban green zones and related pollen allergy: A review. Some guidelines for designing spaces with low allergy impact. Landsc. Urban Plan. 2011, 101, 205–214. [Google Scholar] [CrossRef]
  60. Galán, C.; Antunes, C.; Brandao, R.; Torres, C.; Garcia-Mozo, H.; Caeiro, E.; Ferro, R.; Prank, M.; Sofiev, M.; Albertini, R.; et al. Airborne olive pollen counts are not representative of exposure to the major olive allergen Ole e 1. Allergy Eur. J. Allergy Clin. Immunol. 2013, 68, 809–812. [Google Scholar] [CrossRef] [PubMed] [Green Version]
  61. Rojo, J.; Pérez-Badia, R. Spatiotemporal analysis of olive flowering using geostatistical techniques. Sci. Total Environ. 2015, 505, 860–869. [Google Scholar] [CrossRef] [PubMed]
  62. Jato, V.; Rodríguez-Rajo, F.J.; Aira, M.J. Use of phenological and pollen-production data for interpreting atmospheric birch pollen curves. Ann. Agric. Environ. Med. 2007, 14, 271–280. [Google Scholar] [PubMed]
  63. Hjelmroos, M. Evidence of long-distance transport of Betula pollen. Grana 1991, 30, 215–222. [Google Scholar] [CrossRef]
  64. Garrido, A.; Fernández-González, M.; Álvarez-López, S.; González-Fernández, E.; Rodríguez-Rajo, F.J. First phenological and aerobiological assessment of olive orchards at the Northern limit of the Mediterranean bioclimatic area. Aerobiologia 2020. [Google Scholar] [CrossRef]
  65. Dabrowska-Zapart, K.; Chłopek, K.; Niedzwiedz, T. The impact of meteorological conditions on the concentration of alder pollen in Sosnowiec (Poland) in the years 1997–2017. Aerobiologia 2018, 34, 469–485. [Google Scholar] [CrossRef] [Green Version]
  66. Ziska, L.H.; Makra, L.; Harry, S.K.; Bruffaerts, N.; Hendrickx, M.; Coates, F.; Saarto, A.; Thibaudon, M.; Oliver, G.; Damialis, A.; et al. Temperature-related changes in airborne allergenic pollen abundance and seasonality across the northern hemisphere: A retrospective data analysis. Lancet Planet Health 2019, 3, e124–e131. [Google Scholar] [CrossRef] [Green Version]
Figure 1. Meteorological variables: Maximum Temperature (black lines), Rainfall (black bars), Relative humidity (grey lines) and Wind speed (grey lines).
Forests 11 01129 g001
Figure 2. Pollen grain concentrations (grey area), allergen concentrations (black line), maximum temperature (points line) and rainfall (bar) for Alnus, Betula, Fraxinus, Olea and Platanus during the MPS.
Forests 11 01129 g002
Figure 3. Plot and Factors of principal components and factor analysis (PCFA) for each taxon, meteorological parameters: Mean, Maximum and Minimum temperatures (Mean T, Maximum T and Minimum T), Relative humidity (RH), Rainfall (Rain) and Wind speed (Ws) (a-Fraxinus. b-Alnus. c-Platanus. d-Betula and e-Olea).
Forests 11 01129 g003aForests 11 01129 g003b
Figure 4. Sampling location area, green zones indicate the Betula and Olive groves use Spanish Forest Species Inventory for Betula and CORINE land cover for Olea. Maps showing 24-h HYSPLIT backward trajectories at a final height of 250, 500 and 700 m agl. at considered episodes: (a) 17 April 2017; (b) 6 May 2018; (c) 21 May 2017; (d) 24 June 2018.
Forests 11 01129 g004aForests 11 01129 g004b
Table 1. Date of the start, end and length of the main pollen season (MPS) (days), mean pollen (pollen/m3), date of the pollen peak (day), pollen (pollen) and allergen, allergen peak of the MPS (ng/m3), date of the allergen peak (day) and Pollen Allergen Potency (AP) (ng/pollen).
20172018
FraxinusAlnusPlatanusBetulaOleaFraxinusAlnusPlatanusBetulaOlea
MPS start3-January10-January16-March26-March4-May4-January17-January6-April18-April23-May
MPS end28-February2-March20-April27-April4-June10-March25-February8-May15-May2-July
MPS length57523633326640332841
Mean pollen10522039443241591643006
Pollen peak 374081549307199160867932128335
Peak date17-February31-January29-March10-April4-May17-January24-January6-April25-April24-June
Pollen56326927290310313891575636853998397233
Fra e 1Aln g 1Pla a 1Bet v 1Ole e 1Fra e 1Aln g 1Pla a 1Bet v 1Ole e 1
Mean allergen0.0390.1770.3870.2880.0190.0450.1850.1950.2980.003
Allergen peak0.2411.8681.1570.9250.1010.6601.3200.5350.6240.019
Peak date17-February1-February21-March19-April21-May23-January18-February15-April6-May24-June
Allergen2.2379.20013.9279.5130.6042.9707.3865.0728.3540.117
AP (ng/pollen)0.00400.00340.00190.00310.00040.00190.00120.00090.00100.0005
Table 2. Spearman correlations between pollen or allergen and the main meteorological variables (* p < 0.05; ** p < 0.01).
FraxinusAlnusPlatanusBetulaOlea
Average Temperature−0.444 **−0.416 **0.120 **0.250 **0.306 **
Maximum Temperature−0.383 **−0.373 **0.158 **0.291 **0.257 **
Minimum Temperature−0.472 **−0.432 **ns0.138 **0.318 **
Relative Humidity0.229 **0.199 **−0.277 **−0.373 **−0.161 **
Rainfallnsnsns−0.108 **ns
Wind Speed−0.201 **−0.129 **0.278 **0.279 **0.245 **
Allergen0.704 **0.689 **0.712 **0.719 **0.810 **
Fra e 1Aln g 1Pla a 1Bet v 1Ole e 1
Average Temperature−0.410 **−0.387 **nsns0.202 **
Maximum Temperature−0.405 **−0.354 **ns0.107 **0.170 **
Minimum Temperature−0.376 **−0.370 **−0.142 **−0.092 **0.201 **
Relative Humidity0.309 **0.231 **−0.182 **−0.272 **−0.131 **
Rainfallnsnsns−0.073 *ns
Wind Speed−0.203 **−0.187 **0.175 **0.168 **0.205 **
Pollen0.704 **0.689 **0.712 **0.719 **0.810 **
Table 3. Regression equations developed between the pollen concentrations (pollen/m3) and allergen values (ng/m3) during the main pollen season of the assessed taxa.
Regression EquationAdj. R2p
FraxinusFra e 1 = 0.0002 + 0.002 × Fraxinus (pollen/m3)0.6090.000
AlnusAln g 1 = 0.009 + 0.001 × Alnus (pollen/m3)0.2890.000
PlatanusPla a 1 = 0.011 + 0.001 × Platanus (pollen/m3)0.6250.000
BetulaBet v 1 = 0.011 + 0.001 × Betula (pollen/m3)0.5120.000
OleaOle e 1 = 0.0003 + 0.0003 × Olea (pollen/m3)0.7370.000
Table 4. Thresholds of allergenic risk for each taxon considering the pollen (Galán et al., 2007) and the allergens. Number of days with allergy risk periods for pollen or allergen. Total number of days during the period of study of high risk by means the combination of pollen and allergen data.
Risk LevelPollen20172018TotalAllergen20172018TotalPollen + Allergen
AlnusLow1–3089971860.011–0.03928174564
Moderate31–50139220.040–0.0595611
High>50172744>0.059322355
FraxinusLow1–30107751820.002–0.06550398916
Moderate31–502680.067–0.109538
High>5001010>0.1094812
PlatanusLow1–5067781450.012–0.05813122534
Moderate51–200189270.059–0.20122830
High>2006814>0.201211031
BetulaLow1–3057961530.013–0.03803359
Moderate31–505380.039–0.055131831
High>50171936>0.055362258
OleaLow1–505039890.001–0.01663118491
Moderate51–2007070.0169–0.06510111
High>200000>0.065101
Publisher’s Note: MDPI stays neutral with regard to jurisdictional claims in published maps and institutional affiliations.

