


Abstract
Solar-type young stellar objects undergo periodic, energetic outbursts that appear to be the result of enhanced mass accretion driven by the gravitational instability of their disks. Such FU Orionis outbursts may have profound consequences for the earliest solids in a protoplanetary disk, namely the refractory inclusions containing abundant calcium and aluminum (CAIs). We present models of the orbital evolution of centimeter-radius particles representing large CAIs in marginally gravitationally unstable disks. The hydrodynamical evolution of the disks is calculated with a fully three-dimensional code, including compressional heating and cooling in the beta cooling approximation. The particles are initially distributed uniformly throughout the disk, which extends from 1 to 10 au around a solar-mass protostar, but within ∼100 yr the particles are concentrated by gas drag into regions surrounding the spiral arms and rings formed by the gas disk. The particles settle down toward the disk midplane, only to be lofted repeatedly upward by shock fronts. Large-scale radial transport both outward and inward occurs, with significant numbers of particles reaching the outer disk (∼10 au) and surviving for considerably longer times than would be the case in a quiescent disk with gas pressure monotonically decreasing with distance from the protostar. Individual particles experience wide ranges of disk temperatures during their journeys, ranging from 60 K in the outer disk to nearly 2000 K in spiral features. Future work will consider the implications for CAI rims of the thermochemical processing experienced during FU Orionis outbursts.
Export citation and abstract BibTeX RIS
1. Introduction
Calcium–aluminum-rich inclusions (CAIs) are submillimeter- to centimeter-sized refractory particles found in the most primitive chondritic meteorites. While most CAIs and refractory inclusions are submillimeter in size (Simon et al. 2018), the largest CAIs are the most amenable to detailed studies, such as isotopic dating. Petrological studies have revealed the presence of thin, multilayered rims around CAIs from all chondrite types and sizes (MacPherson 2014). CAIs are the oldest objects known in the solar system, with ages of ∼4.567 Gyr (Amelin et al. 2010; Connelly et al. 2012), effectively defining the zero-point for the formation of our planetary system. Their highly refractory nature implies solidification during the earliest, hottest phases of the inner solar nebula, while their Wark–Lovering (WL) rims attest to subsequent episodes of thermal and isotopic processing (e.g., Simon et al. 2011, 2016). The CAIs found in samples of Comet Wild 2 (Brownlee et al. 2006; Joswiak et al. 2017) reveal that refractory particles were transported outward from the inner solar nebula to the cold outer nebula regions where comets formed and orbit. The origin and evolution of these enigmatic objects remain a challenge for meteoritical studies and for theoretical models of the evolution of the solar nebula.
Boss et al. (2012) presented the first theoretical models of the evolution of cm-radius particles in a marginally gravitationally unstable (MGU) protoplanetary disk, a phase associated with the periodic FU Orionis outbursts that accompany the early evolution of low-mass protostars (e.g., Zhu et al. 2010; Kuffmeier et al. 2018). FU Orionis outbursts, which involve a rapid increase in luminosity by a factor of ∼102, followed by a slow decrease over multiple decades, are expected to occur over a dozen times during the early evolution of solar-type protostars. Atacama Large Millimeter/submillimeter Array observations of FU Orionis disks have confirmed their relatively large masses (∼0.08 to ∼0.6M⊙) and compact sizes compared to the disks around EXor protostars with less vigorous outbursts (Cieza et al. 2018). Near-IR imaging of FU Orionis disks has revealed the presence of arms and fragmented distributions that Takami et al. (2018) conclude are consistent with FU Orionis outbursts being caused by gravitationally fragmenting disks.
Boss et al. (2012) found that the spiral arms in an MGU disk are capable of transporting disk gas and particles outward as well as inward, over distances of ∼10 au in a few hundred years, potentially explaining the discovery of refractory inclusions in cometary samples. Isotopic evidence for large-scale outward transport of refractory inclusions has since been presented by Render et al. (2019) and Larsen et al. (2020), though Larsen et al. (2020) suggested stellar outflows as the mechanism rather than MGU phases. Lorenz et al. (2019) presented morphological evidence for outward transport of CAIs. Boss et al. (2012) also suggested that the temperature extremes experienced by the particles in their models (∼60 to ∼1500 K) might be capable of explaining the formation of WL rims on CAIs.
Boss (2015) presented the results of the full suite of particle dynamics models, ranging from the 1 cm radius particles of Boss et al. (2012), through to 10 cm, 1 m, and 10 m particles in MGU disks. The models showed that the 1 and 10 m particles largely survived the MGU phase on chaotic orbits in the outer disk, while the 1 and 10 cm particles, being more closely tied to the gas, tended to be lost to protostar gas accretion, even while significant fractions were transported outward. The models did not allow for particle collisions and growth, but clearly these results have implications for pebble accretion scenarios (e.g., Johansen & Lambrechts 2017; Elbakyan et al. 2020) for planetesimal formation in disks that experience FU Orionis outbursts. Growth by pebble accretion during the earliest phases of disk evolution appears to require settling of pebbles to a quiescent disk midplane (Drazkowska & Dullemond 2018).
The present paper builds upon the work of Boss et al. (2012) and Boss (2015) in two ways. First, particles in the two previous papers were restricted to orbiting in the midplane of the MGU disks. Here we extend the models to allow vertical motions, starting with particles distributed in the midplane and vertically throughout the disk, and study the extent to which the particles settle to the midplane through disk gravity while being lofted upward by the chaotic spiral arms. Second, the previous papers assumed that the disk temperature distribution was a fixed, axisymmetric distribution that varied only in radius, from 1550, 1650, or 1800 K at the inner disk boundary at 1 au, to a minimum of 60 K in the outer disk. Here we include disk heating and cooling processes in the β cooling approximation (Gammie 2001), so that particles can experience high temperatures when passing through the shock-heated and compressed regions of spiral arms rather than only by passing close to the central protostar. In a future paper, we intend to explore the effects of the thermal processing experienced by the cm-radius particles on the possible implications for the formation of the WL rims found on CAIs (e.g., Simon et al. 2011, 2016).
2. Numerical Methods
The numerical code is the same as that used by Boss (2015, 2017, 2019), which may be consulted for further details. The EDTONS code solves the three-dimensional equations of hydrodynamics and the Poisson equation for the gravitational potential, with second-order accuracy in both space and time, on a spherical coordinate grid (see Boss & Myhill 1992). An explicit artificial viscosity is not used in the models. Boss (2017) described how the β cooling approximation was incorporated into the solution of the specific internal energy equation (Boss & Myhill 1992), where the time rate of change of energy per unit volume, which is normally taken to be that due to the transfer of energy by radiation in the diffusion approximation, is redefined to include β cooling. This term is defined as the negative of a product of positive factors and so is always negative, resulting only in cooling.
Gammie (2001) suggested that the outcome of gravitational instability depended on the beta parameter β = tcoolΩ, where tcool is the disk cooling time and Ω is the local angular velocity, and that fragmentation would result when β was less than 3. Boss (2017) reviewed subsequent work by many groups, and concluded that a critical value of β in the range of 10–30 appeared to the correct indicator for disk fragmentation, depending on the details of the numerical code used, such as numerical resolution and the artificial viscosity.
This paper continues the approach of Boss (2017, 2019) of exploring the implications of the fixed, spatially and temporally constant β approximation hypothesized by Gammie (2001). Others have examined the effects of using more physically based cooling approximations, such as Baehr & Klahr (2015), who employed a definition for cooling that depended on a number of factors, namely the midplane temperature and sound speed, disk surface density, Rosseland mean opacity, local angular velocity, and effectively a free parameter γ. Note that these models were two-dimensional only and restricted to a razor-thin disk. It is unclear how such a thin-disk formulation could be extended to the fully three-dimensional disk models presented here, though this is an interesting avenue for further work. Instead, the intention here is to continue in the vein of the large number of workers who have used the classic β approximation of Gammie (2001), such as Meru & Bate (2011a, 2011b, 2012), Paardekooper (2012), Rice et al. (2014), Young & Clarke (2015), Deng et al. (2017), Boss (2017, 2019), Booth & Clarke (2019), and Vorobyov et al. (2020).
Mercer et al. (2018) calculated three-dimensional models of disks, including radiative transfer using the methods of Lombardi et al. (2015) to estimate optical depths. The opacities used in all of these models were based on the opacity parameterizations of Bell & Lin (1994), which agree well with Rosseland mean dust opacities below 2000 K (mean opacities in the range of 0.01–10 cm2 g−1) and with Rosseland mean gas opacities above 2000 K, where dust grain sublimation leads to large drops in the mean opacity in low-density regions. Mercer et al. (2018) used their radiative transfer models to estimate the effective local value of β throughout their disk models, finding that βeff varied from ∼0.1 to ∼200 in different regions of the models. In their large-scale disk models, βeff varied from greater than 20 in the inner disk to as low as ∼3 in the outer disk. Spiral arms had βeff ∼ 1, while dense, bound clumps had βeff ∼ 200 as a result of the high optical depths. As noted by Boss (2017, 2019), Mercer et al. (2018) concluded that a constant β could not completely reproduce their radiative transfer results, so clearly constant β is merely a convenient approximation. Nevertheless, the exploration of β values of 10 and 30 in the present models appears to be consistent with the cooling rates to be expected for disks with realistic mean opacities for dust grains and gas.
As in Boss (2015), the equations are solved on a grid with Nr = 51 uniformly spaced radial grid points, Nθ = 23 theta grid points, distributed within π/2 ≥ θ ≥ 0, but compressed toward the disk midplane, and Nϕ = 256 uniformly spaced azimuthal grid points. The radial grid extends from 1 to 10 au, with disk gas flowing inside 1 au being added to the central protostar. The gravitational potential is obtained through a spherical harmonic expansion, including terms up to N Ylm = 32. Because these models do not attempt to model the formation of self-gravitating clumps that could become gas-giant protoplanets, the numerical resolution is not increased during the evolutions in order to avoid violating the criteria on Jeans length (e.g., Boss et al. 2000) and Toomre length (Nelson 2006). This allows the models to be computed in a few months of CPU time on the Carnegie memex cluster, rather than in a few years.
As in Boss et al. (2012), the particles were represented as finite-size particles that interact with the disk gas by gas drag, while moving on Keplerian orbits, subject to the gravity of both the protosun and the evolving gaseous disk, but not of each other. The particles were not allowed to grow or to fragment by collisions with other particles, because previous studies have shown (e.g., Estrada et al. 2016) that collisions only rarely lead to particle growth to sizes of 10 cm or larger in the regions where the parent bodies of CAIs formed. The particles are passive tracer particles with no effect on the disk evolution. The particle orbits are calculated in spherical coordinates using a numerical scheme that is accurate to second order in space and time, the same as the disk hydrodynamics scheme, with the same time step being used to advance both the particles and the disk gas.
Boss (2015) noted that simulations of particles evolving through gas drag in disks using explicit hydrodynamics codes must use a time step that is shorter than the particle stopping time, in order to avoid erroneous particle behavior. The particle stopping time ts (Weidenschilling 1977) is defined as

with particle density ρp = 3 g cm−3, particle radius rp = 1 cm, gas density ρ, and sound speed cs . We can estimate the shortest expected stopping times in the regions with the highest gas density and highest sound speed, which are in the inner disk midplane, where ρ ∼ 10−9 g cm−3 and T ∼ 1000 K, yielding ts ∼ 105 s in the inner disk. The typical hydrodynamical time step taken was ∼3 × 10³ s, and in no case was it higher than ∼6 × 10³ s. Clearly the relatively short time steps required by the hydrodynamics code are small enough to resolve the particle stopping times. For 1 cm particles, the Epstein drag law is usually appropriate for these disk models (Boss et al. 2012; Boss 2015).
As in Boss (2015), particles that move outward and strike the outer disk boundary at 10 au are reflected back into the disk, in order to simulate the evolutions of particles that are transported beyond 10 au but then return. Conversely, particles that hit the inner disk boundary at 1 au are assumed to have been either accreted by the central protostar or lost by sublimation in the hot inner disk. These lost particles are tabulated but are thereafter removed from the calculations.
Further details on the calculation of the particle orbits are given by Boss (2015). The equations are designed to conserve particle angular momentum when there are no azimuthal forces (i.e., a central force with no gas drag). Boss (2005) showed that the scheme is able to conserve the angular momentum of an orbiting particle to at least eight digits in the absence of gas drag, and that particles on initially circular or elliptical orbits with semimajor axes of 5 au remain stable on these orbits for at least 500 yr. The time steps used are considerably smaller than those used by symplectic integrators. The gas-drag forces used to update the particle radial and azimuthal angular momenta are calculated using interpolations, accurate to second order, of the gas disk variables in the gas-drag force laws, as well as time-centered velocities, in order to ensure temporal accuracy. Boss (2015) tested the gas-drag force laws by inserting particles with radii of 1 cm, 10 cm, 1 m, and 10 m in a disk of uniform density and temperature at a radial distance of 5 au, with Keplerian velocities, subject only to gas-drag forces. All four spiraled inward with radial drift speeds that were within factors of two of the radial velocities calculated by Weidenschilling (1977) for similar disk parameters, confirming the accuracy of the gas-drag forces. Boss (2015) also ran two test models with gas-drag forces set equal to zero, to determine whether both large and small particles react in the same manner to the gravitational forces of the central protostar and the disk spiral arms: models with 12,181 particles of 1 cm radius and 10 m radius behaved identically for hundreds of years.
As in all of the previous modeling (e.g., Boss et al. 2012; Boss 2015, 2017, 2019), the boundary conditions for the disk gas at both the inner and outer edges of the disk are chosen to absorb, rather than reflect, radial velocity perturbations. This was done in order to avoid reflected waves that might artificially enhance spiral arms. The inner boundary condition allows disk gas to be accreted by the central protostar, thus allowing mass conservation to be maintained during the evolutions. The outer boundary condition can result in a pileup of disk gas in the outermost midplane cells, resulting in a local density enhancement that should be ignored. This artificial enhancement can be seen in Figure 13 and is a result of the desire to conserve mass in the calculations. This outer boundary condition can also cause a local enhancement of larger particles at late times, in spite of their being reflected back onto the active grid (e.g., Figure 6(d) in Boss 2015 for 1 m radius particles), though the effect is minimal in the present models because 1 cm radius particles (e.g., Figure 8(d) in Boss 2015) are more likely to be transported inward than outward due to their tighter coupling to the gas and its continual accretion onto the central protostar.
3. Initial Conditions
Table 1 summarizes the four models, which started from either axisymmetric disks (Figure 1) or disks that had been evolved for 105 yr and formed spiral arms (Figure 2). For both cases, models had β cooling parameters of either 10 (relatively fast cooling) or 30 (relatively slow cooling). As in Boss (2015), the initial density distribution in the gas disk was an adiabatic, self-gravitating, thick disk (Figure 3) in near-Keplerian rotation about a stellar mass Ms (Boss 1993), with an initial midplane density chosen to enforce near-Keplerian rotation. The surface density of the disk may be approximated by a power law that decreases with cylindrical radial distance R as R−1/2 (Boss 1993). Figure 3 can be used to determine that the initial disk has a ratio of the scale height of the disk gas density to radius H/R of 0.20 at 1 au, 0.16 at 5 au, and 0.14 at 10 au, significantly larger than for the typical standard unflared disk, where H/R ∼ 0.05. The scale height is defined here as the distance above the midplane where the gas density falls by a factor of e ≈ 2.718 below the midplane density at that radius. Figure 3 also shows that the disk is embedded in a spherical halo with a density of 10−14 g cm−3 at 1 au, which decreases with spherical radial distance r as r−3/2 (Boss 1993). The inner disk radius is 1 au and the outer one is 10 au. The initial disk mass Md is then 0.047 M⊙, and the initial protostellar mass is Ms = 1.0 M⊙. The initial outer disk temperature is set to 60 K for all models, so that all models begin from an MGU configuration with an initial minimum value of the Toomre (1964) Q gravitational stability parameter of 1.8 in the outer disk. Inside ∼5 au, Q rises steeply to high values Q > 4 (e.g., Figure 1(b) of Boss 2015), making the inner disk formally gravitationally stable, compared to the marginal instability beyond 5 au. The initial temperature distribution is axisymmetric, with the radial profile calculated for the initial disk by Boss (1996, see blue line plot in Figure 1(a)), with a maximum temperature of 1550 K at 1 au, which decreases monotonically with radius to the outer disk temperature of 60 K (Figure 4). The outer disk temperature was not allowed to drop below 60 K, even in the presence of the disk cooling, in order to keep the disk MGU.
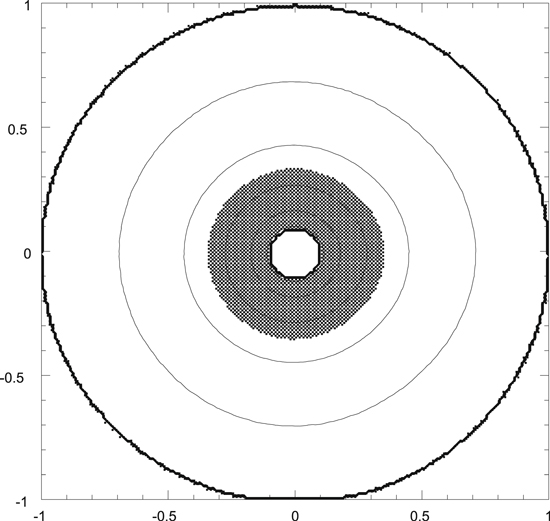
Figure 1. Initial axisymmetric midplane (z = 0) density distribution in the disk. The region shown is 20 au across. The inner boundary of the disk has a radius of 1 au. A solar-mass protostar resides at the center of the disk. Cross-hatched regions have densities exceeding 1.25 × 10⁻¹⁰ g cm−3. Contours represent changes in density by factors of 2.
Download figure:
Standard image High-resolution image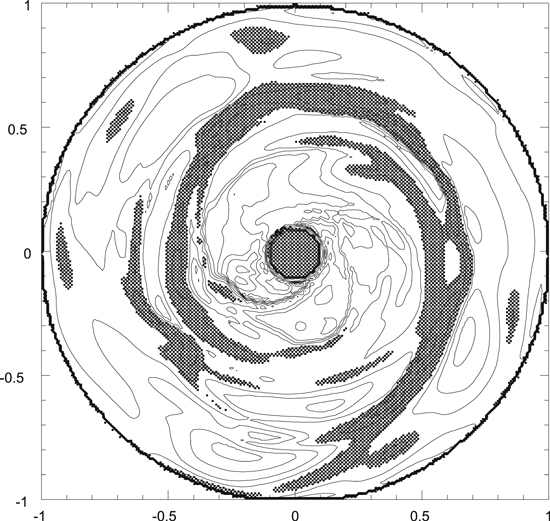
Figure 2. Initial non-axisymmetric midplane (z = 0) density distribution in the disk with spiral arms, plotted as in Figure 1.
Download figure:
Standard image High-resolution image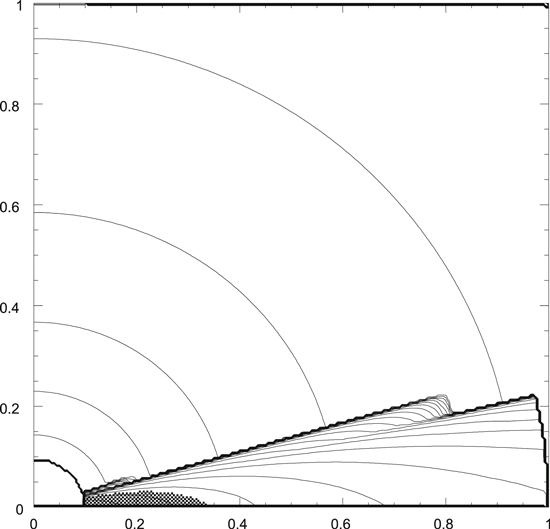
Figure 3. Initial density distribution in the disk in the azimuthal plane for the axisymmetric models. The disk inner boundary has a radius of 1 au while the outer boundary is at 10 au. The models have hemispherical symmetry about the disk midplane at the bottom of the figure. As in Figure 1, cross-hatched regions have densities exceeding 1.25 × 10⁻¹⁰ g cm−3, while contours represent changes in density by factors of 2. The upper surface of the disk (heavy jagged black lines) is at a density of 10−14 g cm−3.
Download figure:
Standard image High-resolution image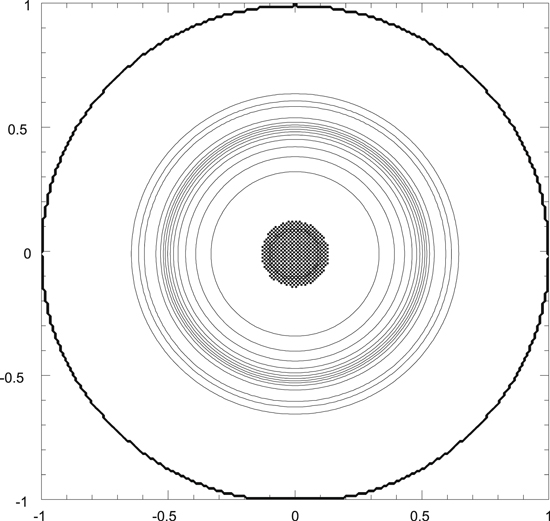
Figure 4. Initial axisymmetric midplane (z = 0) temperature distribution in the disk for all models, plotted as in Figure 1. Cross-hatched regions have temperatures exceeding 1514 K. The disk temperature is 1550 K at the inner boundary, falling to 60 K at the outer boundary. Contours represent changes in temperature by factors of 1.25.
Download figure:
Standard image High-resolution imageTable 1. Initial Disk Density Distributions, Beta Cooling Parameters, and Final Evolution Times for the Models
| Model | Initial density | β cooling | Final time (yr) |
|---|---|---|---|
| ARMS-10 | spiral arms | 10 | 1492 |
| ARMS-30 | spiral arms | 30 | 1016 |
| AXIS-10 | axisymmetric | 10 | 1986 |
| AXIS-30 | axisymmetric | 30 | 1164 |
Download table as: ASCIITypeset image
Figure 5 shows the initial spatial distribution of the 3072 particles for all of the models projected onto the midplane of the disk, while Figure 6 presents the initial distribution projected onto an azimuthal (ϕ = const.) plane. Figure 5 shows that the particles were initially distributed uniformly in azimuth, even for the two models that began with an evolved, non-axisymmetric disk (Table 1). Figure 6 shows that as a result of the vertical (θ) grid being compressed toward the midplane, the initial vertical distribution was similarly compressed toward the midplane, with the uppermost layer of particles lying right at the uppermost surface of the disk, as seen in Figure 3. Note that as a result of the hemispherical symmetry assumed in the EDTONS code, only a single hemisphere is shown in Figures 3 and 6, as the other hemisphere is a reflection of the hemisphere shown. Note also that the vertical scale is expanded somewhat in Figure 6, but not in Figure 3.
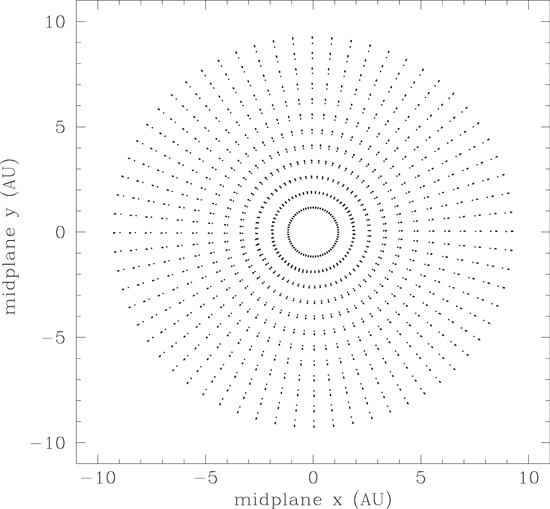
Figure 5. Initial distribution of 1 cm radius particles in the entire three-dimensional grid, projected onto the disk midplane (z = 0).
Download figure:
Standard image High-resolution image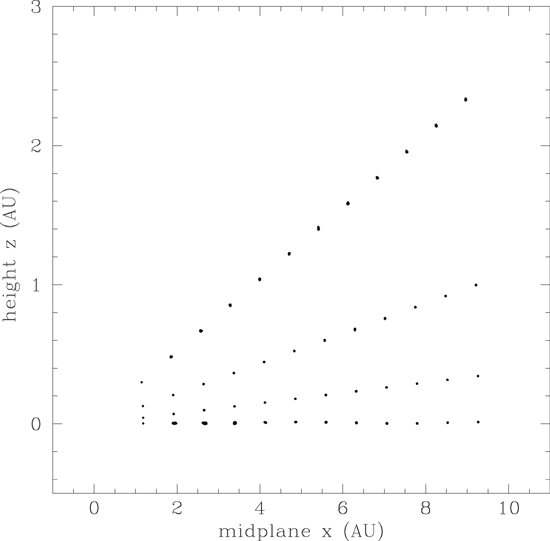
Figure 6. Initial distribution of 1 cm radius particles in an azimuthal (ϕ = const.) vertical plane of the disk. Hemispherical symmetry (above and below the midplane) is assumed in the models.
Download figure:
Standard image High-resolution image4. Results
Figure 7 summarizes the results of the fraction of particles surviving for all four models, that is, the fraction of the initial total of 3072 particles that were still actively evolving on the numerical grid and had not yet hit the inner boundary at 1 au. Figure 8 depicts the concurrent decrease in mass of the protoplanetary disk, with the disk mass lost being accreted by the central protostar once it passes inside the 1 au inner boundary. It can be seen that by about 1000 yr, between 30% and 40% of the disk mass is accreted by the protostar, whereas about 95% of the particles have hit the 1 au boundary by that time. Figure 7 shows that particle losses were higher for the two models that started with spiral arms, even though Figure 8 shows that the disk mass loss rate was slower for those initial conditions. The choice of the disk cooling rate had the effect of increasing the particle losses with slower cooling (β = 30 versus 10), yet had a mixed effect on the rate of disk mass losses, though the differences are perhaps not significant considering the chaotic nature of the evolution of MGU disks.
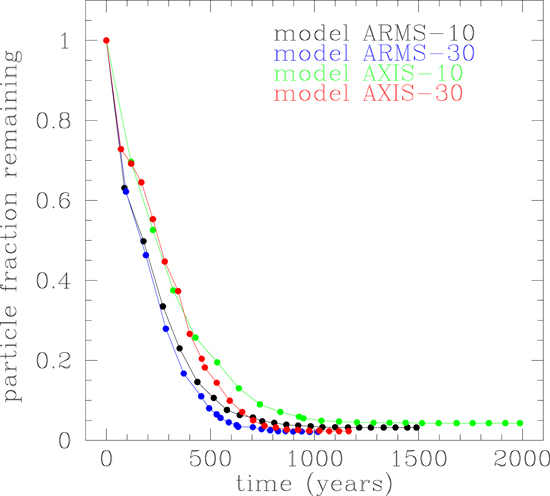
Figure 7. Time evolution of the fraction of the number of 1 cm radius particles remaining in the active disk region (1–10 au) for the four models listed in Table 1.
Download figure:
Standard image High-resolution image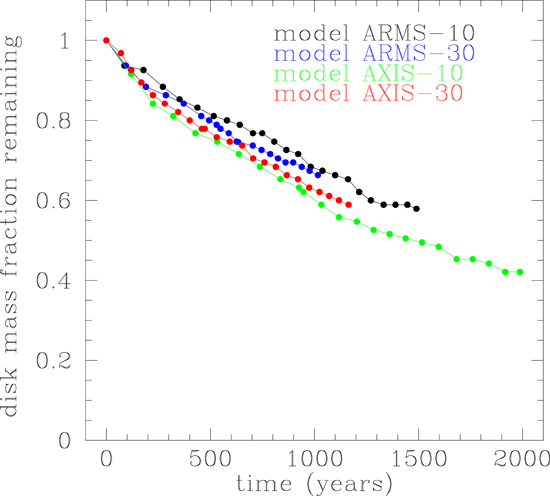
Figure 8. Time evolution of the fraction of the remaining disk mass in the four models listed in Table 1. The disk mass is accreted by the central protostar.
Download figure:
Standard image High-resolution imageThe particle loss rates are higher in the present models than in those of Boss et al. (2012), which are summarized in Figure 9. By 1000 yr in those earlier models, the disk mass lost was about 42%, somewhat higher than in the present models, but the particle loss was less than 75%, considerably less than with the present models. For comparison, using the estimates of Weidenschilling (1988), for a gas disk density of ρ = 10−11 g cm−3, a 1 cm radius particle initially at 5 au should experience an inward radial velocity due to gas drag of ∼104 cm s−1, leading to inward drift and loss onto the protostar in ∼200 yr. That estimate pertains to an axisymmetric, quiescent disk with a disk gas pressure that declines monotonically with radius. The fact that significant (up to 5%) numbers of cm-radius particles managed to continue orbiting in the present models even after as long as 2000 yr of evolution (Figure 7) shows that MGU disks appear to be capable of slowing the otherwise inevitable loss of cm-radius particles in a quiescent, non-MGU disk, consistent with the claims of Boss et al. (2012) for a role for MGU disks in transporting outward and preserving CAI-sized refractory inclusions prior to their assembly into increasingly larger boulders and planetesimals.
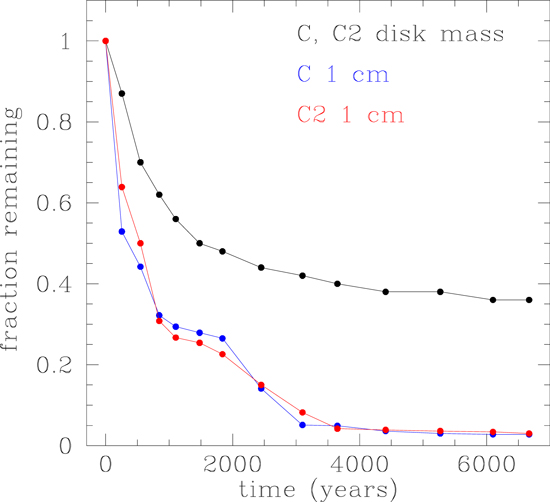
Figure 9. Time evolution of the fraction of the number of 1 cm radius particles remaining in the active disk region (1–10 au) and fraction of disk mass for models C and C2 from Boss (2015). The particles in model C started in a uniform distribution in the disk midplane, while those in model C2 started concentrated in the spiral arms of the initial disk. In both models, the particles were limited to trajectories in the disk midplane.
Download figure:
Standard image High-resolution imageFigure 10 illustrates the mechanism whereby the spiral arms in an MGU disk inhibit the inward migration of cm-radius particles. The initially azimuthally uniform particle load in model ARMS-10 settles into the spiral arm distribution in less than 100 yr. The spiral arms constitute local pressure maxima that result in particle traps, as gas drag forces particles toward the gas pressure maxima in the centers of the spiral arms (Haghighipour & Boss 2003a, 2003b). Substantial numbers of particles remain throughout the disk after 352 yr, though by the end of the evolution, 797 yr, only 5% remain active.

Figure 10. Time evolution of the distribution of 1 cm radius particles for model ARMS-10, projected onto the disk midplane, at times and remaining active particle numbers (#): (a) 0.0, # = 3072; (b) 88 yr, # = 1938; (c) 352 yr, # = 708; and (d) 797 yr, # = 147.
Download figure:
Standard image High-resolution imageFigure 11 shows that particle settling toward the disk midplane only occurs to a limited extent, and that the spiral arms are able to toss particles upward and keep them suspended throughout the entire evolution of model ARMS-10. The spiral arms act as shock bores or hydraulic jumps, forcing the particles upward (Boley & Durisen 2006). In fact, the irregular upper surface of the particle distribution seen in Figure 11(b) agrees reasonably well with the corresponding density distribution in the azimuthal plane seen in Figure 12 for the ARMS-10 model at the same time, to the extent that the higher density disk gas contours are puffier and extend to greater heights (∼0.2 au) inside ∼5 au than outside (∼0.1 au). This is consistent with the higher disk gas temperatures inside ∼5 au than outside (see Figure 14), which results in greater vertical pressure support for the gas disk, and hence a larger disk scale height. As a result, the particles can remain suspended at greater heights by gas drag inside ∼5 au than outside, as seen in Figure 11(b). The particles are less densely spaced inside ∼5 au than outside as a result of this puffiness of the gas disk, coupled with their closer proximity to the inner boundary at 1 au, where they can be lost. It should be noted that Figure 11 plots all azimuths whereas Figure 12 plots only a single azimuthal slice. Nevertheless, by this time, all azimuthal slices are similar to the extent needed to make the claim of reasonable agreement of the irregular upper surface of the distribution seen in Figure 11(b).
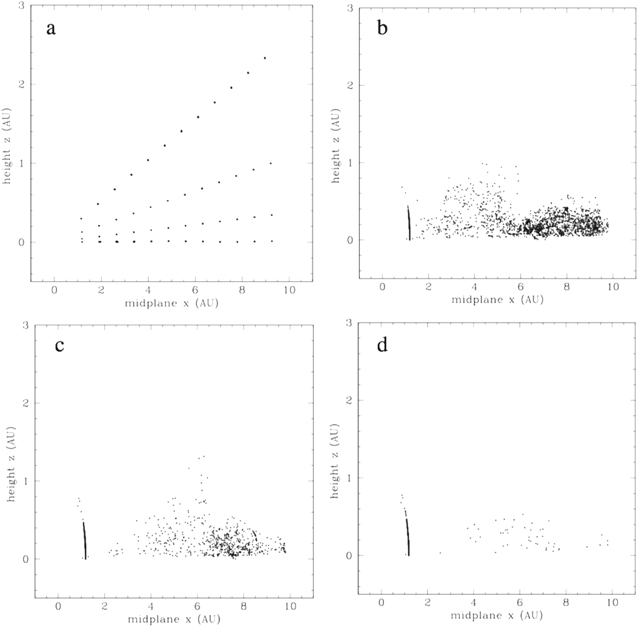
Figure 11. Time evolution of the distribution of 1 cm radius particles for model ARMS-10, projected onto an azimuthal plane, at times and remaining active particle numbers (#): (a) 0.0, # = 3072; (b) 88 yr, # = 1938; (c) 352 yr, # = 708; and (d) 797 yr, # = 147.
Download figure:
Standard image High-resolution image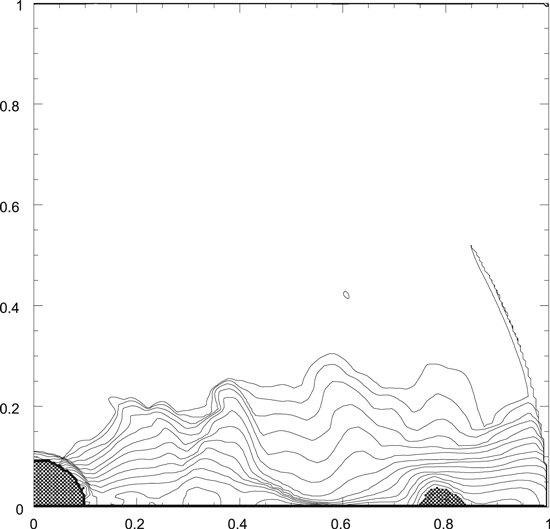
Figure 12. Disk density distribution in an azimuthal plane for model ARMS-10 at 88 yr, plotted as in Figure 3. The upper surface of the disk is at a density of 10−14 g cm−3; lower densities above the disk are not plotted for clarity. The azimuthal slice shown is at 9 o'clock in Figure 10. A dense spiral arm can be seen at 8 au (0.8 in plot units).
Download figure:
Standard image High-resolution imageThe ability of dense spiral arms to transport particles radially and vertically over short time periods is evident from Figures 10 and 11. Figure 11 reveals the likely primary explanation for the enhanced particle loss rate in the present models (Figure 7) compared to the previous models (Figure 9). Figure 11 shows that the particles lost by hitting the inner boundary do so over a large vertical extent, i.e., hitting as high as about 0.5 au above the midplane. In the previous models (Boss 2015), the particles were restricted to orbits in the disk midplane, so with the added vertical dimension in the present models, there is effectively more phase space for particles to wander in and strike the inner boundary. The other major difference with Boss (2015) was the inclusion of β cooling in the present models, but Figure 7 showed that significant changes in the cooling rate had little effect on the particle loss rate. The same was true for starting with initial conditions of axisymmetric versus spiral arms. Furthermore, the disk mass loss rate was similar in both sets of models (Figures 8 and 9), which also supports the idea that the reason for higher particle mass loss rates was not the underlying disk evolution but instead was the addition of the vertical dimension. We return to this question below, in the context of the Stokes numbers and particle decoupling from the gas.
Figure 13 depicts a representative midplane density distribution for the models, showing the formation of multiple spiral arms, which effectively form a transient partial ring-like feature after 88 yr of evolution for model ARMS-10. Such spiral arms and rings act as local gas pressure maxima that can serve as formidable barriers to the inward migration of cm-radius particles (Haghighipour & Boss 2003a, 2003b), as seen in Figure 10 for model ARMS-10. In fact, there is a close correspondence between the density maxima in Figure 13 and the densest concentrations of particles seen in Figure 10(b) at the same time. Clearly, dense clumps of disk gas can serve as efficient particle traps as well as barriers to inward migration. Figure 14 illustrates how the gas density distribution determines the temperature distribution, with minimum gas temperatures (60 K) reigning outside the outer edge of the spiral arms and clumps seen in Figure 13. The highest temperatures occur in regions with the sharpest density gradients, as expected for compressional heating of the disk gas moderated by the β cooling routines. Temperatures in excess of 1778 K occur as a result of the localized shock compressional heating associated with the spiral arm features. Note that the spiral features seen in the hot inner disk in Figures 13 and 14 are driven by the one-arm spirals in the unstable outer disks; one-arm spirals can penetrate to the inner edge of a disk (e.g., Boss & Durisen 2005). Note also that the densest arms and clumps occur in the cooler regions of the disk, as required for their self-gravitational maintenance, while the highest temperatures occur in the relatively low-density inner regions, where shock heating is driven by the outer spiral arms and clumps.
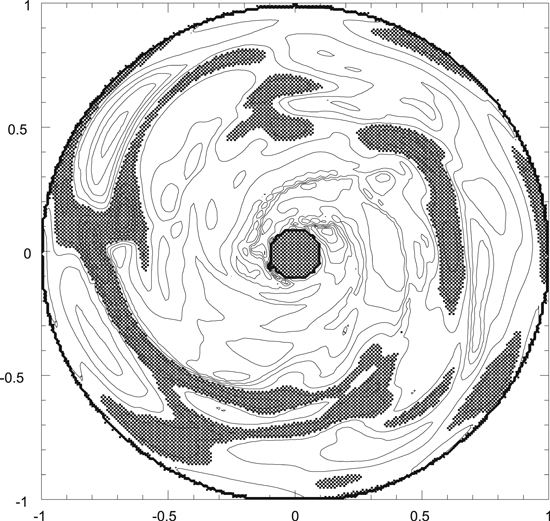
Figure 13. Midplane (z = 0) disk density distribution for model ARMS-10 after 88 yr of evolution with β = 10 cooling, plotted as in Figure 1.
Download figure:
Standard image High-resolution image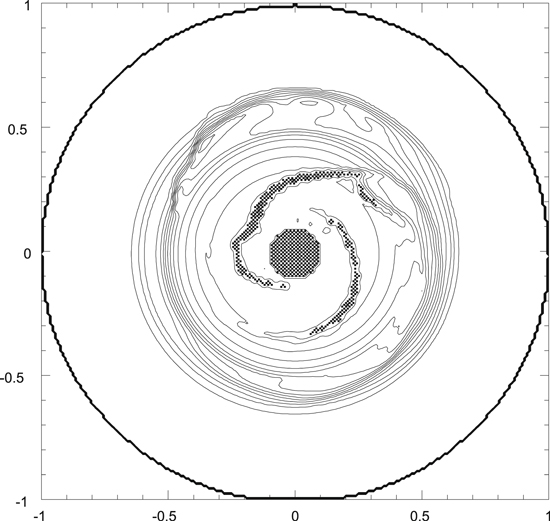
Figure 14. Midplane (z = 0) disk temperature distribution for model ARMS-10 after 88 yr of evolution with β = 10 cooling. Cross-hatched regions have temperatures exceeding 1778 K, otherwise plotted as in Figure 4.
Download figure:
Standard image High-resolution imageFinally, we turn to the consideration of the orbital and thermodynamical evolution of individual particles, as in Boss et al. (2012). Figure 15 presents the midplane orbital evolution of a representative cm-radius particle, which began its evolution at a radial distance of ∼2.5 au when projected down to the disk midplane. This particle orbits around the central protostar nearly 30 times before striking the inner boundary after over 300 yr of evolution in model ARMS-30. It can be seen that the particle was transported outward as far as ∼9 au before returning inward to distances inside a few au. The orbits are somewhat eccentric and do not close, indicative of the chaos induced by the transient spiral arms in an MGU disk. Finally, the particle hits the inner boundary, as can be seen in Figure 15. Note that the disk and particles all orbit in the counterclockwise sense.
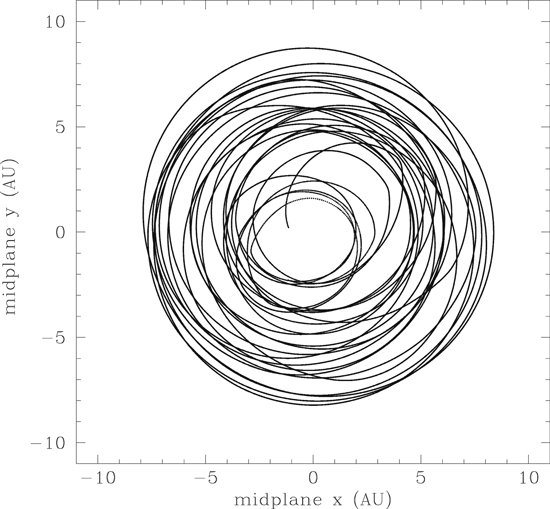
Figure 15. Time evolution of the orbit of particle #716 in model ARMS-30, projected into the midplane, over a time period of 365 yr. The particle hits the inner boundary at 1 au, ending its evolution.
Download figure:
Standard image High-resolution imageFigure 16 shows that the trajectory of this same particle in the vertical direction is even more chaotic that in the midplane. The starting location of this particle is evident in Figure 16, at a height of about 0.64 au. It settles down toward the midplane, but then follows a chaotic trajectory out as far as 9 au, with one notable excursion upward over 1 au above the midplane. Typically, however, the spiral arms keep the particle lofted no higher than about 0.4 au above the midplane. Finally, the particle ends its evolution at the 1 au inner boundary, at a height of about 0.2 au.
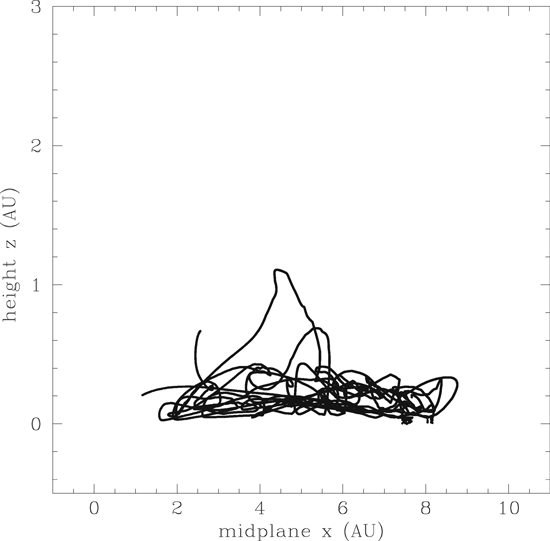
Figure 16. Time evolution of the orbit of particle #716 in model ARMS-30, projected onto an azimuthal plane, over a time period of 365 yr. The particle starts well above the midplane at a height of 0.64 au and eventually hits the inner boundary at 1 au, ending its evolution.
Download figure:
Standard image High-resolution imageIn the present MGU disk models, the spiral arms and clumps are highly transient, and as a result particle trajectories are subject not only to highly transient gas drag forces, but also to highly transient gravitational forces from the dense clumps and arms. Any intuition that is based on conventional models of accretion disks, where disk self-gravity is negligible, is not likely to be appropriate for the present MGU disk models, where the dynamical evolution of both the spiral features and the particles is essentially chaotic.
Figure 17 depicts the thermal environment sampled by this particle during its peregrinations, while Figures 18 and 19 show the midplane temperature and radial temperature profiles for model ARMS-30 after 94 yr of evolution for comparison. Starting in the hot region close to the protostar with disk temperatures exceeding 1000 K, the particle soon reaches a much cooler disk region at 60 K, before journeying back inward and then outward, experiencing multiple cycles of 60 and 1000 K environments. Clearly a particle with such a history would be expected to possibly acquire an icy mantle in the outer disk, only to lose it upon transport to the inner disk. Passage in and out of inner disk regions with temperatures as high as 2000 K might result in the formation of WL rims on the refractory core of this particle, as was suggested by Boss et al. (2012). Testing this hypothesis with detailed thermochemical models of the environments experienced by particles like this one is intended to be the subject of the next paper in this series.
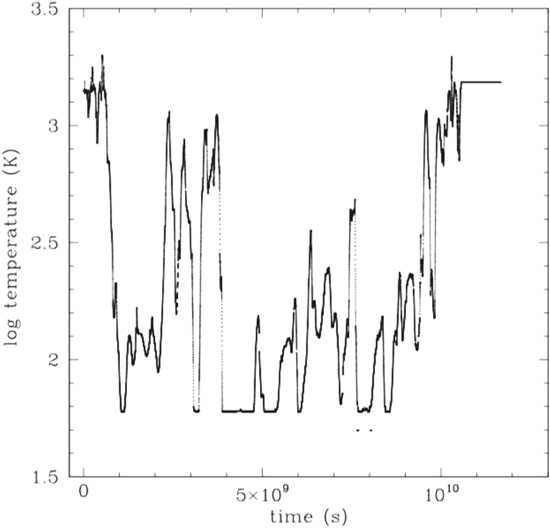
Figure 17. Time evolution of the disk temperatures experienced by particle #716 in model ARMS-30 over a time period of ∼365 yr. The minimum disk temperature is 60 K, while the temperature of the inner boundary is 1550 K; the particle hits this, ending its evolution, as shown in the flatline portion of the plot on the right, when the particle is no longer active.. The particle experiences even higher temperatures during its evolution by passing through spiral arm-driven shock-heated regions, as seen in Figures 18 and 19, reaching temperatures as high as 2000 K.
Download figure:
Standard image High-resolution image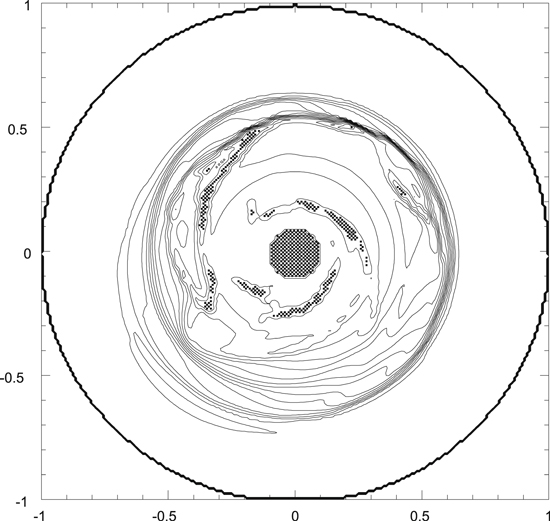
Figure 18. Midplane (z = 0) disk temperature distribution for model ARMS-30 after 94 yr of evolution with β = 30 cooling. Cross-hatched regions have temperatures exceeding 1778 K, otherwise plotted as in Figure 4.
Download figure:
Standard image High-resolution image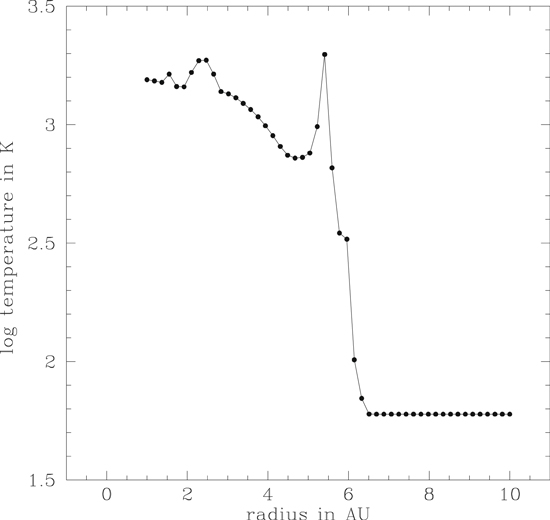
Figure 19. Radial profile of the midplane disk temperatures in model ARMS-30 after 94 yr of evolution, corresponding to a radial profile in Figure 18 at 2 o'clock. The minimum disk temperature is 60 K, while the inner boundary temperature is 1550 K. The profile crosses several spiral arm-driven features seen in Figure 18, resulting in local temperature spikes.
Download figure:
Standard image High-resolution imageFigures 20 and 21 show the evolution of the Stokes number and disk gas density for particle #716 from model ARMS-30, for comparison with Figure 17. The Stokes number St is defined here as the product of the stopping time ts and the local disk angular velocity Ω, and so is a measure of the reaction of the particle to the changing conditions in the surrounding gas. Large values of St > 1 imply a particle large enough to not be responsive to gas drag, while small values of St < 1 imply a particle that is locked to the gas motions. Figure 20 shows that particle #716 has St < 1 throughout its evolution, though at times St reaches values above ∼0.1, implying marginal decoupling from the disk gas. Inspection of Figure 21 reveals that these relatively large values of St occur when the particle is embedded in regions of low gas density, near the beginning and end of its evolution. Conversely, the drop in St to ∼10−4 seen in Figure 20 corresponds to the highest gas density experienced by the particle, ∼4 × 10⁻⁹ g cm−3, seen in Figure 21.
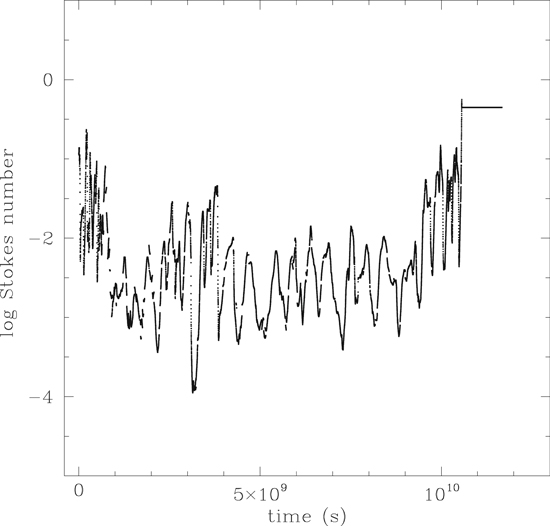
Figure 20. Time evolution of the Stokes number experienced by particle #716 in model ARMS-30 over a time period of ∼365 yr (see Figures 17 and 21).
Download figure:
Standard image High-resolution image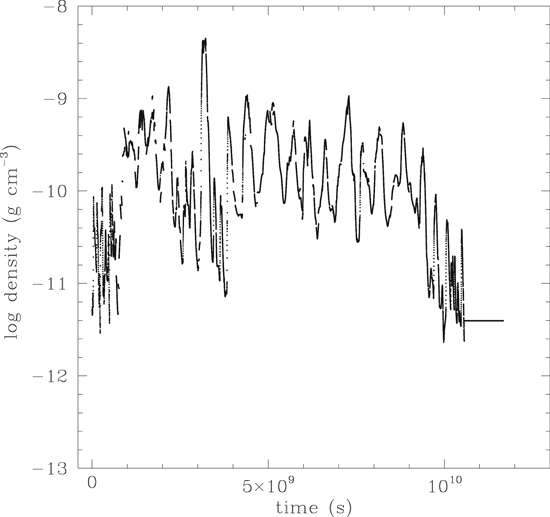
Figure 21. Time evolution of the disk gas density experienced by particle #716 in model ARMS-30 over a time period of ∼365 yr (see Figures 17 and 20).
Download figure:
Standard image High-resolution imageFigure 9 of Boss (2015) shows that particles with sizes of 1 and 10 cm undergo larger variations in orbital radius after hitting the outer boundary than the 1 and 10 m particles launched from the same initial disk position. This is clearly a result of the smaller particles being more closely tied to the gas than the larger ones. Figure 22 shows the azimuthal (vϕ ) and radial (vr ) velocities (top and bottom, respectively) for particle #716 in model ARMS-30, which hits the inner boundary (Figure 17) with a relatively large Stokes number of close to 1 (Figure 20). Figure 22 shows that #716 experiences rapid and large changes in azimuthal velocity, from ∼10 km s−1 (Keplerian at 10 au) to ∼30 km s−1 (Keplerian at 1 au). The radial velocity undergoes similar rapid and large variations, from as high as ∼10 km s−1 outward to ∼10 km s−1 inward. An inspection of the data files for the ARMS-30 disk shows that the variations in particle velocity are similar in amplitude to the variations seen in the gas disk velocity field. In fact, entire sectors of the disk gas can be seen to be moving inward with speeds over 1 km s−1 and up to 10 km s−1 for a segment inside 5 au. Thus the occurrence of an inward radial velocity of ∼1 km s−1 leading to collision with the inner boundary is consistent with the particle being transported inward primarily by gas motions, leading to a final decoupling with higher Stokes number and a collision with the inner boundary. Evidently the particle is not moving continually at 1 km s−1 with respect to the gas; rather, the gas is moving at this speed and carrying the particle along with it to a large extent.
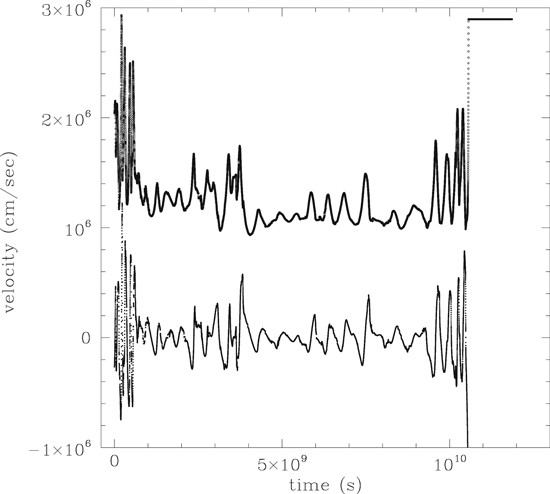
Figure 22. Time evolution of the azimuthal (top) and radial (bottom) velocity of particle #716 in model ARMS-30 over a time period of ∼365 yr (see Figures 17, 20, 21). The azimuthal velocity remains fixed at 29 km s−1 once the particle hits the inner boundary at 1 au and is thereafter no longer an actively evolving particle (flatline portion to the right).
Download figure:
Standard image High-resolution imageComparing the radial temperature gradient in Figure 19 with that of the gas density in Figure 23 shows that the highest temperatures occur on the shocked edges of the spiral features seen in Figure 18 at 2 o'clock. The gas density of the relatively hot inner disk is relatively low, due in part to accretion onto the central protostar, while the disk gas concentrates just outside the inner disk, beyond ∼6 au, where the temperature drops to the minimum allowed disk temperature of 60 K. This explains why the highest temperatures experienced by particle #716 (Figure 19) occur in relatively low-density, shock-heated phases of its evolution (Figure 21).
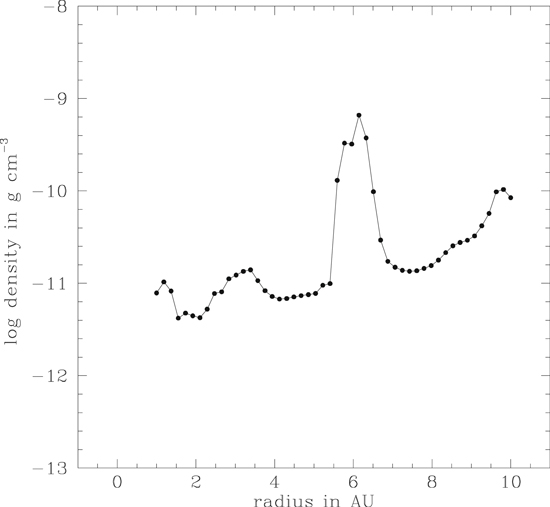
Figure 23. Radial profile of the midplane disk gas density in model ARMS-30 after 94 yr of evolution, corresponding to a radial profile in Figure 18 at 2 o'clock (see Figure 19).
Download figure:
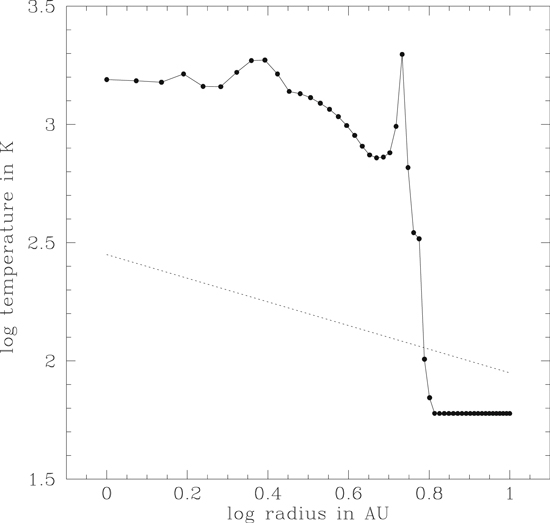
Standard image High-resolution imageFigure 24 displays the same temperature profile as seen in Figure 19, except now plotted on a log–log scale for comparison with the thermal profile T = 280R−1/2 K (R in au) assumed in Nakagawa et al. (1986), a classic paper on particle drag motions in the minimum mass solar nebula. It can be seen that the thermal profile assumed in Nakagawa et al. (1986) differs significantly in all respects from that of the present models, from a much cooler inner disk to a hotter outer disk. The gentle thermal gradient assumed is also quite different from the jagged behavior of the present models, particularly the sharp drop at 6 au. In the Epstein gas drag limit that characterizes these models, the drag depends not only on the gas density, but also on the thermal speed of the gas, i.e., as T1/2, so that the effects of gas drag can vary rapidly in regions with the sharp temperature gradients seen in Figures 19 and 24, as well as with the sharp density gradients seen in Figure 23. As a result, intuition about particle motions based on the classic work of Nakagawa et al. (1986) may be misleading in the context of the present models.
Figure 24. Radial profile of the midplane disk temperatures in model ARMS-30 after 94 yr of evolution, corresponding to a radial profile in Figure 18 at 2 o'clock. This is the same profile as shown in Figure 19, except that the radius is plotted logarithmically, in order to allow a comparison with the thermal profile T = 280R−1/2 K (R in au) (dotted line) assumed in Nakagawa et al. (1986).
Download figure:
Standard image High-resolution image
The sharp temperature gradients associated with spiral-driven features in the present β cooling models suggest another factor that can help explain the enhanced loss of particles compared to the losses in the models of Boss et al. (2012) (see Figures 7 and 9). The models of Boss et al. (2012) assumed a fixed, axially symmetric, radial thermal profile (their Figure 1(C)), so that there was no contribution to the Epstein gas drag caused by sharp variations in the thermal velocity of the gas. Combined with the added phase space for particle loss to the inner boundary associated with the relaxation of the constraint to midplane orbits in Boss et al. (2012), the sharp thermal gradients in the inner disk, along with enhanced Stokes numbers (Figure 20) in the low-density inner disk, suggest that the consequent enhanced particle decoupling from the gas led to more rapid depletion of the surviving particle population in the present models. The fact that particles can only be lost in these models by striking the inner disk boundary at 1 au emphasizes the danger faced by particles traversing the inner disk. This danger is to some extent arbitrary, because an inner disk boundary at 0.05 au would presumably lead to longer particle trajectories prior to being their consumed by the growing protostar, but the danger would still persist.
5. Discussion
The sort of thin particle disk often assumed in models where the particle disk undergoes a self-gravitational instability (e.g., Goldreich & Ward 1973) does not appear to be likely to occur during MGU disk phases: lofting of particles by spiral arms, coupled with large-scale radial transport inward and outward, would seem to prohibit such an instability. The mechanism for particle lofting in the present models is consistent with the suggestion of Boley & Durisen (2006) that the spiral arms act as shock bores, as seen in Figures 11 and 23. Similar evidence for particle lofting has been found in the 3D shearing box models of cm-sized particles in gravitoturbulent disks by Riols et al. (2020), who found a particle vertical scale height only somewhat smaller than that of the disk gas scale height. The global 3D disk models of Bae et al. (2016a, 2016b) demonstrated that spiral density waves can produce turbulence that results in angular momentum transport and vertical mixing of gas, with an effective value of α ∼ 5 × 10⁻⁴, a value similar to that estimated by Boss (2004) of α ∼ 10−3 for MGU disk models similar to those presented here. However, the estimate of Boss (2004) of α ∼ 10−3 was based on the α value where differences began to become apparent compared with an inviscid model. An alternative interpretation of the models of Boss (2004) is that when α ∼ 10−1, the evolution compared to the inviscid model became pronounced, suggesting instead that the effective α viscosity due to MGU effects in those models is closer to α ∼ 10−1, or even higher, than to α ∼ 10−3. Generic turbulence will also loft particles above the disk midplane (e.g., Flock et al. 2017). The 3D shearing box models of Baehr & Klahr (2019) clearly exhibited the same tendency for particles to become concentrated in spiral arms, as seen here (Figure 10) and in the MGU models of Boss (2015). All of these results cast doubt on the usefulness of thin-disk models including both gas and dust grains (e.g., Vorobyov et al. 2018, 2020).
The spiral arms seen in Figure 2 and the ring-like feature seen in Figure 13 are crucial for halting the otherwise rapid loss of particles to inward drift caused by gas drag. These MGU models show that, given that FU Orionis outbursts in young solar-type stars are believed to be frequent and commonplace, the type of relatively quiescent, smooth protoplanetary disk that is often assumed in models of the earliest phases of the planet formation process, with a disk gas pressure that is monotonically decreasing with radial distance (e.g., Klarmann et al. 2018; Krijt et al. 2018; Misener et al. 2019), has little support as a model of the earliest phases of solar-type young stellar objects.
MGU disks also present the opportunity for strong shocks to form that are capable of the rapid heating of solids necessary to explain the thermal processing experienced during chondrule formation (Boss & Durisen 2005). The present models as well as those of Boss (2015) demonstrate that spiral arms are efficient mechanisms for enhancing the local number density of solid particles (e.g., Alexander et al. 2017), possibly alleviating some of the difficulties encountered in achieving the concentration factors inferred for the small-sized particles thought to be chondrule precursors (e.g., Hubbard et al. 2018).
Midplane temperatures exceeding 1778 K are seen in Figures 17–19. Temperatures this high can result in sublimation of a portion of the solid grains responsible for the dust grain opacity, and their loss would result in lower optical depths and hence an enhanced rate of cooling beyond that assumed in the β cooling approximation. In fact, the dust grain opacity models of Pollack et al. (1994), which included a wide range of species, from water ice to olivine, showed Rosseland mean opacity coefficients vanishing above 1500 K. However, even when all dust grains are sublimated, water vapor becomes the next major source of infrared opacity (e.g., Figure 1 of Boss 1984), with the opacities dropping by at most a factor of ∼100 for relevant disk densities at 2000 K, similar to the drop that occurs above ∼150 K when water ices evaporate. Water vapor prevents the drop by a factor of ∼105 in opacity seen in the mean opacities used by Stamatellos et al. (2018) and Mercer et al. (2018), perhaps sufficiently to restore the viability of the β cooling approximation in regions where temperatures may result in partial evaporation. Note, however, that the highest temperatures are only experienced in transient phases of heating in the spiral arms (see Figure 17), and so need not result in complete sublimation followed by re-condensation. Pursuing these questions is the primary focus of the next paper in this series, using improved versions of the thermochemical models used by Boss et al. (2012).
6. Conclusions
These new models extend the work of Boss et al. (2012) and Boss (2015) by allowing vertical motions of the particles as well as a more realistic disk temperature distribution than the fixed axisymmetric distribution assumed in the previous work. With the beta cooling approximation, sharply defined regions of high disk temperatures occur in these MGU disks, further enhancing the non-axisymmetric pressure maxima associated with spiral arms that are experienced by the cm-radius particles. As a result, within ∼100 yr the particles are concentrated by gas drag into the regions of the pressure maxima, as in the previous work, enhancing the local number density of solids. The particles also settle down toward the disk midplane but are lofted upward toward the disk surface by the spiral arms. The spiral arms and rings result in chaotic, large-scale radial transport, both outward to the outer boundary at 10 au, where the particles are reflected back, and inward to the inner boundary at 1 au, where they are stopped from further evolution. As in the models of Boss (2015), significant numbers of particles reach the outer disk and survive for thousands of years, considerably longer than would be expected before spiraling inward to the protostar due to gas drag in a quiescent disk with a gas pressure that monotonically decreased with radius. The models have shown that individual particles can experience wide ranges of disk temperatures during their evolution, from 60 K in the outer disk regions to nearly 2000 K in spiral features. Our future work will build upon the individual particle modeling initiated by Boss et al. (2012) and consider the possible implications for WL rims on CAIs of the dynamic thermochemical processing experienced by solid particles during FU Orionis outbursts.
We thank the referee for numerous exhaustive essays regarding this paper. The computations were performed on the Carnegie Institution memex computer cluster (hpc.carnegiescience.edu) with the support of the Carnegie Scientific Computing Committee.