

Abstract
Powder bed-based additive manufacturing has become increasingly important for industrial applications. In the light of this, qualitative considerations such as the geometrical accuracy, the resulting mechanical properties, and the surface quality of additively manufactured parts must be taken into account. Optical measuring techniques such as confocal laser scanning microscopy, fringe projection and focus variation as well as profilometers are evaluated here, to determine the surface quality of powder bed-based manufactured parts. Even though these surface evaluation methods are established commercially, no standardized measuring procedure has yet been established. Within an experimental study the validity and accuracy of surface measurement methods are evaluated below, taking the limitations of each measurement system and the comparability of areal surface textures into account. The examinations are carried out with the powder materials EN-AW2024, Ti-6V-4Al and PA12, which are processed by electron beam melting, and laser beam melting of metals and polymers. Guidance for a consistent and comparable surface evaluation is thereby provided.
Export citation and abstract BibTeX RIS

Original content from this work may be used under the terms of the Creative Commons Attribution 4.0 license. Any further distribution of this work must maintain attribution to the author(s) and the title of the work, journal citation and DOI.
1. Introduction
Additive manufacturing (AM) processes confer a great deal of freedom in terms of design, and offer the potential to produce parts and assemblies of high geometrical complexity [1]. Selective beam melting technologies represent one major group among the various AM processes. In many industrial applications a laser or electron beam is used to fuse powder particles. Besides the flowability of powder and its recoating properties, a further requirement is the processability of the materials used. In this context the remelting of the powder particles due to elevated temperatures is important [2]. The most common AM systems for selective beam melting are based on metals such as stainless steel, titanium alloys and thermoplastic polymers such as polyamides [2]. For a spatially resolved energy input either an electron or a laser beam is applied. A subdivision of selective beam melting techniques can be achieved by electron beam melting (EBM for metals) or laser beam melting (LBM-M for metals and LBM-P for polymers). The general setup of beam melting systems is shown in figure 1. After the preheating of the building chamber each process is based on three continuously iterated sub-processes of powder coating, exposure phase and consolidation. Before the exposure step a layer of powder of a defined thickness is applied by the recoating mechanism. Metal powders are usually distributed by wiper systems with metal or rubber blades, whereas polymers are commonly applied by stiff metal blades or counter-rotating rollers [3]. CO2-lasers are the state of the art for the exposure process to melt polymers [2] due to good energy coupling of the laser with the polymer powders. For metal processing fibre lasers are generally utilized due to their high absorption ratios [4]. The energy source of EBM is a beam of accelerated electrons within a high vacuum. After selective exposure, the build plate is lowered by the height of one layer of between 30 μm–60 μm for metals, and around 100 μm for polymers [2]. The three process steps are repeated until manufacturing is completed. After the cooling step the parts are unpacked and any adhering powder and residual support structures from the LBM-M process are removed. Parts generated from these three powders and beam-based additive manufacturing processes have certain properties in common. If the same material and process parameters are used the residual porosity of the additive manufactured parts is very similar [4–8]. In addition, an increased surface roughness in the course of construction, due to both the layered build-up structure and adhering powder particles, is common to all three processes [9]. In terms of top and bottom surfaces polymer and metal parts show different surface structures. The surfaces of polymer parts are coated by adhering powder, whereas the bottom sides of metal parts are stabilized by support structures and the top sides are comparatively smooth. Besides the impact of the layer thickness [10] many other factors influence the surface roughness or topography of beam molten parts: particle shape, particle size distribution [11], bulk density [12], part orientation [13–15], processing parameters [13–18], and processing ageing conditions [15] of the powder being used. A variety of techniques are available for measuring the surface quality of beam molten parts. Therefore, the validity and accuracy of various profilometer and optical measurement procedures are evaluated experimentally within the presented study.
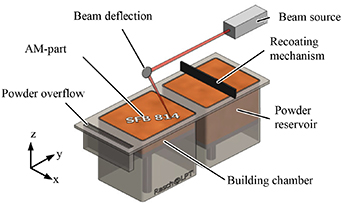
Figure 1. Schematic illustration of the basic setup of powder-based additive manufacturing systems. Reproduced from [19]. CC BY 4.0.
Download figure:
Standard image High-resolution image2. State of the art
Typically, surface texture can be quantified by different characteristic values for either surface profiles or surface areas. However, there is no established special procedure for determining the surface roughness of AM owing to the various challenges of surface evaluation. In particular, parts generated by LBM technologies often exhibit irregular surface structures due to adhering powder particles. This can be observed in the microscopy image of a thin section of a PA12 part shown in figure 2. Furthermore, resulting undercuts complicate an accurate measurement and analysis of a surface [20]. In addition, the layer stacking effects in the z-direction may result in different surface qualities at the specimen sidewalls. Consequently, adapted measurement and evaluation procedures for AM have to be selected to enable comparable and standardized approaches for surface evaluation. In [21] a comprehensive review on surface texture metrology for metal additive manufacturing is given, listing the most common surface measurement technologies. A distinction was made between profile topography measurements, such as profile and areal optical measurements, e.g. focus variation microscopy (chromatic) confocal microscopy, coherence scanning interferometry, atomic force microscopy and elastomeric sensors. Moreover, 2D imaging techniques as optical and scanning electron microscopy also need to be considered. In addition, x-ray computed tomography is mentioned with regard to characterizing part surfaces. It is suggested that in general the expected spatial frequencies, the structure of the topography and the material itself must be taken into account. Significant effects on the quality of the measurement results exist, both in terms of accuracy and of measurement uncertainty [21]. In this article, three established optical surface measurement procedures (focus variation microscopy (FV), fringe projection (FP), and confocal laser-scanning microscopy (CLSM)) are compared with a profilometer measurement to evaluate the capability of each measurement system for the purpose of surface evaluations.
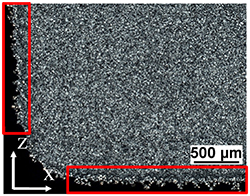
Figure 2. Microscopy image of a PA12 edge region fabricated by LBM-P.
Download figure:
Standard image High-resolution image2.1. Profilometer measurement
Profilometer measurement is a standardized procedure to determine line profile roughness values [22]. During the measurement a probe tip is drawn over the sample surface. The recorded displacement of the probe tip is sampled as a morphologic filtered line profile in relation to the tip radius. With reference to the additional filtered roughness profile (low pass filtered with λs and high pass filtered with λc), the frequently used arithmetic average roughness Ra and the mean roughness depth Rz can be determined [22]. Low pass filtering of the primary profile with the cut-off length λc gives the waviness profile. The form of the component was removed as far as possible beforehand, by subtracting the nominal form [23]. Additional half cut-off lengths before and after the evaluation length ln are required as part of the filtering process [24]. In the case of an expected arithmetic average roughness value of additively manufactured parts of 10 μm < Ra ⩽ 80 μm the measuring length ln is set to 40 mm, whereas a cut-off length λc of 8 mm is needed according to DIN EN ISO 4288 [23]. The roughness values of Ra and Rz can be calculated by equations (2.1) and (2.2) [22]:
Ra is defined as the arithmetic mean of all ordinate values z(x) along the evaluation length ln. Rz represents the arithmetic mean of n single peak-to-valley heights Rzi within the evaluation length ln, whereas Rzi is the height distance between the highest profile peak and the lowest profile valley within a single sampling length lr [22].
2.2. Optical areal surface measurement
In contrast to the analysis of linear profiles, optical measurement procedures allow a fast evaluation of the areal topographies and the corresponding roughness values Si. These surface data give a local description of the whole topography z(x, y). According to the researche [25], the areal arithmetic average roughness Sa is frequently of special interest as regards the real surface texture. This is calculated according to equation (2.3) by a quadratic integral area of the topography, scaled by the measuring field A [26]. It can be compared to the corresponding Ra value by separating the detected topography to a line profile. However, the values Sa and Ra can be different because of the areal filtering for Sa instead of the profile filtering for Ra:
According to the average roughness depth Rz, Sz characterize the measured areal depth of the profile in equation (2.4). Single extreme surface points such as deep valleys or reflections influence this parameter significantly [26]:
2.2.1. Focus variation (FV).
An optical measurement procedure for surface evaluation is focus variation (FV). Depth of focus is used to extract height information about the surface points of components [25]. Due to its high axial resolution of a few micrometres to sub-micormetres it is generally used for analysing roughness parameters [27]. The level of resolution depends on the objective magnification and the depth of focus. Based on a distance measurement the surface is determined by a variation of image sharpness. The measurement object is illuminated and observed by a microscope system with a camera sensor. For each camera pixel the contrast to the surrounding surface points is calculated. As a result, the axial position of the contrast maximum and the surface topography may be reconstructed from an axial scan [28]. Depending on the objective, the size of the measuring fields can vary between square millimetres and square micrometres, leading to lateral resolutions in the range of micrometres to sub-micrometres.
2.2.2. Fringe projection (FP).
Fringe projection (FP) is an areal measuring procedure based on active triangulation. The measurement system consists of a camera and a projector unit [29]. The projector generates a planar and periodical structured pattern of equidistant fringes in defined distances onto the component surface [25]. In relation to the observed texture of the measurement object the fringes are deformed locally, which is detected by the camera system. Surface information can be calculated from the deviation between the initial surface pattern and the deformed pattern [30]. An unambiguous topography measurement and high resolution can be achieved by means of a variation of the fringe pattern and the phase shift technique. Depending on the particular system setup the size of the measuring fields can vary between square meters and square millimetres. The resulting lateral resolution is in the range of millimetres to sub-micrometres. These general conditions allow a wide field of applications for fringe projection which are discussed in [29].
2.2.3. Confocal laser scanning microscopy (CLSM).
Confocal laser scanning microscopy (CLSM) offers a high lateral and axial resolution, dependent on objective magnification and numerical aperture, in the range of micrometres to sub-micrometres. Two apertures are integrated in the observation beam path. Light from the focused surface point reaches the detector [31]. Since the illumination and observation foci are identical this setup is called a confocal system. The setup collects data from a given point in the focal plane without any interference from surrounding light sources. Images are generated by line-wise scanning of the sample surface layer. By repeating these scans for different heights of the specimen, an areal surface topography can be derived [32, 33]. Owing to the lower influence of diffraction, lateral resolution is higher compared to focus variation.
2.3. Limitations of profilometer and optical surface measuring procedures
Each surface measurement technique has different inherent limitations which have to be considered. A comprehensive surface evaluation method does not exist for each measuring application. This is why a combination of different techniques is required to sufficiently resolve the issue of surface roughness. Therefore, an adequate surface evaluation procedure has to be identified, verified and adjusted with respect to different AM materials and processes.
Profilometer measurements in general are well established, standardized and offer a high reproducibility and traceability. However, direct contact with the surface of the measurement objects carries several disadvantages. For example, the probe tip acts as a mechanical low pass filter. Hence, any recorded values depend on the radius and cone angle of the probe tip. The specimen surface can be altered due to mechanical contact with the probe tip. This additional smoothing or scratching of the surface increases the associated measurement uncertainty.
In contrast, optical surface analysing techniques arecontactless in operation. Nevertheless, they also have limitations. Optical systems capture the optical or electromagnetic surface. Optical disturbances from the environment or the illumination of the specimen can have an effect on any surface analysis [27]. The material specific structure can creatediverse optical scattering reflections, causing misinterpretations by the optical sensors. Additionally, overexposure induces illumination peaks, particularly with AM-metals, due to the high reflectivity of metal surfaces. These illumination peaks lead to missing information regarding surface texture and consequently falsify the calculation of the roughness parameters. With sensor optics, the maximum inclination of the surface is limited by the detection of the reflected light. Thus it is critically dependent on the nature of the reflection required by the measuring principle. Another influencing factor is the achievement of an adequate lateral and axial resolution of the optical system, which is crucial for measurement tasks [29]. Large measuring fields may however be reached by means of a stitching of adjacent sections.
2.4. Surface evaluation of powder-based AM parts
To date, profilometer measurement procedures are the most common methods for reproducible and traceable surface characterization of additive manufactured parts. Schmidt summarized that, for the thermoplastic polymer polyamide 12 (PA12), the resulting values of the arithmetic average roughness Ra vary in the range of approximately 10 μm ± 3 μm. The mean roughness depth Rz varies in the range of 50 μm to 150 μm [34]. However, these values are only valid for the top and the bottom layer of the fabricated parts and depend on the particle size (d50 ≈ 60 μm) of the powders. In general, powder-based additive manufacturing exhibits a high surface roughness in the z-direction as shown in [9] for Inconel 635 parts.
In [35] Triantaphyllou et al compared three different surface roughness evaluating techniques: a profilometer measurement, an optical areal measurement setup (infinite focus microscope or focus variation), and a destructive proprietary image analysis. LBM-M and EBM of Ti-6V-4Al parts are characterised by different build orientations. It is shown that the results of the destructive investigation method are consistent with profilometer measurement values. It is also stated that structures such as undercuts cannot be detected by either profile or optical approaches. In terms of optical characterization, the validity of the results gained from the highly reflective 0° LBM-M surfaces was questionable [21, 35].
Grimm et al have analysed differently oriented LBM-P and LBM-M parts using confocal microscopy and profilometer measurements. Confocal microscopy is suggested for an optical three-dimensional topography measurement. This offers a high statistical significance compared with state-of-the-art profilometry. The study finds that the surfaces of LBM-P parts are more difficult to evaluate compared to LBM-M parts, due to a lower level of detail. Profile and areal surface roughness values are classified to show the significance for special applications of surface evaluations [36, 37]. The examinations are extended by a direct correlation between mechanical properties and areal surface roughness parameters [38].
Launhardt et al have presented a surface evaluation of the roughness of a standard steel plate [27]. This shows that the profilometer and optical measurement techniques under consideration give different roughness values according to their measurement limitations. Relating to the reference standard plate, which is calibrated by a stylus instrument, the focus variation and the regarded GFM Micro CAD 0.3 fringe projection sensor (FP) show slightly increased roughness values. CLSM microscopy determines unrealistically high roughness parameters. In contrast to [36], profilometry is recommended as a fast and reproducible method to characterize surface texture even if the probe tip causes scratches on the plastic surface and influences the surface values.
A universally applicable approach for a surface characterization of AM parts in a reproducible and transferable way is still lacking. For this reason, it is necessary to determine a standard measuring procedure for the surface evaluation of additively manufactured powder-based polymer and metal parts.
3. Experimental setup
3.1. Additive manufacturing techniques
Repeatability and accuracy for the surface characterization of powder- and beam-based additively manufactured parts fabricated by LBM-P, LBM-M and EBM is evaluated. A comparison between the four measuring procedures is shown in table 1. The measured surface roughnesses are evaluated for three different powders. A correlation to the initial particle shape and size is given. All specimens analysed in this study have been produced with parameters conforming with standard ranges for each individual manufacturing technique. For EBM specimens an Arcam S12 retrofit (ATHENE) is used, which has been built in collaboration with pro-beam AG & Co. KGaA (Planegg, Germany) and the Chair Materials Science and Engineering for Metals (WTM). The LBM-M specimens are manufactured using the commercial LBM machine SLM 280HL by SLM Solutions AG (Lübeck, Germany). The LBM-P specimens have been built on a lab machine developed by the Institute of Polymer Technology (LKT). The laser-based processes are conducted under inert gas atmosphere at normal pressure. For a high-quality electron beam melting process it is essential to work under vacuum conditions.
Table 1. Manufacturing parameters of manufacturing techniques.
| EBM | LBM-M | LBM-M | LBM-P | ||
|---|---|---|---|---|---|
| Material | Unit | Ti-6V-4Al | Ti-6V-4Al | EN-AW 2024 | PA 12 |
| Machine | ATHENE | SLM 280HL | SLM 280HL | Research system | |
| Beam power | W | 1110 | 275 | 160 | 16 |
| Beam diameter | μm | 300 | 80 | 80 | 400 |
| Scanning speed | mm s−1 | 10 000 | 775 | 60 | 2000 |
| Hatch line spacing | μm | 100 | 120 | 60 | 200 |
| Layer thickness | μm | 50 | 50 | 30 | 100 |
| Hatch rotation per slice | ° | 90 | 67 | 37 | - |
| Preheating temperature | °C | 730 | 200 | 200 | 172 |
| Process atmosphere | Bar | 10−6 (He) | 1 (Ar) | 1 (Ar) | 1 (N2) |
3.2. Powder-based materials
The Ti-6V-4Al powders used for EBM and LBM-M are provided by Tekna Plasma Europe and TLS Technik GmbH & Co. Spezialpulver KG (Bitterfeld, Germany).
The plasma spheroidization process applied by Tekna offers a high powder quality with a very low number of satellite particles, which is crucial for EBM process stability. For the LBM-M process the Ti-6V-4Al powder is atomized by electrode induction melting gas atomization (EIGA). Here, a rod of raw material is rendered molten by induction heating. A constant stream of liquid metal passes without contact through a ring nozzle. A high-pressure inert gas jet atomizes the molten material. The resulting Ti-6V-4Al powder shows spherical morphology and consists of several alloying elements (Ti ~ 89,6 wt. %, Al ~ 6.1 wt. %, V ~ 4.1 wt. %, Fe ~ 0.2 wt. %) [39, 40]. The aluminium alloy EN-AW 2024 is characterized by the use of alloying additives of raw powder (Cu ~ 3.78 wt. %, Mg ~ 1.33 wt. %, Mn ~ 0.66 wt. %, Si ~ 0.17 wt. %, Fe ~ 0.10 wt. %) [19]. The acquired powder from Nanoval GmbH & Co. KG (Berlin, Germany) is also inert gas atomized with argon. To produce polymer parts, (PA2200) polyamide 12 powder from EOS GmbH (Krailling, Germany) is used with refreshing rates of 50/50 wt.%. The aged powder is taken from overflow powder with a short thermal impact time. Detailed information regarding powder size distributions is given in table 2, in addition to further material characteristics given in [34, 41, 42].
Table 2. Powder size distributions of the used materials.
| Method | EBM | LBM-M | LBM-M | LBM-P | |
|---|---|---|---|---|---|
| Material | Ti-6V-4Al | Ti-6V-4Al | EN-AW 2024 | PA12 | |
| D10 | μm | 54 | 39 | 3 | 46 |
| D50 | μm | 72 | 49 | 7 | 62 |
| D90 | μm | 100 | 55 | 13 | 83 |
| Size distribution | μm | 45–105 | 20–63 | 1–20 | 20–90 |
3.3. Specimen
The selected specimen geometry in figure 3(a) is designed to evaluate surface roughness using different measurement techniques. Previous experiments on PA12 have shown Ra values between 13 μm–17 μm and Rz distributions between 95 μm–120 μm, which require an evaluation length ln of 40 mm and a traversing length lt of 56 mm [23, 43, 44]. Therefore, the specimen length is set to 60 mm with a cross section of 15 mm × 15 mm. To analyse the influence of the recoating process, five specimens (A-E) are built with varying positions in the process chamber, as illustrated in figure 3(b). A symmetrical positioning is chosen for each manufacturing process, whereas specimen C has been built in the centre of the powder bed. Surface evaluation is performed at all four sides of each specimen for each manufactured material.
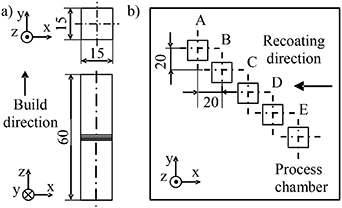
Figure 3. Specimen geometry (a) and positioning in the process chamber (b).
Download figure:
Standard image High-resolution image3.4. Surface measurements
3.4.1. Profilometer measurement.
Profilometer measurements are conducted at the end of the parameter study as a final measurement because potential plastic deformations of the surface by the probe tip may falsify other surface measurements. Each side of the specimens is measured with five repetitions. The distance between the adjacent measurement lines is set to 0.2 mm. The lines are aligned symmetrically around the symmetry planes of the cross section. Further process parameters, such as probe tip geometry, distance between points on the measuring line, tracer velocity, and force are listed in table 3.
Table 3. Parameters for profilometer measurement.
| Tip radius rt | Velocity vTracer | Point distance lp | Force Ft |
|---|---|---|---|
| 2 μm | 0.5 mm s | 1.5 μm | 1 mN |
3.4.2. Focus variation (FV).
The surface measurements are conducted by focus variation. The object is positioned on a mobile measuring table, which can be shifted in lateral x- and y- direction. The vertical scanning and corresponding variation of the image depth of focus are realized by a controlled movement of the scanning microscope relative to the surface of the specimen. To characterize the surface of the additively manufactured specimen according to ISO 4287 [22] and ISO 25 178 [26] an appropriate objective for a stitched measurement field of 60.0 mm × 1.0 mm and a stated axial resolution of 1.21 μm is chosen.
3.4.3. Fringe projection (FP).
For larger-scaled surface analysis the fringe projection technique is applied using a device with a measuring field of 74 mm × 62 mm and a point distance of 30 μm. The measuring angle between the specimen surface and the fringe projector is set to 90° at a working distance of 760 mm, enabling a full surface scan. Therefore, every surface of the specimen is measured once. The unfiltered and unprocessed data is exported as a standard tessellation language (STL) file for the purpose of assessment.
3.4.4. Confocal laser scanning microscopy (CLSM).
Confocal laser scanning microscopy offers high resolutions but consequently small measuring fields compared to other methods. The device used in this study offers a measuring field size of 1.28 mm × 32.00 mm, a stated lateral resolution of 120 nm, and stated minimal axial resolution of 20 nm. The maximum length of the scan is limited to 32 mm. Two separate measurements of each surface are conducted and saved without any filters in the native data format of the microscope. An overlap between the two measurements allows a subsequent stitching of the scans.
3.5. Consistent surface evaluations
It is vital to use one uniform analysing software tool for a consistent evaluation to obtain comparable results for all different determined surface data. Hence, all measuring data are evaluated by Mountains Map Premium 7.0, which can handle the different measurement system-specific import files by interpreting the surface topographies according to the aforementioned ISO standards. Indeed, each surface detection technique observes the same measuring field with a length of 60 mm in the centre of the specimen. Different magnifications lead to diverse numbers of single fields. These fields have to be combined consistently and overlapped by the software to receive areal surface values Si for the entire measuring field. Next, the optically observed area is divided automatically into a huge number of profile lines in order to analyse the arithmetic average 2D-roughness parameter Ri based on equations (2.1) and (2.2). In this way, a direct comparison between the data of the profile measurement and its calculated average of the five repetition profile lines is ensured.
4. Results
Based on surface evaluations [27] and the reference measurement using a metal plate presented above, the following evaluations of additively manufactured parts are examined for profilometer and optical measurement techniques (FV, FP and CLSM) and extended by new insights regarding surface evaluations. After a verification of the repeatability of the optical measurements, a step height calibration is done to estimate appearing scaling errors. A further pre-investigation and data fusion of a defined referencing field should reveal whether the detected areal surface structures are congruent. This congruence of topography is an important condition for comparative surface evaluations, following filtering operations and calculations of the surface values. Based on the pre-investigations, a comparison of the observed areal and linear profile parameters is conducted. The influence of materials used, the positioning of the additively manufactured specimen, and the recoating directions on the sidewall surfaces are examined in order to arrive at a qualification of application- specific surface detection methods. Finally, material ratio curves and spectral density analysis allow an analysis of the capability of optical measurement techniques to detectand separate single particles. Consequently, these examinations should provide guidance for comparable surface measurements in order to reach a standardized procedure for surface evaluation.
4.1. Repeatability of optical measurements
At least 20 measurements are necessary for each optical measuring system and equal environmental conditions must obtain, in order to to analyse repeatability. The surface data have been observed by each measurements technique on the same referencing field of a chosen titanium sidewall of specimen C in the centre of the powder bed. As figure 4 shows, the repeatability of all optical measurements is given. The sidewall roughness Ra of the CLSM system fluctuates within a range of ±0.032 μm. The corresponding standard deviation of the CLSM analysis has been calculated to 0.068 μm, which is still an acceptable value for surface evaluations. The fluctuations of the FP and the FV system are considered as ideal, with standard deviations of 0.014 μm and 0.004 μm, respectively, indicating a good repeatability of measurement. Nevertheless, measurement uncertainty and the data quality of the recorded surface profiles, relating to system capability and the different resolutions of the measurement systems, is examined in detail below.
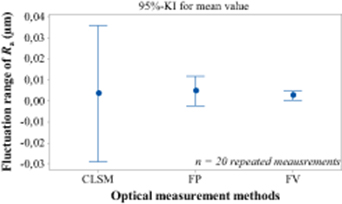
Figure 4. Repeatability of optical roughness measurements (specimen C, Ti-6V-4Al, manufactured by LBM-M).
Download figure:
Standard image High-resolution image4.2. Step height calibration measurement
A first indication that the used fringe projection sensor is not suitable for surface evaluations can be observed from the step height measurements due to the limited number of measuring points. For this reason the insufficient resolution in z-direction may be assumed, which will be examined in the next section. A calibration standard (figure 5) with a defined step height of 999.99 μm has been analysed by each optical system. The step height has been evaluated regarding DIN EN ISO 5436–1 (type A1). To avoid the influence of the curvature of the step height, 1/3 of each surface close to the edge are not considered within the evaluation [45] as illustrated in figure 6. With the exception of the FP measurement system which measures a step height of only 951.19 μm, FV and CLSM evaluation obtain comparable results next to the calibration value as listed in table 4. Although the exact step height cannot be determined by the optical measurement system a deviation of 1.28 μm with the FV and 0.70 μm with the CLSM are acceptable results within the expected range of measurement accuracy.
Table 4. Results of the step height measurement.
| Method | FV | FP | CLSM |
|---|---|---|---|
| Step height | 1 001.27 μm | 951.19 μm | 1 000.69 μm |
| Deviation | 1,28 μm | −48.80 μm | 0,70 μm |
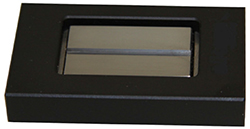
Figure 5. Step height calibration tool.
Download figure:
Standard image High-resolution image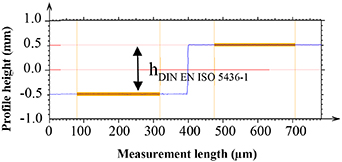
Figure 6. Calculation of the step height.
Download figure:
Standard image High-resolution image4.3. Best-fit of surface topographies
It is well known that diverse surface measurement techniques determine different roughness values. This fact is mostly ascribed to the varied metrological structural resolutions and limitations of the measurement systems. However, another important influencing factor is a similar measurement field on the sample,which is often adjusted insufficiently. In particular, optical measuring systems operate with different viewing angles, which is disadvantageous for the detection of the measuring area. Consequently, a basic analysis of the areal measuring field is essential before commencing the evaluation and the calculation of roughness values. Figure 7 illustrates, representative for the other examined materials, the raw data imaging of EN-AW2024 using (a) focus variation (FV), (b) fringe projection (FP) and (c) confocal laser scanning microscopy (CLSM). The measured section of the FP sensor in (b) indicates that the axial resolution respective to the given point distance of 30 μm is not adequate to detect surface structures. Nevertheless, this optical measurement method is examined to assess its influence on roughness results in comparison with the GFM Micro CAD 0.3 fringe projection sensor [27]. In contrast, the raw image data of the focus variation with an axial resolution of 1.21 μm in (a) shows easily detectable surface structures. The CLSM in (c) has the best axial resolution with 20 nm. However, metal surfaces in particular, exemplified by the EN-AW2024 aluminium alloy, cause a large amount of peaks. These peaks can also be observed within the overlap of CLSM and FV in figure 8 fitted by Polyworks 2017 software. Three small markers are yielded at the corners of a 2 mm × 2 mm referencing field on the sidewall of a specimen surface for the purpose of accurate comparability of the observed area. The additively manufactured specimens are positioned by a mechanical reference contact to obtain comparable and repeatable results by pre-alignment. Within an observation of this field and its markers the surface topographies detected by the three optical measurement systems can then be fitted subsequently. A further Gaussian filtering has been used to achieve a better comparison between the FV and CLSM surfaces, which are adapted to a comparable resolution. The evaluation of the filtered contour confirms the hypothesis that hills and valleys in the detected surface topographies are approximately next to each other. Even if the data fusion of the measuring fields allows only a subjective assessment of surface congruency, the standard deviation of mean with a value of 5 μm confirms the good accordance of the measurement data. The detected deviation in congruency is similar for filtered and unfiltered evaluations. Consequently, the basic condition of a direct comparison of the FV and CLSM data is given for the surface evaluations below. Also the roughness values Si show rudimentary comparable results relating to the entire surface under consideration. The evaluated data can then be transferred to the roughness value calculations shown below. Conclusions for a larger measuring field of 1 mm × 60 mm according to ISO 4288 can also be derived [23].
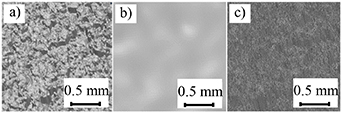
Figure 7. Compared sections of EN-AW2024 by (a) FV, (b) FP and (c) CLSM between reference markers.
Download figure:
Standard image High-resolution image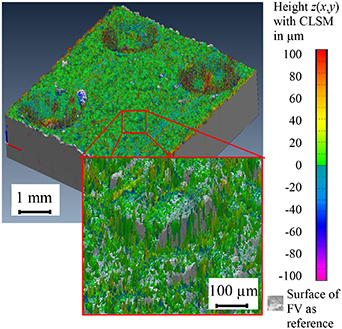
Figure 8. Overlap of referencing measuring fields of EN-AW2024 with FV and CLSM.
Download figure:
Standard image High-resolution image4.4. Comparison of areal and profile measurement techniques
As mentioned in the experimental procedures, 20 specimens are produced in total for three different materials, using four additive manufacturing machines, each producing five specimens (A–E). Surface evaluations have been conducted for each of the four specimen sidewalls using optical and profilometer methods to obtain consistent and comparable results. The areal detected topographies are used to calculate the roughness values Sa and Sz. The Ra and Rz parameters are determined by a separation of the observed area into profile lines as described in section 3.5. A comparison of arithmetic roughness values is illustrated with reference to the optical measurement systems in figure 9, a representative illustration for specimen C of PA12. In general, the profile Ra values seem to be smaller than the areal Sa values, regardless of the optical measuring system. Since Ra values are already calculated as a mean value of thousands of profile lines they are more stable and less susceptible to local effects in the measuring field. The evident observed periodical trend of the FP measurement may be ascribed to a randomized effect on the detected surface. A closer assessment of the measurement technique specific dispersions in figure 10 shows differences relating to the roughness values Ra and Sa as well as between the measurement techniques employed. There is no large gap between the calculated roughness parameters Ra and Sa for CLSM. The comparatively highest mean value of Ra = 23.5 μm and a standard deviation of 1.5 μm was observed for PA12. In contrast, the gap between Ra and Sa is much higher for FV measurements, though Ra shows a lower standard deviation with 0.8 μm and a mean value of 7.8 μm. The FP has the largest dispersion for the areal surface value Sa, whereas the derived Ra value clearly shows the lowest dispersion, with a standard deviation of 0.4 μm and Ra = 3.0 μm owing to insufficient resolution. The reference value of 15.2 μm determined by the profilometer measurement is not achieved by any of the observed optical measurement systems, a tendency previously noted by Launhardt et al [27]. Here, the trend has also been verified that the mean roughness depth Sz and the analogue Rz values are far higher than the arithmetic mean parameters as illustrated in figure 11. Reflectance peaks may cause high roughness values and a dispersive distribution of the detected Rz and Sz parameters. For this reason, these mean roughness depth values are not significant and not plotted in the following evaluations. Further to the examinations of Launhardt et al [27], who proved that the presented trends may be associated with the limitations of profilometer and optical surface measuring methods, the evaluations below focus on additional influencing factors. In this context, the analysis of the material influence and the location of the measuring area will be examined to come to continuative statements regarding applications.
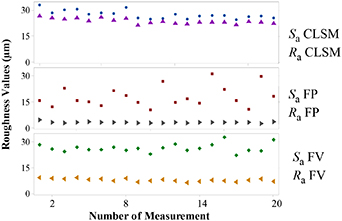
Figure 9. Ra and Sa values for PA12 (all specimen sidewalls).
Download figure:
Standard image High-resolution image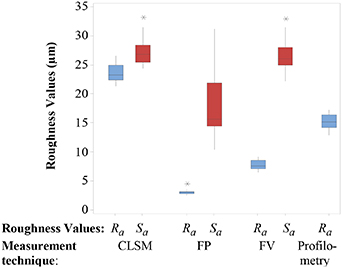
Figure 10. Comparison of Ra and Sa for PA12 (all specimen sidewalls).
Download figure:
Standard image High-resolution image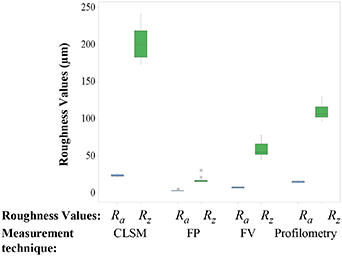
Figure 11. Comparison of Ra and Rz for PA12 (all specimen sidewalls).
Download figure:
Standard image High-resolution image4.5. Material specific roughness
As with the analysis of the material specific sidewall roughness, the differences between the optical and profilometer measurement techniques are also apparent in figure 12. With regard to the profilometer reference measurements of the examined materials, a small range between 11 μm–18 μm was reached for Ra. In total, the determined roughness is broadly similar to the results of measurement specific evaluations, except for the arithmetic roughness values of the Ti-6V-4Al manufactured by the EBM process. Each optical measuring method registered comparatively high values and distributions, indicative of reduced quality at the sidewall surfaces. A deficient connection between the layers and the high size distribution of the powder, as shown in table 2, is responsible for these deviations in EBM. In contrast, the additively manufactured Ti-6V-4Al specimens of the LBM process offer overall low sidewall roughness and a very smooth surface without obvious layer effects. This fact points to controlled parameter settings in the LBM manufacturing of the titanium alloy. Finally, the EN-AW2024 and PA12 materials show comparable sidewall surfaces regardless ofmeasurement technique.
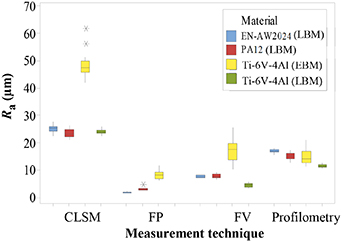
Figure 12. Material and measurement technique depending roughness (average value of all specimen).
Download figure:
Standard image High-resolution image4.6. Influence of AM process concerning specimen positioning and recoating direction
In addition to the influence of materials on surface roughness, additional factors such as the positioning of the specimen in the powder bed and the direction of the powder coating were analysed to determine their effects on the sidewall surfaces. As the influence of the material composition of of the powders utilised is almost identical, the following analysis is conducted using PA12 powderbut could be considered as equally representative of the behaviour of EN-AW2024 or Ti-6V-4Al. According to manufacturing process, the five specimens were positioned symmetrically around the centre of the powder bed. This layout of the specimens allows an analysis of manufacturing inhomogeneities at the border areas of the building plate caused by heat transferring effects. As figure 13 demonstrates, these effects have no major influence on the sidewall surfaces if all manufactured specimens are compared. The calculated average arithmetic roughness of each of the five specimens is broadly constant for all observed measurement technique-dependent surface evaluations. In addition, the recoating influence on sidewall surfaces parallel and perpendicular to the recoating direction are examined in figure 14. Likewise, the arithmetic mean roughness values Ra are not significantly different according to the ANOVA analysis of variances and a calculated p value of 0.67 > α = 0.05. The perpendicular surfaces to the recoating direction 'Front' and 'Back' exhibit slightly increased parameter dispersions compared to the parallel recoated sidewalls. After due considerationl, it can be stated that the influence of positioning and recoating direction on the manufactured sidewall surfaces layer by layer in z-direction are relatively small. Further impacts such as stepping effects and local defects interfere at the manufactured sidewalls. Consequently, a continuative evaluation is necessary to analyse and separate all influencing effects.
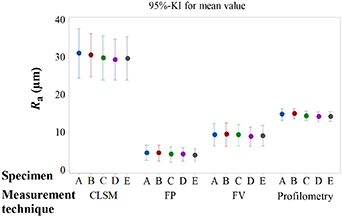
Figure 13. Specimen and measurement technique specific roughness for PA12.
Download figure:
Standard image High-resolution image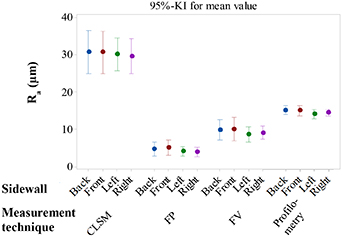
Figure 14. Sidewall and measurement technique depending roughness for PA12.
Download figure:
Standard image High-resolution image4.7. Characterisation using material ratio curves
The material ratio curve or Abbott curve is another frequently used tool for the characterization and comparison of surfaces, preferably with Gaussian distributed heights for the topography. The parameters are defined in ISO 13 565–2 and ISO 25 178–2 [26, 46]. The ISO 13 565–3 presupposes a normal distribution for the material probability curve and the derived parameters [47].
As shown in figure 2 the surface texture may be influenced by partially adhering powder particles. In the worst cases, a single layer of unmolten particles may influence surface roughness. Consequently, a material ratio curve is used in figure 15 to estimate this influence, regarding a single (PA12) powder layer on a smooth surface of a roughness standard with a defined texture (Ra = 0.05 μm), as illustrated in figure 16. The measured material ratio of a single PA12 layer (illustrated in orange) with an area coverage of about 50% is conformed to the powder particle distribution of table 2. It shows an averaged powder size of ~60 μm. It should be noted that the optical measuring system is unable to detect undercuts of PA12 powder particles. Nevertheless, the grey Abott curve of the PA12 powder on the roughness standard shows a clear transition between the thin powder layer and the smooth surface of the roughness standard. This transition confirms the powder distribution of ~50% in figure 16 on the roughness standard. The detected profile height is locally higher than the average powder size distribution because some powder particles may stack upon the smooth surface. Shading problems of single powder particles are a possible reason for the unexpected early transition of the grey Abott curve at a cumulative height of >90%.
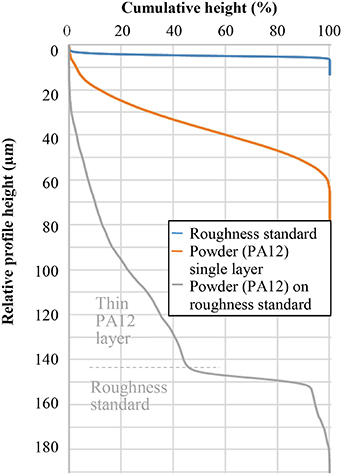
Figure 15. Material ration curves for PA12 single powder layer, roughness standard and the combination measured by FV.
Download figure:
Standard image High-resolution image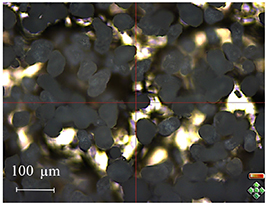
Figure 16. Microscopy picture of PA12 powder on the roughness standard captured by focus variation.
Download figure:
Standard image High-resolution imageIn comparison to the Abott curves of the material specific specimen sidewalls in figure 17 the trend of the observed material ratios is very similar. Only the transition zone is not distinctive at the sidewalls of the manufactured parts because single powder particles are adhering at the surfaces.
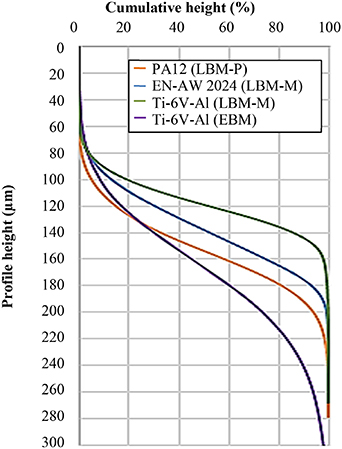
Figure 17. Material ratio curves for specimen C measured by FV.
Download figure:
Standard image High-resolution image4.8. Characterisation using power spectral density analysis
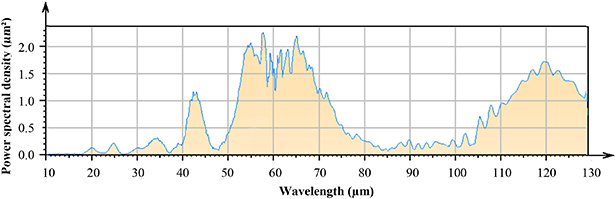
A further mathematical tool for surface evaluation is power spectral density (PSD) analysis, which dissects the topography into separate parts from distinct spatial frequencies or wavelengths. PSD is mathematically a Fast Fourier Transformation (FFT) of the autocorrelation function of the signal, which consists of a spectral or wavelength itemized power [48, 49]. The topography signal of the line profile of the PA12 single powder layer of section 4.7 is analysed statistically to obtain specific wavelengths. The power spectrum can be used to identify the powder size distribution of the materials used, in addition to the sophisticated material analysis discussed in section 3.2. In compliance with the particle size distribution of PA12 in table 2 the power spectral density of figure 18 shows a large and similar specific peak around a wavelength of 60 μm. A further and smaller amount of particles of the single analysed powder layer can be identified with an average peak at 43 μm. The large power spectral density at 110 μm to 130 μm may be explained by of the powder covering of ~50% and its interjacent gaps.
Figure 18. Power spectral density (PSD) analysis of a single PA12 powder layer.
Download figure:
Standard image High-resolution image
4.9. Qualification of application specific surface detection methods
To complete the results of the surface evaluations in section 4, a qualification of surface specific surface detection methods is given. Firstly, the selection of a suitable measuring system with a sufficient resolution is essential for surface evaluations. As can be seen in figure 7(b) the resolution of the observed fringe projection system was too low for roughness analysis, leading to an unrealistic calculation of the roughness parameters. Pre-investigations of the capability of the measurement system, as well as examinations of the repeatability and the congruency of the compared surfaces are necessary for further evaluations. The comparison of the areal and profile parameters in section 4.4 indicates that a judicious selection of the calculated roughness parameter in dependency of the measuring system is also important. Using the example of the mean roughness depth Sz and Rz, surface evaluation with optical systems is not recommended because bad wings may critically falsify the calculated roughness results. Concerning the analysis of the sidewall surfaces, the arithmetic roughness values are appropriate for repeatable and stable surface evaluations. The profilometer measurement method is mostly a reference but not ideal for all surface evaluations and materials, due to the filtering effects of the tip, as analysed in [27]. The well-regarded CLSM technique has an ordinary repeatability but determines high roughness values and distributions. A good compromise for surface evaluations is focus variation. This optical measurement technique allows areal evaluations with an adequate resolution. In fact, the determined roughness values are smaller than the profile references but the results are reproducible and approximately stable versus environmental conditions. This result has been confirmed in [36].
5. Conclusion
Currently, no standardized measuring procedure for evaluating the surface quality of powder bed-based additively manufactured parts has been established. Obtaining comparative quality measurements for these parts is challenging using established surface measuring techniques. Therefore, this paper has presented a comparison between different measuring methods in order to provide assistance for researchers and engineers to realize consistent measuring conditions and to support the interpretation of the measured data. For this purpose guidance was given for a comparative surface evaluation. Different powder bed-based additive manufacturing methods such as EBM, LBM-M and LBM-P were applied to evaluate consistent specimens with different materials (Ti-6V-4Al, EN-AW2024, PA12) and parameter settings. A possible generalisation of this guidance may equally be applied to other powder-based materials, manufacturing techniques and process parameter settings. It has been shown that the calculated material specific surface roughness of metal and polymer parts is comparable concerning different optical and profilometer measurement methods. However, the material-dependent roughness can vary according to the additive manufacturing processes employed. Consequently, the suitability of various optical surface detection techniques such as focus variation (FV), fringe projection (FP) and confocal laser-scanning microscopy (CLSM) were investigated alongside the established profilometer measurement technique in order to evaluate the surface profile. The monitored raw data sets were all processed using the same software in order to minimize the influence of different algorithms and users. Having verified the various measurement system capabilities and evaluated the reproducibility of the processes, an additional step height calibration has been conducted. A following fitting of the observed topographies allows a first assessment of the congruency of the surfaces. Only if these conditions were verified and if the significant roughness values were determined, could a direct comparison of different surface data be enabled. After a short examination of the material positioning and recoating influence on the surface quality of the sidewalls a qualification of application-specific surface detection methods was given. The focus variation technique was found to be suitable as an areal surface detection method for surface evaluations on additively manufactured parts, although an additional adjustment of the linear profilometer measurement is also advised. Finally, material ratio curves and spectral density analysis of the FV analysis show the ability of this measuring system to separate single powder particles. Together with sufficient resolution and low measurement uncertainty, this last analysis is required in order to estimate a comprehensive surface evaluation of measurement systems.
Acknowledgments
The authors want to thank the German Research Foundation (DFG) for funding the Collaborative Research Centre 814 (CRC 814)–Additive Manufacturing, sub-projects A5, B2, B3, B5 and C4. Furthermore, the authors gratefully acknowledge the support of the Erlangen Graduate School in Advanced Optical Technologies (SAOT).
Author contributions7
Hausotte oversaw project administration and contributed to the conceptualization, supervision, methodology, writing, editing and review process. Heinl led the editing and review process, supervision, writing (the original draft), contributed data curation, formal analysis, investigation, methodology, software, validation and visualization. Greiner, Pobel, Rasch, Huber, Papke contributed investigations, resources, software, visualisation, writing, supported review and editing. Wudy, Merklein, Schmidt, Körner, Drummer contributed supervision, subproject administration, editing and review process.
Footnotes
- 7
Author contributions according to listed author roles of CRediT (https://casrai.org/credit/- 12.02.2020).