


Abstract
The National Ignition Facility (NIF) at Lawrence Livermore National Laboratory, is the first of its kind megajoule-class laser facility with 192 beams capable of delivering over 1.8 MJ and 500TW of 351 nm light for high accuracy laser-matter interaction experiments. It has been commissioned and operated since 2009 to support a wide range of missions including the study of inertial confinement fusion, high energy density physics, material science, and laboratory astrophysics. In the first section of this paper we discuss the current status of laser performance obtained during the 408 target experiments completed in 2017. The performance spanned a wide range of laser energies, powers and pulse durations as requested for these target experiments. A special emphasis is given on energy delivery and cone power accuracy in the UV, as these are key parameters for successful experiments. In the second section of the paper, the results obtained during the 2017 performance quad campaign are briefly described. During this campaign a series of laser-only shots were taken to perform tests at elevated energies on a single NIF quad. These tests were designed to assess laser performance limits and operational costs against predictive models. This campaign culminated with the delivery of ~54 kJ of UV on a single quad of NIF, and 14 kJ on a single beam aperture, which are both to our knowledge the largest energies achieved to date for a neodymium-glass, frequency tripled architecture.
Export citation and abstract BibTeX RIS
1. NIF Laser Performance Status
1.1. Introduction
NIF laser design criteria includes the ability to routinely generate pulses up to 1.8 MJ total energy at 351 nm, with peak power up to 500 TW and precisely-controlled temporal pulse shapes with powers spanning two orders of magnitude [1]. The focal spot fluence distribution of these pulses is conditioned, through a combination of continuous phase plates in between the SHG and THG crystals in the final optic assembly, smoothing by spectral dispersion, and the overlapping of multiple beams with orthogonal polarizations [2]. A dedicated software tool suite was developed by the NIF team to operate the laser safely and efficiently leading over the years to significant shot rate increase, with a sustained performance of ~400 target experiments per year. Figure 1 describes the breakdown of the NIF experiments in terms of the various programs: diagnostic development, discovery science, national security applications, stockpile stewardship-high energy density, inertial confinement fusion and laser performance. In 2017, the total number of all combined experiments was 485 with 408 for target experiments.
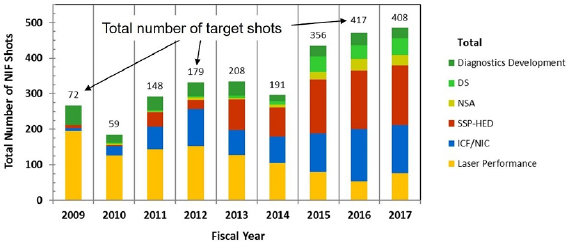
Figure 1. Experiments performed since the NIF commissioning.
Download figure:
Standard image High-resolution image1.2. Modeling the NIF beam lines for accurate performance delivery
During the design of their experiments, NIF users can select all or a subset of the 192 beams, request specific energies, pulse shapes on target, pointing location in space, defocus and three precise wavelengths for the inner 23.5° and 30°, and outer cones around 351 nm (with maximal detuning between the inner and outer cones of 4.6 Å in the UV). This set of data is often referred to as 'shot goals' and constitute the deliverables in the UV for a given experiment.
To consistently deliver stringent requested performance, the NIF team developed a software called 'Laser Performance Operations Model' or LPOM [3, 4]. LPOM has three main functions that are critical for the NIF laser operations: automate the shot setup, ensure the equipment protection/machine safety and provide post-shot analysis. The first two functions take place before the experiment and the third obviously after. The following paragraph will focus on the first item as it directly impacts the performance delivered to target chamber center (TCC).
To perform the calculations required for laser setup, each of the 192 beam lines is individually modeled using the virtual beam line (VBL) code that contains the relevant physics for the NIF laser performance (laser propagation/diffraction, amplification and nonlinear optics) [5]. The code inputs for the whole laser system include the specific geometry and configuration of each beamline, the optics metrology files, known material constants as well as data from on-line calibration experiments. All relevant files are stored in databases or internally in LPOM. With these VBL models, LPOM can accurately set up the pulse shapes requested at the Master Oscillator Room (MOR) for each of the 48 sets of four beams (aka 'quads'). LPOM adjusts the various waveplates for the split ratios from the quads into the individual beams and the neutral density filters in the various laser diagnostics. LPOM takes the shot goals and employs the VBL models (accounting for frequency conversion with depletion and laser amplification with gain saturation) to perform an inverse pulse solve and determines how to setup the laser to meet the shot requirements. Specifically, these calculations predict what temporal shapes and energies should be produced in the MOR for the various quads, and what fraction of the quad energies should be injected in each beamline (called laser setpoints). LPOM also determines the settings for the neutral density filters employed in the diagnostics (diagnostics setpoints). The LPOM interfaces to laser and diagnostic setpoints are shown graphically in figure 2 (resp. top green and blue lines/arrows).
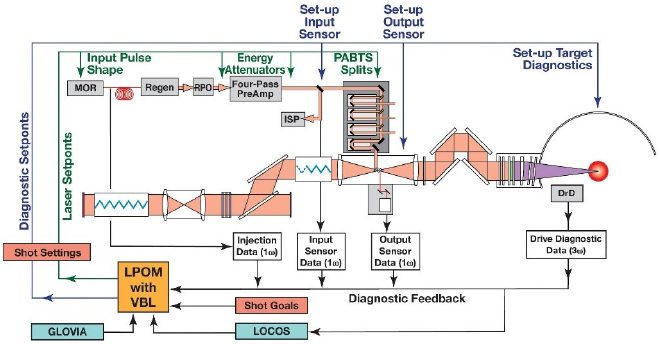
Figure 2. Interfaces of LPOM during a NIF experiment setup from [4]. Reproduced with permission from [3]. Copyright 2015 Society of Photo Optical Instrumentation Engineers (SPIE). One print or electronic copy may be made for personal use only. Systematic reproduction and distribution, duplication of any material in this publication for a fee or for commercial purposes, or modification of the contents of the publication are prohibited.
Download figure:
Standard image High-resolution imageOnce the experiment is performed and the laser diagnostic results are archived in the databases, LPOM performs several analyses to provide additional useful information to the target experimentalists and laser operations staff, including monitoring and trending of the actual laser performance and how well the laser models are rendering this performance for the various beamlines and sections of the laser.
1.3. Main metrics of the laser performance for NIF experiments
In the post-shot phase, LPOM generates web-based reports regarding the laser performance metrics. An example of such a report is provided below (figure 3). LPOM has multiple customers including the target experiment responsible individual, the laser performance experts and the operations crew. The high-level information summarizes the shot metrics in terms of delivered versus requested energy for all NIF beams (top left figure below), the different cones, quads and beams in a hierarchical manner. UV power delivered versus requested by quad or by cone (top right figure) is also available and is generally a critical observable for the experiment. Drilling down at the quad level in the IR section of the laser and more specific quad or beam-based performance is reviewed by the teams in charge of the laser models.
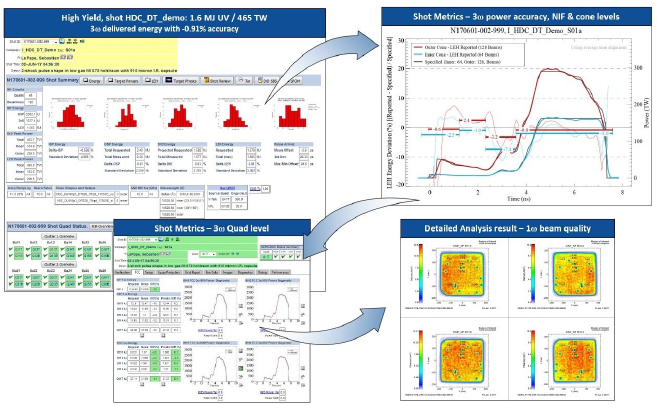
Figure 3. Example of LPOM post-shot analysis.
Download figure:
Standard image High-resolution imageTwo metrics are closely scrutinized. The first is the match between the total energy requested for the experiment and the energy recorded by the diagnostics on the shot. Thanks to precise models and regular calibrations, NIF can deliver the requested energy within 1% of average bias and a standard deviation of 2% as illustrated in figure 4. This plot includes data from 2011 to 08/2017 for shots with total energies above 200 kJ.
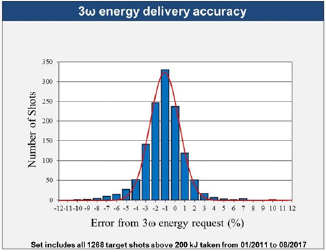
Figure 4. Histogram of NIF total UV energy delivered versus requested.
Download figure:
Standard image High-resolution imageThe second metric that is closely followed and critical for the success of an experiment is the power accuracy, or the ability of NIF to deliver, for various pre-defined time bins or intervals, an absolute average power (or energy in the time interval) as requested in the shot goals. By many aspects this performance is more challenging to obtain than power balance where the dispersion among beams and quads must be kept low but little emphasis is given to the absolute power delivery. The power accuracy exercise is more demanding for the models and their calibration. It is difficult to set a general specification regarding the energy and power accuracy as all experiments have potentially different goals, targets and sensitivity to laser performance deviation. However, the laser performance team goal is to maintain all intervals in the powers of the inner and outer cones within 10% absolute accuracy with a stretch goal of 5%. Figure 5 provides four examples of such reports for vastly different experiments pertaining to ignition experiments using 192 beams (top row), discovery science and generation of magnetic fields (bottom left) and study of equation of state (bottom right). Good power accuracy performance was obtained on all experiments despite the large range of energies (from 90 kJ to 1.8MJ), powers (from 8 TW to 460 TW), pulse durations (from 8 ns to 30 ns) as well as very different shapes and dynamic ranges.
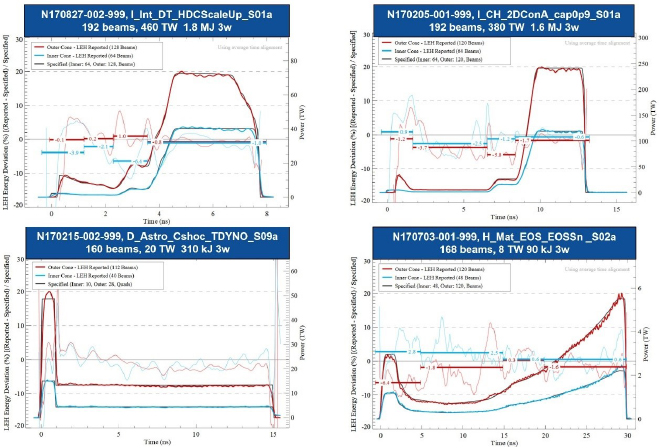
Figure 5. Example of four different target experiments with their 3ω power accuracy per cone.
Download figure:
Standard image High-resolution image1.4. Monitoring of the model-measurements deviations and model updates
To ensure high quality results are obtained at the target for each experiment, the fidelity (or quality) of the models in the IR and the UV is routinely trended and compared with the measurements coming out of our calibrated diagnostics. Such monitoring and attention to detail is necessary to obtain reproducible laser delivery at the target, within stringent ignition specifications described above. LPOM performs all these comparisons and checks as well as sends alarms to the Operations crew if the behavior of some hardware goes out of pre-defined bounds.
An example of such model comparison with measurements is shown in figure 6. It shows the comparison between the prediction for the amplification model in the IR and the measured performance, normalizing out the variations at the injection in the laser amplifier by propagating with the models the measured performance at the injection and comparing it with the measurement. Each filled-in circle represents the average model performance for the 64 inner beams when the squares represent a similar metric for the 128 outer beams. The threshold that triggers a model change (represented by the red dashed lines) is ±2%. The model updates are meant to compensate for the slow drifts of the various laser transfer functions.
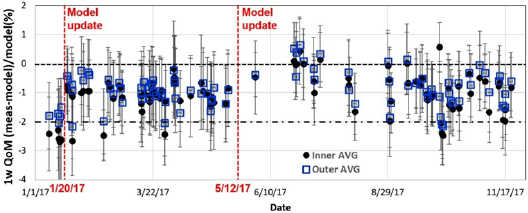
Figure 6. Monitoring of the quality of the 1ω model over time and the associated model updates.
Download figure:
Standard image High-resolution image2. Performance quad results at elevated energy
2.1. Introduction
The 2017 NIF Performance Quad Campaign exercised a single quad of NIF (Q45T) at elevated energy to assess the impact of recent improvements to the infrared (1ω) and ultraviolet (3ω) sections of the laser on integrated performance. The improvements deployed on the performance quad included: (1) active beam shaping and near field beam flattening (see section 2.2), (2) reduction of passive losses by replacing polarization rotators potassium dihydrogen phosphate (KDP) crystals with deuterated ones and uncoated grating debris shields for beam sampling with anti-reflection coated ones (3) increased damage resistance with Advanced Mitigation Process version 3 [6–8] and finally the use of a fused silica debris screen (FSDS) [9]. The campaign employed ignition-relevant hydro-scaled versions of 'high-foot' pulses [10, 11] with energy up to 13.5 kJ/2.5 TW at 3ω per beamline, equivalent to 2.6 MJ/480 TW for full-NIF operations, see yellow diamonds in figure 7. The main objectives were (1) an updated assessment of laser performance limits with validation of laser simulation codes, and (2) extension of 3ω optics lifetime models to higher fluence to estimate the cost of operating NIF at increased energy. This section focuses on the laser performance results of the campaign.
The campaign comprised a total of 25 full-system shots: 8 to ramp up and prepare the 1ω Main Laser, followed by 17 shots to Target Chamber Center (TCC), including 5 shots to condition the transport mirrors and final optics up to elevated energy, then 6 shots at elevated energy interleaved with 6 low-energy optics 'cleaning shots'.
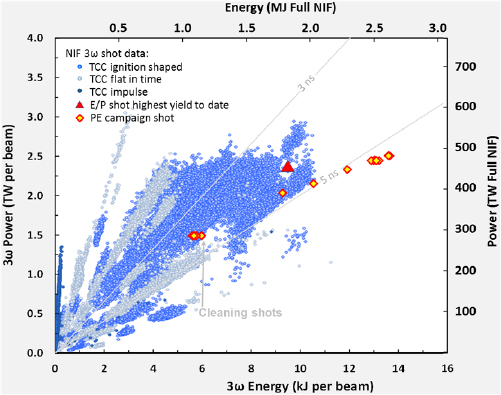
Figure 7. NIF energy-power diagram. Past shots are in blue see [2] when Performance Quad shots are the yellow diamonds. [2] © the American Nuclear Society, http://www.ans.org/, reprinted by permission of Taylor & Francis Ltd, http://www.tandfonline.com on behalf of the American Nuclear Society.
Download figure:
Standard image High-resolution imageIgnition-quality pulses were delivered to TCC up to a 3ω quad energy and power of 54.6 kJ, 9.9 TW. The 1ω and 3ω laser measurements at the outputs of the Main Laser and Final Optics Assembly respectively were both consistent with the modeled expectations for energy, power, and near field beam quality to within a few percent. On the highest energy/power shots, a small amount of filamentary damage from B-integral-induced self-focusing was observed on three of the four beams in the quad. The damage occurred in a thin (~3 mm wide) strip on the thick side of the Wedged Focus Lenses (WFLs) and is strongly correlated with an intensification at the edge of the beam profile exhibited in the 3ω near-field fluence data. Virtual beam line (VBL) simulations have been able to reproduce to some extent the observed edge intensification but as yet do not predict that filamentation should have occurred. Resolving this discrepancy is a topic for future work, along with identifying ways to increase power limits and margin against filamentation. For example, simulations suggest that it is possible to mitigate the intensification of the beam edge by installing a softer-edge serrated apodizer in the front end.
2.2. 1ω Performance
The 1ω Main Laser performed according to expectations. All experiments were performed at 1052.85 nm for consistency purposes. Beam near-field fluence homogeneity (also called beam contrast and defined as the standard deviation of the fluence divided by the average) was maintain below 7% for all beams and all experiments; the delivered performance was consistent with the setup goals up to 22.5 kJ per beam, the maximum tested. Moreover, the agreement between delivered energy and specified energy was better than 2%. The agreement between delivered and requested power was in the range of that required for ignition experiments (figure 8).
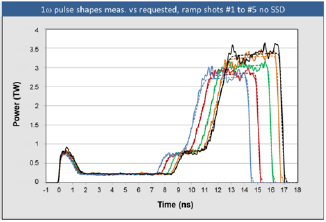
Figure 8. 1ω pulse shapes from B454 measured at the output of the Main Laser (solid lines), compared to request (dashed lines). Colors correspond to Full-NIF-Equivalent 3ω energies of 2.0 MJ (blue), 2.2 MJ, 2.4 MJ, 2.5 MJ, and 2.6 MJ (black). Traces are single beam line and unsmooth, explaining small amount of visible noise.
Download figure:
Standard image High-resolution imageAn example comparison of modeled to measured 1ω performance is shown in figure 9, demonstrating the high degree to which the models have been validated. The laser amplification saturation fluence in the beam 454 model was slightly adjusted to better match the measured temporal pulse profiles. After this adjustment, the overall agreement with the measurements at elevated energy was better than 1.3% for the energy, and better than 5% for the time-resolved power with 1 ns boxcar smoothing (for the two beams that were equipped with full-aperture 1ω power sensors: B451 and B454). Additionally, prior to the campaign an improved method was implemented in LPOM for computing the 2D-resolved small signal gain, better accounting for beam multiplexing and vignetting in the Main Amplifiers. The new method resulted in better qualitative and quantitative agreement with the measured near field fluence profiles, especially for the low-frequency components of the profiles.
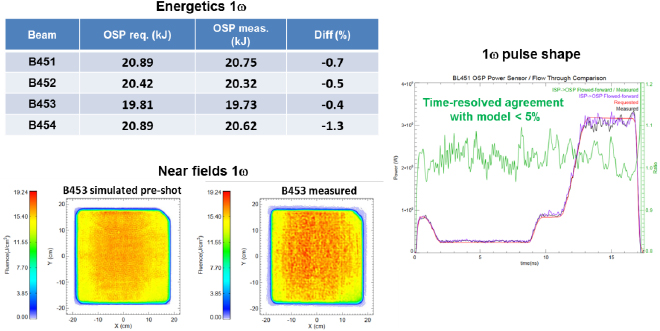
Figure 9. Overall agreement between measurements and the models at high-energy.
Download figure:
Standard image High-resolution imageAchieving and maintaining good spatial beam quality was an important part of this campaign. Each preamplifier module in the NIF front-end is equipped with a programmable spatial shaper (PSS) system containing an optically-addressed liquid-crystal light-valve [12]. The PSS is used to sculpt the spatial fluence profile injected into the four beams in each quad to serve two specific functions. One is to flatten the output beam profile by pre-compensating for the laser gain spatial nonuniformity in the flash-lamp-pumped main amplifiers (referred to as PSS beam flattening). The optimum transmission map for the PSS is derived from the near-field fluence profiles measured at the output of the Main Laser on low-energy (unsaturated) shots. When this optimum transmission map is applied, the output beam quality (fluence contrast) is improved by ~2× at low energy (figure 10, top row).
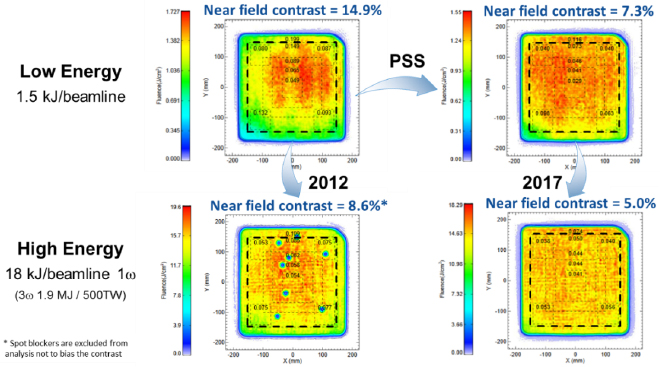
Figure 10. Examples of near-field beam quality measured on beam B454 with (right) and without (left) PSS beam flattening. Top and bottom rows show low and high energy operation, respectively.
Download figure:
Standard image High-resolution imageThe same optimum transmission map also improves beam quality at high energy. Figure 10 (bottom row) compares the B454 near-field fluence profile measured during the 1ω energy ramp portion of the campaign (shot N161115-001-999) with the measured fluence profile from the same beam on shot N120705-002-999 [13], taken at similar energy and power but without PSS beam flattening. In this case the fluence contrast was reduced from 8.6% to 5%. More generally, the contrast at the output of the main laser was improved from 8%–9% to 5%–6% on average for the quad and maintained at this level for the duration of the campaign (figure 11).
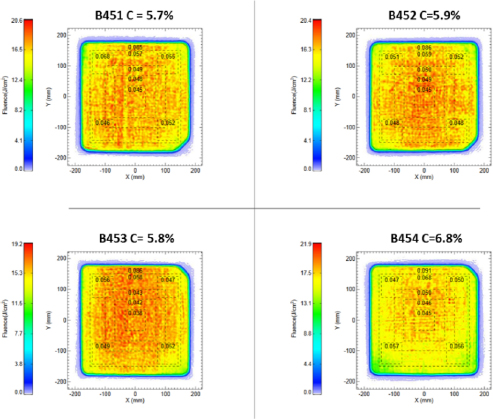
Figure 11. Measured 1ω near-field fluence profiles at the output of the Main Laser for the four beams of Q45T on shot N170309-001-999 (2.6 MJ 3ω at TCC Full NIF Equivalent).
Download figure:
Standard image High-resolution imageThe effect of the reduced fluence contrast is to significantly reduce the high-fluence tail of the near-field fluence distribution, even at large saturation. For example, the fraction of energy above 17 J cm−2 (for an experiment performed at 18 kJ) was reduced by ~100× when the PSS beam flattening was applied (figure 12). This level of improvement and its impact on 3ω optics operating cost were the major drivers behind the implementation of PSS beam flattening in late 2015 for all NIF beamlines and were included in the models and simulations during the planning for this campaign.
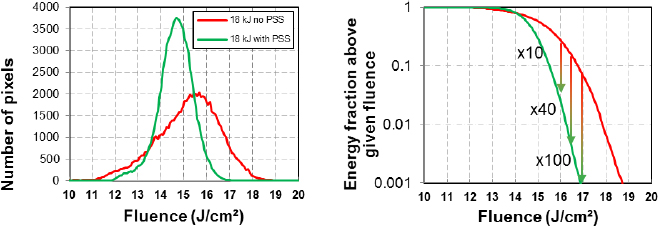
Figure 12. Measured 1ω near-field fluence histograms at the output of the Main Laser with PSS beam flattening (green) and without PSS beam flattening (red).
Download figure:
Standard image High-resolution imageA second important function of the PSS is to create shadows ('spot blockers') at specific locations in the beam to mask defects or damage spots in the final optics. The spot blocker is designed to have the minimum diameter and edge width that produces acceptable modulation at out-of-relay-plane components when the effects of diffraction, spatial filtering and B-integral are properly accounted for [14]. The diameter and edge width of the spot blockers had been optimized to 2.2 cm FWHM and 2.2 cm respectively for NIF energies up to 1.9 MJ. The increased level of amplifier saturation and total system B-integral associated with higher energy operation changes this optimum, requiring larger spot blockers to maintain the same machine safety margins. VBL simulations determined that a diameter of 2.6 cm for the spot blockers is the new optimum.
The new spot blocker specifications were verified by performing shots to the output of the Main Laser corresponding to 1.8 and 2.6 MJ 3ω TCC Full NIF Equivalent, with the output sensor package (OSP) near-field camera imaged at SF4 lens [4]—the optical component furthest out of relay. The comparison of the images and the spot blocker profiles (figure 13) demonstrate machine safety margins similar to the 1.8 MJ nominal case when 2.6 cm spot blockers are operated at 2.6 MJ.
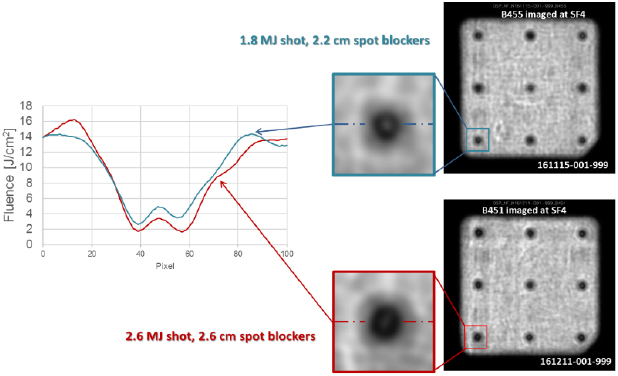
Figure 13. Spot blocker profiles measured at the equivalent plane of SF4 for 1.8 MJ 3ω TCC Full NIF Equivalent shot with 2.2 cm spot blockers (top, blue) and 2.6 MJ 3ω TCC Full NIF Equivalent shot with 2.6 cm spot blockers (bottom, red). Lineouts (left) through the spot blocker profiles shows similar shape and modulation level.
Download figure:
Standard image High-resolution image2.3. 3ω Performance
The 3ω laser performance met all expectations for energy and power. As shown in figure 14, all shots at elevated energy were delivered within 2% of the request. To save time, the rules of engagement for front end energy tolerance were relaxed for the 1.1 MJ cleaning shots, resulting in a larger variability between the requested and delivered energy on these shots.

Figure 14. Energy delivery accuracy for high energy shots (dark symbols) and low energy cleaning shots (light symbols). Labeled energies are 3ω TCC Full NIF Equivalent.
Download figure:
Standard image High-resolution imageThe final shot in the 3ω energy ramp sequence (#5) culminated with a total 3ω quad energy of 54.61 kJ delivered to TCC, within 1.4% of the requested energy. The power at 3ω was also delivered within the accuracy currently supported for ignition experiments. Two of the beams in the performance quad were equipped with 3ω power sensors for this campaign. The time-resolved quality of the 3ω model (the comparison between the 3ω power measured on these two beams and the 3ω power inferred from the 1ω power measured at the output of the Main Laser and flowed-forward by model) are within 5% for most of the time epochs during the pulse (right hand plots, figure 15).
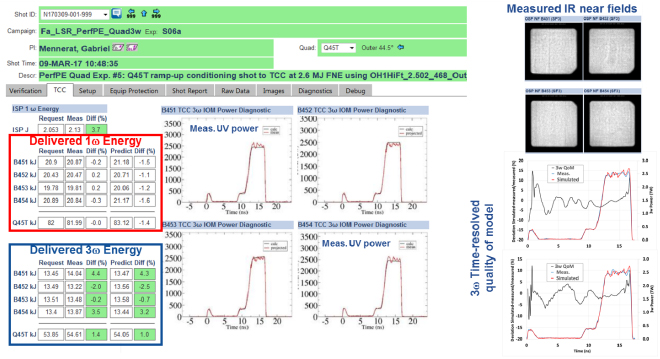
Figure 15. LPOM (laser performance and operations model) summary shot report data for N170309-001 (2.6 MJ 3ω TCC Full NIF Equivalent).
Download figure:
Standard image High-resolution imageThe laser diagnostics on the target chamber have a limited ability to diagnose the 3ω near-field fluence profiles at the output of the Final Optics Assembly, when appropriately configured. For this campaign, 3ω near-field data was acquired on two of the four beams in the quad. Data quality was such that it precluded accurately quantifying certain important fluence metrics like contrast, but it was sufficient to provide good quantitative information about other important metrics such as flatness and edge modulation (figure 16(a)).
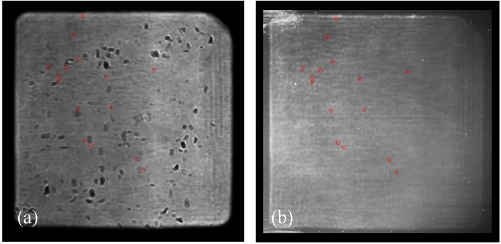
Figure 16. (a) B454 3ω near-field fluence profile measured on N170309-001-999 (2.6 MJ 3ω TCC Full NIF Equivalent). Dark obscurations are due to small localized defects in the diagnostic path. (b) Post-shot photograph of side-illuminated ADDS showing fluence-dependent damage pattern.
Download figure:
Standard image High-resolution imageAdditional and supporting near-field fluence data was provided by the Automated disposable debris shield (ADDS), the last optic in the Final Optics Assembly. Figure 16(b) shows a post-shot digital camera picture of a side-illuminated ADDS after a single high energy shot. The gray-level in the ADDS picture is approximately proportional to the quantity of light scattered from the ADDS, which is approximately proportional to the damage density in the ADDS, which is in turn proportional to the 3ω fluence profile on the shot. Close inspection of both images reveals an identical pattern of small dark spots, identified by the red circles in figure 16. The spots correspond to shadows in the high-fluence beam profile produced by damage mitigation cones machined into the up-stream wedged focus lens, confirming that (1) beam shadows and obscurations are readily recorded by the ADDS and thus (2) most of the dark obscurations in the diagnostic image are in the diagnostic path, not the high-fluence beam. The ADDS picture also confirms the high levels of fluence modulation at the top and left edges of the beam observed in the diagnostic data. As oriented figure 16, the top of the images corresponds to the thick side of the wedged focus lens where filamentation was observed.
The fluence modulation along the top edge of the beam in figure 17 is well-correlated with the location and quantity (~780) of filaments in the lens (S/N 271301) determined from off-line metrology. Figure 17 shows a sub-region of the fluence profile in figure 10(a) containing the edge modulation (top left), the same sub-region showing only the beam where the fluence is above 15 J cm−2 (middle left), and the density of the filaments measured in the lens (bottom left). Lineouts through the fluence regions above 15 J cm−2 and the high-density regions of the filament map show a fair degree of correlation.
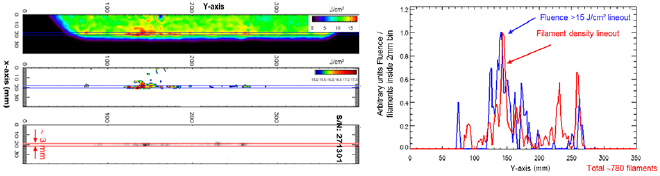
Figure 17. Close-up views of the 3ω measured fluence and filament density count (left). Fluence and filament density lineouts (right).
Download figure:
Standard image High-resolution imageThe level of fluence modulation from beam edge intensification observed in this campaign was not predicted by our models. To close this gap, the standard VBL model used in LPOM needed to be augmented to better model the beam apodization that occurs in the front-end. Specifically, the spatial resolution used for the calculations was increased to 20482 with 15 samples in time. The serrated apodizer is located after the regenerative amplifier and before the pre-amplifier, and in its current incarnation defines a 10%–90% edge transition width of 2.2 cm in the Main Laser at low sigma B.
As shown in figure 18, the augmented VBL model was able to produce some edge intensification without the need to change any of the baseline values for the nonlinear coefficients (γ) of the materials. The contribution of B to the edge intensification was confirmed by turning off the nonlinear coefficients in the model and verifying that the edge intensification was eliminated. It is suspected that the initial limited sampling of our simulation was not sufficient to resolve this edge effect. This discrepancy is currently being investigated, and additional measurements will be taken to determine if some physical effects are missing from our model, or if other reasons like for example very low-level beam clipping can explain such behavior at the edge of the beam.
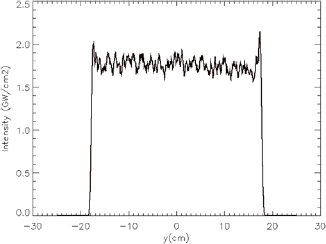
Figure 18. Average lineout of a 3ω intensity profile simulated VBL at the input of the lens with currently installed, 2.2 cm roll-off, beam apodizer mask. The right side of the intensity is mapped onto the thickest side the WFL.
Download figure:
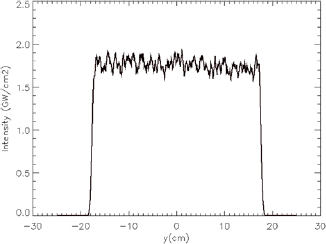
Standard image High-resolution imageNIF operation at elevated energy and high sigma B is likely to require, as in the case of the spot blocker, softer beam edge apodization. Numerical simulations with VBL show that increasing the edge transition of the apodizer from 2.2 cm (current design) to 3.4 cm should mitigate the observed edge intensification (figure 19). Experiments are being planned to test this mitigation. Additional work is also being planned to confirm the values of the non-linear coefficients in the codes - particularly the off-diagonal terms used in the final optics- through focused, off-line experiments.
Figure 19. Average lineout of a 3ω intensity profile simulated VBL at the input of the lens with a softer, 3.4 cm roll-off, beam apodizer mask.
Download figure:
Standard image High-resolution image
In conclusion, NIF teams have developed tools and processes using dedicated calibration shots as well as analysis of all target experiments to ensure the health of the NIF laser models in the IR and the UV such that accurate and consistent performance can be delivered for the most stringent missions. In addition, very promising results have been obtained at elevated energy, during the performance quad experiment. The laser performance delivered (energy, power and fluence distributions) was demonstrated to be excellent agreement with our models. These results, with minor optimization to be performed at the beam edges, demonstrated that NIF can be operated for high accuracy experiments beyond its current operating limits.
Acknowledgments
The work summarized here represents the combined effort of many individuals. We acknowledge the members of the NIF Operations team, as well as the NIF Power and Energy Integrated Product Team for their central role in the planning, execution, simulation, analysis, and documentation of the performance quad campaign.
This work was performed under the auspices of the U.S. Department of Energy by Lawrence Livermore National Laboratory under Contract DE-AC52-07NA27344. Lawrence Livermore National Security, LLC.