

Abstract
Sedentary behaviour (SB) is associated with a number of adverse health outcomes. Studies that have used ActiGraph monitors to define sedentary time tend to use a threshold of <100 counts per minute (cpm) for classifying SB; however, this cut-point was not empirically derived for adults. It is not known whether ActiGraph cut-points for SB differ depending on the context in which it occurs. We aimed to: (1) empirically derive an optimal threshold for classifying SB, using the cpm output from the ActiGraph GT3X+, compared to the sedentary classification from the activPAL3™; and (2) ascertain whether this varied by day of the week and in working time versus non-working time.
A convenience sample of 30 office-based university employees (females (66.67%); age 40.47 ± 10.95 years; BMI 23.93 ± 2.46 kg m−2) wore the ActiGraph GT3X+ and activPAL3™ devices simultaneously for seven days. Data were downloaded in 1 min epochs and non-wear time was removed. Generalised estimating equations were used to make minute by minute comparisons of sedentary time from the two devices, using sedentary minutes (when all 60 s were classified as sitting/lying) from the activPAL3™ as the criterion measure.
After data reduction participants provided on average 11 h 27 min of data per day. The derived cut-points from the models were significantly higher on a Saturday (97 cpm) compared to weekdays (60 cpm) and Sunday (57 cpm). Derived cpm for sedentary time during working time were significantly lower compared to non-working time (35 (95%CI 30–41) versus 73 (54–113)). Compared to the 100 cpm and 150 cpm thresholds, the empirically derived cut-points were not significantly different in terms of area-under-the-curve, but had lower mean bias for working and non-working times.
Accelerometer cut-points for SB can depend on day and also domain, suggesting that the nature of sitting differs depending on the context in which sedentary time is accrued.
Export citation and abstract BibTeX RIS
Introduction
Sedentary behaviour (defined as any waking behaviour in a sitting or reclining position, with energy expenditure ⩽1.5 METs (Sedentary Behaviour Research Network (SBRN) 2012)) is associated with a number of health outcomes (Owen et al 2010), including: metabolic syndrome risk factors (Hamilton et al 2007, Stamatakis et al 2012); obesity (Hu et al 2003); type 2 diabetes (Hu et al 2003); back pain (Chen et al 2009); and mortality (in particular from cardiovascular disease and cancer) (Katzmarzyk et al 2009, van der Ploeg et al 2012). Many of these correlates of sedentary behaviour and health-related outcomes have been shown to be independent of moderate to vigorous physical activity levels (Owen et al 2010). The extent to which this apparent effect of sedentary behaviour is an artefact of the way physical activity is incorporated into the analysis models is unclear, since a recent study that adjusted for total physical activity (including light physical activity) showed that sedentary behaviour was not an independent risk factor for cardio-metabolic biomarkers (Maher et al 2014). A compositional analysis by Chastin et al (2015) showed that the distribution of time spent in sedentary behaviour, co-dependent with time spent sleeping, and in light- and moderate to vigorous physical activity, was associated with some, but not all cardio-metabolic biomarkers. There is a need to further improve how we measure sedentary behaviour and light physical activity.
Many studies that have found associations between sedentary behaviours and health-related outcomes have primarily measured self-reported sedentary time based on leisure time (i.e. television time) (Thorp et al 2010), or self-reported total sedentary time (Proper et al 2007). Subjective measures of sedentary behaviour are limited by: underestimates of sedentary time (Rosenberg et al 2010, Clemes et al 2012); recall limitations in questionnaires; and tend to have 'low-to-moderate' validity compared to objective measures (Atkin et al 2012). Objective measures of sedentary behaviour, such as those obtained from the use of accelerometer-based devices, including the ActiGraph and activPAL™ monitors (Matthews et al 2008, Dunstan et al 2012, Healy et al 2016), are able to examine duration, frequency and intensity of activities, including how much time is spent at a predetermined level of activity using different thresholds.
Matthews et al (2008) were the first to describe time spent in sedentary behaviours using an objective measure of sedentary time, for participants in the National Health and Nutrition Examination Survey (NHANES). The accelerometer-based device used in their study was the ActiGraph 7164; the magnitude of the acceleration measured by an ActiGraph device within a specified epoch is converted to a count using a proprietary algorithm, as an approximation for energy expenditure. Sedentary behaviour was defined as less than100 counts per minute (cpm). This cut-point had been based on a study that defined sedentary behaviour thresholds in a sample of adolescent girls (age 13–14 years old) (Treuth et al 2004a). The aim of the study by Treuth et al (2004a) was to define a regression equation to estimate energy expenditure (metabolic equivalent) from ActiGraph counts using the ActiGraph 7164 device, and to define thresholds of these counts for different activity levels (including sedentary behaviour). Although the 100 cpm cut-point has been widely used in adult sedentary behaviour studies it should be noted that: (i) it was derived from an adolescent female population; it is known that activity behaviour differs between children and adults, with children tending to carry out activity in short and sporadic bursts compared to adults (Welk et al 2000), and total sitting time is known to increase as we get older (Matthews et al 2008); (ii) it was derived from two screen based leisure activities (TV viewing and playing computer games), that are not representative of sedentary time in adults; (iii) the counts from the study by Treuth et al (2004a) were recorded in 30 s epochs; the relationship between epoch length and cut-point is not linear, and it has been suggested that doubling count thresholds from 30 s to 60 s epochs, would lead to 'considerable error in total estimates' (Aguilar-Farías et al 2013, p 297).
There is limited evidence in adults on the validity of the 100 cpm cut-point used to define sedentary time, especially in newer models of the ActiGraph accelerometer. In a study of 20 overweight office workers (mean body mass index (BMI) 33.7 kg m−2), Kozey-Keadle et al (2011) suggested that 150 cpm may be a more appropriate cut-point to define sedentary behaviour, when compared to direct observation. This is comparable to an ActiGraph calibration study, by Lopes et al (2009) that also found a higher threshold (200 cpm) for sedentary behaviour in obese and overweight patients (mean BMI 31.0 kg m−2) (Lopes et al 2009). Crouter et al (2006) proposed an arbitrary cut-point of 50 cpm to distinguish sedentary behaviour from light physical activity; in a cohort of working age adults (mean BMI 24.2 kg m−2). In contrast, a study of older adults (mean age 73.5 years), found that a much lower threshold (<25 cpm, based on the activPAL3™ sedentary behaviour classification) may be more appropriate to define sedentary behaviour in an older age group (Aguilar-Farías et al 2013). These studies suggest that it may be appropriate to have different cut-points dependent on BMI and age (Owen et al 2010).
It has been suggested that sedentary time in the work and leisure domains may represent differing associations with health outcomes (Pinto Pereira et al 2012). Given that there is so much variation between the ActiGraph cut points derived for different populations, it is reasonable to assume that different contexts may also lead to different thresholds. There has been no empirically derived ActiGraph cut-points for sedentary behaviour in adults, and therefore the primary aim of this study was to empirically derive an optimal threshold for correctly classifying sedentary behaviour, using the cpm output from the ActiGraph GT3X+ accelerometer, when compared to the sedentary classification from the activPAL™ accelerometer in a free-living environment. The activPAL™ device, which is used to classify posture, has been shown to be a valid measure when distinguishing between sitting/lying, standing and locomotion in everyday activities (Grant et al 2006, Kozey-Keadle et al 2011). It is important to be able to accurately measure sedentary behaviour on different days (i.e. work and non-work) (Proper et al 2007), and also in different domains (i.e. working and non-working hours) (Thorp et al 2012, Clemes et al 2014) in order that we can fully understand the consequences of how sedentary time is accrued and its correlates with health-related outcomes; and consequently, a secondary aim was to ascertain whether thresholds for sedentary behaviour cut-points varied by day of the week and in working time versus non-working time.
Methods
A convenience sample of 30 employees/post graduate students (healthy volunteers that spend most of their 'working day' sitting) from the University of Salford were asked to participate in the study. Volunteers self-reported that their work role was 100% office based work, mostly on a computer. Prior to the study commencement, ethics approval was granted by the College of Health and Social Care Ethical Approval Panel at the University of Salford, and participants provided written informed consent.
Accelerometers
The ActiGraph GT3X+ accelerometer is a small (4.6 × 3.3 × 1.5 cm), light-weight (19 g) instrument that records acceleration in the vertical, antero-posterior and medio-lateral axes, worn at the waist (ActiGraph LLC, Pensacola, Florida). To ensure the outcomes of this study were analogous with other generations of ActiGraph devices, only the accelerations on the vertical axis were analysed (Matthews et al 2008, Stamatakis et al 2012, Thorp et al 2012). These accelerations are integrated, using a proprietary algorithm, as an activity count over a specified epoch; for this study, these are referred to as cpm.
The activPAL3™ is a small, light-weight (15 g) accelerometer-based device that is attached to the anterior aspect of the thigh (PAL Technologies Ltd, Glasgow, Scotland). Data from this instrument classifies activities into sedentary (sitting/lying), standing and stride events, using proprietary algorithms (Chastin and Granat 2010, Edwardson et al 2016). Consecutive stride events are combined to give walking events. The output from the activPAL™ has been validated for classification of sedentary, upright, standing and walking activities in a range of populations including older adults (Grant et al 2006, 2008), and is an accurate device for measuring sedentary behaviour in a free-living environment (Kozey-Keadle et al 2011, Baumgartner et al 2015).
Procedure
Participants were asked to wear the ActiGraph GT3X+ and the activPAL3™ devices, simultaneously for seven days. The ActiGraph GT3X+ was worn during all waking hours and removed overnight; the activPAL3™ was worn continuously for 24 h a day and was only removed for bathing or swimming. The ActiGraph GT3X+ was worn on the right hip (on the midaxillary line), attached with an adjustable belt; the activPAL3™ was attached to the front (middle-anterior line) of the right thigh (with hypoallergenic double-sided adhesive pad). Participants were asked to fill in a detailed activity diary with designated fields to record their sleeping hours; they were also asked to record their working hours, and if either accelerometer was removed, the time it was removed and the reason it was removed. Height and weight were self-reported, and used to calculate body mass index (BMI = kg m−2).
Data cleaning and data reduction
The data from both devices were downloaded using the manufacturer's software, and imported into Stata, where all data cleaning, reduction and analysis was carried out (StataCorp. 2013. Stata Statistical Software: Release 13. College Station, Texas: StataCorp LP). The data from the ActiGraph GT3X+ device (collected at 30 Hz) were downloaded using the ActiLife v5.10.0 software by ActiGraph, using the low-frequency extension for 60 s epochs (Cain et al 2013); the cpm from the vertical axis were transferred to Stata along with the date and time variables. The data from the activPAL3™ device (collected at 20 Hz) were downloaded using the activPAL(tm) v7.2.29 software by PAL Technologies Ltd; the time, interval and activity variables were transferred from the events file to Stata (Edwardson et al 2016). To ensure that data related to only genuine wear time a number of decision rules were implemented. An automated program was written in Stata to match the 60 s epoch data from both devices and to derive non-wear time for all participants; the rules for deleting non-wear time were implemented in the following order: (i) using the diary and by manually looking at the matched data, the first 5 min after both devices were attached were deleted, and conversely the 5 min prior to at least one device being removed were also deleted (reasons accelerometers were removed included sleeping, bathing and swimming); (ii) for any recorded periods of cycling or attending the gym, the period was removed together with the 10 min before and the 10 min after, using the self-reported period from the activity diary. Due to the lack of movement of the body's core when cycling, using gym equipment (e.g. rowing machine) and resistance training, accelerometers may not accurately measure these activities (Welk et al 2000); the energy expenditure from these activities would be ⩾1.5 METs, and would therefore not fit the SBRN definition of sedentary behaviour (SBRN 2012); (iii) the Troiano automated algorithm was used to remove further non-wear time; this was defined as bouts of ⩾60 min of consecutive zero counts from the ActiGraph GT3X+ , allowing interruptions of up to two counts of non-zero counts (less than or equal to 100 cpm) (Troiano et al 2008); (iv) it was imperative that both accelerometers were worn at the same time for this analysis, and therefore activPAL3™ non-wear time was also considered: sedentary bouts longer than 120 min from the activPAL3™ were also assumed to be non-wear time; (v) lastly, spurious data of over 15 000 cpm from the ActiGraph GT3X+ were deleted (Esliger et al 2005).
Statistical analyses
Statistical methods used in calibration studies to derive cut-points from accelerometers (mainly the ActiGraph) have tended to generate regression equations for different activity intensities, based on statistical models between energy expenditure and accelerometer counts. Indirect calorimetry units that are used to measure energy expenditure can be a burden to the user, and are only generally used for a few hours in a free-living environment where sedentary behaviour most naturally occurs (Crouter et al 2013). To derive an appropriate cut-point for sedentary behaviour, the change in counts over time from the ActiGraph GT3X+ must first be accounted for. The counts from each successive minute are likely to be autocorrelated with the previous minute and also with the following minute; for example, a person sitting during a given minute is more likely to be sitting during the next minute (Tryon 2011). The statistical models of choice for this study, generalised estimating equations (GEEs), were used to make minute by minute comparisons of cpm from the ActiGraph GT3X+ and the sedentary classification of the activPAL3™. A sedentary minute from the activPAL3™ was defined when all 60 s were classified as sitting or lying; however, since the participants wore both devices during waking hours only, the sedentary behaviour recorded was more likely time spent sitting than lying.
GEEs take into account the within-subject correlation between measurements, whilst also making use of all available data (Liang and Zeger 1986). An advantage of GEE analysis over standard regression techniques is that they are designed specifically for analysis of repeated measures. Individual GEE models were generated for each day of the week, working days, weekend days, all seven days of the week, worktimes and non-worktimes. For each GEE model, the mean of the predicted distribution was calculated from the reciprocal of μ (based on the gamma distribution and the reciprocal link function); the upper-threshold of the predicted distribution was used as the proposed cut-point. The GEE models were limited to the waking hours of between 08:00 and 22:00; working hours were limited between 09:00 and 16:30; and non-working hours were limited between 18:00 and 22:00. GEE models produce asymptotically normal, unbiased standard errors when missing data is missing completely at random (Zeger and Liang 1986); standardising waking and working hours assured that there were sufficient replicates for model convergence.
The accuracy of the standard errors of the derived cut-points from the GEE models was maximized using bootstrapping techniques, by resampling the observations 1000 times for each regression model (Efron 1979); all models were adjusted for age and sex. The classification accuracy of the derived cut-points was compared to that of the previously proposed cut-points for sedentary behaviour (50, 100 and 150 cpm; Matthews et al 2008, Kozey-Keadle et al 2011, Crouter et al 2013), by calculating the sensitivity, specificity, and area under the receiver operating characteristic curve (ROC–AUC). ROC–AUC analysis calculates the area under the curve when sensitivity (probability a minute is defined as sedentary from the ActiGraph GT3X+ derived cut-point, given that the minute is defined as sedentary from the activPAL3™) is plotted against, 1-specificity (probability a minute is defined as non-sedentary from the ActiGraph GT3X+ derived cut-point, given that the minute is defined as non-sedentary from the activPAL3™). To maximize the validity of the outcome, the outcome that gives the bigger area under the curve is seen as the optimum when comparing cut-points. The amount of sedentary time is presented as percentage of sedentary time across each day. Mean bias percentages ((ActiGraph sedentary minutes/activPAL3™ sedentary minutes) − 1 × 100), average difference in sedentary time and limits of agreement (LoA) for sedentary time calculated from the derived cut-points, were compared to sedentary time from the activPAL3™ using the Bland–Altman method.
Results
The average age of men in the study was 44.8 ± 11.1 years, and women were 38.3 ± 10.2 years (there was no statistically significant difference in age, p = 0.1574); the range of ages across the sample was 24–62 years old. The mean BMI of participants was 23.93 (±2.46, range: 19.2–28.0 kg m−2).
Accelerometers were reported not to be worn, or worn incorrectly, on only eight of the 210 d of data collection; reasons included going away for the weekend, not being in work on first day of data collection and incorrect placement of the activPAL3™. After data reduction, participants provided on average 11 h 27 min of data per day (SD = 2 h 34 min) equating to 82% of the waking day between 08:00 and 22:00.
Of the data that were removed, the majority of minutes were as a result of information in the activity diaries (main reasons were cycling, showering/bathing and swimming); after these data were removed, only two participants had further data removed after identifying periods of 60 min or greater of zero counts (allowing for up to 2 min of non-zero counts). In total 137 515 trimmed minutes of matched data were available from both the activPAL3™ and the ActiGraph GT3X+ monitors. The majority of these minutes (82 020; 59.64%) were classified as sedentary only from the activPAL3™ (equal to all 60 s of the minute being sedentary); 30.82% (42 380) were upright only minutes and the remainder 9.54% (13 115) were mixed minutes, containing both sedentary and upright activity.
The derived cut-points for all days of the week were less than 100 cpm, with the exception of Saturday; cut-points for Monday to Friday ranged from 41 to 60 cpm and were similar to Sunday (57) (figure 1); the cut-point for Saturday was significantly higher compared to other days, 97 cpm. The overall derived cut-point for the week was 65 cpm; the derived sedentary behaviour threshold for working days (Monday to Friday, equivalent to participants' standard working days) was lower than that derived for weekend days (60 versus 74 cpm respectively); however, this was not significant. Cut-points for working hours and non-working hours were significantly different (35 versus 73 cpm respectively).

Figure 1. ActiGraph GT3X+ accelerometer derived cut-points (95% CI) for sedentary behaviour from GEE regression models.
Download figure:
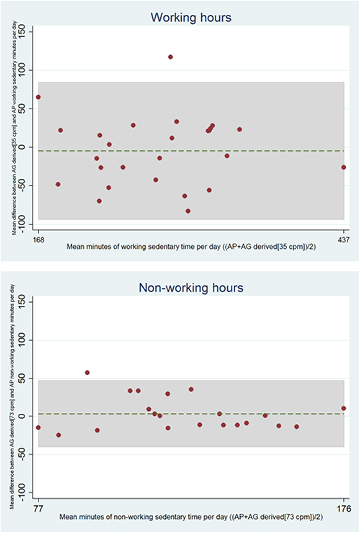
Standard image High-resolution imageThere were no significant differences between the derived cut-points and the previously proposed cut-points (100 cpm and 150 cpm) in terms of ROC–AUC analysis, for days of the week or working and non-working times (table 1). As expected, the higher thresholds of 100 and 150 cpm resulted in higher sensitivity values. The lowest mean bias and smallest average differences in sedentary time occurred for the derived cut-points for the majority of the models, when compared to sedentary time from the activPAL3™. The derived cut-points, the 100 and the 150 cut-points all overestimated sedentary time (with the exception of Wednesday and Friday); this is most likely due to misclassification of non-sedentary activities that result in low cpm, such as standing still (Crouter et al 2006). The 50 cut-point gave a smaller mean bias and average difference across the whole week, compared to the derived cut-point of 65 cpm. The percentage of sedentary time (from the activPAL3™) was higher on working days compared to weekend days (61.22 % versus 53.79 % respectively), and also during working hours compared to non-working hours (65.85% versus 58.62% respectively). Figure 2 shows the Bland–Altman plots for the mean differences (defined as ActiGraph sedentary time minus activPAL3™ sedentary time) and limits of agreement for sedentary time determined from the activPAL3™ and the derived ActiGraph GT3X+ cut points, for both working and non-working hours. The limits of agreement were narrower for non-working sedentary time compared to working hours; this may be due to the there being less non-working hours compared to working hours each day. However, the mean bias percentage was smaller for working hours when compared to non-working hours (<0.01% versus 6.04%: table 1).
Table 1. Accuracy of the derived cut-points compared to cut-points of 50 cpm, 100 cpm and 150 cpm.
| Sedentary time (measured by the activPAL3™ (%) | Sensitivity (%) | Specificity (%) | AUC | Mean bias % (95% CI) | Average difference (mins) | 95% LoA (mins) | |
|---|---|---|---|---|---|---|---|
| Monday | 54.44 | ||||||
| Derived (54 cpm) | 84.56 | 74.22 | 0.79 | 9.27 (−2.56, 21.09) | 23.55 | (−149.53, 196.63) | |
| 50 cpm |
83.95 | 74.56 | 0.79 | 8.20 (−3.58, 20.00) | 19.75 | (−154.07, 193.57) | |
| 100 cpm |
90.11 | 68.98 | 0.80 | 19.96 (7.10, 32.81) | 64.45 | (−111.10, 242.00) | |
| 150 cpm |
93.37 | 64.41 | 0.79 | 28.18 (14.14, 42.22) | 95.25 | (−82.84, 273.34) | |
| Tuesday | 60.63 | ||||||
| Derived (41 cpm) | 83.61 | 74.94 | 0.79 | 2.45 (−5.39, 10.28) | −1.92 | (−140.73, 136.89) | |
| 50 cpm |
85.59 | 73.64 | 0.80 | 5.45 (−2.38, 13.28) | 10.62 | (−122.82, 144.05) | |
| 100 cpm |
92.22 | 68.49 | 0.80 | 15.95 (7.97, 23.93) | 54.96 | (−67.06, 176.98) | |
| 150 cpm |
95.32 | 64.06 | 0.80 | 22.48 (13.95, 31.01) | 81.46 | (−40.05, 202.98) | |
| Wednesday | 64.17 | ||||||
| Derived (52 cpm) | 82.27 | 73.95 | 0.78 | −0.99 (−9.13, 7.16) | −17.63 | (−194.43, 159.17) | |
| 50 cpm |
81.88 | 74.21 | 0.78 | −1.52 (−9.72, 6.68) | −20.26 | (−199.10, 158.58) | |
| 100 cpm |
89.17 | 68.83 | 0.79 | 8.67 (1.20, 16.15) | 28.63 | (−119.61, 176.87) | |
| 150 cpm |
93.00 | 64.24 | 0.79 | 15.35 (7.88, 22.83) | 59.85 | (−76.99, 196.70) | |
| Thursday | 59.98 | ||||||
| Derived (60 cpm) | 82.08 | 70.73 | 0.76 | 5.85 (−4.63, 16.34) | 11.70 | (−161.96, 185.37) | |
| 50 cpm |
79.87 | 72.20 | 0.76 | 2.43 (−7.86, 12.73) | −3.07 | (−181.58, 175.43) | |
| 100 cpm |
87.23 | 66.14 | 0.77 | 14.63 (3.75, 25.50) | 49.59 | (−111.53, 210.71) | |
| 150 cpm |
91.56 | 61.30 | 0.76 | 22.58 (11.23, 33.93) | 83.82 | (−68.80, 236.43) | |
| Friday | 64.76 | ||||||
| Derived (59 cpm) | 83.40 | 75.38 | 0.79 | −2.09 (−8.59, 4.41) | −12.41 | (−138.85, 114.03) | |
| 50 cpm |
81.69 | 76.48 | 0.79 | −4.27 (−10.90, 2.36) | −22.36 | (−151.59, 106.86) | |
| 100 cpm |
89.14 | 70.77 | 0.80 | 6.15 (0.57, 11.73) | 24.55 | (−82.52, 131.61) | |
| 150 cpm |
92.93 | 66.25 | 0.80 | 12.63 (7.21, 18.05) | 52.77 | (−47.13, 152.68) | |
| Saturday | 49.91 | ||||||
| Derived (97 cpm) | 80.82 | 77.02 | 0.79 | 7.23 (−2.89, 17.35) | 11.44 | (−121.61, 144.50) | |
| 50 cpm |
70.42 | 82.14 | 0.76 | −9.03 (−19.15, 1.10) | −46.00 | (−205.55, 113.55) | |
| 100 cpm |
81.30 | 76.79 | 0.79 | 7.99 (−2.11, 18.08) | 14.06 | (−117.47, 145.58) | |
| 150 cpm |
87.11 | 71.97 | 0.80 | 19.22 (8.30, 30.14) | 53.06 | (−67.99, 174.10) | |
| Sunday | 54.76 | ||||||
| Derived (57 cpm) | 80.97 | 77.96 | 0.79 | 2.38 (−8.36, 13.13) | 1.16 | (−154.32, 156.63) | |
| 50 cpm |
79.58 | 78.93 | 0.79 | −0.02 (−10.63, 10.60) | −7.63 | (−163.56, 148.30) | |
| 100 cpm |
87.32 | 72.45 | 0.80 | 14.40 (2.85, 25.95) | 44.37 | (−104.63, 193.36) | |
| 150 cpm |
91.20 | 67.35 | 0.79 | 23.17 (10.69, 35.65) | 76.42 | (−69.07, 221.91) | |
| Monday to Friday | 61.22 | ||||||
| Derived (60 cpm) | 84.25 | 73.23 | 0.79 | 2.11 (−3.59, 7.82) | 3.87 | (−111.28, 119.02) | |
| 50 cpm |
82.31 | 74.42 | 0.78 | −0.62 (−6.37, 5.13) | −8.38 | (−127.07, 110.32) | |
| 100 cpm |
89.36 | 68.76 | 0.79 | 10.27 (4.71, 15.83) | 40.18 | (−64.31, 144.66) | |
| 150 cpm |
93.09 | 64.10 | 0.79 | 17.24 (11.59, 22.89) | 70.83 | (−23.38, 170.04) | |
| Saturday and Sunday | 53.79 | ||||||
| Derived (74 cpm) | 80.51 | 77.52 | 0.79 | 1.63 (−5.83, 9.10) | 4.32 | (−91.74, 100.37) | |
| 50 cpm |
75.19 | 80.65 | 0.78 | −6.91 (−14.85, 1.02) | −22.11 | (−124.04, 79.81) | |
| 100 cpm |
84.43 | 74.78 | 0.80 | 8.43 (1.06, 15.80) | 24.91 | (−68.09, 117.91) | |
| 150 cpm |
89.24 | 69.82 | 0.80 | 18.03 (10.24, 25.82) | 54.71 | (−41.67, 151.08) | |
| All 7 d | 56.65 | ||||||
| Derived (65 cpm) | 83.65 | 74.40 | 0.79 | 5.35 (−3.89, 14.59) | 18.17 | (−91.94, 128.27) | |
| 50 cpm |
80.69 | 76.24 | 0.78 | 1.01 (−8.37, 10.39) | 0.08 | (−114.12, 114.29) | |
| 100 cpm |
88.24 | 70.52 | 0.79 | 12.90 (3.89, 21.90) | 49.22 | (−52.67, 151.11) | |
| 150 cpm |
92.21 | 65.78 | 0.79 | 20.45 (11.33, 29.58) | 80.11 | (−17.09, 177.30) | |
| Working hours (Monday to Friday) | 65.85 | ||||||
| Derived (35 cpm) | 83.54 | 69.34 | 0.76 | 0.00 (−7.79, 7.79) | −4.62 | (−93.61, 84.37) | |
| 50 cpm |
86.72 | 66.82 | 0.77 | 4.77 (−2.77, 12.30) | 8.11 | (−73.97, 90.20) | |
| 100 cpm |
92.57 | 60.84 | 0.77 | 14.11 (6.71, 21.52) | 33.16 | (−37.65, 103.98) | |
| 150 cpm |
95.35 | 56.21 | 0.76 | 19.56 (11.93, 27.19) | 47.51 | (−20.52, 115.53) | |
| Non − working hours (Monday to Friday) | 58.62 | ||||||
| Derived (73 cpm) | 83.54 | 75.46 | 0.80 | 6.04 (−5.83, 17.91) | 3.62 | (−39.70, 46.94) | |
| 50 cpm |
79.34 | 78.22 | 0.79 | −0.70 (−12.22, 10.81) | −4.19 | (−48.58, 40.21) | |
| 100 cpm |
86.73 | 72.29 | 0.80 | 12.05 (−0.48, 24.58) | 10.34 | (−33.05, 53.74) | |
| 150 cpm |
90.77 | 66.82 | 0.79 | 20.75 (6.88, 34.62) | 19.96 | (−25.04, 64.94) |
aCrouter (2006); bMatthews (2008); cKozey-Keadle (2011); sensitivity and specificity are expressed as percentages; AUC, area under the curve; LoA, limits of agreement; mins, minutes; Sedentary time as measured by the activPAL™.
Figure 2. Bland–Altman plots of the relationship between activPAL3™ and derived ActiGraph GT3X+ sedentary time, for working and non-working hours.
Download figure:
Standard image High-resolution image
Discussion
This current study is the first to empirically derive sedentary behaviour thresholds in adults in the free-living environment. Most existing studies that have used an ActiGraph accelerometer to describe time spent in sedentary behaviours have used an arbitrary threshold of 100 cpm to define sedentary behaviour; however, this cut-point had not been empirically derived in adults. We found that the empirically derived cut-point across all days of the week was 65 cpm; the cut-points for individual days of the week were significantly different, ranging from 41 to 60 cpm with the exception of Saturday, which was substantially higher (97 cpm). Interestingly, cut-points for working hours were substantially lower compared to non-working times (35 cpm versus 73 cpm).
The derived cut-points performed better in terms of mean bias and average difference in sedentary time, compared to the 100 and 150 cpm threshold. Specifically, the 100 cpm cut-point over-estimated worktime sedentary behaviour by 14.11% compared to an overestimation of <0.01% for the derived cut-point of 35 cpm. The use of a new sedentary behaviour cut-point in a specific setting, for example 35 cpm in office workers, would reduce misclassification of non-sedentary activities such as filing, which have previously been found to have an average cpm of 60 (Crouter et al 2006).
Validation studies of the 100 cpm cut-point for ActiGraph accelerometers have found conflicting findings in working age adults. Kozey-Keadle et al (2011) found that both the activPAL™ and the ActiGraph GT3X (100 cpm threshold) underestimated sedentary time by 2.8% and 4.9% respectively, compared to direct observation, in a small cohort of overweight university workers (n = 20; mean BMI 33.7 ± 5.7 kg m−2). The same study suggested that 150 cpm may be the most appropriate cut-point to define sedentary behaviour from the ActiGraph GT3X. Conversely, Crouter et al (2013) found that the 100 cpm threshold from the ActiGraph GT1M, overestimated sedentary time in working-age adults by 9.9%, compared to a criterion measure of indirect calorimetry in a free-living environment over 6 h (n = 29; mean BMI 25.0 ± 4.6 kg m−2). This is similar to our current study, where we found the 100 cut-point overestimated sedentary time by 12.9% (across all seven days) compared to the criterion measure of the sedentary classification of the activPAL3™ accelerometer. The lower empirically derived cut-point of 65 cpm, across the whole week, also overestimated sedentary time, but with a lower mean bias of 5.35%. This overestimation in sedentary time may be explained by misclassification of some non-ambulatory standing activities that can produce low counts per minute (Crouter et al 2006, Matthews et al 2008). A study by Hart et al (2011) examined the convergent validity of the activPAL™, the ActiGraph GT1M and an activity record (the Bouchard Activity Record), in healthy adults (n = 32; mean BMI 23.0 kg m−2). They found moderate agreement between sedentary time for the ActiGraph GT1M compared to the activPAL™ ( = 0.47); sedentary time was also found to be 25% higher using a 100 cpm threshold from the ActiGraph GT1M compared to the sedentary classification of the activPAL3™. Differences in the methodologies between these studies included: different criterion measures (direct observation (Kozey-Keadle et al 2011); indirect calorimetry (Crouter et al 2013); sedentary classification of activPAL, this study and Hart et al (2011)); and time of studies (direct observation and indirect calorimetry was 6 h (Kozey-Keadle et al 2011, Crouter et al 2013); waking hours over one day (Hart et al 2011); seven days, this study). Another difference was the ActiGraph model and use (or not) of the low-frequency extension during data processing, which impacts on comparability between studies (Cain et al 2013). Cain et al (2013) found that data from different generations of ActiGraph devices are comparable for moderate to vigorous physical activity, but not at the lower end of the movement continuum; this is thought to be due to the more recent models (GT3X and later) requiring larger accelerations to record non-zero counts. Applying the low-frequency extension enables greater comparability with studies that have used older model ActiGraph devices when comparing sedentary time. Studies by Kozey-Keadle et al (2011) and Aguilar-Farías et al (2013) used the low-frequency extension during data processing; studies by Crouter et al (2013) and Hart et al (2011) used the ActiGraph GT1M device and were carried out before the low-frequency recommendation by Cain et al (2013). Finally, the three studies that were carried out in healthy adults of normal weight all found an overestimate of sedentary time compared to the 100 cpm threshold: the exception was the study by Kozey-Keadle et al (2011), which was in 20 overweight university workers where the 100 cpm underestimated sedentary time. It is not clear why overweight individuals might have different cut-points. There has been some conflicting reports of the effect of waist adiposity on the tilt angle of the monitor, and consequently on the output of some activity devices (Swartz et al 2009). However, the accuracy of the output from ActiGraph devices has been shown not to be affected by the differences in tilt angle that occur in individuals with different BMI (Feito et al 2011). For older adults (mean age 73.5 years) a threshold of <25 cpm may be more appropriate to define sedentary behaviour (Aguilar-Farías et al 2013). For children and adolescents, the 100 cpm threshold seems to hold true (Treuth et al 2004b, Ridgers et al 2012). There seems to be no consensus for ActiGraph accelerometer cut-points for sedentary behaviour, and those proposed vary widely. Combined, these findings suggest that there should be different cut points for different populations.
Not only have we demonstrated the derivation of empirical ActiGraph accelerometer cut-points for sedentary behaviour, our study adds to this growing field by identifying a lower threshold of 35 cpm for sedentary time during working time for office workers. These proposed lower thresholds in older people and office workers suggest that these groups are more stationary whilst sitting. Because these studies all used waist worn ActiGraph accelerometers, the differences in stillness whilst sitting must originate from limited hip movement. Taken together, these studies suggest that people sit differently depending on the population characteristics (age, body composition) and the environment where sedentary time is accrued.
In studies of largely office-based workers, sitting time on workdays is known to be much higher compared to non-work days (Thorp et al 2012, Healy et al 2016); these studies found that people sat for 77.0% and 78.8% of working hours, using the ActiGraph GT1M and the activPAL3™ monitors respectively. Another study found that over 80% of work hours were spent in sedentary behaviours compared to 69% in non-work time (objectively measured using an Actical accelerometer) (Parry and Straker 2013). While our study was not designed to measure total sedentary time we also found higher percentages of sitting time on working days compared to the weekend (61.22% versus 53.79%); and working hours versus non-working hours, using the activPAL3™ sedentary classification (65.85% versus 58.62%). The workplace is a key setting for prolonged bouts of sedentary time (Ryan et al 2011). Although we found this was also true for our study, since 70.15% of sedentary time during working hours was spent in prolonged bouts (⩾20 min), this was not statistically significant to non-working hours, (66.65%: data not shown). It is important to further investigate sedentary time accrued during working hours, not only as a risk in itself, but also because it is known that those who sit a long time at work also tend to be sedentary for longer periods in their leisure time (Jans et al 2007).
Our study derived sedentary cut-points for both the working and non-working domains; however, another domain in which people may accrue significant sedentary time is travel. We collected only limited information on travel time and mode; however, we tried to minimise any commuting time on weekdays by limiting working and non-working hours used in the regression models. Our derived cut-points for working and non-working hours implied that we sit differently at work compared to our leisure time; it is not known what extent this is true for travel time.
This is the first time that a threshold for cpm for sedentary behaviour has been empirically derived from an observational study in a free-living environment, using the activPAL™ sedentary behaviour classification as the criterion measure. The activPAL™ has been shown to provide valid and precise measures of sedentary time (Grant et al 2006, Kozey-Keadle et al 2011). However, there are some limitations to our study. Although the accelerometer manufacturers employ proprietary algorithms to reduce the raw acceleration data to cpm or sitting/standing behaviour, there are still a large amount of data cleaning and data reduction decisions to be made. Since the aim of the study was to derive cut-points, it was the quality of the data that was deemed to be important and not the quantity of minutes included. Therefore, aggressive data reduction rules were applied that used a combination of times from an activity diary and a non-wear algorithm. A strength of our study is the large amount of data (11 h 27 min: 82% of waking time), despite the data reduction process.
Generalised estimating equations can be used to account for autocorrelation; however, these models assume linearity of the outcome variable over time (Liang and Zeger 1986). The outcome variable (cpm) for this study has a polynomial distribution with time, and therefore the assumption of linearity is not valid. The models in this study were run with and without the assumption of linearity, using the mfp command in Stata that takes into account the multivariable fractional polynomial nature of the counts. When the results from these two methods were compared, there was no impact on the precision of estimates of the derived cut-points.
The ActiGraph accelerometer cut-points derived in this study were in university workers, who spent most of their day sitting in front of a computer. Our cut-point for sedentary behaviour across the whole week (65 cpm) may be limited to working adults, and the lower cut-point of 35 cpm may only be generalisable to other office based workers. Barnett and Cerin (2006) found considerable individual variability in calibration regression lines for accelerometer counts versus walking speed, and wide between-subject differences in mean bias are often reported for sedentary behaviour cut-points as evidenced in our study and also in Crouter et al (2013).
Cut-points based on energy expenditure from calibration studies can vary in estimates of time spent in different activity categories (Crouter et al 2006, 2013). The definition of sedentary behaviour from the SBRN classifies both posture and energy expenditure; however, there is currently no instrument that can measure free-living sedentary behaviour accurately using this definition (Granat 2012). Whilst the 100 cpm threshold from the ActiGraph provides a useful measure of sedentary behaviour, it generally overestimates time spent in these behaviours (Hart et al 2011, Crouter et al 2013). Taking into account the context and population in which sedentary time is accrued may have implications on how we measure sedentary time in a working population, and consequently in studies looking at correlates and determinants of sedentary behaviour. For example, a study that examined associations between sedentary time and cardio-metabolic risk factors, found more consistent associations for leisure time sedentary behaviour compared to occupational sedentary behaviour (Pinto Pereira et al 2012). We suggest that a applying a lower threshold to a homogenous population such as office workers would give more precise estimates for overall sedentary time compared to the 100 cpm threshold, and reduce misclassification of non-sedentary activities in this population.
Conclusion
Although the activPAL™ is widely used in research studies as the preferred accelerometer device to measure sedentary behaviour, the ActiGraph monitor is generally used in many large cohort studies (Hagströmer et al 2007, Matthews et al 2008, National Centre for Social Research and University College London. Department of Epidemiology and Public Health 2011, Baptista et al 2012, Hansen et al 2012); the data that has been collected with this device is still being analysed to examine correlates of sedentary behaviour and health-related outcomes. Since sedentary behaviour is independently linked to several health-related outcomes, it is imperative to have accurate and reliable measures of sedentary time when using objective measures. It is not known if different types of sedentary behaviour have different impacts on health, and therefore a more precise definition of ActiGraph accelerometer thresholds of sedentary behaviour are needed.
Acknowledgments
The authors thank the participants for taking part in the study. The authors would also like to acknowledge the contribution of Professor Lindsey Dugdill, who sadly passed away in December 2014. Lindsey was integral to the design, application and initial analyses of this study; she is greatly missed by her colleagues at the University of Salford.
Conflict of Interest
One of the authors is a co-inventor of the activPAL3™ physical activity monitor and a director of PAL Technologies Ltd. The remaining authors declare no competing interests.