


Abstract
Experiments were performed on the Omega EP laser facility to study laser pulse propagation, channeling phenomena and electron acceleration from high-intensity, high-power laser interactions with underdense plasma. A CH plasma plume was used as the underdense target and the interaction of the laser pulse channeling through the plasma was imaged using proton radiography. High-energy electron spectra were measured for different experimental laser parameters. Structures observed along the channel walls are interpreted as having developed from surface waves, which are likely to serve as an injection mechanism of electrons into the cavitated channel for acceleration via direct laser acceleration mechanisms. Two-dimensional particle-in-cell simulations give good agreement with these channeling and electron acceleration phenomena.
Export citation and abstract BibTeX RIS

Content from this work may be used under the terms of the Creative Commons Attribution-NonCommercial-ShareAlike 3.0 licence. Any further distribution of this work must maintain attribution to the author(s) and the title of the work, journal citation and DOI.
1. Introduction
Laser-based plasma accelerators have become a highly promising alternative to conventional accelerators in recent years. Wakefield acceleration can be driven by a laser pulse or particle beam propagating through an underdense plasma, which produces a plasma wave with a phase velocity close to the speed of light, and can transfer energy to 'surfing' electrons trapped in the waves [1–3]. With the reduction of the laser pulse duration, a regime where the laser pulse duration matched the plasma frequency was achieved and this allowed significant advances in controlling and producing narrow energy spread electron beams [4–6]. Furthermore, transverse oscillations of the high-energy electron beams within the plasma wave structure leads to a very bright, directional x-ray source [7]. Using laser pulses of longer pulse duration produce a more complicated interaction, with the leading edge of the pulse producing plasma waves. However, if the laser pulse is intense enough, the ponderomotive force of the laser pulse expels the electrons from the regions of highest intensity to form a cavitated channel. Once the channel has formed, plasma waves are no longer present, but electrons are able to gain energy through direct laser acceleration (DLA) mechanisms [8, 9].
The study of this channel formation, the energy exchange from the laser pulse to electrons and the subsequent transport and dissipation of the energy is of specific relevance to the hole boring fast ignition inertial confinement fusion scheme [10]. A high-intensity laser pulse is used to form a channel though the low-density coronal plasma of the compressed fuel, so that a second laser pulse can be guided to the dense fuel and strongly heat the electrons in this region to ignite the system. The aim of this study is to gain a better understanding of the energy transfer and electron heating mechanisms in such systems.
Several DLA mechanisms have been identified using particle-in-cell (PIC) simulations to accelerate electrons to energies exceeding the ponderomotive potential. The transfer of laser energy to the electrons can occur either through a stochastic acceleration mechanism [11, 12], or via the coupling of quasi-static electric or magnetic fields with the laser pulse fields within the cavitated channel [13, 14]. A parametric amplification mechanism could also contribute to electron acceleration in this regime [15]. Experimental measurements of high energy electrons accelerated from underdense plasma channels have been made [8, 9]. The energy gain of the electrons has been determined numerically to scale as the normalized vector potential, a0 = eE0/(mecωL) [11], where E0 is the peak laser electric field, e is the charge on an electron, me is the electron rest mass, c is the speed of light in vacuum and ωL is the frequency of the laser pulse. A recent publication by Naseri et al [16] demonstrates that surface waves are required to trap electrons at the channel wall and pre-accelerate them to relativistic energies. This initial momentum allows the electrons to undergo further energy gain via DLA mechanisms. Naseri et al found the two-stage process was required to explain the large number of electrons accelerated to well in excess of the ponderomotive energy.
Oscillation of these electrons within the channel and laser pulse fields, which necessarily take place during the acceleration process, have been shown to generate a bright source of x-ray synchrotron radiation [17]. By understanding the electron acceleration mechanisms, the electron trajectories and ways in which the mechanisms can be controlled or altered, allows the possibility to produce a high-brightness, short-duration, directional x-ray beam that may be useful as a high-energy density physics diagnostic. Furthermore, enhancing the energy transfer to electrons and increasing the electron beam temperature could be of interest to a situation where there might be a large pre-plasma ahead of a denser target or for positron production [18].
This paper presents electron spectra accelerated longitudinally by the Omega EP (extended performance) laser (either 1 or 10 ps pulses) from a CH plasma plume with a peak electron density of ne = 5 × 1019 cm−3, which, for the 1.053 μm laser wavelength to be used for this study, corresponds to 0.05nc, where nc = me 0ω2L/e2 is the critical density and 0 is the permittivity of free space. The plasma density used is comparable to the density used in a previous study [9], but with the extension to higher laser pulse energy. The experimental results are compared to two-dimensional PIC simulations. Proton radiography [19] images the evolution of the electromagnetic fields in the channel formed by the interaction. Modulations along the channel wall are observed in the proton probe images and are in good agreement with current loops and field structures seen in the PIC simulations as the surface waves evolve. The experimental set-up and simulation parameters are given in sections 2 and 3, respectively. Section 4 discusses channeling, surface waves and electron acceleration and section 5 summarizes the findings of this paper.
2. Experimental set-up
The experiment was performed at the Laboratory for Laser Energetics using the Omega EP laser system. A single long-pulse (∼nanosecond) laser beam was used to create an underdense plasma target and two 'short-pulse' (∼picosecond) beams provided the main interaction pulse and a pulse to generate a proton probe beam. Schematics of the two experimental configurations are shown in figures 1(a) and (b). The long-pulse had a 2.5 ns super-Gaussian temporal profile at a wavelength of 351 nm (3ω). There was 1120 J energy on target, focused to an 800 μm diameter super-Gaussian profile focal spot using distributed phase plates, incident at 55° to the normal of a 125 μm thick planar plastic target. The intensity on target was 1 × 10¹⁴ W cm−2, which created a plasma plume. The two-dimensional hydrodynamic code SAGE [20] was used to model the heating and expansion of the fully ionized CH plasma plume into the vacuum, to determine the plasma density profile. The path of the main interaction pulse was at a height of 1.9 mm above and parallel to the target surface at a time of 3.0 ns after the leading edge of the long pulse arrived on target. At this position and time, the plasma electron density profile was well approximated by a Gaussian function of half-width =650 μm as shown by the fit (solid line) with a peak plasma density of ne = (5 ± 1) × 1019 cm−3 = 0.05nc, with the error being due to experimental laser pulse energy fluctuations. Some shots were taken at an angle of 23° through the plume, meaning a slightly asymmetric profile was expected. Both these profiles are shown in figure 1(c).
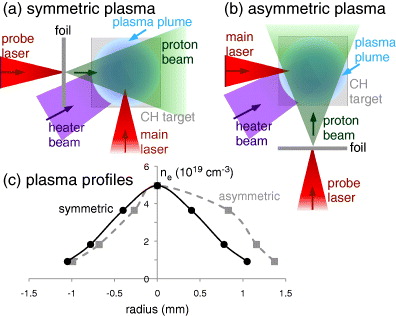
Figure 1. Schematic of (a) symmetric and (b) asymmetric experimental configurations showing the production of the underdense plasma plume by the long pulse heater beam, the interaction of the main laser beam, and the proton probe diagnostic. The plasma profiles that the main interaction beam will propagate through are plotted in (c) as calculated by the SAGE code, with the radius measured relative to the axis of the plasma plum in a plane containing the main laser beam. The solid line is a Gaussian fit and the dashed line for the asymmetric axis is to guide the eye.
Download figure:
Standard imageThe main interaction pulse had either a full-width half-maximum (FWHM) pulse duration of 8 or 1 ps and a range of on-target energies giving average powers of >55 TW. It was focused using an f/2 off-axis paraboloid to the focal plane, which was 0.8 mm from the axis of the plume, where ne = 2.5 × 10¹⁹ W cm−2 = 0.025nc. If a laser pulse exceeds a critical power, Pc ≈ 17.5(nc/ne) GW, relativistic self-focusing overcomes diffraction and the pulse will be guided [21]. In this experiment, Pc ≈ 0.7 TW and therefore the main interaction pulse was well into the relativistic self-focusing regime. If a Gaussian temporal profile is assumed, the peak vacuum intensities for typical shots are 3.7 × 10¹⁹ W cm−2 for the 8 ps pulse and 2 × 10¹⁹ ⩽ I ⩽ 1.5 × 10²⁰ W cm−2 for the 1 ps pulse (due to a range of laser pulse energies), corresponding to peak normalized vector potentials 4 ⩽ a0 ⩽ 11. On-target intensity maps have been reconstructed using on-shot wavefront data [22].
For creating the proton radiography beam, a pulse with on-target energy of 250 J and a FWHM pulse duration of 1 ps was used. The laser pulse had a central wavelength of 1.053 μm and was linearly polarized. The pulse was focused with an f/2 off-axis paraboloid giving peak vacuum intensities of (0.4–1) × 1020 W cm−2 (a0 = 6–9) onto a 50 μm thick copper foil. A proton beam originating from the rear side of the target was generated through target normal sheath acceleration [23]. This acceleration mechanism produces a proton beam with a small virtual source size (∼1 μm), good laminarity, and a generation time on the order of the laser pulse duration (∼1 ps) [19]. Therefore using this proton beam as a probe provides good spatial and temporal resolution. The proton source foil was placed 5 or 6 mm from the main interaction focal spot and the backlighter beam was focused onto the front surface of the foil. The protons are detected on a radiochromic film (RCF) pack placed 8 cm away from the main interaction, which gives an approximate interaction magnification of 17. The stack has a vertical tip of 5° and a horizontal tilt of 10° to avoid back-reflected light into the laser chain. As the time it takes the protons to travel from the source foil to the interaction is dependent upon the proton energy, different film layers image a different times in the interaction creating an image sequence.
An absolutely calibrated magnetic spectrometer measured the electron spectrum along the main interaction beam axis [24].
3. Particle-in-cell simulation parameters
To model the interaction two-dimensional (x, y, px, py, pz) PIC simulations were performed using the OSIRIS 2.0 code [25]. The simulation box was 2 mm × 1 mm with a resolution of 12.6 cells per λ in the longitudinal (x) direction and 3.1 cells per λ in the transverse direction (y). There were 16 particles per cell for each species, electrons and protons. Although experiment used a CH plasma, the interaction governing the channeling is largely dominated by the interaction with the electrons, so the additional ion species would be unlikely to affect the general result considered here. The radial ion acceleration could be one phenomena where a difference may be observed. The initial plasma density profile was Gaussian with a width of 500 μm and a maximum density of 0.05nc. The laser pulse was linearly polarized with the electric field in the y-direction and a wavelength λ = 1.053 μm. To approximate the experimental energy distribution in the focal plane, two overlapped pulses were used, one for the central hotspot focused to w0 = 3.4 μm giving a peak vacuum a0 = 5.5 and the other to mimic the wider energy distribution, focused to w0 = 16 μm giving a peak vacuum a0 = 1.5, which gave total of a0 = 7. The focal plane was 800 μm before the peak density. Two different laser pulses are compared. The shorter having a FWHM pulse duration of τL = 1 ps and the longer having a FWHM pulse duration of τL = 8 ps. The peaks of the pulses enter the simulation box at 1.3 and 10.4 ps, and arrive at the peak plasma density at 4.6 and 13.7 ps, for the 1 and 8 ps pulses respectively.
4. Surface waves and electron acceleration
Figure 2 shows experimental proton probe images of a 55 J, 1 ps pulse passing through the underdense plasma from left to right. The first image shows the time when the laser pulse had just arrived at focus and the channel was beginning to form. The second and third images are from later times into the interaction and show how the laser pulse broke up into a number of individual filaments, creating several channels [26, 27]. Along the filaments, a periodic structure grows, which has a period of approximately 50 μm at peak density. These features persist for times well after the laser pulse has left the plasma (the lower energy probe proton images show the plasma until 20 ps on the shot shown in figure 2, although not shown) and have been previously explained as electromagnetic soliton excitation [28].
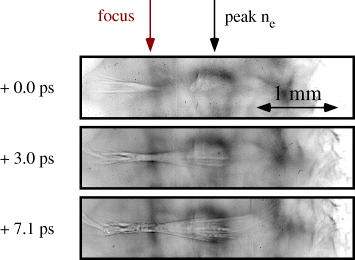
Figure 2. A sequence of proton probe images showing the channel formation by the 1 ps laser pulse interaction.
Download figure:
Standard imageFigure 3 shows the laser pulse intensity envelope and electron density at three times through the simulation. The laser pulse intensity envelope was obtained by applying a low pass Fourier filter to the squared electric field from the simulation. The channel filamentation is visible in the electron density plots and the channel walls appear modulated, particularly further along the channel. Note that the laser pulse was refracted away from the higher plasma density and hence the channel formation also deviates from the original laser axis.
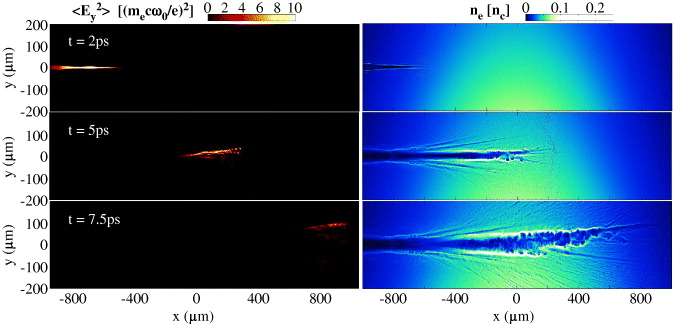
Figure 3. One picosecond pulse simulation data showing (left) the laser pulse intensity envelope and (right) the electron density at times of 2, 5 and 7.5 ps into the simulation. The laser pulse is propagating from left to right.
Download figure:
Standard imageThe proton probe also captured the electromagnetic field structures created by a 750 J, 8.4 ps pulse passing through an underdense plasma, which were previously presented in [29, 30]. The image in figure 4 shows a time of 18.4 ± 3.0 ps after the laser pulse has reached half-peak intensity at the focal plane. The image times were estimated by comparing the channel radius observed in the experimental data to the channel radius observed in two-dimensional simulations. This would be equivalent to a time of 28 ± 3 ps into the simulation, so although this late time was not reached by the simulation, the 17.5 ps data show the closest comparison to the experimental data in figure 4. A single channel is observed to be formed through the plasma near the focal plane. However, after some laser pulse propagation distance, the channel is observed to break up into a number of filaments. At a later time, the laser pulse self-corrects, causing the individual channels to merge into a single channel. This self-correction is due to the ponderomotive force of the laser, which eventually displaces plasma between the filaments, resulting in a single channel. The proton probe images show the walls of the channel have periodic modulations. Figure 4 shows a region of the proton probe image of the channel, with an expanded region to highlight in more detail the wave-like structures, which have a scale of approximately 50 μm. The proton probe diagnostic is relatively insensitive to density modulations, which implies that features in the proton images are primarily due to electromagnetic fields. Therefore the electric and magnetic fields at the channel walls are not smooth and likely have complex structures.
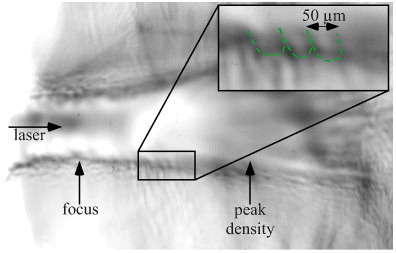
Figure 4. Close up of proton probe image of the 8 ps interaction showing the channel wall region at a time of 18.4 ± 3 ps after the laser pulse reaches half-peak intensity at the focal plane and an expanded view of the modulations.
Download figure:
Standard imageThe proton probe image in figure 4 has an increase in the proton flux along the center of the channel. The presence of this feature can be explained by a reduction in the radial electric field strength, which would reduce the deflection of the proton probe from the channel. The ponderomotive force of the laser initially expels the electrons from the regions of highest intensity, which produces a radial electric field. On a longer time-scale, the ions within the channel respond to this electric field and are accelerated radially in a Coulomb explosion [31] to evacuate the channel and hence reduce the radial electric field. A similar effect was previously noted by Kar et al [32].
The rate at which the channel forms due to the ponderomotive force of the laser pulse is determined by the peak intensity of the laser pulse and the rise time of the approximately Gaussian pulse. The simulations show that the channel for the 1 ps pulse developed more rapidly than the longer 8 ps pulse, due to the faster rise time (both simulations had the same peak a0). Once the electrons are expelled from the peak intensity region, a large transverse electric field (≈0.4 TV m−1) caused by the charge displacement is generated. The ions within the channel are then accelerated transversely in this electric field. The plasma density at the center of the channel was greatly reduced and as a result there were no plasma waves within the channel. Therefore, once the channel had formed, the electrons were not accelerated by a self-modulated wakefield acceleration mechanism [2, 33, 34].
The laser pulse undergoes various instabilities including relativistic self-focusing [21, 35], which keeps the intensity of the laser pulse high over a longer distance, filamentation [26, 27] and hosing [36]. Figure 5(a) shows the laser pulse intensity envelope at 13.5 ps in to the 8 ps pulse simulation. The laser pulse focal profile was initially close to Gaussian, but after some propagation distance it became modulated. Surface waves are excited at the channel walls by intensity modulations in the laser pulse envelope [36]. At the entrance to the channel, and for some distance after the focal plane, the electron density of the channel walls appears relatively smooth (figure 5(b)). However, beyond where the laser pulse first appears modulated, the electron density of the channel walls also starts to exhibit modulated structures. The magnitude of the current, |j|, the transverse electric field, Ey, and the transverse magnetic field, Bz, all show similar structures (figures 5(c)–(e)).
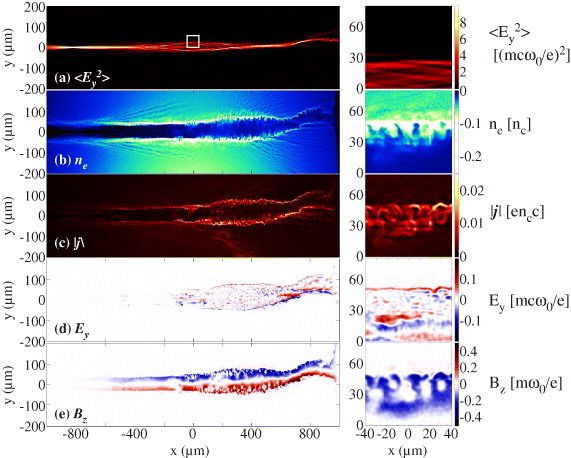
Figure 5. Eight picosecond pulse simulation data at a time of 13.5 ps. (Left) the full box length (x-direction) is shown. (Right) a zoomed-in region (indicated by the white box on the left image) gives more detail to illustrate (a) the laser pulse intensity envelope,  , (b) the electron density, ne, (c) the magnitude of the current, |j|, (d) the y-component of the electric field, Ey and (e) the z-component of the magnetic field, Bz. The laser pulse is propagating from left to right and is polarized in the y-direction.
Download figure:
Standard imageAn antisymmetric mode can be excited by the hosing of the front of the pulse and is described by the dispersion relation [36]

where kx,sw is the wave number of this mode, de = c/ωpe is the electron skin depth and l is the channel width. By considering the excitation of the surface wave as the radiation of an oscillating, moving source, Naumova et al find that kx,sw ≈ ω2pe/cωL. In the case considered here, the skin depth, de ∼ 1 μm, is much smaller than the channel width, l ≈ 50 μm. Therefore, equation (1) can be approximated to ωsw ≈ ω2pe/ωL and the wavelength of the surface waves is estimated to be λsw ≈ 2πc/ωsw = λLnc/ne. The peak plasma density along the laser pulse propagation path was ne = 0.05nc, so the predicted surface wave wavelength is λsw ≈ 21 μm. At half the peak density 0.025nc (500 μm from the simulation peak density), gives λsw ≈ 43 μm.
Figure 6 presents a section of the channel wall at three different times showing (a) the electron density, ne, (b) the magnitude of the current, |j| and (c) transverse magnetic field, Bz. In response to the laser accelerated electron beam, a strong return current [37] was drawn through the high-density walls of the channel (figure 6(b)). The accelerated electron beam generated an associated transverse magnetic field, Bz (see figure 5(e)). By 12.5 ps into the simulation, the channel wall modulation has been seeded. The electron density, the currents driven in the walls of the channel and the transverse magnetic fields show typical modulation features being ≈20 μm in size. These features are likely due to surface wave excitation [38] and the scales are in good agreement with the estimated λsw. At later times, the channel has expanded and the modulations have developed to a larger typical size of ≈50 μm, which is illustrated by the dashed red line overlaid on the 17.5 ps electron density contour plot. The scale of these features at this later time in the simulation agrees with the ≈50 μm observed in the experiment (figure 4).
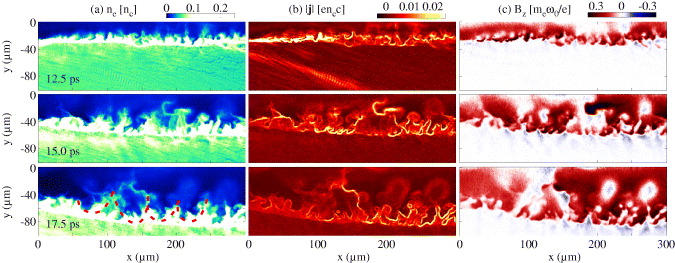
Figure 6. (a) The electron density, ne (b) the magnitude of the current, |j| and (c) the transverse magnetic field, Bz in the vicinity of the channel wall from the simulation at times of 12.5, 15.0 and 17.5 ps. The 17.5 ps electron density has a dashed red line overlaid to illustrate the feature sizes.
Download figure:
Standard imageSurface waves have previously been identified as a possible injection mechanism for the DLA of electrons [38]. When an intense laser pulse creates the channel required for DLA, almost all of the electrons are expelled from the regions of highest intensity. A complete cavitation of the channel is possible at very high intensities [27]. To enable a significant number of electrons to be accelerated, there must be an injection mechanism to transport the electrons into the channel fields. To initiate the DLA, the electrons also require some initial relativistic momentum. By examining the flow vectors of the currents, the current loops generated by the surface waves open out in towards the center of the channel.
An expanded region of the simulation shows the details of the current loops and wall current structures in figure 7 at 17.5 ps. The current flow directions are shown by the superimposed blue arrows, with the larger blue arrows showing the overall current directions. Along the center of the channel, at y = 0 μm, the current direction is negative, corresponding to the longitudinal fast electron beam accelerated in the positive x-direction. The channel wall region, at y ≈ −50 to −90 μm, contains the complicated return current structures. Between the channel wall and the center of the channel, two electron vortices circulate around magnetic solitons [39] (the magnetic field structures can be seen in figure 6(c)). These loops are being fed with electron current from the channel wall structures. The laser pulse fields interact with the electrons orbiting the vortex, particularly at the points where the laser pulse electric field aligns with the electron current direction and acts to heat the electrons as is observed by considering  , as shown in figure 7(c). As the vortex electron energy increases, the radius of gyration gets larger, so that eventually the electrons are injected into the region of highest laser intensity where they can be accelerated via DLA.
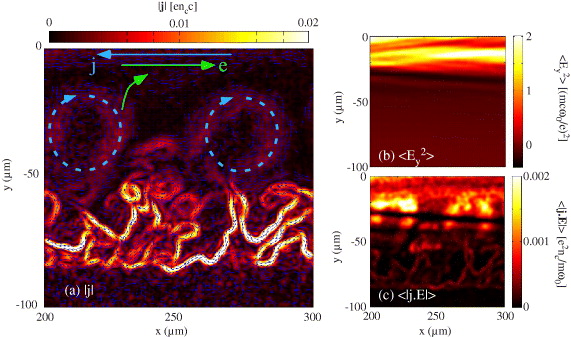
Figure 7. (a) Close-up view of the absolute current in the 8 ps pulse simulation at a time of 17.5 ps with the blue current flow direction arrows superimposed. The large light blue arrows illustrate the overall direction of the currents in the center of the channel and in the vortices. The light green arrows indicate the electron velocity direction. (b) The laser pulse intensity envelope,  . (c)
. (c)  , indicating where work is being done on the electrons.
Download figure:
Standard imageTypical experimental electron spectra measured along the initial laser-axis for different laser conditions are shown in figure 8. The effective temperature of the electron beams were obtained from the high energy spectra gradients. The experimental beam divergence was measured using a RCF stack to be ≈10° (half-width half-maximum) for both the 94 TW, 8 ps shots and the 400 TW, 1 ps shots. The electron beam was observed to be centered along the laser pulse axis for the 94 TW, 8 ps shots. However, at high-power (400 TW, 1 ps shots), the electron beam was observed to be deflected away from the laser pulse axis by 16°. This is likely due to the density asymmetry of the plasma plume, meaning the laser pulse is refracted toward the lower density (all figures are orientated with the higher density at the bottom of image). The simulation data illustrated in figures 3 and 5 also show the deviation from the initial axis (at the rear of the target, right side) of both the laser pulse propagation and channel direction. It is also likely that the refraction from the original laser axis becomes more severe at higher laser powers, which would explain the observed deflection in the electron beam and hence the reduction in total number measured in the on-axis electron spectrometer. Therefore, only the edge of the electron beam would be observed in the spectrometer for the higher power shots.
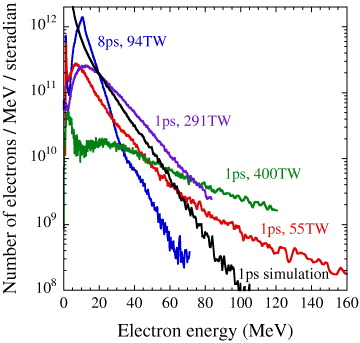
Figure 8. Experimental electron spectra from typical shots with different laser conditions. Below 109 electrons MeV−1 sr−1, the signal becomes unreliable as this is close to background noise. The 1 ps pulse duration simulation electron spectrum at a time of 6 ps into the simulation is also shown (spectrum has been scaled using a multiplication factor).
Download figure:
Standard imageA summary of the electron spectral data gathered over a number of shots for each laser condition is shown in table 1. The total charge, Qtotal, the total beam energy, Ebeam, and conversion efficiency from laser pulse energy into the electron beam, η, are estimated by assuming the electron beam has a divergence angle of 10°. High effective temperatures, Teff, are reached, which are well in excess of the ponderomotive potential energy,  , where
  is the time-averaged Lorenz factor (for a0 = 7, Up ≈ 2MeV). Teff generally increases with a0, which is in agreement with scalings for DLA where the acceleration is driven by the electric-field of the laser pulse. The conversion efficiency of laser pulse energy into electron energy, η, shows a general decrease with increasing laser power. Considering the channel as a cylinder, the ratio of the surface area to the volume of the channel gets smaller with increasing radius. The channel radius is expected to increase with laser energy. Therefore at higher laser power, the channel wall area where the injection occurs does not increase as rapidly as the cavitated channel volume where the acceleration occurs, hence there is a decrease in overall efficiency.
Table 1. Summary of the different experimental laser conditions (defined by the laser energy Elaser, the laser pulse duration, τL, and a0) and the electron spectral data taken. The total charge, Qtotal, total beam energy, Ebeam and conversion efficiency from laser energy into the electron beam, η, are all calculated assuming a beam with a divergence angle of 10°. The effective temperatures, Teff, are determined using fits to the electron spectra.
| No. shots | Elaser (J) | τlaser (ps) | Plaser (TW) | a0 | Qtotal (nC) | Ebeam (J) | η (%) | Teff (MeV) |
|---|---|---|---|---|---|---|---|---|
| 4 | 755±10 | 8 | 94±1 | 5.4 | 365±150 | 4.6±1.8 | 0.6±0.2 | 6.5±0.2 |
| 2 | 55±1 | 1 | 55±1 | 4 | 160±61 | 2.5±1.0 | 4.5±1.8 | 14.5±0.4 |
| 2 | 291±7 | 1 | 291±7 | 9.5 | 235±70 | 4.6±1.9 | 1.6±0.6 | 12.3±3.2 |
| 2 | 400±2 | 1 | 400±3 | 11.1 | 33±22 | 1.0±0.9 | 0.3±0.2 | 30.0±11.4 |
Both the 1 and 8 ps pulse simulations show the high-energy electrons are accelerated over the duration of the high-intensity pulse. An electron energy spectrum generated from the 1 ps pulse simulation, by considering the forward momentum of the electrons within 20 μm of the center of the channel, is shown in figure 8. This spectrum has been scaled by a constant multiplication factor in order to make the comparison between simulation and experimental data easier. The effective beam temperature was Teff ≳ 10 MeV for the 1 ps pulse simulation at a time of 6 ps into the simulation. This simulated spectrum would be comparable to laser conditions between the experimental 55 and 291 TW spectra, and is in reasonable agreement with the electron beam temperatures measured experimentally at these laser powers. It is difficult to obtain a meaningful electron spectrum for the 8 ps simulation, since the pulse duration is longer than the simulation box and the boundary condition at x = ± 1000 μm is absorbing for the electrons.
There are a number of considerations to make when comparing the experimental and simulated electron spectra. (i) The experimental data showed more extensive channel filamentation than the simulations, due to the fact that the focal spot and plasma density were likely much less uniform than assumed in the simulations, aiding the seeding of the instabilities and likely reducing the peak laser intensity. (ii) The electron spectrometer diagnostic had a limited dynamic range due to a high background signal. The image plate detectors are sensitive to all ionizing radiation and some of the x-rays and γ-rays generated by the interaction will penetrate the diagnostic shielding to produce a background signal. Since the production of x-rays and γ-rays are intrinsically linked to the fast electrons, shots producing the higher temperature, better conversion efficiency electron beams inherently cause a larger background signal in the diagnostic. This is particularly problematic for the higher energy electrons where the signal-to-noise ratio becomes small. Therefore the effective temperatures, rather than the maximum energy, of the electron beams is likely the better measure for comparison. (iii) The simulation spectra are taken during the interaction, rather than considering only those particles leaving the interaction. As electrons leave the target, sheath fields grow and could alter the spectrum of the emerging electron beam. (iv) There is also evidence that the electron beam does not emerge from the plasma along the original axis of the laser beam, but is rather deflected as discussed above. However, the simulations do illustrate that very high temperature electron beams are accelerated within the channel and that the surface waves are the likely injection mechanism for the DLA.
5. Summary
In conclusion, proton probing has been used to image the interaction of high-energy, high-power laser pulses through millimeter-scale plasma with a peak density of 0.05nc and provides evidence for surface waves on the channel walls. Surface waves are an injection mechanism to launch electrons from the high density walls of the channel into the cavitated channel region, where the high intensity laser fields coupled to the strong quasi-static electric and magnetic fields associated with the channel can accelerate electrons via a DLA mechanism to energies of many times the ponderomotive potential. High energy electron spectra were observed from both experiment and PIC simulations.
In the context of creating a channel for fast ignition inertial confinement fusion [10], this type of electron acceleration could be detrimental to the implosion if a significant hot electron current were to outrun the channeling laser pulse and pre-heat the dense central fuel. Conversely, the highly directional electron beam generated in underdense plasma may assist fast ignition by generating a strong collimating magnetic field, which could guide the more divergent electron beams generated in solid target interactions [40]. An understanding of the DLA mechanism and the surface wave generation and electron injection mechanisms is therefore necessary if the process is to be controlled. Furthermore, efficiently accelerating high-temperature electron beams through DLA could be useful for producing high-brightness, directional x-ray beams [17] for use as a high-energy density physics diagnostic, or for enhancing positron production [18] particularly at higher plasma densities where the conversion efficiency is higher [41].
Acknowledgments
The authors gratefully acknowledge technical assistance from the staff of the Laboratory for Laser Energetics and the OSIRIS consortium (UCLA/IST) for the use of OSIRIS 2.0. The OSIRIS 2.0 simulations were run on GlowWorm (NSF/DOE grant no.-0903557), part of the Nyx cluster. This work was supported by the National Laser Users' Facility (NLUF) and the DOE (grant no. DE-NA000874). This work was partially supported by the DOE for LLNL under #DE-AC52-07NA27344.