

Abstract
The snow-induced radiative forcing (SnRF) measures the instantaneous perturbation to Earth's shortwave radiation at the top of the atmosphere (TOA) caused by the presence of snow cover. Land surface albedo (as) is a key parameter in estimation of SnRF. Previous studies have focused on using satellite or reanalysis as data in SnRF quantifications. However, their spatial and temporal differences remain unclear. In this study, SnRF over the Northern Hemisphere (NH) estimates from two satellite and four reanalysis as datasets were compared for the overlapping period of 1982–2012. The 31-year annual-mean SnRF was estimated at −1.81 to −1.59 W m−2 from satellite as datasets, with a peak of −4.01 W m−2 and Standard Deviation (SD) of 1.54 W m−2 in April. The comparable SnRF from reanalysis as was −1.48 to −2.30 W m−2, with a peak of −4.77 W m−2 and SD of 0.81 W m−2 in the same month. In the seasonal cycle, SnRF from satellite as displayed lower values from October to January, but higher values from February to July, compared with SnRF using reanalysis as. Moreover, the annual-mean SnRF declined by 0.39–1.25 W m−2 during 1982–2012 from satellite as datasets, which is much smaller than the results using reanalysis as datasets. Furthermore, changes in monthly-mean SnRF from satellite as displayed an enhance trend in snow accumulation seasons, which are largely different with the comparable changes from reanalysis-based SnRF, indicating that there are large interannual and intra-annual biases between SnRF estimates from satellite and reanalysis as datasets. Based on above results, we conclude that the large discrepancies between SnRF estimations from satellite and reanalysis as should be considered in evaluating the response and feedback of snow cover to Earth climate change in future studies, especially in radiation budget anomalies.
Export citation and abstract BibTeX RIS

Original content from this work may be used under the terms of the Creative Commons Attribution 4.0 licence. Any further distribution of this work must maintain attribution to the author(s) and the title of the work, journal citation and DOI.
1. Introduction
Surface albedo (as) is defined as the ratio of the solar radiation reflected from the Earth's surface to the solar radiation incident upon it, is critical in the regulation of Earth's surface energy budget and characterizing the Earth's radiative regime (Lofgren 1995, Liang et al 2010, Liang et al 2019). Published studies have proved that snow cover extent (SCE) changes are positively correlated with as anomalies because of its high reflectance (Qu and Hall 2014, Chen et al 2015, Chen et al 2017, Zhang et al 2019). When the snow cover shrinks, the as decreases, with less solar radiation reflected back into the space. Meanwhile, the remaining snow generally has a lower as caused by snow metamorphosis (Qu and Hall 2014). The solar radiation perturbation induced by as anomalies that are driven by SCE changes is defined as snow-induced radiative forcing (SnRF) (Flanner et al 2011, Chen et al 2015, Chen et al 2016a), which is vital in measuring the feedback of snow cover to Earth radiation budget (Flanner et al 2011, Singh et al 2015) and climate projections (Perket et al 2014, Qu and Hall 2014) under the climate change background.
To estimate radiative forcing caused by snow cover changes, several studies have estimated the SnRF at different time spans and spatial scales in recent decades (Flanner et al 2011, Chen et al 2015, Singh et al 2015, Chen et al 2017). For example, Flanner et al (2011) quantified the radiative forcing from the Northern Hemisphere (NH, the half of the Earth that lies north of the equator) cryosphere during 1979–2008 and reported that the cyrospheric cooling declined by 0.45 Wm−2 during 1979–2008, with nearly equal contributions from changes in land snow cover and sea ice. Chen et al (2015) estimated the SnRF induced by snow cover phenology changes over the NH for the period 2001–2014 and found that the contrasting changes in snow cover phenology led to contrasting anomalies of SnRF among the NH middle and high latitudes, which accounted for 51% of the total shortwave flux anomalies at the top of the atmosphere (TOA) during 2001–2014. Singh et al (2015) quantified the global land shortwave cryosphere radiative effect during 2001–2013 and reported that the NH land SnRF estimates from Moderate Resolution Imaging Spectroradiometer (MODIS) were approximately 18% smaller than previous estimates derived from coarse-resolution advanced very high resolution radiometer (AVHRR) data during the overlap period of 2001–2008. However, being limited by the uncertainty of as datasets and shortage of long-term as datasets, the differences in SnRF evaluated from longterm satellite and reanalysis as datasets are remain unclear.
The as is one of the most important parameter in the calculation of SnRF, which measures the amount of solar radiation reflected back into the space caused by snow cover changes (Groisman et al 1994, Flanner et al 2011, Perket et al 2014, Chen et al 2015, Singh et al 2015). However, as is among the main radiative uncertainties in current climate modeling (Liang 2001, Liang et al 2002), which may bring a cumulative error in the SnRF estimation. For example, Myher and Myher (2003) reported that cropland as values is the most important factor yielding the large range in estimated radiative forcings caused by land use changes. Bright and Kvalevåg (2013) confirmed that through perturbations in as, land use activities affected shortwave radiative forcing at the TOA. As one of the most notable component of land cover type over the NH, with large spatial coverage and rapid changes, presence of snow cover are largely related with land use changes over the NH. Published studies have proven that SCE in the NH has experienced a well-documented rapid decrease since late 1960s (Déry and Brown 2007, Brown et al 2010, Derksen and Brown 2012, Chen et al 2016a). Moreover, climate projections suggest that the SCE will continue shrinking in the future (Brown and Robinson 2011, IPCC 2013). Thus, to make clear the spatial and temporal differences in SnRF estimation caused by as datasets is necessary to reduce the radiative uncertainties in climate change studies.
Published scholars have reported large differences among current as products, e.g., By analyzing the global as climatology and spatial-temporal variation during 1981–2010, He et al (2014) showed that at latitudes higher than 50°, the maximum difference in winter zonal albedo ranged from 0.1 to 0.4 among the nine satellite datasets. Assessment of Community Land Model (CLM2) as using MODIS data, Oleson et al (2003) reported that in regions with extensive snow cover, the CLM2 overestimated white-sky and black-sky as by up to 20%. As the largest single component of the cryosphere in terms of spatial extent, the discrepancy between the satellite-derived and reanalyzed as is evident. Although published studies have estimated SnRF from local to global scales, few of them have provided a comprehensive analysis of the uncertainties in SnRF estimations induced by as datasets.
The objective of the present study is to comprehensively examine the performance of satellite and reanalysis as datasets in representing the large scale spatiotemporal variability and long term change in SnRF over the NH. Additionally, the study aims to understand the differences between reanalysis and satellite as in the context of characterizing radiative forcing within the NH climate system, which is crucial for accurately characterizing NH climate patterns and assessing the underlying evolution of the NH climate system.
2. Methodology and datasets
To calculate SnRF over the NH and cross-compare SnRF results from satellite and reanalysis as datasets, we first introduce the methodology in calculation of SnRF. Then, we give a brief introduction of datasets used in this study.
2.1. Methodology
2.1.1. Estimation of SnRF
To calculated SnRF over the NH, the radiative kernel approach (Shell et al 2008, Soden et al 2008) was employed in this study. The radiative kernel approach separates the radiative responses to land surface albedo as induced by snow cover changes with other climate parameters (such as temperature, water vapor, and CO2). In this study, the albedo radiative kernels, expressed as the TOA shortwave flux anomalies associated with a 1% change in as, were employed to estimate SnRF driven by snow cover changes. The time (t) dependence of SnRF (W m−2), within a region R (here, the NH) of area A, composed of grid cells r can be expressed as follows (Flanner et al 2011, Chen et al 2015):

where S (t, r) is the domain of SCE over the NH, ∂αs/∂S (t, r) is the rate of variation of land surface albedo αs with snow cover change, and ∂F/∂αs (t, r) is the response of the TOA net shortwave radiation anomalies to αs changes. Following Flanner et al (2011), we assumed that the temporally and spatially varying ∂αs/∂S and ∂F/∂αs were constant with the snow cover fraction S and αs, respectively. Therefore, ∂αs/∂S could be replaced with the mean albedo contrast (Δas) induced by the snow cover anomaly and ∂F/∂αs can obtained from the albedo radiative kernels (Flanner et al 2011, Chen et al 2015).
2.1.2. Z-score definition
To cross-compare SnRF estimates from satellite and reanalysis as datasets consistently, SnRF over the NH during the period 1982–2012 were converted into corresponding z-score series in the comparison analysis. According Kreyszig (1979), the z-score of a raw SnRF series x is expressed as

where μ and σ are the mean and standard deviation (SD) of SnRF over the NH for period 1982–2012, respectively.
2.2. Datasets
According equation (1), the snow cover range, albedo contrast Δas caused by snow cover presence, and albedo radiative kernels are needed in the calculation of SnRF. The snow cover range was obtained from SCE dataset. The Δas was calculated by subtracting snow-free surface albedo (αsf) from surface albedo as in the corresponding period. The albedo radiative kernels were get from published datasets.
To meet the requirements in SnRF estimation, the snow cover range from the Climate Data Record (CDR) of NH SCE Version 4 (NHSCE) (Brodzik and Armstrong 2013); two satellite αs datasets from the global land surface satellite (GLASS) (Liang et al 2013a, 2013b) and the second edition of Climate Monitoring Satellite Application Facility (CM SAF) Cloud, Albedo And Surface Radiation dataset from AVHRR (CLARA-A2) (Karlsson et al 2017); four reanalysis αs datasets from the European Centre for Medium-Range Weather Forecasts (ECWMF) reanalysis 5 (ERA-5) published by the Copernicus Climate Change Service (C3S) (C3S 2017), the 55-yr Japanese reanalysis project (JRA-55) (Ebita et al 2011), the Modern-Era Retrospective analysis for Research and Applications, Version 2 (MERRA-2) (Gelaro et al 2017), the National Centers for Environmental Prediction (NCEP) climate forecast system reanalysis (CFSR) (Saha et al 2010); a snow-free surface albedo αsf dataset from the MODIS Terra and Aqua combined Bidirectional Reflectance Distribution Function and Albedo (BRDF/Albedo) Global Gap-Filled, Snow-Free Version 6 (MCD43GF) (Schaaf 2019); and albedo radiative kernels from the community atmosphere model version 3 (CAM3) (Shell et al 2008), atmosphere model 2 (AM2) (Soden et al 2008) and the sixth generation of the atmospheric general circulation model ECHAM (ECHAM6) (Mauritsen et al 2013) were used in this study. Summary of datasets used in this study are listed in table 1.
Table 1. Summary of datasets used in the study.
| Variables | Datasets | Horizontal resolution | Temporal resolution | Spatial coverage | Time span | References |
|---|---|---|---|---|---|---|
| Snow cover | NHSCE | 25 km | Weekly | NH | 1966.10–2018.12 | Brodzik and Armstrong (2013) |
| Satellite-retrieved as | GLASS | 0.05° | 8-day | Global | 1981.06–2017.12 | Liang et al (2013a) |
| CLARA-A2 | 0.25° | 5-day | Global | 1979.06–2015.12 | Karlsson et al (2017) | |
| Reanalysis as | ERA-5 | 0.25° | Monthly | Global | 1979.01–2019.10 | C3S (2017) |
| CFSR | 0.50° | Monthly | Global | 1979.01–2017.11 | Saha et al (2010) | |
| JRA-55 | 0.50° | Monthly | Global | 1958.01–2012.12 | Ebita et al (2011) | |
| MERRA-2 | 0.50° | Monthly | Global | 1980.01–2017.11 | Gelaro et al (2017) | |
| Snow-free as | MCD43GF | 0.0083° | Daily | Global (<70°N) | 2000.03–2017.12 | Schaaf (2019) |
| Albedo radiative kernels | CAM3 | 2.81° | Monthly | Global | — | Shell et al (2008) |
| AM2 | 2.50° | Monthly | Global | — | Soden et al (2008) | |
| ECHAM6 | 1.88° | Monthly | Global | — | Mauritsen et al (2013) |
2.2.1. NHSCE snow cover dataset
To obtain snow cover range used in SnRF estimation over the NH, the NHSCE Version 4 (https://nsidc.org/data/NSIDC-0046/versions/4) (Brodzik and Armstrong 2013) at weekly intervals for January 1982 through December 2012 at a spatial resolution of 25 km was employed in this study. The NHSCE is developed by Robinson et al (2014), which were derived from the manual interpretation of AVHRR, Geostationary Operational Environmental Satellite (GOES), and other visible-band satellite data (Helfrich et al 2007). The NHSCE is widely used in large-scale snow cover studies (Brown and Robinson 2011, Derksen and Brown 2012, Chen et al 2016a). Uncertainty analysis of NHSCE estimated from regression analysis and an inter-comparison of multiple datasets indicated a 95% confidence interval in NH spring SCE of ±3%–5% for 1966–2010 (Brown and Robinson 2011).
2.2.2. Satellite-retrieved land surface albedo datasets
Two longterm satellite as datasets were employed to estimate SnRF over the NH and to cross-compare with SnRF estimates from reanalysis as for the overlapping period of 1982–2012.
2.2.2.1. CLARA-A2 land surface albedo dataset
The CLARA-A2 dataset provides 5-day black-sky as dataset (wavelengths of 0.25–2.5 μm), which is generated based on a homogenized AVHRR radiance time series and is created by using algorithms to separately derive as for different land use areas, including snow, sea ice, open water, and vegetation (Karlsson et al 2017). Currently, the CLARA-A2 as dataset is the only available longterm as product derived from AVHRR imagery. In this study, the CLARA-A2 black-sky as over the NH at the spatial resolution of 0.05°, covering from 1982 to 2012 were used to cross-compare SnRF estimates from GLASS and reanalysis as datasets. The CLARA-A2 as dataset has been used to estimate sea ice albedo changes (Riihelä et al 2013) and sea ice as comparison (Cao et al 2016) over the Arctic regions.
2.2.2.2. GLASS broadband albedo dataset
The GLASS Broadband Albedo Version 40 product is based on the integration of two algorithms through a temporal filter scheme (Liu et al 2013, Zhao et al 2013) using AVHRR and MODIS version 6 radiance data. The GLASS products provide as at total shortwave, visible and near-IR under actual atmospheric conditions spectral ranges. To match black-sky as obtained from CLARA-A2, the 8-day GLASS total shortwave black-sky as at the spatial resolution of 0.05°, covering from 1982 to 2012 were used in this study. The GLASS as dataset has been used to quantify the albedo induced radiative forcing of snow melting over Greenland (He et al 2013), forest disturbances over northeastern China (Zhang and Liang 2014) and snow cover phenology changes over the NH (Chen et al 2015, Chen et al 2016a) with high quality and fine spatial resolution.
2.2.3. Reanalysis land surface albedo datasets
Four longterm reanalysis as datasets were selected to quantify SnRF over the NH and to cross-compare with SnRF estimates from satellite as from 1982 to 2012, including JRA-55, CFSR, MERRA-2, and ERA-5.
2.2.3.1. ERA-5 reanalysis land surface albedo datasets
The ERA-5 product is the latest global atmospheric reanalysis dataset produced by the ECMWF (https://www.ecmwf.int/en/forecasts/datasets/reanalysis-datasets/era5)(C3S 2017). ERA-5 has important changes relative to the former ERA-Interim atmospheric reanalysis, including higher spatial and temporal resolutions with a latest. model and data assimilation system (Albergel et al 2018).
The monthly ERA-5 as was calculated with clear sky surface downward and upward shortwave fluxes at a 0.125 spatial resolution from 1979 to present. By using eight independent observations include evapotranspiration, gross primary production, soil moisture, and leaf area index from remote sensing observations and soil moisture, turbulent heat fluxes, river discharges and snow depth from in situ observations, Albergel et al (2018) reported that the ERA-5 showed a consistent improvement over ERA-Interim. To cross-compare SnRF results from satellite and other reanalysis datasets, the monthly ERA-5 as at the spatial resolution of 0.125°, covering NH from 1982 to 2012 were employed in this study.
2.2.3.2. JRA-55 reanalysis land surface albedo datasets
The JRA-55 is the longest reanalysis datasets that uses the full observing system (in contrast, products like ERA-20C and NOAA 20CR assimilate a very limited set of observations while NCEP R1 uses an antiquated model and assimilation scheme) spanning 1958 to present (https://climatedataguide.ucar.edu/climate-data/jra-55). The monthly JRA-55 as product is parameterized as functions of solar zenith angle and surface skin temperature (Ebita et al 2011). In this study, the monthly JRA-55 as at the spatial resolution of 0.5°, covering NH from 1982 to 2012 were used in quantification of SnRF over the NH.
2.2.3.3. MERRA-2 reanalysis land surface albedo datasets
The MERRA-2 is a global atmospheric reanalysis derived from the Goddard Earth Observing System atmospheric general circulation model, version 5 (GEOS-5) (Gueymard et al 2019) (https://gmao.gsfc.nasa.gov/reanalysis/MERRA-2/). The MERRA-2 is the first satellite-era global reanalysis to assimilate space-based observations of aerosols and represent their interactions with other physical processes in the climate system spans from 1980 to 2017. To cross-compare SnRF results from satellite and other reanalysis datasets, the monthly MERRA-2 as at the spatial resolution of 0.5°, covering NH from 1982 to 2012 were used in this study.
2.2.3.4. CFSR reanalysis land surface albedo datasets
The NCEP CFSR is a global, high resolution, atmosphere–ocean–land surface–sea ice coupled system over the period January 1979 to November 2017 (Saha et al 2010) (https://climatedataguide.ucar.edu/climate-data/climate-forecast-system-reanalysis-cfsr). The CFSR was designed to provide the best estimate of the state of these coupled domains over this period. The monthly NCEP CFSR as was calculated using the land model Noah described by Rai et al (2019). To cross-compare SnRF results from satellite and other reanalysis datasets, the monthly CFSR as at the spatial resolution of 0.5°, covering NH from 1982 to 2012 were used in this study.
2.2.4. MCD43GF snow-free land surface albedo dataset
To obtain climatology of monthly-mean snow-free surface albedo αsf needed in SnRF calculation, the gap-filled daily MCD43GF αsf at spatial resolution of 1 km (Schaaf 2019) was used in this study, which representing the as after removing the presence of snow cover. The MCD43GFαsf product are computed for MODIS spectral bands 1 through 7 as well as shortwave-infrared, visible and near-infrared bands from 2001 to 2017. To compare with white-sky as from CLARA-A2 and GLASS datasets, the daily shortwave broadband white-sky αsf from 2001 to 2012 was used in this study.
2.2.5. Albedo radiative kernels datasets
To reduce radiative uncertainty in SnRF estimation caused by albedo radiative kernels, three monthly albedo radiative kernels: CAM3 gridded at 2.81° horizontal resolution from Shell et al (2008), AM2 gridded at 2.50° horizontal resolution from Soden et al (2008), and ECHAM6 gridded at 1.875° horizontal resolution from Mauritsen et al (2013) were used in this study. The seasonal cycle of albedo radiative kernels from CAM3, AM2 and ECHAM6 over the NH are shown in figure 1.
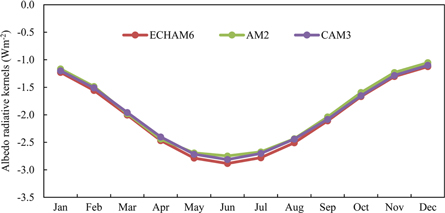
Figure 1. Differences between albedo radiative kernels used in the study.
Download figure:
Standard image High-resolution image2.2.6. Data preparation
Considering the time span and spatial resolution of individual datasets, this study was carried out among the overlapping period of 1982–2012 in 0.5° spatial resolution. Because of missing AVHRR surface reflectance data in 1994, the satellite as datasets from CLARA-A2 and GLASS were incomplete in this year. Thus, we excluded 1994 in this study. Due to difficulties in discriminating snow from ice over Greenland, this region was excluded from the analysis.
Before calculation, datasets used in this study in table 1 were regridded and remapped at a spatial resolution of 0.5° with geographic latitude/longitude projection with the help of gdalwarp (http://www.gdal.org/gdalwarp.html). For datasets with spatial resolution greater than 0.5°, we used 'average' in the resampling process, which computed the average of all non-NODATA contributing pixels in the domain of our study. For datasets with spatial resolution lower than 0.5°, we used 'cubic-spline' in the resampling process.
To match the temporal interval of albedo radiative kernels, the weekly NHSCE snow cover dataset, 8-day GLASS, 5-day CLARA-A2, and daily MCD43GF datasets were temporally aggregated to produce a monthly-averaged series in the calculation. To make sure the quality of as datasets, the quality control flags of '00' and '01' of the 8-day GLASS as, indicating uncertainties of <5% and <10%, were used to generate the monthly mean as series. Quality assurance values between '0' and '1' of daily MCD43GF, representing the majority of high-quality and good quality full inversion values, were used to generate the monthly mean snow-free surface albedo and climatology snow-free surface albedo over the NH.
3. Climatology of SnRF over NH
The annual-mean and monthly-mean of SnRF over the NH for the period 1982–2012 were used to explore the climatology differences between 31-year averaged SnRF derived from satellite and reanalysis as datasets. For SnRF estimates using a given as dataset, we first calculated the monthly SnRF using CAM3, AM2, and ECHAM6 albedo radiative kernels, respectively. Then, we obtained the annual-mean SnRF by averaging the monthly-mean SnRF from January to December. The numbers in parenthesis indicate the SD of averaged annual-mean SnRF between three SnRF results.
3.1. Annual-mean SnRF
The spatial distributions of the 31-year annual-mean SnRF estimates from two satellite and four reanalysis as datasets during 1982–2012 are presented in figure 2. As shown in figure 2(a), SnRF estimates from both satellite and reanalysis as datasets displayed similar spatial distribution over the NH during 1982–2012, with generally larger values in the high latitude areas of Eurasia and North America, and the high elevation Rocky Mountains, Tibetan Plateau, and Stanovoy Range, but smaller values in the low latitude and low elevation regions.
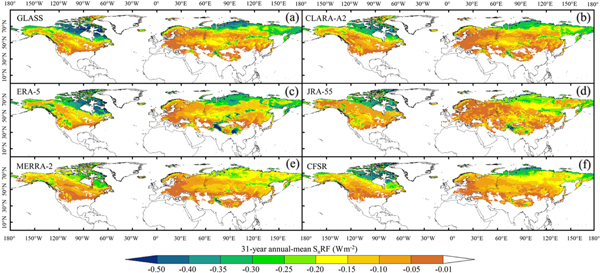
Figure 2. Annual mean SnRF over the NH calculated from (a) GLASS, (b) CLARA-A2, (c) ERA-5, (d) JRA-55, (e) MERRA 2, and (f) CFSR from 1982 to 2012.
Download figure:
Standard image High-resolution imageThe annual mean SnRF over the NH during 1982–2012 was estimated at −1.81 (±0.06) W m−2, −1.59 (±0.10) W m−2, −2.30 (±0.15) W m−2, −1.48 (±0.16) W m−2, −1.74 (±0.07) W m−2, and 1.49 (±0.06) W m−2 using the GLASS, CLARA-A2, ERA-5, CFSR, JRA-55, and MERRA-2 as datasets, respectively.
Compared with SnRF estimates from GLASS as (figure 2(a)), the results from CLARA-A2 (figure 2(b)) was minor at high latitudes, especially in regions of Eurasia near the Arctic Ocean. However, compared with SnRF derived from GLASS and CLARA-A2, most of the SnRF estimates from reanalysis as displayed minor values in high latitude and high elevation regions, especially JRA-55 (figure 2(d)) and MERRA−2 (figure 2(e)). Moreover, as shown in figure 2(c), the SnRF estimates from ERA-5 as displayed higher values in mountainous regions, such as the Rocky Mountains, Tibetan Plateau, and Stanovoy Range. In contrast, SnRF estimates from CFSR as was minor in the high elevation Rocky Mountains, Tibetan Plateau, and Stanovoy Range, which indicate that there are large differences exist between SnRF results from individual as dataset, even among reanalysis as datasets.
3.2. Seasonal cycle of the SnRF
The climatology of monthly-mean SnRF in each month for a given as dataset was calculated by averaging the three SnRF estimates using CAM3, AM2, and ECHAM6 albedo radiative kernels. The climatology of seasonal SnRF over the NH for the period 1982–2012 derived from two satellite and four reanalysis as datasets are displayed in figure 3. The satellite-based SnRF in figure 3 were calculated by averaging SnRFs estimate from GLASS and CLARA-A2 as datasets. The reanalysis-based SnRF in figure 3 were calculated by averaging SnRFs estimate from JRA-55, CFSR, MERRA-2, and ERA-5 as datasets.
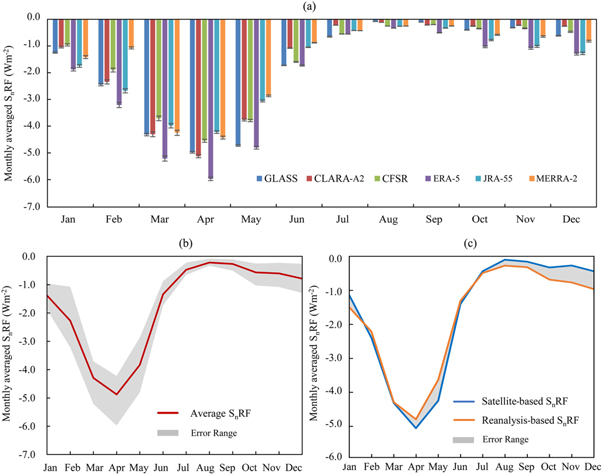
Figure 3. Seasonal cycle of SnRF over the NH from 1982 to 2012. (a) The climatology of monthly-mean SnRF calculated from six individual as datasets, (b) the monthly-averaged SnRF and associated error range between SnRFs derived from six individual as datasets, and (c) error ranges between SnRFs derived from satellite and reanalysis as products. Error Range indicates differences between the maximum and minimum value of SnRF for a given month.
Download figure:
Standard image High-resolution imageAs shown in the seasonal cycle of SnRF over the NH estimates from six individual as dataset during 1982–2012 (figure 3(a)), the SnRF from both satellite and reanalysis as datasets captured the seasonal cycle of SnRF over the NH. The SnRF broadly peaked at approximately −5.97 (±0.07) W m−2 to −4.22 (±0.05) W m−2 in April because of the high solar radiation and large SCE over the NH in April. Meanwhile, the SnRF valleys were broad at −0.33 (±0.003) W m−2 to −0.08 (±0.001) W m−2 in August because of low SCE and albedo radiative kernels values in August caused by higher cloud optical thickness over the NH. However, there were large differences between seasonal cycles of SnRF derived from satellite and reanalysis as datasets. Compared with the SnRF estimates from GLASS and CLARA-A2 as datasets, SnRF calculated from the ERA-5 as dataset displayed higher values in the entire cycle of SnRF over the NH from January to December.
The average monthly-mean SnRF from six as datasets are displayed in figure 3(b), in which the largest discrepancies are distributed in May (−1.93 W m−2), followed by April (−1.75 W m−2) and March (−1.50 W m−2). The detailed differences between SnRF derived from satellite and reanalysis as datasets are displayed in figure 3(c). Compared with the averaged satellite-based SnRF over the NH, the reanalysis-based SnRF displayed higher values in snow accumulation seasons from October to January, but lower values in snow melting seasons from February to July, which indicated that the reanalysis-based SnRF could not capture the actual seasonal cycle of SnRF over the NH during 1982–2012.
4. Changes in SnRF over the NH
Changes in annual-mean and monthly-mean SnRF were used to explore the ability of SnRF derived from satellite and reanalysis as datasets in capture the radiative feedback of snow cover to Earth climate system for the period 1982–2012. Changes were calculated as linear trends multiplied by the time interval.
4.1. Changes in annual-mean SnRF
4.1.1. Spatial distribution of changes in annual-mean SnRF
The spatial distribution of 31-year changes in annual-mean SnRF estimates from six individual as datasets during 1982–2012 are displayed in figure 4.
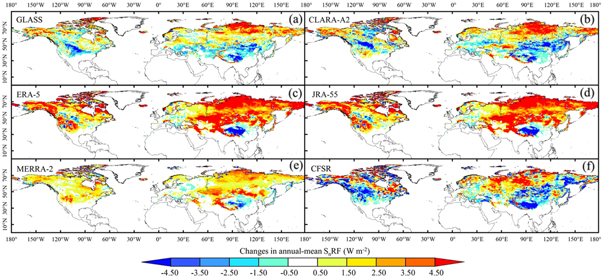
Figure 4. Changes in SnRF over the NH calculated from (a) GLASS, (b) CLARA-A2, (c) ERA-5, (d) JRA-55, (e) MERRA-2, and (f) CFSR during 1982–2012.
Download figure:
Standard image High-resolution imageAs shown in figures 4(a) and (b), the NH experienced weakened cooling effects with a smaller magnitude of SnRF changes in high latitudes near the Arctic Ocean, but strengthened cooling effects with a larger magnitude of SnRF changes in the mid-latitudes, including the central United States and Tibetan Plateau during 1982–2012. Compared with SnRF changes based on satellite as datasets, the comparable changes using ERA-5 (figure 4(c)) and JRA-55 (figure 4(d)) displayed general positive anomalies over the NH, except for the TP regions. Moreover, the large scale negative SnRF changes in the United States and Northern China from satellite-based SnRF results were not captured in SnRF estimates from ERA-5 (figure 4(c)), JRA-55 (figure 4(d)), and MERRA-2 (figure 4(e)). Moreover, the CFSR-based SnRF displayed significant negative changes among most of the NH landmass, except for the high latitudes of Eurasia, which is in conflict with the published findings of rapid snow cover extent reduction in recent decades (Brown et al 2007, Déry and Brown 2007, Chen et al 2016a).
4.1.2. Interannual variability of annual-mean SnRF over the NH
Detailed comparisons of 31-year annual-mean SnRF variabilities over the NH calculated from six individual as datasets during 1982–2012 are provided in figure 5. The large discrepancies between SnRFs estimate from two satellites and four reanalysis as datasets are clearly displayed in figure 6.
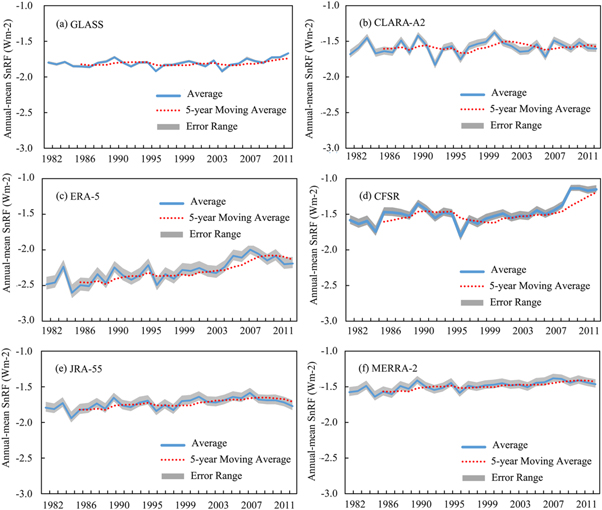
Figure 5. Annual-mean SnRF variabilities calculated from (a) GLASS, (b) CLARA-A2, (c) ERA-5, (d) JRA-55, (e) MERRA-2, and (f) CFSR over the NH from 1982 to 2012. Error Range indicates differences between the maximum and minimum value of SnRF for a given year.
Download figure:
Standard image High-resolution image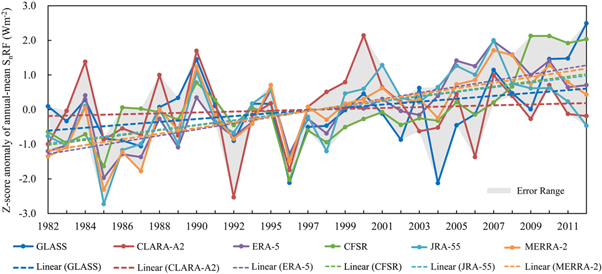
Figure 6. The z-score anomalies of the annual-mean SnRF calculated from GLASS, CLARA-A2, ERA-5, JRA-55, MERRA-2, and CFSR over the NH during 1982–2012. Error Range indicates differences between the maximum and minimum value of SnRF for a given year.
Download figure:
Standard image High-resolution imageBoth satellite and reanalysis-based SnRF present generally positive changes with the shrinking of the SCE over the NH during 1982–2012 (figure 5). The peak of annual-mean SnRF (−1.67 ± 0.03 W m−2) occurred in 2012, whereas in the valley, the peak at −1.92 (±0.05) W m−2 occurred in 2004 in GLASS-based SnRF estimations. Compared with GLASS-based SnRF, the magnitude of SnRF from CLARA-A2 was much smaller, with the peak and valley being −1.38 ± 0.08 W m−2 in 2000 and −1.83 ± 0.11 W m−2 in 1992, respectively. For SnRF estimates from reanalysis as datasets, the ERA-5 and JRA-55-based SnRF series presented peak values in 2007 with −1.99 ± 0.14 W m−2 and −1.59 ± 0.12 W m−2, respectively. Moreover, the valleys of the ERA-5 and JRA-55-based SnRF series occurred in 1985, with −2.60 ± 0.19 W m−2 and −1.94 ± 0.15 W m−2.
The SnRF over the NH declined by 0.39 W m−2 to 1.25 W m−2 during 1982–2012 based on series from satellite as datasets, which was much smaller than the comparable results calculated from the reanalysis-based SnRF (2.02 W m−2 to 2.65 W m−2), which may have overestimated the role of snow cover in climate change studies and future climate projections. Thus, the discrepancies between SnRF estimations from satellite and reanalysis as datasets should be considered when evaluating the snow-induced energy budget and climate system anomalies in future studies.
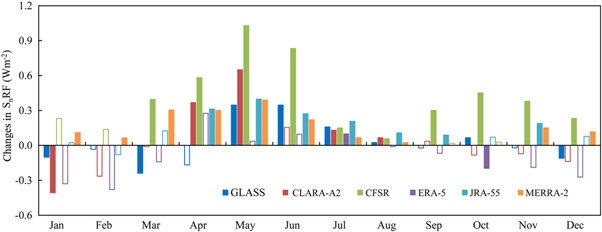
4.2. Changes in seasonal SnRF
The 31-year linear changes of SnRF over the NH in each month derived from two satellites and four reanalysis as datasets from 1982–2012 are shown in figure 7. Changes in SnRF in a given month from 1982 to 2012 were calculated as linear trends multiplied by the time interval.
Figure 7. Monthly changes in SnRF over the NH from 1982 to 2012. Bar filled with colors indicates that changes are statistically significant at the 95% level.
Download figure:
Standard image High-resolution image
Driven by the decreased SCE over the NH in spring and summer seasons (Chen et al 2016a), the SnRF calculated from both GLASS and CLARA-A2 as datasets displayed positive changes from April to August, which coincided with the SnRF changes derived from reanalysis as products. However, the negative SnRF changes calculated from GLASS and CLARA-A2 in the snow accumulation seasons from November to February were largely different from the SnRF changes derived from reanalysis as products, except for CFSR, especially in January. The changes in SnRF calculated from GLASS (−0.10 ± 0.010 W m−2) and CLARA-A2 (−0.41 ± 0.06 W m−2) as datasets were negative in January, which indicated an enhanced cooling effect caused by snow cover. However, this phenomenon could not be adequately represented by a reanalysis-based SnRF.
As reported by Chen et al (2016a) and Cohen et al (2012), driven by Arctic Amplification, increasing snow cover and widespread boreal winter cooling occurred from the 1990s onward. With increased snow cover extent and greater albedo contrast, additional solar radiation was reflected to space, which resulted in a strengthened cooling effect of snow cover and negative changes in SnRF. In contrast, with the rapid decline of spring and summer SCE over the NH (Brown and Robinson 2011, Derksen and Brown 2012, Chen et al 2016a), obviously weakened cooling effects should have been detected from SnRF. Compared with satellite observations, the reanalysis as field captured the SnRF changes.
5. Discussion and conclusions
The SnRF is a vital indicator to evaluate the contribution of snow cover to Earth radiation budget under the background of global warming and rapid SCE reduction over the NH in the past few decades. As a key parameter in SnRF estimation with large bias between satellite and reanalysis products, a comprehensively examine the performance of satellite and reanalysis as datasets in representing the large scale spatiotemporal variability and long term change in SnRF over the NH are necessary. Using two satellite and four reanalysis as datasets coupled with several ancillary datasets, this study explored the differences between satellite- and reanalysis-based SnRFs over the NH for the overlapping period of 1982–2012.
Although both satellite- and reanalysis-based SnRFs captured the climatology of the annual-mean and seasonal cycle of SnRF over the NH during 1982–2012, large differences still exist between them. For climatology of annual-mean SnRF, the reanalysis-based SnRF displayed lower values in high latitude and high elevation regions compared with satellite-based SnRF, which may underestimate the radiative forcing and feedback of snow cover to climate change in those regions. For the seasonal cycle, the reanalysis-based SnRF displayed higher values in snow accumulation seasons from October to January, but a lower value from February to July, compared with satellite-based SnRF over the NH from 1982 to 2012.
Changes in SnRF over the NH during 1982–2012 derived from satellite and reanalysis as datasets were also cross-compared in this study. The annual-mean SnRF over the NH declined by 0.39 Wm−2 to 1.25 Wm−2 during 1982–2012 from satellite-based SnRF, which is much smaller than the results calculated from the reanalysis-based SnRF. In addition, changes in monthly-mean SnRF from satellite-based SnRF series displayed an enhance trend in snow accumulation season over the NH from 1982 to 2012, which are largely different with the comparable changes from reanalysis-based SnRF, indicating that the reanalysis-based SnRF results cannot capture the actual inter-annual and intra-annual changes of SnRF over the NH.
Compared with previous research, the present study investigated the spatial and temporal differences between SnRF over the NH using satellite and reanalysis as datasets for the overlapping period of 1982–2012, which is important for current climate change studies and future climate projections. However, several unresolved issues remain in our study. Subjected to the coarse resolution of NHSCE snow range and reanalysis as datasets, this study was carried out at 0.5 spatial resolution, which may mixed the radiative forcing induced by snow cover and other land cover types, especially vegetation and permafrost (Johansson et al 2013). As an integral component of the global climate system with rapid changes, more detained evaluation and analysis of radiative forcing and feedback induced by snow cover changes with fine resolution is necessary in future studies. Since CLARA-A2 only provides white-sky surface albedo products, this study used white-sky surface albedo products from satellite observations in the cross-comparisons with reanalysis-based annual-mean and monthly-mean SnRF results. However, previous studies have reported that the differences between SnRF with white-sky albedo and black-sky albedo are slightly (Flanner et al 2011, Qu and Hall 2014, Chen et al 2016b), which will not influence the results of this study. Considering the large discrepancies in SnRF results from different surface albedo datasets, the uncertainties in SnRF estimations should be considered in future studies.
Acknowledgments
We would like to thank all people fighting with COVID-19 and the anonymous reviewers for their constructive comments and suggestions. This study was jointly funded by the comprehensive survey of biodiversity over the Mongolian Plateau (2019FY102001), the National Key Research and Development Program of China (NO. 2016YFA0600103) and the National Earth System Science Data Sharing Infrastructure (NO. 2005DKA32300). The Climate Data Record of Northern Hemisphere Snow Cover Extent and MCD43GF land surface albedo products were provided by the https://earthdata.nasa.gov/. The GLASS land surface albedo dataset were available at the national earth system science data center http://www.geodata.cn/. The CLARA-A2 land surface albedo dataset were obtained from the https://wui.cmsaf.eu/safira/. The JRA-55, CFSR and MERRA-2 reanalysis land surface albedo data were obtained from https://rda.ucar.edu/datasets. The ERA5 reanalysis land surface albedo data were obtained from https://www.ecmwf.int/en/forecasts/datasets/reanalysis-datasets/era5. The albedo radiative kernels were obtained from https://climatedataguide.ucar.edu/climate-data/radiative-kernels-climate-models.