


Abstract
We present inelastic neutron scattering data across the Verwey transition in magnetite, obtained for a single crystal via a detwinning method. We provide direct evidence of the influence of the charge order on the transverse-acoustic phonons, associated with discontinuous hardening and narrowing at the transition temperature, and energy splitting for different polarizations. This contrasts with the behavior of the transverse-optical X3 mode, which does not present any critical anomaly, contrary to theoretical expectations. Our data indicate that the incommensurate fluctuations occurring above the critical temperature become locked to the lattice at the transition point, through a mechanism similar to the crystallization of a two-dimensional liquid on a solid surface. Our results also contribute to clarify the different dynamics and mutual interactions of the electronic and structural modes in the Verwey transition.
Export citation and abstract BibTeX RIS

Original content from this work may be used under the terms of the Creative Commons Attribution 3.0 licence. Any further distribution of this work must maintain attribution to the author(s) and the title of the work, journal citation and DOI.
1. Introduction
Structural transformations of solids are formally classified as order–disorder or displacive transitions [1]. In the displacive limit, the concept of soft mode provides a unified picture of the fundamental mechanisms of the lattice dynamical transition. The displacement amplitude of the atoms from the equilibrium positions along the eigenvector of the soft mode can be considered as the ordering field for the structural transformation. Above the critical temperature, Tc, the crystal structure is unstable against the soft mode, whose frequency thus obeys a Curie–Weiss law,  , for
, for  . At Tc, the thermal average of the ordering field, referred to as the order parameter (OP), becomes finite. Equivalently, the dynamic vibrations of the soft mode are frozen into the static structural distortions of the low-symmetry phase. Phonon softening above Tc, followed by phonon condensation at Tc, are the essential features of prototypical displacive transitions with continuous character. The structural transformation of SrTiO3 is the textbook example of displacive transition of true second-order [2].
In the order–disorder limit, the ordering field is identified with an Ising pseudospin variable, whose cooperative ordering produces the transition itself, and its thermodynamic average can be regarded as the OP. In the structural case, complexes of atoms order on the long range, by means of large displacements from their original positions. For example, in NaNO2, NO2 triangles all point in a same direction in the low-temperature phase, whereas they become randomly oriented above TC [3].
Most transitions in solids are intermediate between the above limit cases. Both phonon- and Ising pseudospin-like variables are conceptually required to describe the transitions. Often, displacive structural transformations are associated with an order–disorder transition of a different degree of freedom. The Jahn–Teller effect is among the simplest processes of ordering of electronic states interrelated with atomic displacements. The Verwey transition in magnetite (Fe3O4), a concomitant electronic and structural transformation that takes place at ∼120 K, also represents an example of coupled order–disorder and displacive processes, but at the opposite limit in terms of complexity [4]. To date, the microscopic mechanisms that govern the macroscopic changes in the physical properties of magnetite still elude complete understanding. General theories of structural transitions themselves would benefit from a more profound insight into the Verwey transition, where the electronic, structural and magnetic subsystems are all important, and no leading hierarchy among them has emerged so far.
The most prominent modifications associated with the Verwey transition are a factor of 100 reduction in dc conductivity and symmetry lowering from cubic  to monoclinic Cc with decreasing temperature. In high purity samples, the Verwey transition is first order and takes place at a critical temperature between 110 K and 125 K (the so-called Verwey temperature, TV), depending on minor defect content and stoichiometry deviations [5]. In the high-temperature phase, the crystal structure of magnetite is a cubic inverse spinel, where Fe ions are either tetrahedrally or octahedrally coordinated, and respectively referred to as Fe A and Fe B sites. In both phases, A-type Fe ions are trivalent, whereas below TV excess charges unevenly distribute among the Fe B sites, in a long-range arrangement.
The monoclinic structure of magnetite in the low-temperature phase was refined using accurate methods since the 1980s [6]. However, the precise pattern of the charge and orbital order mutually related to the structural distortions in the monoclinic phase has been disclosed only recently [7–9]. The condensation of polaronic quasi-particles termed trimerons is held responsible for the insulating ground state in the low-temperature phase. The discovery of the trimerons has aroused renewed interest in understanding the role that the electronic and structural degrees of freedom play in the Verwey transition. Recent models argue that the driving force for the transition process resides in the cooperation between electrostatic and lattice vibrational effects [10, 11]. In particular, in presence of local correlations, the condensation of a mode of X3 symmetry was suggested to cause orbital polarization and weak electron localization, along with the opening of an insulating gap. Ultimately, the concerted effect of all the freezing modes determines a more complex pattern of charge and orbital order, corresponding to the experimental observations. Nevertheless, in contrast to the theoretical predictions, no anomaly of the X3 mode imputable to strong electron–phonon coupling was measured above TV [12], leaving contentious any possible hierarchy among the structural modes.
Precursor effects were found to anticipate the discontinuous transition over temperature intervals extending far above TV [12–21]. Diffuse scattering of neutrons and x-rays with local maxima at incommensurate points in reciprocal space was shown to survive to room temperature and attributed to the persistence of local and dynamical electronic and structural correlations in the cubic phase [13–16]. Examination of the scattering intensity indicates a prevalent contribution of the X3 mode to the inherent symmetry of the critical fluctuations [15]. Recently, by means of femtosecond broadband spectroscopy, some of us have demonstrated that modes of the low-temperature phase can be photoinduced also above the critical temperature of the material, owing to their strong coupling to charge correlations on the Fe sites [17]. Deeper considerations on the intrinsic features of short-range order above TV are prevented by sample dependent effects.
The important role of lattice vibrations in the mechanism of the Verwey transition was experimentally confirmed by different techniques. Phonon anomalies at TV were measured for hard modes by means of spontaneous Raman scattering [22, 23]. X-ray nuclear inelastic scattering studies indicated possible hardening of the low-energy modes at TV [5, 24]. Ultrasonic measurements and Brillouin scattering evidenced progressive softening of the shear sound velocity associated with the c44 elastic constant from room temperature to TV [18, 19]. However, further experiments to directly determine the energy and momentum transfer of low-energy phonons in the critical region and thus gain a complete picture were so far limited by crystal microtwinning below TV. In the following, we report an inelastic neutron scattering (INS) study of the lattice dynamics of magnetite across TV. We benefit from an effective detwinning procedure to investigate the vibrational structure on both  and
and  sides of the Verwey transition. Focus is placed on possible structural anomalies of the low-energy phonons, in particular, the dispersion of the transverse-acoustic (TA) branches and the modes regarded to as crucial for the electron–phonon interaction.
2. Methods
A natural single crystal of magnetite of ∼1.7 g mass was purchased from Surface Preparation Laboratory, Zaandam, Netherlands. Based on resistance characterization, our sample exhibits a first-order transition at a Verwey temperature  K (see figure 1(a)). INS measurements were performed at the thermal triple-axis neutron spectrometer EIGER, located at the Swiss Spallation Neutron Source (SINQ), Paul Scherrer Institute (PSI), Switzerland [25].
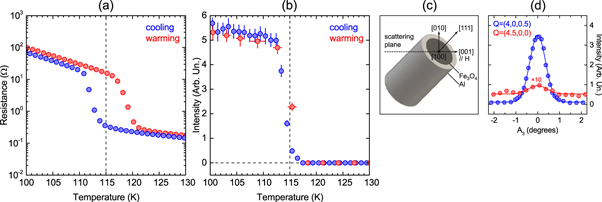
Figure 1. Temperature dependence of the resistance of our sample (a) and the integrated area of the  reflection (b) measured on increasing and decreasing the temperature across the Verwey transition. The heating (cooling) rates were 42 (−42) mK s−1 for the resistance measurements and 14 (−2) mK s−1 for the diffraction measurements. A vertical dashed line denotes TV. (c) Schematic representation of the experimental geometry for detwinning our magnetite sample through cylindrical compression and field cooling. (d) Intensity profiles of the half-integer reflections arising from the doubling of the unit cell along the [100] and [001] directions below TV as a function of the orientation angle of the sample, A3. Data and Gaussian fits are plotted with respectively circles and continuous lines.
Download figure:
Standard image High-resolution imageTo prevent crystal microtwinning in the monoclinic phase, the crystal was shaped into a [111]-oriented cylinder and inserted into an aluminum ring. As aluminum contracts more than magnetite upon cooling, it generates a biaxial compression perpendicular to the [111] direction. Combined with cooling in a 1.1 T field along the [001] direction, this favors in energy one specific structural domain [26]. Figure 1(c) displays our experimental geometry. The crystal was aligned with the [100] and [001] directions in the horizontal scattering plane, and installed into a horizontal-field cryomagnet.
Hereafter, for simplicity, the reflections will be indexed according to the cubic scheme, Q =  (where a = 8.3631 Å is the lattice parameter), in spite of the monoclinic symmetry below TV. The critical temperature for the structural transition was determined by measuring the elastic intensity at
  , which is a structural OP associated with the doubling of the unit cell in the [001] direction (see figure 1(b)). The metastability limits of the cubic and monoclinic phases were found at respectively 113 K and 117 K. Figure 1(d) illustrates the experimental verification of the effectiveness of our detwinning procedure. Namely, the elastic intensities at
  and
and  below TV were compared to rule out any meaningful contribution from twin domains with c axis perpendicular to the field direction, under the assumption of equivalent [100] and [010] directions (being an out-of-plane reflection,
  was not accessed).
Inelastic scans were performed in constant-Q mode, around the (4, 0, 0) and (0, 0, 4) Brillouin zone centers. The final neutron wave-vector was fixed at kf = 2.662 Å−1. The intensity at the detector was normalized against the flux on a low efficiency monitor before the sample. TA phonons were measured along the [001] direction near TV and at our 2 K base temperature. The TA dispersion was also measured along the [100] direction at 2 K. Measurements of the temperature dependences of the lowest energy TA- and transverse-optical (TO)-X3 modes were performed across TV, respectively at the
  and
and  momentum points.
3. Results
Figure 2(a) exemplifies a complete set of our INS data. The dominant contribution from magnetic scattering visible at low wave-vectors prevented us from measuring any phonon peak at momentum points closer than 0.3 reciprocal lattice units (r.l.u.) to the zone center. To estimate accurate phonon energies and widths, constant-Q spectra were fit by functions comprised of multiple Gaussian peaks, after subtraction of a linear background contribution.
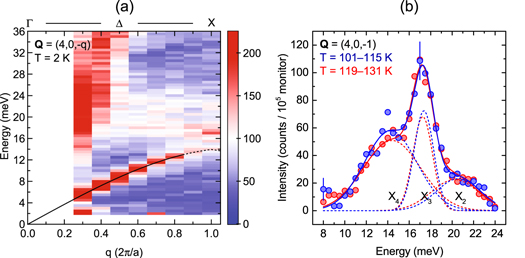
Figure 2. (a) Color-coded map of scattered intensity along the [001] direction around the  reflection at our 2 K base temperature. Our fit to the dispersion curve of the TA phonons is plotted with a continuous line. Extrapolations are represented by a dashed line. (b) INS spectra at the X-point below (101–115 K) and above TV (119–131 K). Error bars are displayed only for representative points. Total fit curves are represented by solid lines, for data in the high- (red) and low-temperature phase (blue). Single Gaussian peaks are plotted with dashed lines and labeled according to the symmetry assignment of [11].
Download figure:
Standard image High-resolution imageFirst, we address the lattice vibrational effects across TV at the zone boundary along the [001] direction, denoted as the X-point. The energy range below 24 meV contains the X3 mode which belongs to the lowest lying TO branch. Recently, the X3 mode was proposed as a primary OP of the structural modifications and suggested to play a leading role in the metal-insulator transition [10, 11]. According to the same models, in presence of strong on-site interactions, atomic displacements of X3 symmetry are interrelated with orbital order and a small charge disproportionation similar to the Verwey model, which suffice to determine the change of state from conductive to insulating.
Supplementary figure 1 (available online at stacks.iop.org/NJP/19/103013/mmedia) illustrates the temperature dependence of the energy and width of the X3 mode. To improve statistics, the data at the X-point were averaged in two different temperature regions above and below the transition temperature. Figure 2(b) and table 1 summarize the comparison between the resulting spectra.
Table 1.
Values of parameters from fits to the data at the X-point (X4, X3 and X2 modes) and the Δ-point ( mode), respectively.
| Below TV (101–115 K) | Above TV (119–131 K) | |||
|---|---|---|---|---|
| Mode | Energy/meV | FWHM/meV | Energy/meV | FWHM/meV |
| X4 | 14.3 ± 0.9 | 5.6 ± 1.6 | 14.4 ± 1.3 | 6.3 ± 2.0 |
| X3 | 17.4 ± 0.2 | 2.1 ± 0.6 | 17.3 ± 0.2 | 2.1 ± 0.6 |
| X2 | 20.6 ± 1.8 | 4.8 ± 3.9 | 20.3 ± 2.5 | 5.1 ± 4.3 |

|
8.6 ± 0.1 | 2.0 ± 0.1 | 8.3 ± 0.1 | 2.4 ± 0.1 |
Our data elucidate that the Verwey transition does not cause any discontinuity in the characteristics of the lattice vibrations of X3 symmetry. Namely, neither the width nor the energy of the X3 mode changes between 101 K and 131 K within respectively 0.2 meV and 0.6 meV uncertainty. Therefore, we rule out possible softening of the X3 mode. The width of the X3 mode remains close to the 1.9 meV resolution limit all across the critical region, at odds with recent observations of anharmonic behavior for different modes from 293 K to TV [12]. More remarkably, the absence of any width or energy anomaly of the X3 mode contrasts with recent first-principle calculations, which predicted intimate connection between structural distortions of X3 symmetry and the electronic structure, and a consequent leading role of the X3 mode in the promotion of order [10, 11].
The lowest energy peak in figure 2(b) is identified as the TA-X4 mode. Our data corroborate previous observations of anomalous width for the X4 mode above TV [12]. In addition, we studied the evolution of the characteristics of the X4 mode on crossing the Verwey transition. We found that the atypical broadening of the X4 mode persists also below TV. The highest energy peak in figure 2(b) is instead assigned to the second TO mode at the X-point, labeled as X2. Considerations analogous to the above for the X4 mode hold true for the X2 mode. However, note that the quantitative reliability of any conclusion for the X2 mode is questioned by its poor contrast against the background, with absence of a well-defined peak.
Next, as illustrated in figure 3, we measured the structural dynamics across the critical temperature at the  momentum point, in the energy range of the TA-
 mode. Following the earliest lattice dynamical studies of the Verwey transition, the
  mode was regarded to as the prime candidate for softening, responsible for the lattice instability [27]. More recently, the
  mode was proposed as a primary OP of the structural transition [10, 11]. In the ordered state, structural distortions of
  symmetry strongly couple with the phase modulation of the excess electrons on the B-type Fe sites with the same periodicity [7].
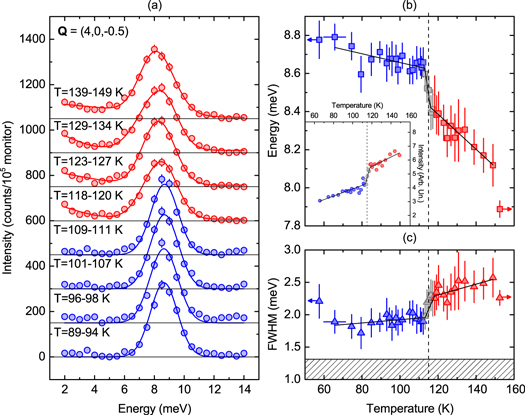
Figure 3. (a) INS spectra averaged over different temperature ranges across TV. Data are offset by 150 counts/105 monitor for clarity. Constant levels of background intensity are subtracted and horizontal lines are drawn to accentuate the possible onset of critical scattering above TV. Fitting functions comprised of symmetric and asymmetric Gaussian peaks are plotted with continuous lines. Energy (b) and width (c) of the  mode as a function of temperature across the Verwey transition. Left and right horizontal arrows are associated with datapoints at 2 K and 293 K, respectively. The hatched area represents the resolution limit. Inset: integrated area of linear background in the same temperature range, between 2 meV and 14 meV energy loss. Continuous lines are a piecewise linear fit to the data, where the fit parameters are the slope and the temperature limits for the high- and low-temperature phase. A vertical dashed line denotes TV.
Download figure:
Standard image High-resolution imageFigure 3(a) displays energy loss spectra taken at the  momentum point, averaged in different temperature ranges above and below the transition temperature to improve the signal-to-noise ratio. To emphasize the possible contribution of diffuse scattering to the intensity at low energy above TV, the incoherent background estimated from the data at 110 K was subtracted from all the spectra.
Figures 3(b) and (c) show the dependence on temperature of the energy and width of the  mode across TV. Table 1 summarizes the average values of the mode parameters near the transition temperature in the two different phases. In contrast to the X3 mode, a sudden energy renormalization of the
  mode takes place in the critical region, concomitant to an abrupt decrease of its width. Our data do not contain any evidence of softening of the
  mode. Conversely, as the temperature is lowered from 150 K to TV, the
  mode hardens at a pronounced rate,
  meV K−1, which appears anomalous when compared to the four times smaller rate below TV. The difference in mode energy between 150 K and 293 K further suggests that the slope of the energy change increases considerably below 150 K. In contrast, the mode width slightly decreases from 150 K to TV. The smaller width of the
  mode at 293 K compared to 150 K is consistent with previous observations of atypical broadening with lowering temperature starting from 293 K [12].
Between 2 meV and 14 meV energy loss, background intensity builds up on warming, with a step-like change at TV (see inset in figure 3(b)). As evident in figure 3(a), a minor distortion of the lineshape also develops discontinuously across TV. The increase of scattered intensity at energies intermediate between the central peak and the phonon sideband, and the onset of lineshape asymmetry are both possible signatures for the critical dynamics of lattice vibrations coupled with fluctuations of the charge density [28].
Finally, we studied the dispersion curves of the TA modes at 2 K, in the [001] and [100] directions, which cease to be equivalent in the monoclinic phase, and the effect of the Verwey transition on the TA mode energies and widths. Figure 4 illustrates our data and cumulative fitting functions at 2 K. Figures 5(a) and (b) display the dispersion curves of the TA modes in the [001] and [100] directions at 2 K, and in the [001] direction at different temperatures, respectively. The largest mode width is found at the X-point. A relative maximum in mode width occurs at the incommensurate wave-vectors qz = 0.6–0.7 r.l.u. Widths close to the resolution limit are restored below TV at the incommensurate points, in contrast to the persistence of abnormal width for the X4 mode. Remarkably, the onset of the Verwey transition is accompanied by an overall hardening of the TA modes. As noticeable in figure 5(a), we also found that below TV the dispersion curve of the TA modes along the [100] direction is slightly harder compared to the [001] direction.
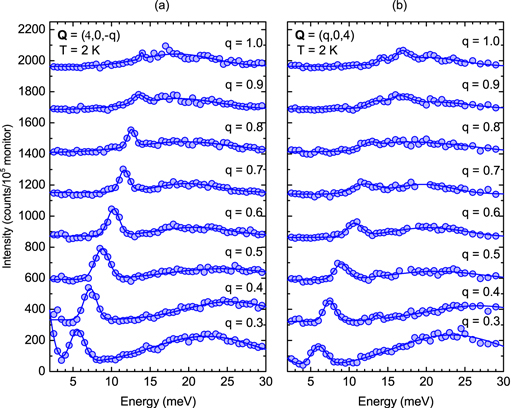
Figure 4. INS spectra along the [001] (a) and [100] direction (b) at 2 K around respectively the  and
and  Brillouin zone centers. Data are offset by 275 counts/105 monitor for clarity. Multiple Gaussian peaks are fitted to the data and plotted with blue lines.
Download figure:
Standard image High-resolution image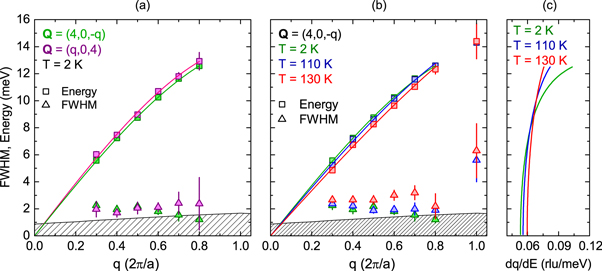
Figure 5. (a) TA phonon energy (squares) and FWHM (triangles) as a function of reduced wave-vector along the [001] and [100] direction at 2 K. (b) Energy (squares) and FWHM dispersion (triangles) of the TA phonons along the [001] direction above (130 K) and below TV (110 K) and at 2 K. Third-order polynomial fits to the data are plotted with lines. The hatched areas represent the resolution limit. To improve statistics, the averaged data displayed in figure 2(b) were accounted for in the analysis at close temperatures of 110 K and 130 K. (c) Contributions of the measured TA phonons to the reduced vibrational density of states,  , in the low-energy region, as calculated from the fits to the data in panel b.
Download figure:
Standard image High-resolution image
4. Discussion and conclusions
X-ray nuclear inelastic scattering measurements found an abrupt modification of the vibrational density of states for  meV at TV, suggestive of lattice stiffening accompanying the onset of charge order [5, 24]. Definite conclusions were prevented by the uncertainty associated with the subtraction of the elastic peak. Here, we provide decisive evidence to the above effect, clearly visible in figure 5(b) as a sudden hardening by 0.3–0.6 meV of the TA modes at TV. To demonstrate qualitative agreement with [5] and [24], in figure 5(c) we plotted the inverse slope of our dispersion curves, dq/dE, proportional to the contribution of the TA modes to the vibrational spectrum normalized to the squared energy,
  , under the simplifying assumption of isotropy. It is also interesting to note that, at the base temperature, the dispersion of the TA modes with polarization along [001] is slightly harder than for displacement vector aligned to [100] (see figures 4(a), (b) and 5(a)). Therefore, consistent to naive symmetry considerations, the isotropic phonon dispersion along
  in the cubic structure is lost below the phase transformation temperature. However, the sign of the energy difference provides non-trivial information on the physical effect responsible for the symmetry breaking. In particular, the observed behavior is also relevant to charge order, which involves a small but non-negligible modulation of the average charge density in the planes of atoms along [001], and thus larger force constants between them, compared to the perpendicular directions.
In the Verwey transition, charge ordering and atomic displacements constitute distinct OP, with different dynamics. Since the transformation is not strongly first order, but close to continuous, the primary OP is expected to present enhanced susceptibility, associated with softening of the corresponding mode. However, if such mode consists of a diffusive charge degree of freedom with correlation time scale longer than the lattice vibration periods, the dynamics of the electronic and structural modes become decoupled and thus phonon softening does not occur. Note that the above scenario does not imply that the two modes themselves are decoupled. Simply, in the presence of linear coupling between the two modes, but decoupled dynamics, the change of the primary OP from zero to finite value causes a discontinuous displacement of the equilibrium positions of the ions, yet without any direct modification of the phonon frequency. Clearly, additional anharmonic effects, such as a cubic term in the interionic potential, can determine a renormalization of the phonon frequency, but only as an indirect consequence of the change in the equilibrium positions of the ions.
Without any assumption on the dynamics, the most legitimate candidates for phonon softening in magnetite are the modes proposed as OP of the structural transition, yet with particular reference to the approximate symmetry  for the low-temperature phase [10, 11]. In particular, the modes of X3 and
  symmetry were suggested as primary OP, and among the structural distortions regarded to as secondary OP, the X1 mode is also associated with important atomic displacements. As summarized by our data in supplementary figure 1, and figures 2(b) and 3(b), near the transition temperature neither of the lowest lying modes of X3 and
  symmetry softens, and the TA branch does not present any Kohn anomaly along [001] at wave-vectors
  r.l.u. In contrast, the
  mode hardens significantly in the pre-transition region.
The most natural explanation for the absence of phonon softening in our observations is that the high-temperature phase is unstable against slow diffusive critical modes of electronic rather than structural nature. As discussed above, this does not rule out strong linear coupling of the latter modes to the lattice vibrations, but only the mutual dependence of their dynamics. Furthermore, the absence of anomalies of the X3 mode is not in contradiction with the observation of diffuse scattering with the same symmetry [15], but a confirmation of the order–disorder nature of the transition. In fact, such absence of phonon anomalies associated with an OP has been observed in other order–disorder transitions where the OP is well identified [29]. Here, the situation is more complex, since multiple modes are involved in the transition. Indeed, the anharmonic effects observed for some phonon modes imply that they cannot be neglected in the description of the transition.
Recent refinements of the crystal structure below TV underline the important displacement amplitude of additional frozen modes at the X- and W-point, namely, the X1, W1 and W2 modes [8, 9]. Strictly speaking, to completely rule out the occurrence of phonon softening, the above modes should also be addressed. As pointed out by the same studies, several frozen modes need to be accounted for to adequately describe the atomic displacements from the parent to the distorted phase. Accordingly, the notion itself of phonon condensation might even lose relevance in the mechanism of the Verwey transition, in favor of a process dominated by local distortions.
The general picture of our results is consistent with the interpretation of the precursor effects of the Verwey transition in terms of critical fluctuations of the charge density coupled to atomic displacements. In the cubic phase, charge fluctuations are associated with local distortions, in the form of dynamical trimeron complexes. Below TV, the trimerons become static and order on the long range. It is well known that in small polarons such as the trimerons there may occur an exponentially large enhancement of the effective mass [30]. This explains why the trimerons can be treated as classical variables and their fluctuations are slow compared to the phonon frequencies. In the cubic phase, the phonon modes coupled with the trimerons cause dynamic local distortions of the FeO6 octahedra, completely analogous to their static counterparts below TV [20]. In other words, the electronic origin of the instability here suggested is not in contrast with the occurrence of dynamic local distortions above TV. The widths of the coupled modes increase, however, they do not soften, since their oscillation periods are shorter than the relaxation time of the charge fluctuation modes. Specifically, in agreement with previous observations [13, 14], in a wide temperature region above TV, the TA modes propagating along [001] are strongly coupled with the critical fluctuations. Broader TA modes and thus larger coupling constants occur at qz = 0.6–0.7 r.l.u. and 1 r.l.u. (see figures 2(b) and 5(b)), corresponding to local maxima of diffuse scattering intensity. Careful examination of the data in figure 5(b) reveals that larger energy changes take place at TV at the same qz = 0.6–0.7 r.l.u. Below TV, mode widths closer to the instrumental resolution are restored at  r.l.u. (see figures 3(a), (c) and 5(b)). This incommensurate-commensurate transition is quite common in charge-ordered systems [31] and can be understood in the following way.
The competition among the characteristics of the critical fluctuations (e.g., trimeron density, temperature and mutual interactions) determines an instability of the electronic degree of freedom at intrinsic wave-vectors independent of the underlying lattice periodicity. In the pre-transition region, far enough from the transition temperature, the amplitude of the critical fluctuations is small. As a result, the inherently incommensurate modulation of the charge density prevails over the effects of the commensurate lattice potential. These comprise coupling terms of third order between structural and electronic OP. In the regime of robust electronic OP below TV, the energy gain associated with the latter terms locks in a commensurate modulation of the charge density. In such ordered state, the electron-phonon interactions at incommensurate wave-vectors lose importance, consistent with our observations of discontinuous narrowing of the TA modes at  r.l.u. A simple analogy to the above mechanism is the condensation of a two-dimensional fluid on a crystal substrate. In the liquid phase, the structure factor of the overlayer consists of broad peaks centered at incommensurate wave-vectors which reflect local dynamical correlations inherent to the characteristics of the overlayer itself. Below the freezing point, the peaks become narrower and shift to positions commensurate to the underlying lattice due to substrate-overlayer interactions [32].
The behavior of the TA-X4 mode at qz = 1 r.l.u. is more puzzling. Contrary to the TA modes at incommensurate wave-vectors, it remains anomalously broad below TV (see figures 2(b) and 5(b)). If on one hand the persistence of anharmonic interactions at commensurate wave-vectors below TV is not surprising, on the other hand anomalously large width is observed also at high temperature [12], which is suggestive of an intrinsic characteristic of the X4 mode, independent of the Verwey transition.
In summary, in our INS study, discontinuous changes of the TA modes were observed across the critical temperature for the Verwey transition in magnetite. The frequency renormalization of the lattice vibrations was interpreted in terms of incipient charge order. Step-like modifications of the phonon widths provide evidence to the abrupt suppression of the incommensurate correlations of the charge fluctuations which anticipate the phase transformation above TV. Overall, our observations illustrate the distinct roles which commensurate and incommensurate interactions play in the mechanism of the Verwey transition. The absence of softening for the phonon modes coupled to the charge fluctuations points to a decoupling of the dynamics of the modes of electronic and structural type. Namely, the charge degree of freedom fluctuates on long time scales compared to the lattice vibrations. This is at the opposite limit with respect to the adiabatic approximation valid for wide-band solids and is indicative of a strongly correlated system with significant electron–phonon coupling. It is natural to associate the above degree of freedom characterized by slow dynamics with the fluctuating trimerons.
Acknowledgments
We acknowledge A M Oleś (Marian Smoluchowski Institute of Physics, Jagiellonian University, Kraków) and P Piekarz (Institute of Nuclear Physics, Polish Academy of Sciences, Kraków) for useful discussions, and D Rubin (Soreq Nuclear Research Center, Yavne) for the design of the sample holder. LUMES acknowledges financial support by the NCCR MUST of the Swiss National Science Foundation. HMR acknowledges financial support by the Swiss National Science Foundation and its Sinergia network Mott Physics Beyond the Heisenberg model (MPBH). J L acknowledges financial support by Italian MIUR under projects FIRB-HybridNanoDev-RBFR1236VV, PRIN-RIDEIRON-2012X3YFZ2, Premiali-2012 AB-NANOTECH, and Italian MAECI under collaborative projects SUPERTOP-PGR04879 and AR17MO7.