Article

Integrating Global Satellite-Derived Data Products as a Pre-Analysis for Hydrological Modelling Studies: A Case Study for the Red River Basin

1
Faculty of Civil Engineering and Geosciences, Department of Water Management, Delft University of Technology, Stevinweg 1, Delft 2628 CN, The Netherlands
2
FutureWater, Costerweg 1V, Wageningen 6702 AA, The Netherlands
3
UNESCO-IHE, Westvest 7, Delft 2611 AX, The Netherlands
4
Faculty of Hydrology and Water Resources, Thuy Loi University, 175 Tay Son, Dong Da, Ha Noi, Vietnam
5
Earth System Science Interdisciplinary Center, University of Maryland, College Park, MD 20742, USA
6
Hydrology and Remote Sensing Labaratory, USDA-ARS, Beltsville, MD 20705, USA
7
USGS EROS Center, North Central Climate Science Center, Colorado State University, Fort Collins, CO 80523, USA
*
Author to whom correspondence should be addressed.
Remote Sens. 2016, 8(4), 279; https://doi.org/10.3390/rs8040279
Submission received: 14 January 2016 / Revised: 14 March 2016 / Accepted: 21 March 2016 / Published: 28 March 2016

Abstract

:
With changes in weather patterns and intensifying anthropogenic water use, there is an increasing need for spatio-temporal information on water fluxes and stocks in river basins. The assortment of satellite-derived open-access information sources on rainfall (P) and land use/land cover (LULC) is currently being expanded with the application of actual evapotranspiration (ETact) algorithms on the global scale. We demonstrate how global remotely sensed P and ETact datasets can be merged to examine hydrological processes such as storage changes and streamflow prior to applying a numerical simulation model. The study area is the Red River Basin in China in Vietnam, a generally challenging basin for remotely sensed information due to frequent cloud cover. Over this region, several satellite-based P and ETact products are compared, and performance is evaluated using rain gauge records and longer-term averaged streamflow. A method is presented for fusing multiple satellite-derived ETact estimates to generate an ensemble product that may be less susceptible, on a global basis, to errors in individual modeling approaches. Subsequently, monthly satellite-derived rainfall and ETact are combined to assess the water balance for individual subcatchments and types of land use, defined using a global land use classification improved based on auxiliary satellite data. It was found that a combination of TRMM rainfall and the ensemble ETact product is consistent with streamflow records in both space and time. It is concluded that monthly storage changes, multi-annual streamflow and water yield per LULC type in the Red River Basin can be successfully assessed based on currently available global satellite-derived products.

Graphical Abstract

1. Introduction

Global surface and ground water resources are under increasing pressure from human water use and climate change [1,2,3]. Well-informed decision-making on water management is essential for coping with tensions between water availability and water demand. This requires a feasible methodology for quantifying the current state of water resources in terms of hydrological flows and connectivity, as well as indicators of water use and reuse [4]. Once reasonable estimates of these quantities have been established, simulation models can be used to examine the predicted consequences of different scenarios related to policy adjustments, climate change, land use modifications, etc. (e.g., [5]).
The fundamental components of the water balance that need to be quantified include precipitated water, consumed water, water withdrawals, and non-consumed water with varying definitions and sub-classifications to be found in widely used water assessment frameworks such as Water Footprint [6], Water Accounting Plus (WA+) [7], and System of Environmental-Economic Accounts for Water (SEEA-Water) [8], among others. Relating precipitation and/or withdrawals to consumptive use through evapotranspiration provides a basis for an assessment of weekly or monthly surplus (i.e., groundwater recharge, drainage, surface runoff dynamics) or deficit (i.e., irrigation, inundation, return flows and their reuse). The role of soil water storage changes is essential at smaller time scales and should get sufficient attention [9].
Satellite-derived datasets have been increasingly put to use in the field of water resources management at a range of different spatio-temporal scales. They provide valuable information in poorly gauged or inhospitable areas and transcend political borders. By now, methodologies for deriving precipitation (P) and actual evapotranspiration (ETact) from remotely sensed data are well-established [10,11,12]. For purposes of water accounting, identification of management options and relating water consumption to services and benefits, it is desirable to relate the quantified flows to types of land use and land cover (LULC) within a river basin or, ideally, to individual water users. This facilitates a description of water users in a river basin in terms of their dependency on water from different sources, as well as the extent to which they “produce” water for potential downstream reuse [4].
A number of global-scale satellite-derived data products (GSDPs) for P, ETact and LULC are available. Many of these are already in the public domain or soon to be released, which makes them a valuable and easily accessible resource for water management researchers, consultants and policy makers. Scientific literature provides a substantial body of review work on these products and their fundamental algorithms. Open-access rainfall GSDPs are extensively evaluated in scientific literature for a variety of geographical areas across the globe, e.g., [13,14,15,16,17,18]. Existing GSDPs on LULC and their validation are discussed for example by Mora et al. [19] and Tsendbazar et al. [20]. Conversely, global-scale ETact products based on remote sensing are relatively new. A wealth of literature on satellite-based techniques for quantifying ETact is available [21] and the basic algorithms are well-documented [22,23,24,25,26]. Many institutions are now taking the next step by developing and distributing operational evapotranspiration products for the globe at spatial resolutions of ≤5 km. ETact GSDPs provide independent datasets for calibrating hydrological models and land surface models. Comparative analyses of ETact models applied on the continental to global scales have recently come available and typically compare two individual satellite-derived ETact products for specific regions [27,28,29,30,31], some also including ETact outputs from global hydrological models and land surface models [32]. Comprehensive evaluations of a larger number of satellite-derived ETact estimates, in the style of the many P assessments that are available, have so far only sparsely been conducted [33,34]. This is related to the limited availability of these products in the public domain up to now, which is currently changing rapidly.
Some recent papers have focused on integrating rainfall, ETact and LULC GSDPs and their combined potential for assessments of water resources. Bastiaanssen et al. [35] successfully computed the annual water balance of the Nile basin, including net withdrawals. Wang-Erlandsson et al. [36] demonstrated how global P and ETact time series can be used to compute the storage capacity of the root zone. The integrated use of satellite-derived P and ETact is a reality check on a pixel-by-pixel basis and an opportunity to check data quality that goes beyond the comparison with individual rain gauges or eddy covariance towers, which both cover very limited areas. If quality is found to be satisfactory, such data can be integrated in hydrological modeling procedures on the regional and global scale. In addition, Hain et al. [37] demonstrated how ETact retrieved from energy balance can be combined with an inferred local water balance to diagnose ancillary sources and sinks of moisture across landscapes, e.g., due to intensive irrigation or agricultural drainage, or access to shallow water tables.
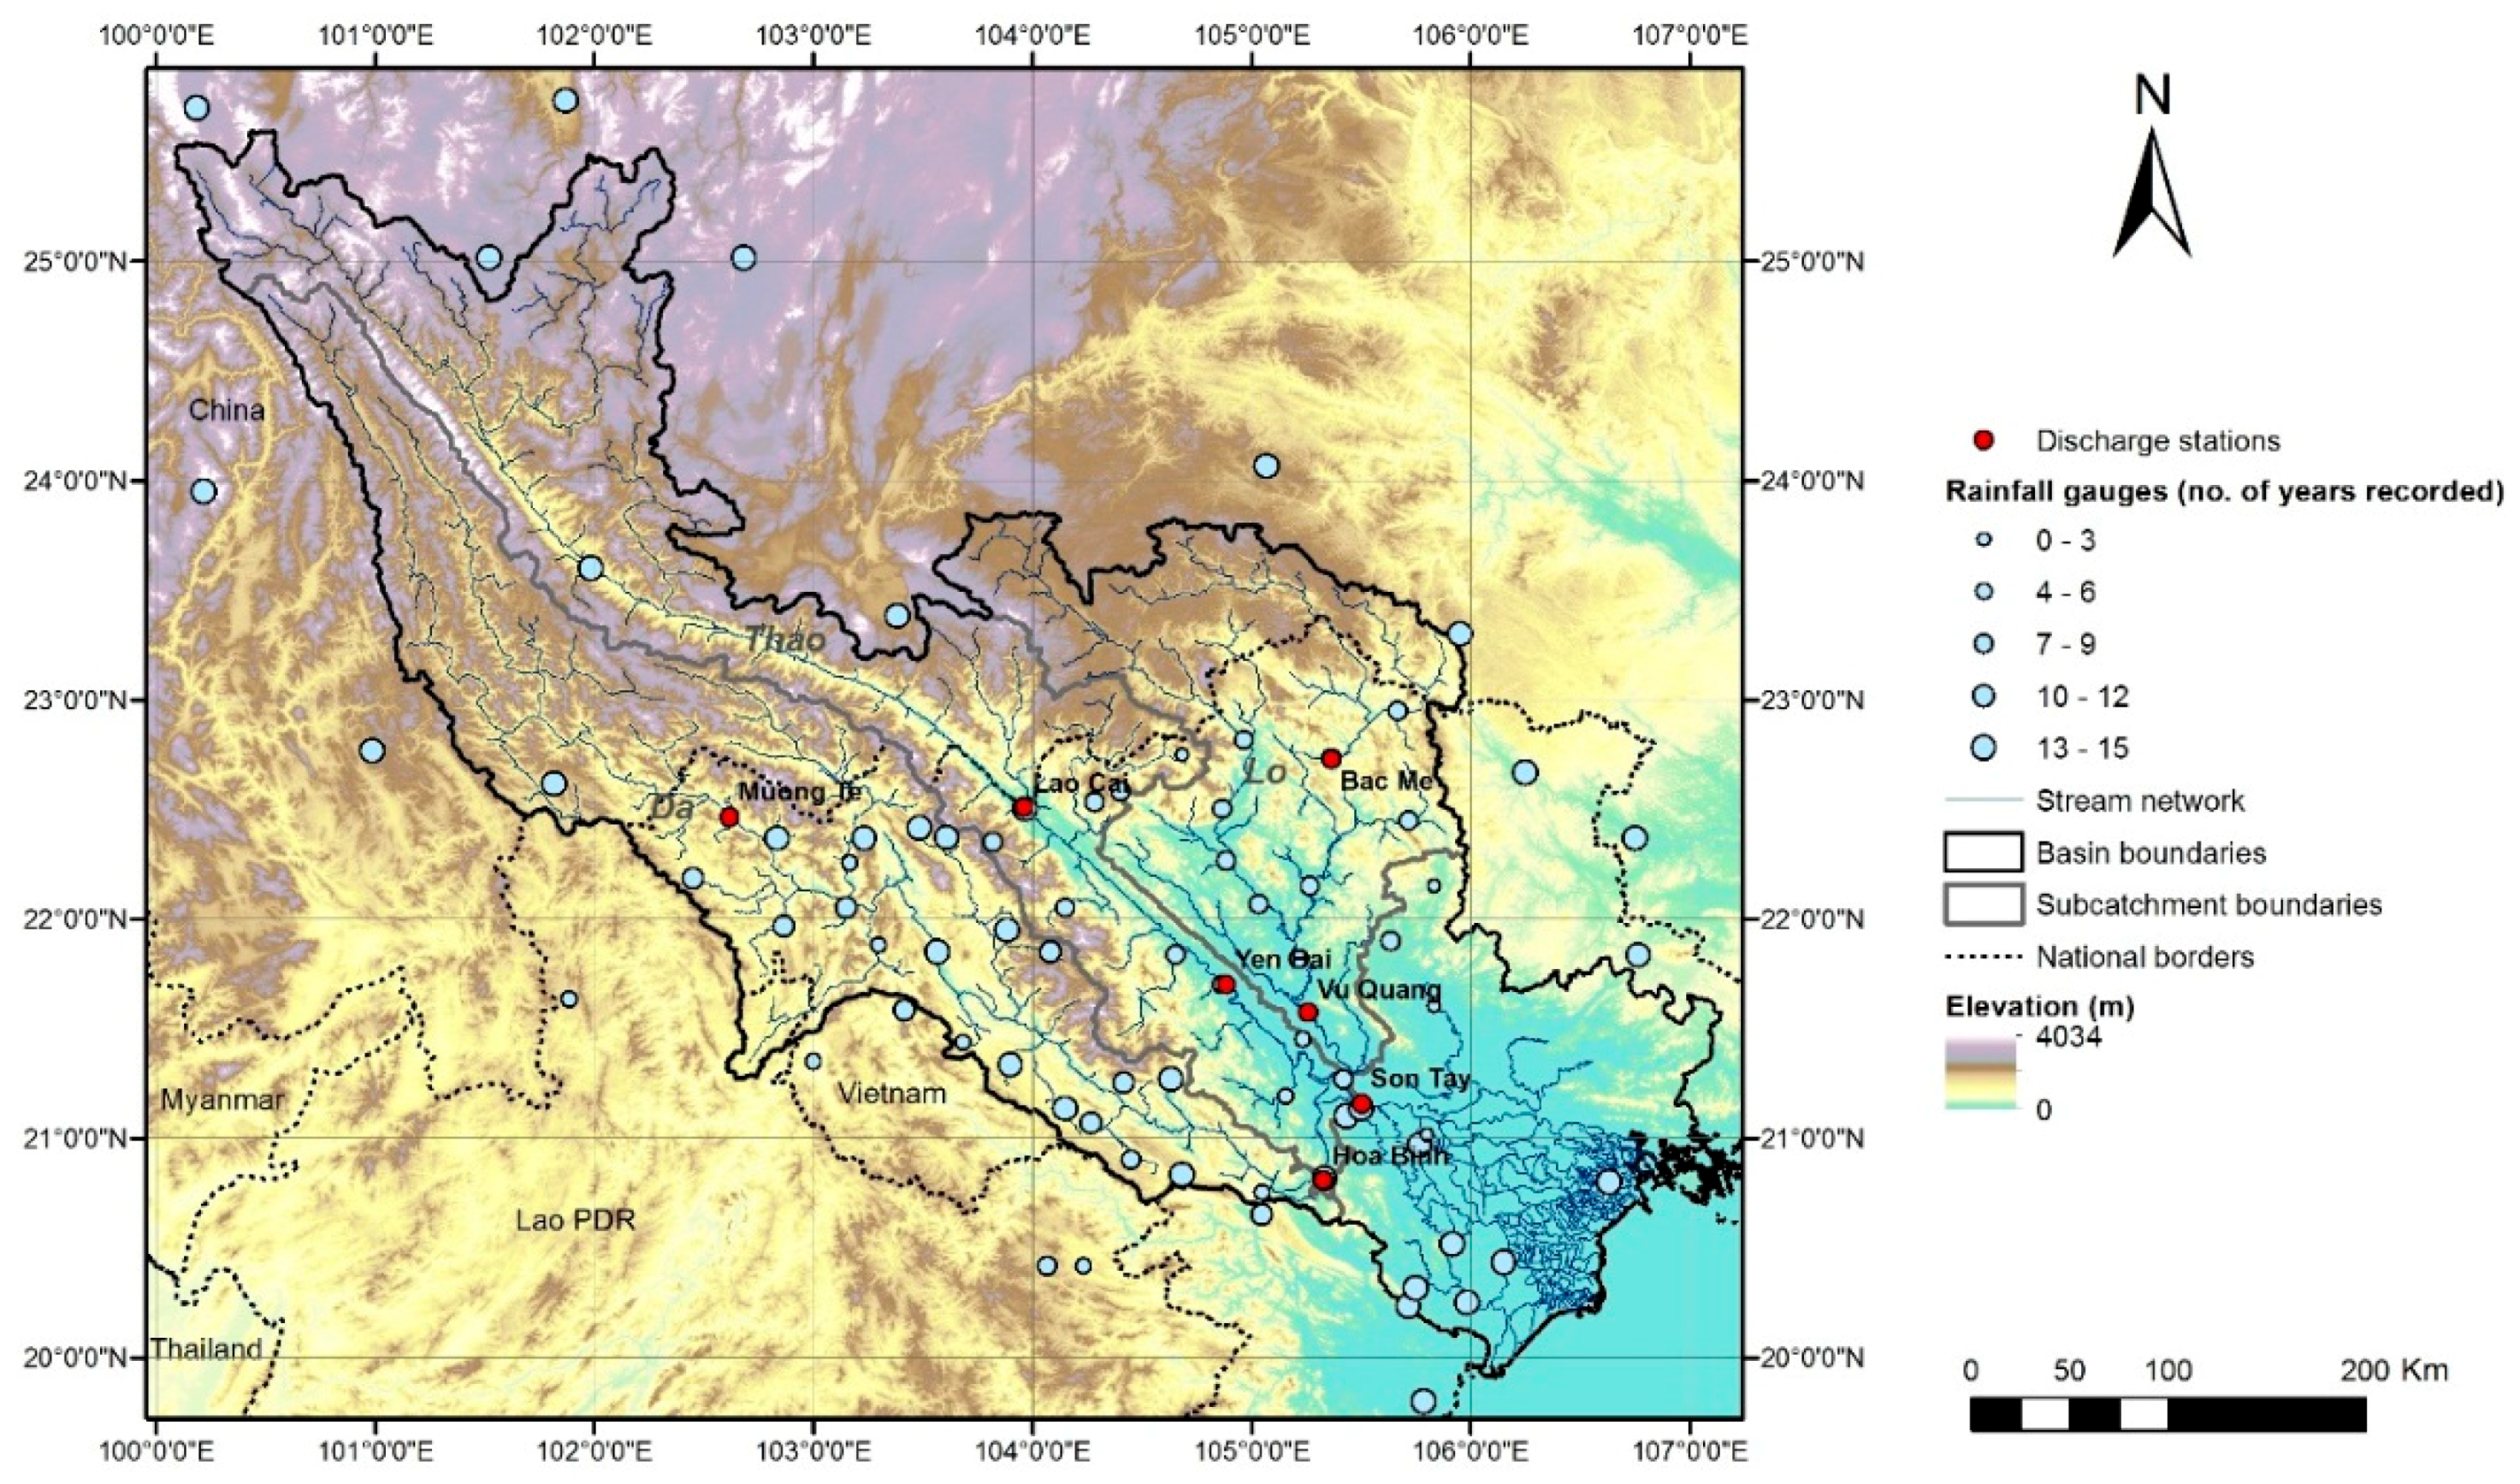
In this paper, we aim to: (1) demonstrate how integrating satellite-derived P, ETact and LULC maps constitutes an important pre-analysis in the first stages of hydrological modeling; (2) show that consistency between hydrological variables is a way to evaluate and compare individual earth observation products, with a focus on five new global ETact products; and (3) evaluate the suitability of global satellite-derived data products for assessing water resources in a basin with challenging conditions for remote sensing. We present our case in the context of the transboundary Red River Basin in Southeast Asia, traditionally a problematic region for remote sensing because of weather patterns, but also a basin with pressing water management issues where limited international data sharing hampers a comprehensive understanding of basin water use and hydrology.

2. Materials and Methods

2.1. Study Area

The Red River Basin (Figure 1) can be roughly divided in an upstream half situated in the province of Yunnan in southern China and a downstream half in northern Vietnam, with a minor portion of less than 1% located in Lao PDR. Its total surface area is approximately 164,000 km2. The Red River has two main tributaries: Da River (Lixian in Chinese) and Lo River (Panlong). The upstream part of the basin is largely forested, mountainous and sparsely populated. The delta of the Red River, downstream of the confluence of the three major branches, is a densely populated area of great importance to Vietnam for its agricultural productivity and economic activity.
Annual rainfall varies substantially across the Red River Basin, with values between 700 and 3000 mm found based on long-term station time series [38,39], while even local annual averages of over 4000 mm/year are reported [40]. Approximately 80% of this rainfall occurs in the months May to October, which comprise the wet season for both the Vietnamese and the Chinese portion of the basin [41]. The resulting variability of river discharge in space and time, as well as population growth, lead to substantial challenges related to flood control and water stress, particularly in Vietnamese territories [42]. Water management options across the basin have increased with the construction of five large multi-purpose reservoirs in the Vietnamese Da River and tributaries of the Lo River, as well as manifold smaller hydropower dams in both China and Vietnam. However, this has also increased the need for spatiotemporal data on water availability to support reservoir management [43].
At the tail end of the basin, the Red River Delta has seen many centuries of human water management, from the construction of hydraulic works for protection from floodwaters to the support of irrigation by avoiding inflow of brackish water and enhancing land drainage, making use of tidal influences if possible. Three zones can be distinguished: the lowlands, midlands, and highlands, based on their elevation relative to the water table [44]. The spatial distribution of water resources across the Delta is unequal, with some areas approaching the minimum level of water availability required to “sustain life and agricultural production” [45]. Most of the surface area of the Delta is characterized by rice paddies for a major part of the year. Typically, two rice seasons are observed, an irrigation-dependent spring season and a rainfall-dependent summer season [46]. If irrigation water availability allows, farmers grow a third “dry” crop such as vegetables or maize during the October–February period, particularly in the highlands and midlands. Reuse of drainage water within irrigation schemes is substantial [47]. Still, non-consumed irrigation water is one of the main sources of aquifer recharge, and thus of industrial and domestic water supply [48]. The outflow from the complex stream network of the Red River Delta into the Gulf of Tonkin occurs through nine different outlets [49].

2.2. Land Use/Land Cover

The current application requires an accurate and recent LULC map covering northern Vietnam/southern China with a sufficient level of spatial detail, validity for a year within the past 10–15 years and distinguishing between classes relevant for the nature of water use, including a class for irrigated cropland. An overview of existing global LULC maps is provided by Mora et al. [19], with spatial resolutions ranging from mid-resolution (300–500 m) to lower resolution (≥1 km) products. In addition, the first high-resolution Landsat-based global LULC products are now also available [50,51]. The number of classes of the available LULC maps varies from 9 to 37, and years of coverage from 1992 to 2012. Based on the criteria mentioned above, in particular Globcover 2009 [52] and GLCNMO2008 [53] were identified as potentially suitable inputs to this study.
Accuracies of global LULC products were previously found to be in the range of 69%–87% [12]. Ongoing initiatives such as the Global Observation for Forest Cover and Land Dynamics (GOFC/GOLD) of ESA seek to enhance the quality of global LULC products. In the meantime, auxiliary satellite images from the public domain are helpful to enhance LULC maps for a specific region. We adopted an approach of deriving an optimized LULC map for the Red River Basin derived from a combination of existing LULC GSDPs and time series of freely available MODerate resolution Imaging Spectroradiometer (MODIS) satellite images [54] a proven methodology for improving the accuracy of LULC maps [55,56]. Regional-scale improvement of global land cover products, incorporating auxiliary data and a priori knowledge, leads to more accurate and actionable water accounting information.
The 300 m Globcover 2009 map was taken as the basis for the new LULC map. Although the spatial distribution of forested and shrubland classes seems in accordance with expert knowledge, the original Globcover 2009 product largely contains rainfed cropland pixels for the Red River Delta. This is erroneous when viewed against the abundant presence of irrigation infrastructure. However, there is a blurred line between rainfed and irrigated agriculture in the region, as the wet-season is likely rainfed in both classes, with water coming from rainfall or recession of seasonal floods [57]. The main distinctive feature between locations with a single, exclusively rainfed crop and multi-cropped areas with at least one irrigated cycle is therefore the occurrence of a winter and/or spring crop [58].
According to the Globcover 2009 validation report [59], irrigated pixels are regularly misclassified as other agricultural classes. Therefore, to correct the Globcover 2009 agricultural classes, first all cells containing >50% cropland were merged into a single cropland class. MODIS Normalized Difference Vegetation Index (NDVI) values within the merged cropland class during the spring season were decisive in distinguishing irrigated from rainfed agriculture. Pixels covered by clouds, as indicated by the MODIS pixel reliability layer, were omitted from this analysis. No gapfilling of individual images was performed, in order to only include pixels directly sensed by MODIS with sufficient quality. An average NDVI of at least 0.55 in the months March to May was used as a criterion for identifying irrigation, in accordance with the typical Red River Delta spring cropping cycle. A different cropping calendar was identified from NDVI time series analyses for the northern parts of the basin, with a pronounced peak during January. For this reason, a second precondition of a minimum NDVI of at least 0.55 in January was introduced to account for irrigation in the upstream portion of the basin. The underlying assumption is that an NDVI of 0.55 for cropland in the Red River Basin cannot be achieved in January or March–May by relying solely on rainwater.
In addition to the correction of the Globcover 2009 cropland classification, a visual assessment of the original map against high-resolution satellite imagery indicated an underestimation of urban area in the Red River basin. It was observed that the urban land use class of GLCNMO2008 is more realistic and these cells were therefore introduced to represent built-up area in the improved LULC map. As a final step, isolated pixels were filtered out using a GIS focal majority filter.
MODIS NDVI time series of three major classes in the final LULC map are displayed in Figure 2. While some noise is apparent due to the different cloud masks applied to each of the individual images, distinct temporal patterns are clearly identified. The second annual cropping season in the irrigated class is clearly visible when compared to the rainfed cropland. A third, less pronounced peak of irrigated NDVI values can be observed in the winter months. Year-to-year differences of winter and spring crop NDVI are illustrative of varying water availability. As is to be expected, average NDVI of the merged forested class remains relatively stable and high (>0.5) throughout the entire year.
The final, enhanced LULC map is depicted in Figure 3. Visual comparison with the recently released IWMI map of irrigation in Asia [60], retrieved 19 November 2015) shows similar spatial distributions of rainfed and irrigated land. As the Red River Delta has been the main focus area of previous studies, availability of validation data is mainly limited to this area. The modifications to the original Globcover 2009 yield a total irrigated area of 869,029 ha in the 10 provinces that together make up the Red River Delta administrative region. Literature sources report irrigated acreages varying from 670,000 to 850,000 ha, although the exact spatial and temporal scope of these figures is not always specified in these studies [43,45,61,62,63]. These values are all somewhat lower than the acreage found in a recent Advanced Synthetic Aperture Radar (ASAR)-based study, reporting 1,180,000 ha of double-cropped rice for 2007–2011 [58], so some uncertainty persists. Overall, the new LULC map corresponds well with the majority of available information from other sources and suffices for the current purpose.

2.3. Rainfall

A spatially distributed monthly rainfall product is required which covers the Red River Basin for the last 10–15 years. Existing rainfall GSDPs with over 10 years of data in the period 2000 to present and a spatial resolution of ≤0.25 degree were downloaded and evaluated: the Tropical Rainfall Measurement Mission monthly best estimate (TRMM 3B43 v7), the global rainfall estimate based on the CPC MORPHing technique (CMORPH) and the Climate Hazards Group InfraRed Precipitation with Station dataset (CHIRPS v1.8). Since no readily available CMORPH monthly product exists, three-hourly data were aggregated to obtain monthly values. Table 1 presents the main characteristics of the rainfall GSDPs evaluated for the Red River Basin.
In order to select the most accurate rainfall product for the target basin, the performance of each of the GSDPs was assessed by means of ground observations. Daily rainfall station data were purchased from the Vietnamese National Center for Hydro-Meteorological Forecasting (NCHMF) and downloaded from the NOAA Global Summary of the Day (GSOD) database, as distributed by the National Climatic Data Center (NCDC). In total, multiple years of rainfall data for 76 gauges were available for GSDP validation. Figure 1 indicates the location and amount of data available for each station. A full list of all rain gauges can be found in Table A1. Data from 62% of these stations are not provided in the public domain and are therefore particularly suitable for validation, since the TRMM and CHIRPS algorithms incorporate a calibration procedure based on open-access rainfall gauge measurements. Nevertheless, it was decided to also include public GSOD data in this validation exercise as otherwise no validation data from Chinese territories would be available.
Figure 4 shows plots of satellite-derived monthly rainfall data against rain gauge measurements. Of the three evaluated products, the TRMM regression line is closest to the line of 1:1 correspondence, followed by CHIRPS and CMORPH respectively. A few outliers are clearly visible, where high gauged rainfall amounts do not correspond with satellite-derived estimates. These were all recorded at the Bac Quang station. It is unclear if this signifies a problem with the measurement station or the GSDPs. However, as these 10 points make up only a minor portion of the total number of monthly rainfall values evaluated (10,368), their impact on further analyses is negligible.
The error in monthly rainfall estimates for each of the products is further evaluated in Figure 5. With −5.83 mm, CHIRPS has a slightly lower error than TRMM, while the mean error of CMORPH monthly rainfall estimates are furthest from measured values. It is interesting to note that, although the CHIRPS mean error is lower than the TRMM mean error, the standard deviation of the CHIRPS error is higher as a result of the amount of months with large error values. Table 2 lists a number of other commonly used validation statistics. These indicate a favorable performance of TRMM in terms of the relationship between measured and estimated values (r), the relative mean absolute error (RMAE), and the predictive power of the algorithm relative to the gauged mean (Nash–Sutcliffe coefficient).
Based on the findings discussed above, TRMM was identified as the most suitable GSDP for describing monthly rainfall in the Red River basin. This is in line with earlier findings that TRMM is the most favorable option for satellite-derived rainfall on the monthly scale in an area in southern China [67], and a successful application of TRMM precipitation in a modeling study in central Vietnam [68]. Apparently, for the Red River Basin, the higher spatial resolution of the CHIRPS product does not lead to a more accurate assessment of rainfall when compared to the point scale. It should be noted that some of the GSOD stations used for validation may also have been part of the TRMM and CHIRPS algorithms, whereas CMORPH is uncorrected for station values.
It is often decided to perform a bias-correction of rainfall GSDPs based on ground observations. However, special attention should go to the issue of scale when comparing point measurements of rainfall gauges to coarse pixels [69]. Naturally, a 25 km pixel can be quite heterogeneous e.g., in terms of topography, and different rainfall rates may occur over short distances within a grid cell. Vernimmen et al. [70] discuss in detail how the presence of multiple ground stations within a grid cell enhances opportunities for validation. In the Red River Basin, five TRMM pixels were identified containing two rainfall stations (Figure A1). The records of these gauges were averaged per pixel and plotted against TRMM values. This resulted in a slope of the fitted line of 0.97 (Figure A2). This increase relative to 0.93 (Figure 4) indicates that performance of TRMM seems satisfactory in terms of representing intra-pixel variability. Although the sample size is insufficient to draw any definitive conclusions, this brief analysis does not provide a reason for assuming that a point-based bias correction would improve the 25-km TRMM rainfall estimate.

2.4. Actual Evapotranspiration

2.4.1. Available ETact Products

While the network of rain gauges in the Red River Basin is sufficient to arrive at a well-informed choice of an optimal GSDP for precipitation, this is unfortunately not the case for evapotranspiration. No network of ETact measurements is available for the Red River Basin, limiting the foundation for selecting a single ETact GSDP. We therefore take an ensemble approach to defining ETact across the basin, combining information from multiple GSDPs.
In this study, five ETact products were evaluated with a coverage of the Red River Basin at a spatial resolution of ≤5 km with a time series of over 10 years: the MODIS Global Terrestrial Evapotranspiration Product (MOD16, [22]), the Operational Simplified Surface Energy Balance (SSEBop, [23]), the revised Surface Energy Balance System (SEBS, [25]), CSIRO MODIS Reflectance Scaling actual ET (CMRSET, [24]), and the Atmosphere-Land Exchange Inverse (ALEXI) water and energy budget model [71]. Although these products all use MODIS satellite data to some extent, their fundamental modeling strategies are markedly different. SSEBop and SEBS rely on MODIS land surface temperature (LST) data for determination of the latent heat flux. ALEXI uses a similar approach but integrates a range of different spaceborne data sources. CMRSET combines a vegetation index for estimating photosynthetic activity with shortwave infrared reflections to estimate vegetation water content and presence of standing water. MOD16 follows the Penman–Monteith logic and relies on visible and near-infrared data to account for Leaf Area Index (LAI) variability. The latter is currently the only global product that has been tested and reviewed in a substantial number of scientific articles [29]. For a detailed description of each of the ETact algorithms, the reader is referred to the citations listed in Table 3.
ALEXI is the only model for which no preprocessed monthly product was available. Therefore weekly values were aggregated to monthly maps, with ETact during weeks overlapping two months being proportionally divided over these months. Maps of annually averaged ETact for the Red River Basin in 2003–2012 retrieved from the five aforementioned methods can be found in Figure A3.
Table 3 lists the basin-averaged ETact according to the individual products. The annual average ETact in 2003–2012 falls within a range of 268 mm, with SSEBop on the low end and SEBS on the high end of the values. It is interesting to note that the standard deviation of seasonal sums in the dry season is higher than in the wet season for all products. This reflects the different ways in which the algorithms simulate evapotranspiration under stressed conditions; during the rainy season, ETact will likely equal ETpot most of the time. None of the retrieved annual ETact amounts conflict with reported values for reference evapotranspiration in the Red River Basin [39], or with the basin annual average potential evapotranspiration (ETpot) of 1306 mm according to a 1 km global dataset on long-term average monthly ETpot distributed by CGIAR [74].
Karimi and Bastiaanssen [12] report a mean absolute percentage error of 5.4% for remote sensing-based ETact estimations. However, the range of values in Table 3 indicates that algorithms developed for the global scale yield substantially different outlooks on the Red River Basin water balance. This is also visible when comparing the spatial patterns in Figure A3. Specific locations where ETact values of the different products correspond or contradict can be observed in Figure A4, where a spatial depiction of the coefficient of variation (CV) in annual average ETact is provided per pixel. The highest CV values are observed in areas with high elevation along some of the subbasin boundaries, where especially SEBS deviates from the other GSDPs (see Figure A3). A high CV is also found in the coastal zone, possibly caused by differing methodologies for dealing with standing water, or differences in applied land/water masks.
Examining the monthly variability of ETact for different LULC classes against a priori knowledge is a way to further evaluate the five models. Figure 6 shows how monthly ETact varies for three major land use types: irrigated cropland, rainfed cropland and the merged forested classes. In general, the different products agree reasonably well in terms of temporal patterns in monthly ETact, and no clear discrepancies are observed in relation to known monthly rainfall patterns. The least temporal variation is observed in CMRSET, and the highest in SEBS followed by SSEBop. Rainfed agriculture has generally the lowest ETact of these three LULC classes, according to all products. It is found that all models compute a reduction in the difference between the rainfed and irrigated classes as the wet season progresses. This is to be expected to a certain extent, as rainfed crops will have access to sufficient water during this period. The difference remains the largest in SSEBop ETact, whereas almost full convergence of the rainfed and irrigated CMRSET curves occurs from July onwards. MOD16 is the only model that predicts ETact to be highest for the forest class throughout the year. ALEXI and CMRSET predict a very similar time series for the forested and irrigated classes, which may seem surprising as the physical conditions of these ecosystems are rather different. However, both forest and irrigated crops have access to ancillary moisture unavailable to rainfed crops (the forests due to deeper rooting depths), and with the current information it is difficult to determine which of the five temporal curves for these LULC types are most realistic. Despite the differences between products, Figure 6 does not provide sufficient basis for excluding any of the ETact models from further analyses.

2.4.2. Solving the Water Balance to Evaluate ETact

As the information available for the Red River Basin is insufficient to verify the quality of the ETact products independently from rainfall, TRMM data were used in combination with streamflow records to check the closure of the water balance:
Q = P E T a c t   Δ S
where Q is measured river discharge and ΔS is the change in catchment storage. Fundamental hydrological principles and the law of mass conservation dictate that, over a number of hydrological years, the rainfall surplus (P − ETact) should equal Q at the downstream end of a catchment. In this study, the storage change over a period of 10 years is assumed to be negligibly small. Time series of daily river discharge were purchased from the NCHMF for the hydrological stations indicated in Figure 1. Metadata of these stations are provided in Table A2. Using SRTM elevation data, upstream catchments were derived for each of the available measurement stations. Bac Me, Muong Te and Lao Cai are located in mountainous areas and all have a catchment located for the largest part in China. Hoa Binh, Yen Bai and Vu Quang are located at downstream points in the Da, Thao and Lo subbasins, respectively. The Son Tay station is located after of the confluence of the Da, Thao and Lo Rivers. No streamflow time series is measured downstream from Son Tay [49,75].
First, a preliminary check of the reliability of these Q data was performed by checking the consistency of temporal patterns between upstream and downstream stations in the same river branch (Figure A5). Although the upstream and downstream stations in the Da and Lo basins follow approximately the same pattern, the time series for the Thao River are quite different. For the years 2004 and 2005, hardly any runoff seems to be generated in the largely forested area of 14,000 km2 between Lao Cai and Yen Bai, while in 2003–2004 Q measurements downstream are even lower than upstream (in other words, net consumption seems to occur), which is impossible given the size and dominant LULC types of the area. As the Yen Bai discharge curve corresponds well with temporal patterns observed at other stations, it was decided to eliminate Lao Cai from further analyses. Averaged over the overlapping period of records, Yen Bai, Vu Quang and Hoa Binh, the three downstream stations in the subbasins, measure 92.8% of the total runoff at Son Tay. This is according to expectations, with the remaining 7.2% to be generated in the small intermediate area. In short, the analysis of streamflow records yields sufficient confidence in all available measurement stations, with the exception of Lao Cai.
It was decided to use long-term streamflow at one downstream gauging station to assess the area-averaged ETact. Son Tay is the obvious choice, as it is located downstream of the confluence of the main tributaries and upstream of the Red River Delta, the main area of water demand. ETact upstream from Son Tay was compared against TRMM rainfall and measured streamflow in Table 4. Hydrological years were defined from 1 April until 31 March of the subsequent calendar year, in order to include one full wet and dry season. Using this precipitation and streamflow dataset, SSEBop shows the best performance over this basin in terms of accordance with the laws of mass conservation, overestimating P minus Q by only 3.4%. For all other ETact products, values are found to exceed P minus Q with a range of 14.0% (CMRSET) to 34.3% (SEBS).
It is important to realize that the aforementioned differences between P minus Q and ETact are not only a product of uncertainties in satellite-derived P and ETact. A variety of factors cause a potentially significant uncertainty in streamflow records, with errors of 10%–20% not uncommon for single observations [76,77,78]. In the Red River Basin, local stage-discharge relations may become outdated after a number of years, depending on geology, in-stream sand mining and changes in erosion-sedimentation patterns due to reservoir construction. Specifically for the Son Tay gauging station, a error of 10%–15% in streamflow values was reported in 2014 [49]. Since the SSEBop retrieval of ETact falls well within this range of accuracy, we assume that it represents the upstream conditions most accurately in terms of absolute ETact. Still, the outcomes of such assessments should be regarded as comparative analyses, rather than absolute validation exercises.

2.4.3. Construction of an Ensemble ETact Product

While P minus Q comparisons provide a means for assessing general reasonability of ETact retrievals at basin scales, they provide no information about the relative model accuracy in spatially distributing ETact. Each of the algorithms incorporates different inputs, procedures and assumptions, leading to substantial differences in spatial patterns between models, which can be viewed in Figure A3 and Figure A4. Previous studies demonstrated that the performance of a certain ETact algorithm is dependent on factors such as LULC type, climate and the presence of mountains [27,28,29,33,34], meaning that the accuracy of ETact predictions will vary across a basin. An ensemble approach was taken toward generating “best-guess” maps of ETact in the Red River Basin, under the assumption that spatial errors between related yet differing mapping approaches will tend to cancel in the ensemble average. A superior performance of different ETact ensemble products with respect to individual algorithms was previously observed for the Nile Basin [79], where flux towers were available for validation.
To identify models that are spatially most similar, spatial patterns were analyzed in terms of the Pearson correlation coefficient (r) at the pixel level (Table 5). A minimum value of 0.5 was assumed to represent a sufficiently strong spatial correlation to warrant combination in an ensemble ETact product. It was found that the correlation between all pair-wise combinations of ALEXI, MOD16 and SSEBop was above this threshold, whereas CMRSET and SEBS do not achieve this level of correlation with any of the products. Pixel values of monthly ETact for ALEXI, MOD16 and SSEBop were scaled around 1 (the average for each product upstream of Son Tay) and the resulting maps were averaged to create a relative ETact map for each month. Finally, these relative values were multiplied with the SSEBop ETact Son Tay catchment average. In this way, a final monthly ETact product was constructed that is congruent with the basin water balance inferred from P minus Q, as well as with the spatial patterns predicted by the majority of the available ETact GSDPs. The resulting annual ensemble ETact for the Red River Basin is presented in Figure 7.

3. Results

In this section, the ensemble-averaged ETact is used to study the water budget of the Red River basin. Long-term rainfall surplus is examined to determine the net production and consumption of water resources across the basin, in wet vs. dry seasons, and per LULC class. Subsequently, monthly runoff patterns are investigated for each subcatchment and storage changes are expressed as a function of rainfall surplus.

3.1. Rainfall Surplus

Rainfall surplus (Psur) can be viewed as the total water budget available for generating surface runoff, replenishing aquifers, or recharging soil moisture stores. The partitioning of Psur among different hydrological processes depends on factors such as soil type, slope, and intensity of precipitation. For multi-annual time scales on which ΔS can be neglected, Psur equals the water yield (P − ETact − ΔS), the comprehensive term that is transported downstream through surface and sub-surface pathways to constitute river flow.
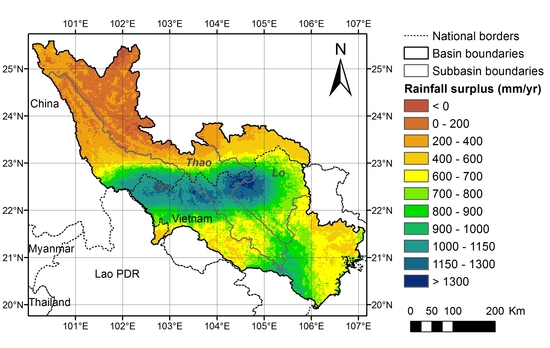
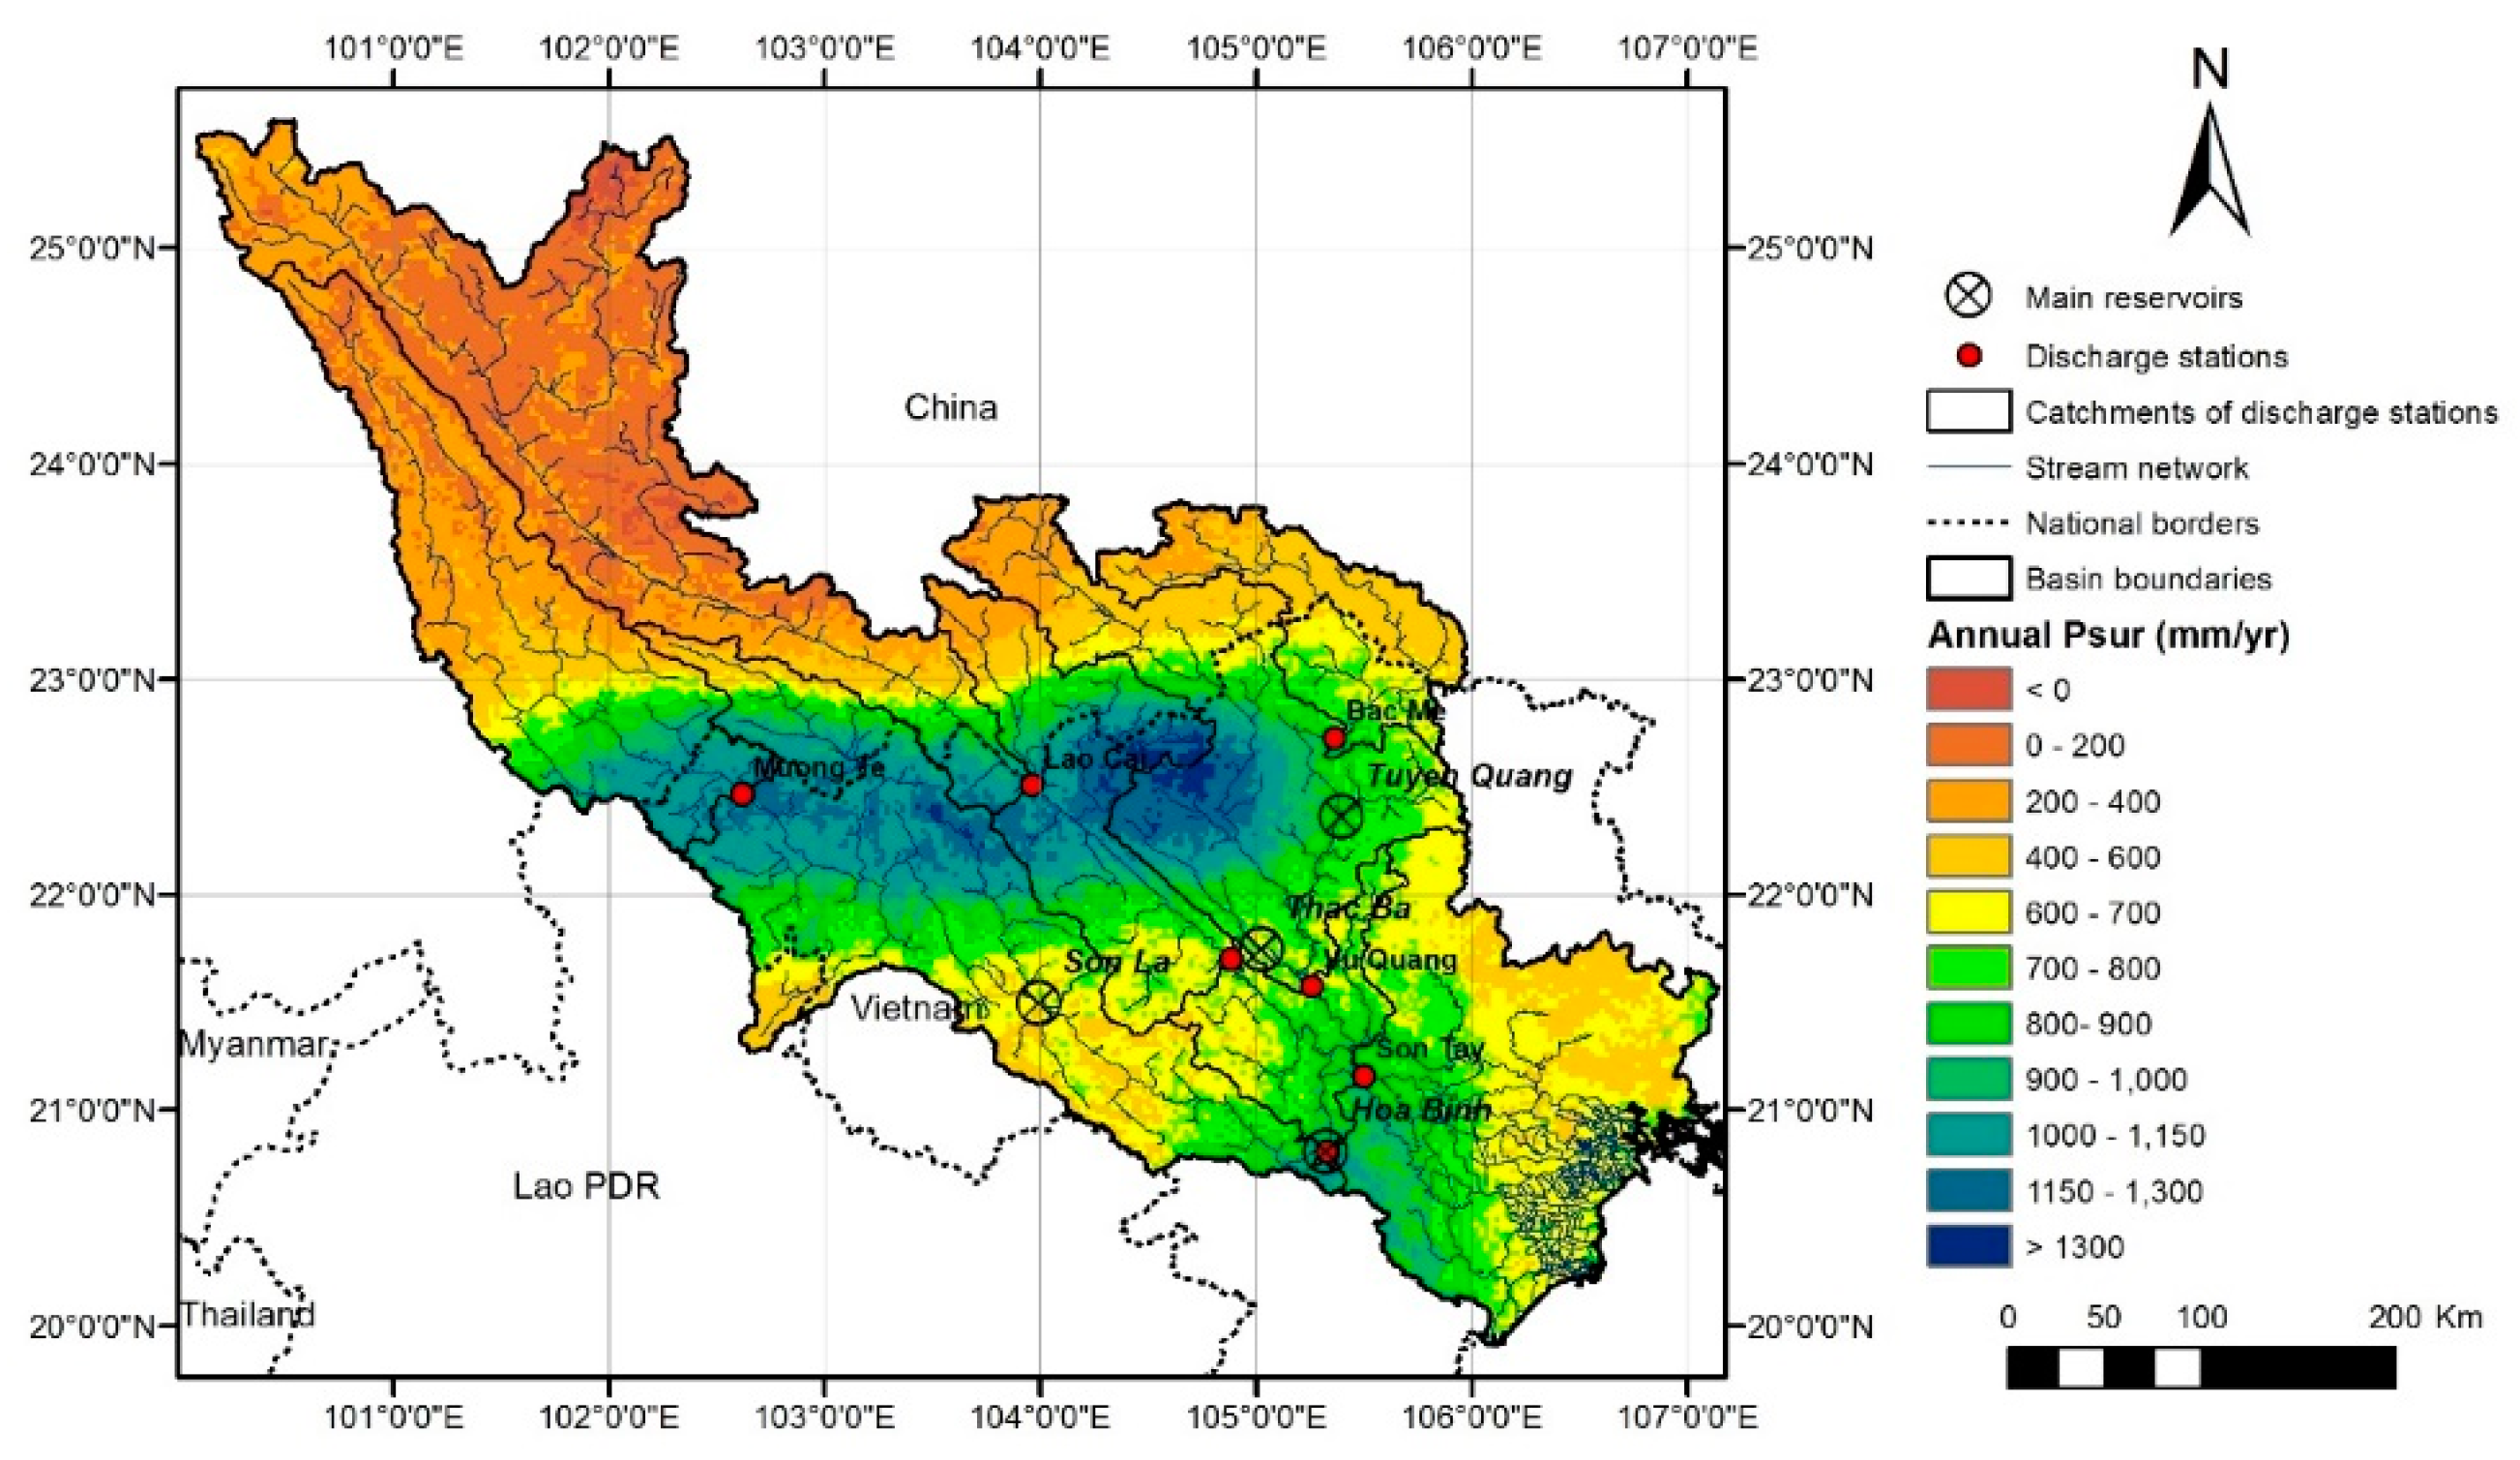
Figure 8 presents the rainfall surplus in the Red River Basin for 2003–2012. From this map it can be concluded that the Red River Basin in a sense is an atypical river basin, with the upstream part generating relatively little runoff. Particularly the forested areas of the northern portion of the basin have a low Psur over this ten-year period. Rainfall is lower here than in other parts of the basin, and forests likely grow deep roots to tap into aquifers. The highest Psur occurs in the central part of the basin, a transitional area between the low-lying southeast and the mountainous north, with peak values of up to 1300 mm/year. From the perspective of transboundary water management, it is interesting to note that the majority of the average annual Psur occurs in Vietnamese territories (825.4 mm, or ~73,000 km3), while only 390.3 mm (~30,000 km3) is produced in China.
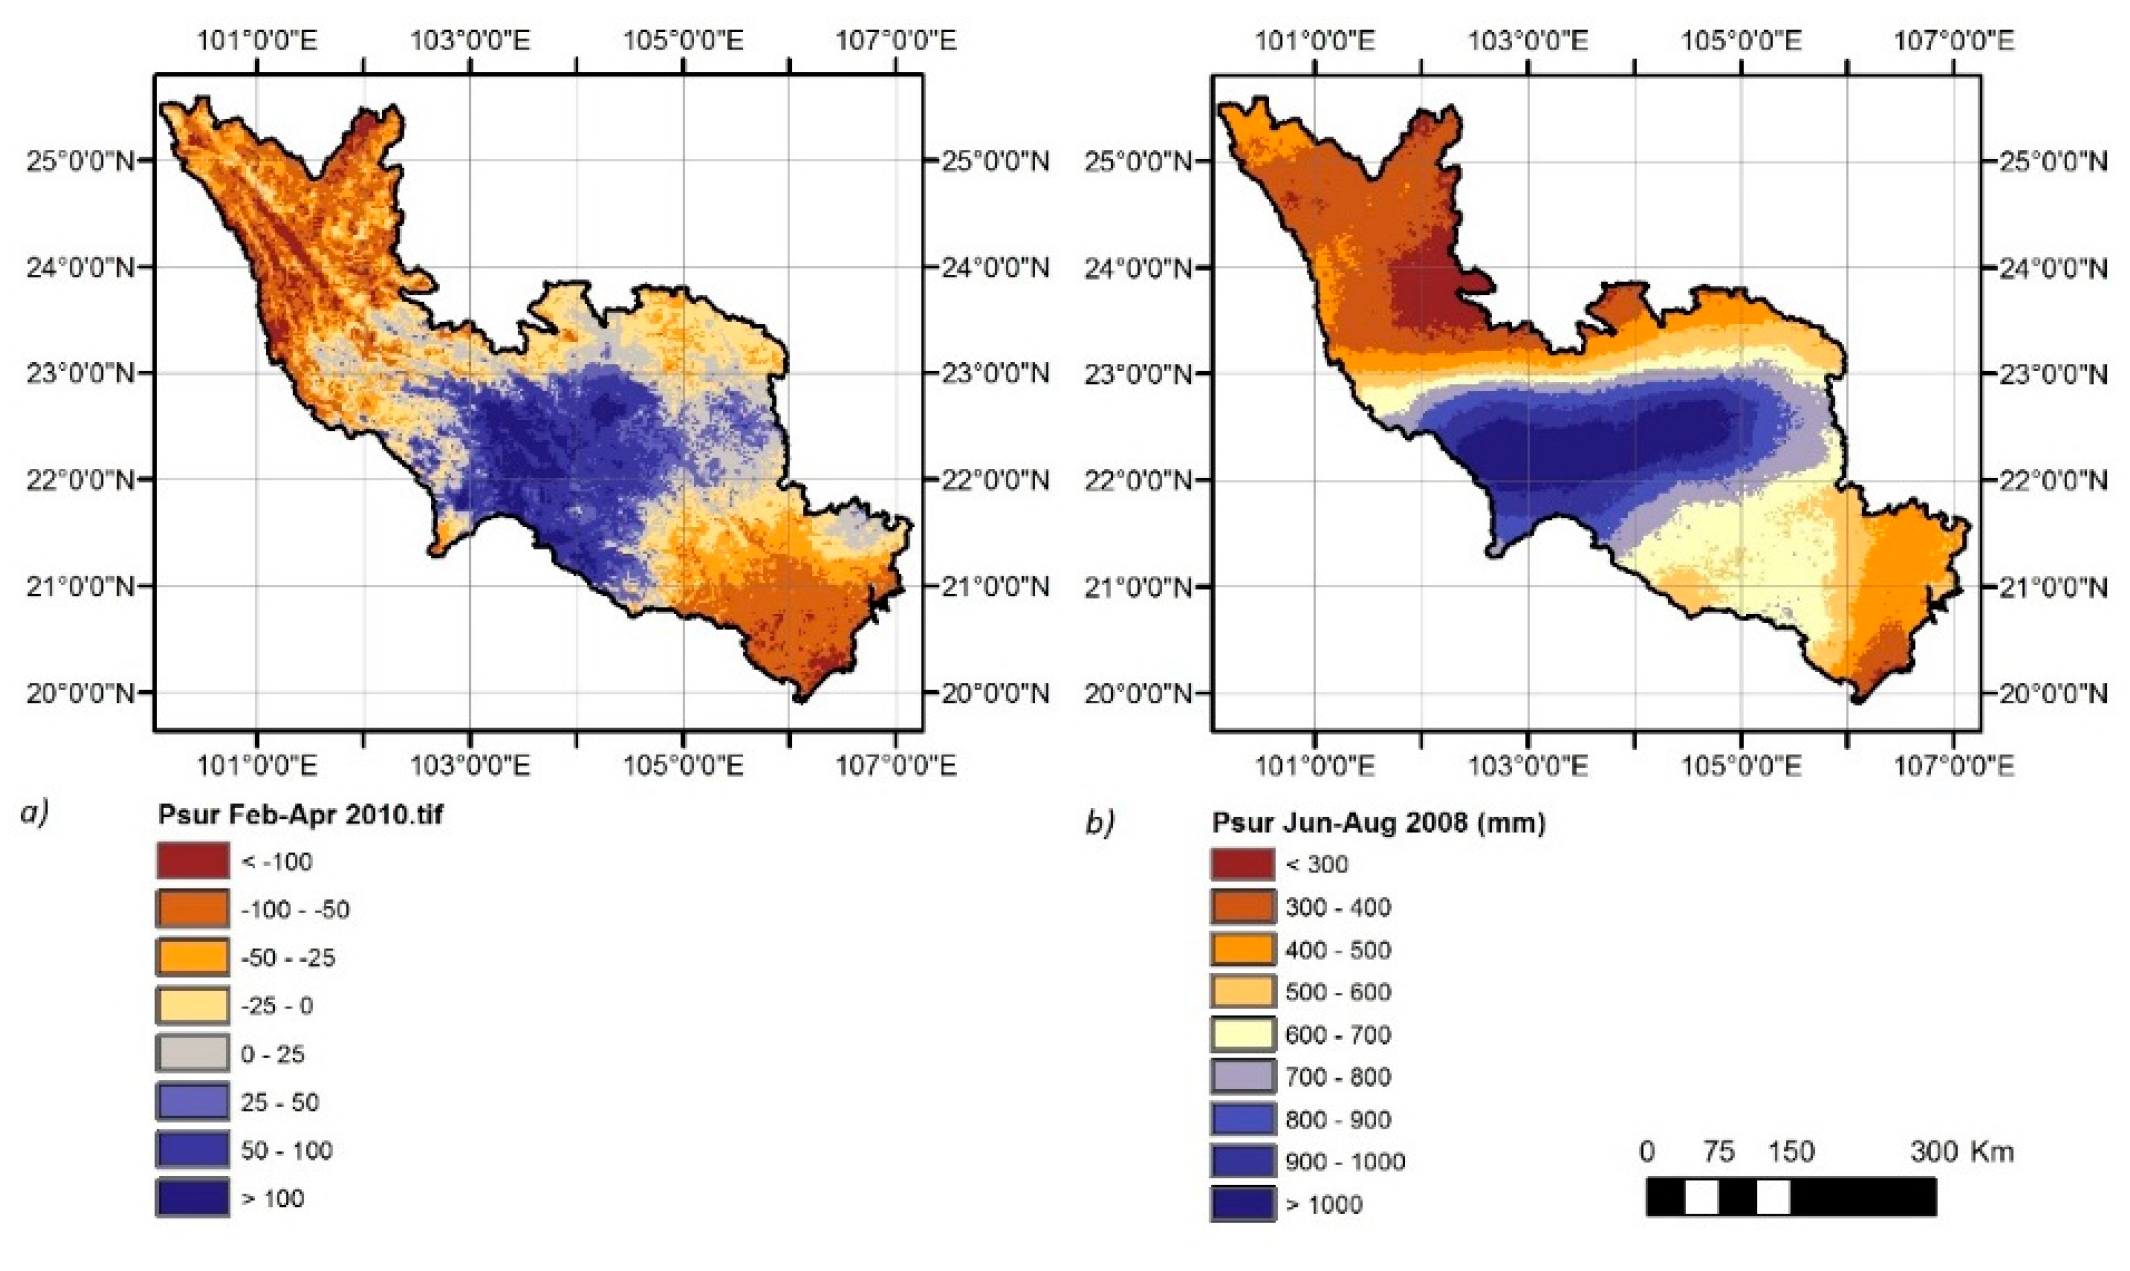
Figure 8 shows that the irrigated Red River Delta on average does not consume water on the annual scale. This, however, is not the case when examining the irrigated spring rice season. Figure 9a shows how Psur becomes negative due to water withdrawals during February–April 2010, when a net water consumption of up to 100 mm is observed in the delta. In general, a negative Psur can be partially related to changes of water storage in the unsaturated zone, but a negative value during elongated periods is indicative of withdrawals. During the rainy summer season, Psur is high in the entire basin (Figure 9b). Within the delta, Psur is observed to be highest in the western part, where drainage is the most challenging due to the low relative altitude in relation to the water level [44].
To evaluate water consumers and producers in the Red River Basin, the spatially distributed Psur assessment was coupled with the improved LULC map (Figure 3). 
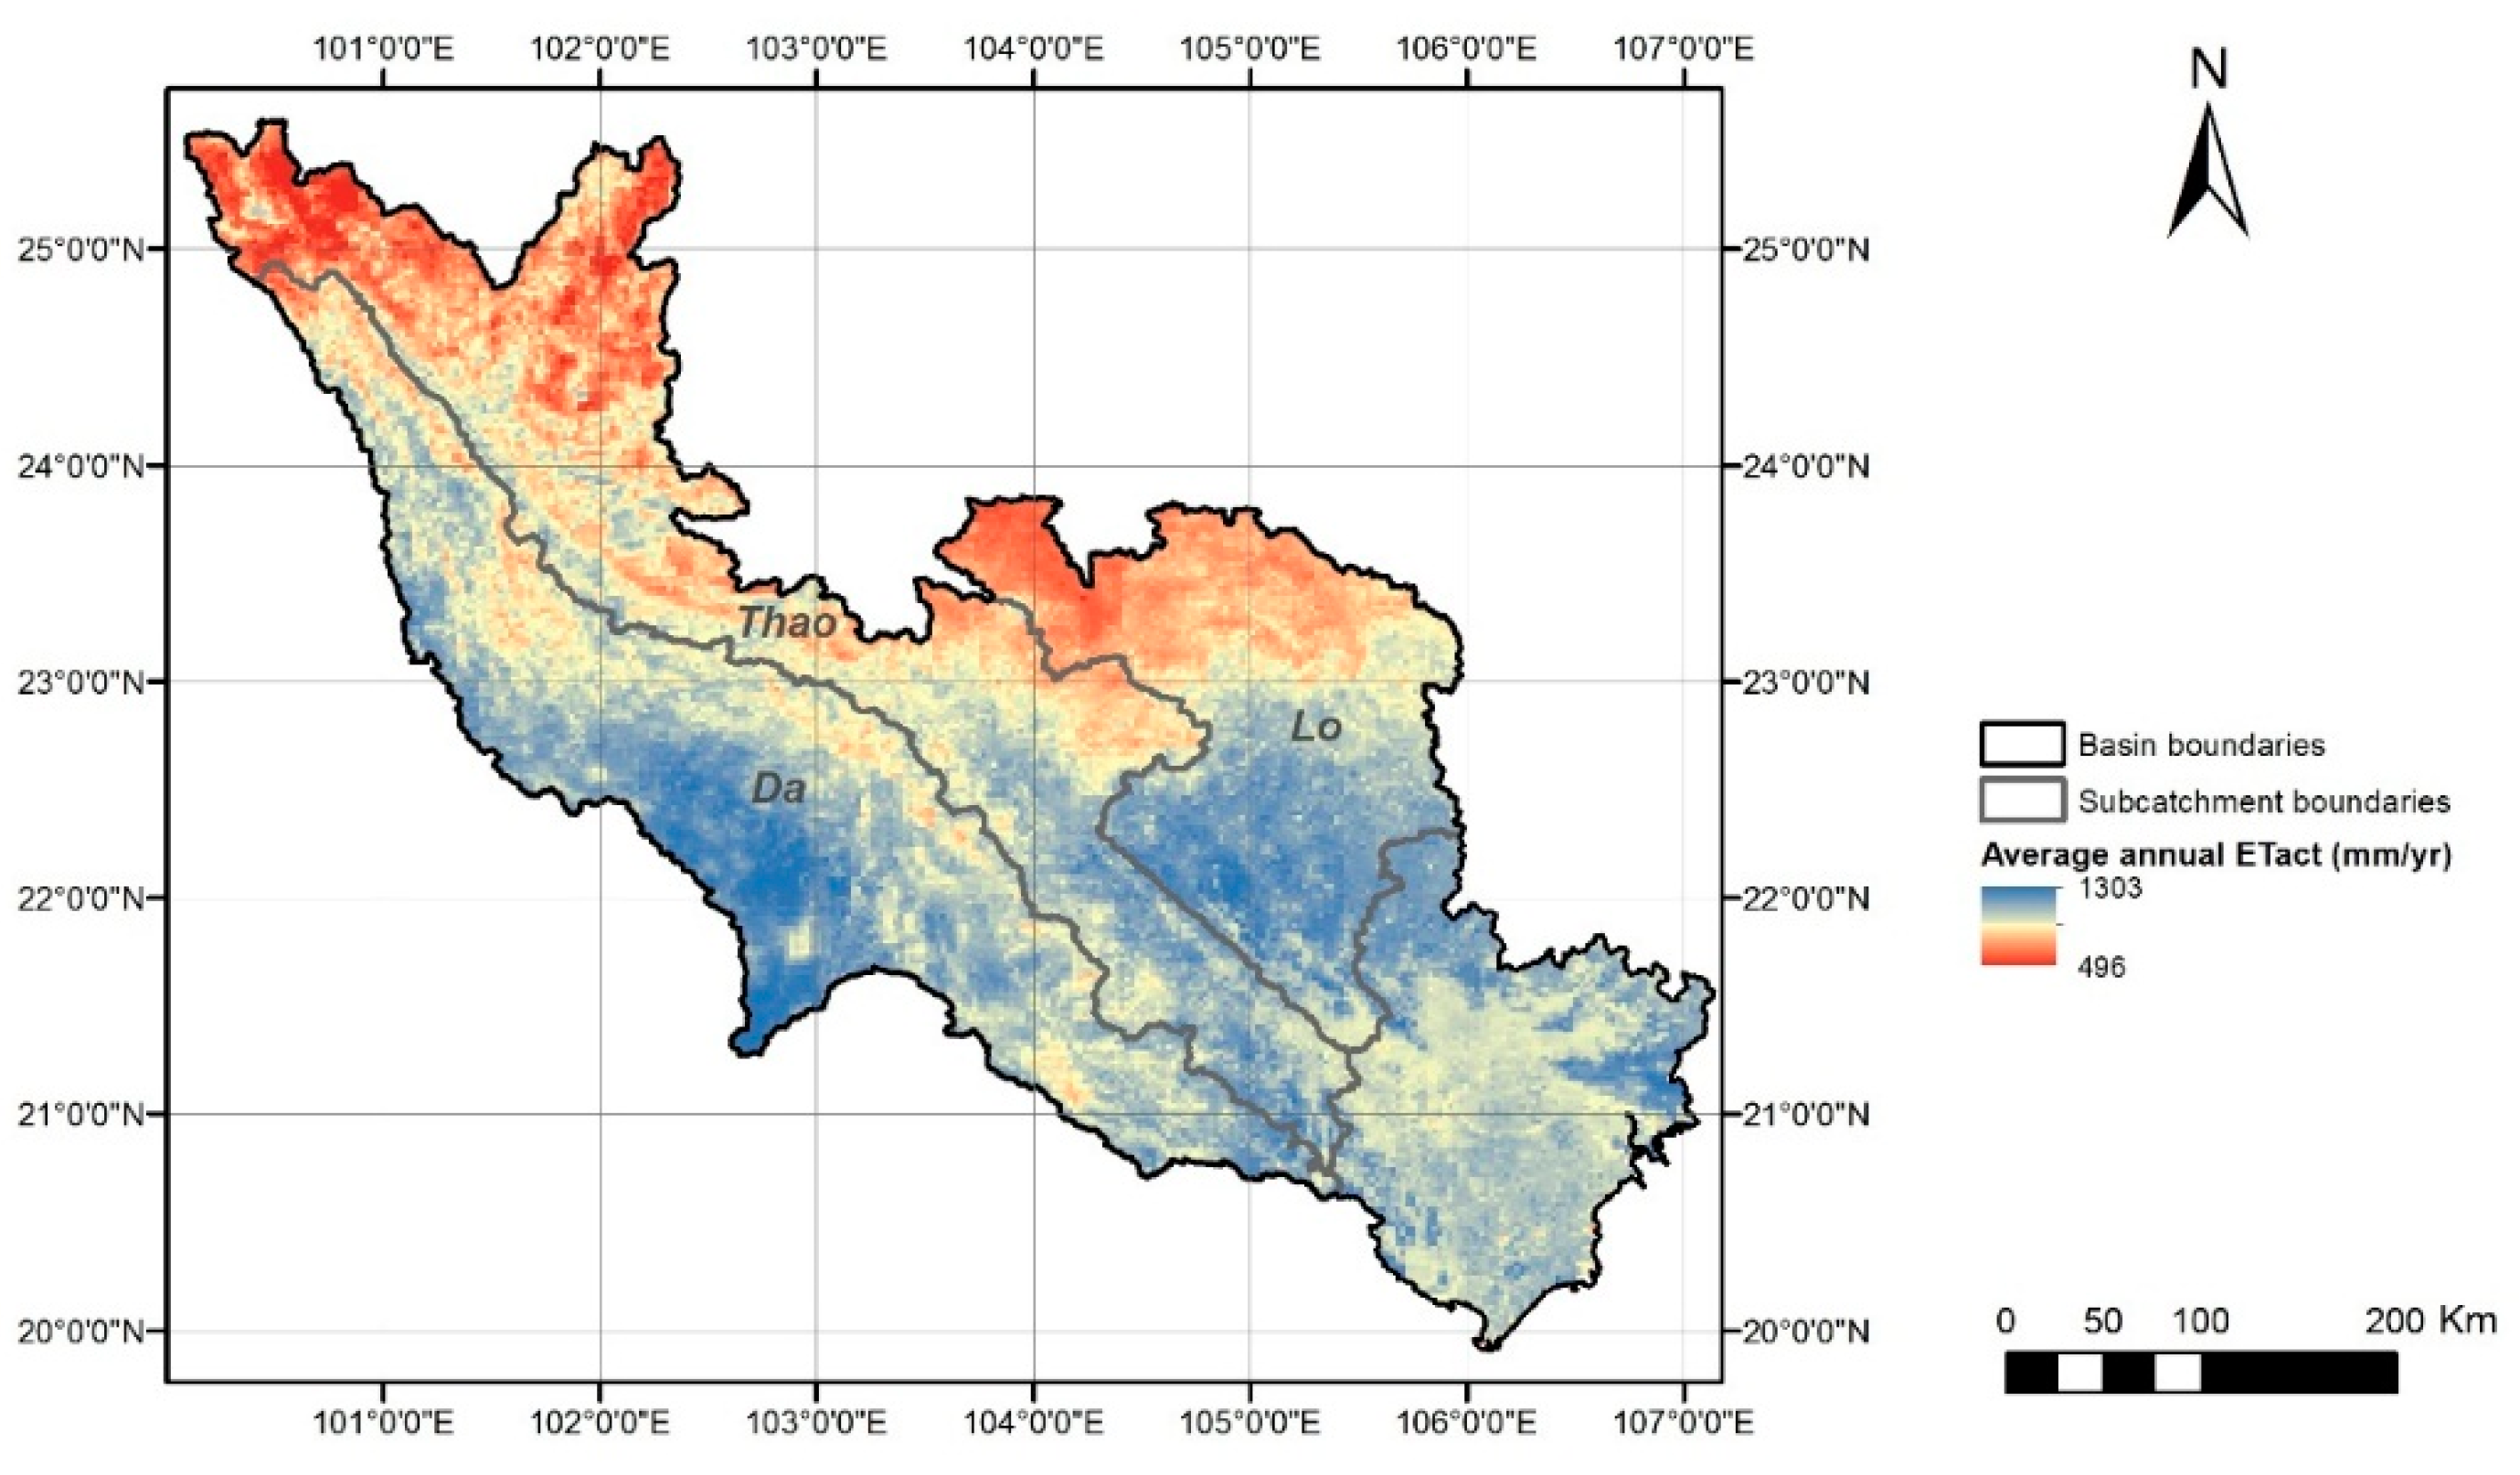
Table 6 provides an overview of water consumption and production by the different LULC classes in the Red River Basin. It is found that, on average, there is no net water-consuming LULC class on the annual scale. The largest amount of water in the Red River basin is produced by the extensive forest and shrubland ecosystems (an annual total of 62.3 km3). In total, 102.6 km3 (or 621 mm/year) of water is produced on average per year, which can be viewed as an estimation of the total outflow of the complex stream network of the Red River Delta.
One of the most striking findings from this analysis is that a relatively large amount of water is produced by areas classified as irrigated cropland, while the opposite is found for the single-cropped rainfed class. Although this may be counterintuitive, it is caused by the geographical concentration of single crop agriculture in areas with a relatively low annual rainfall (±1000–1300 mm). It is observed that the areas equipped with irrigation infrastructure (particularly the delta) are generally receiving more rainfall from the Tonkin sea during the rainy season than the zones dominated by rainfed agriculture further land inwards. Therefore, the observed higher ETact in double- or triple-cropped systems (890.3 mm/year vs. 736.8 mm/year) does not lead to a lower rainfall surplus compared to single crop agriculture. This very high summer rainfall in the delta is a known phenomenon, and the different tributaries and canals essentially serve as drainage canals during this period [80].

3.2. Runoff Response Patterns and Storage Changes

When considering time scales of a single year or smaller, the change in storage ΔS becomes an essential component of the water balance. By relating the measured Q from different gauging stations to upstream Psur, it is possible to e.g., identify the locations within a river basin where most streamflow originates, and the time periods when water stores in the soil profile and aquifers are replenished.
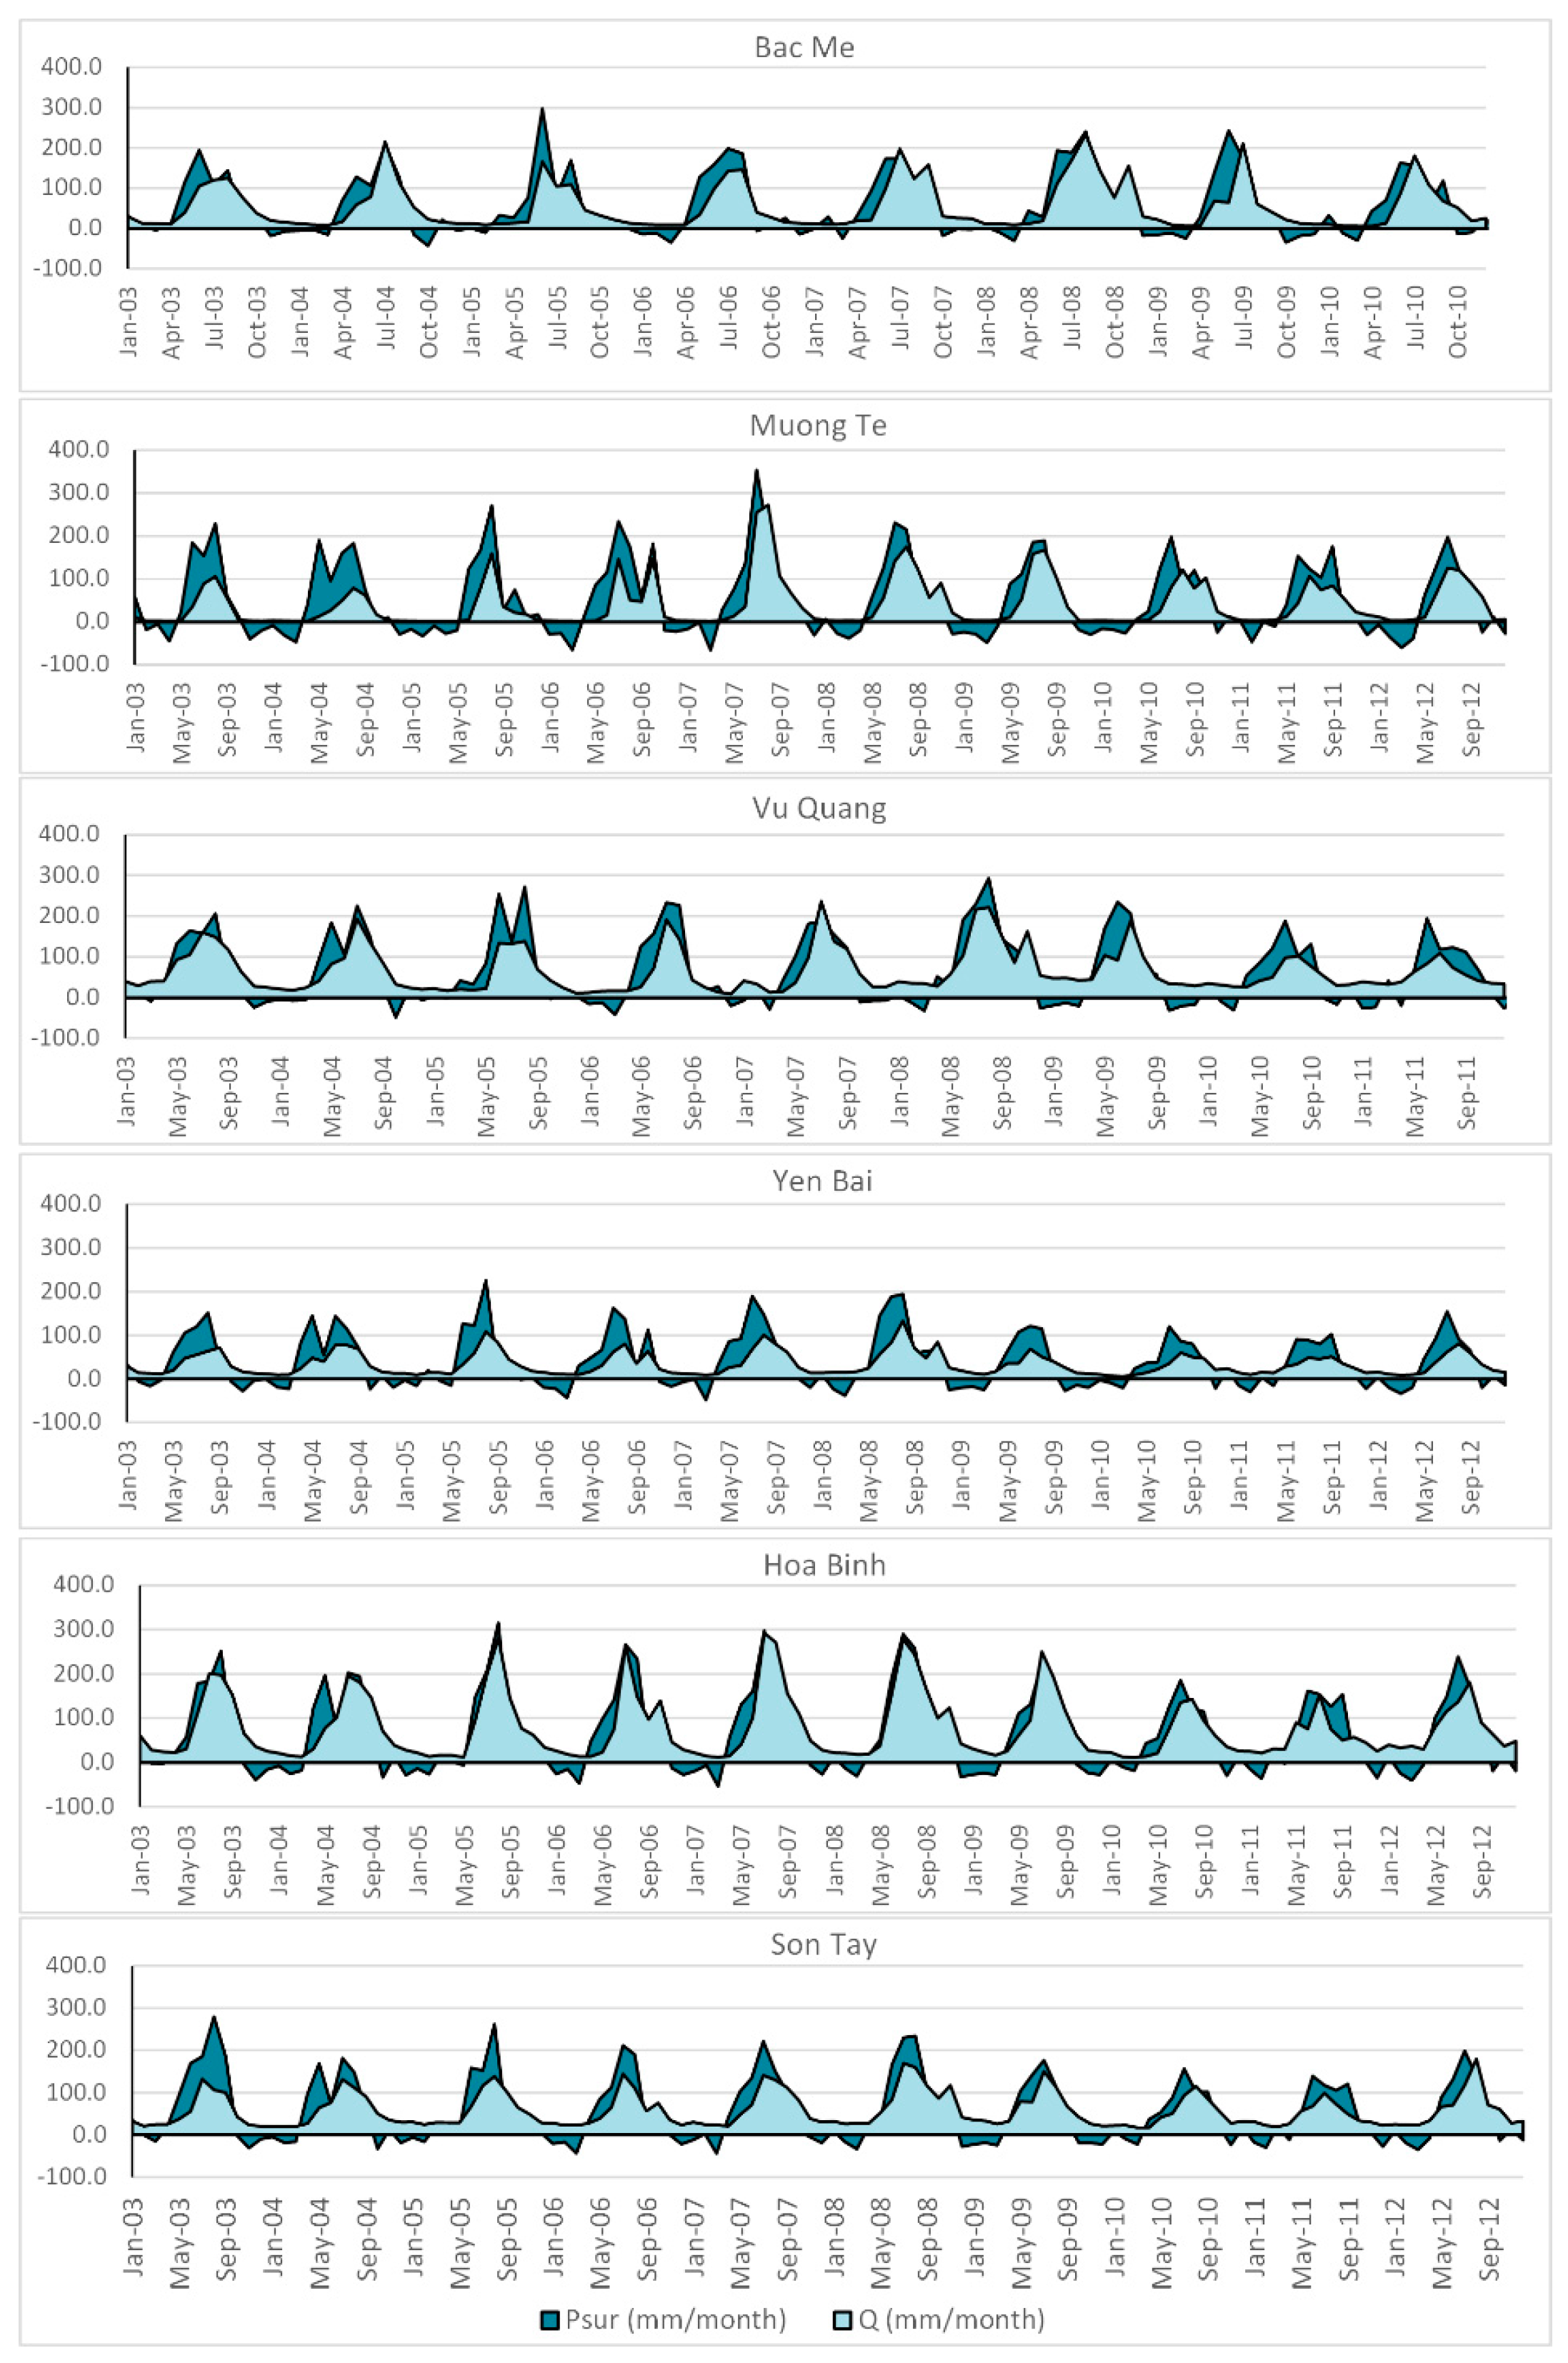
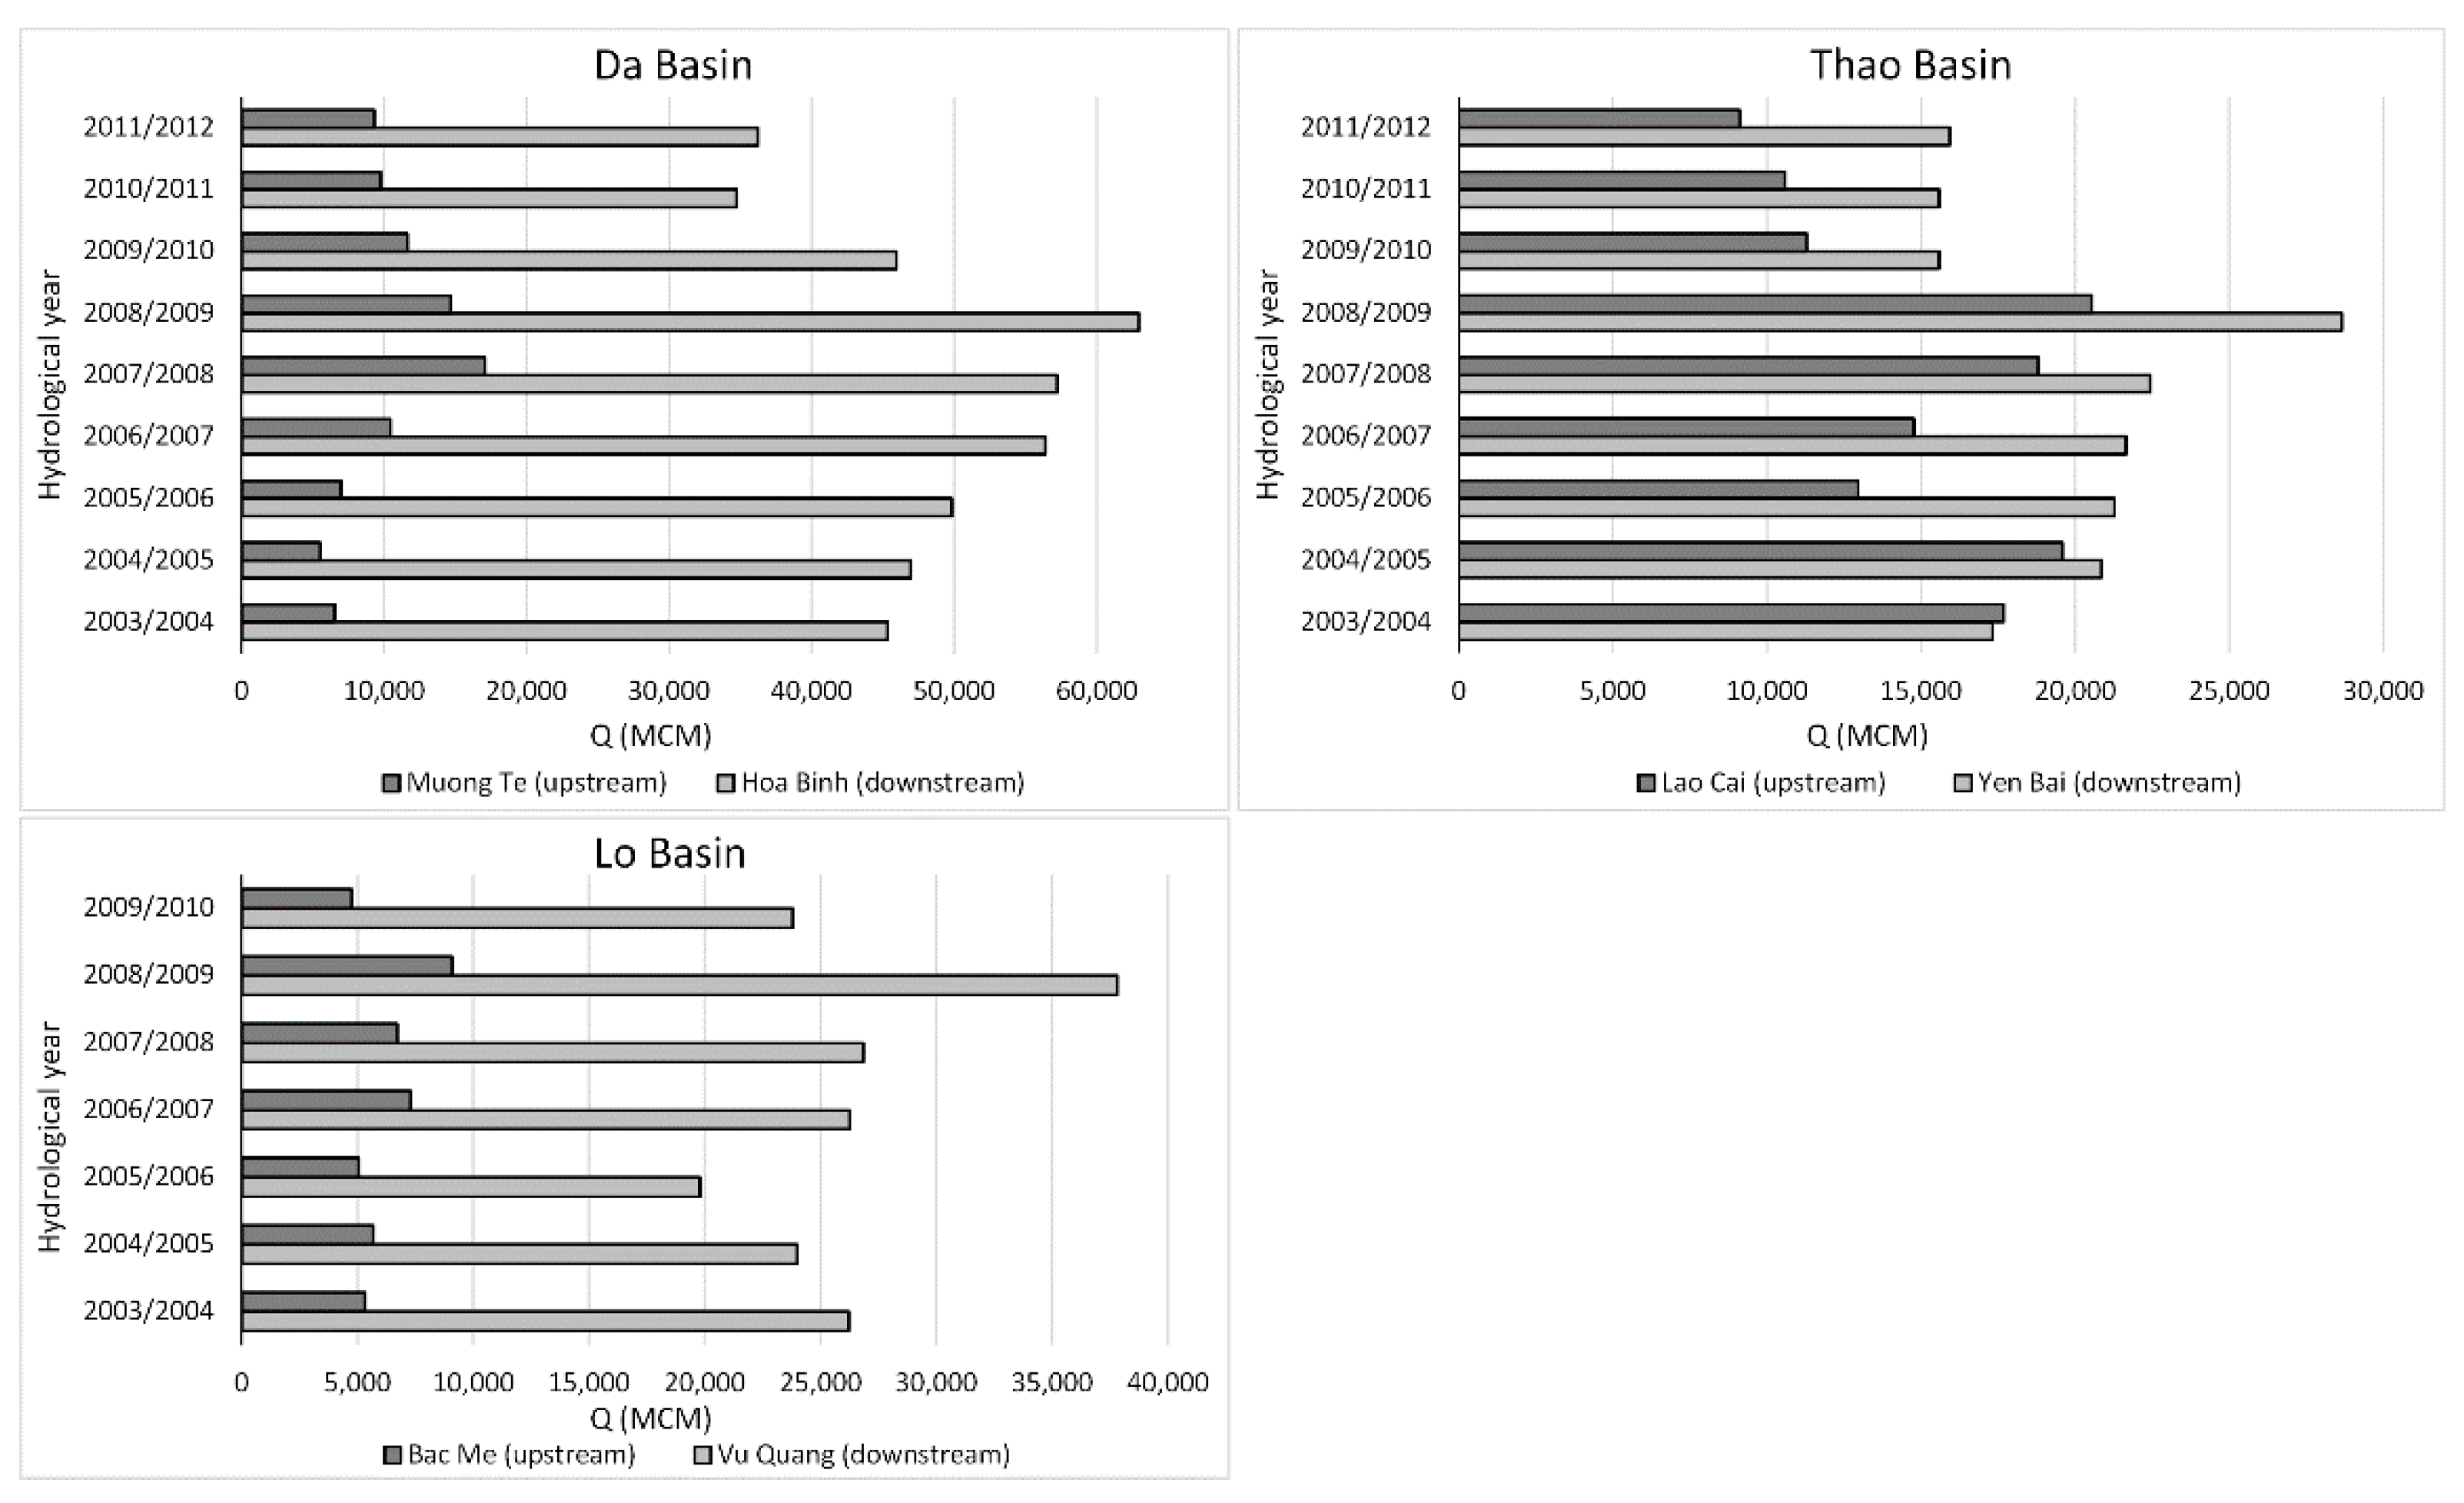
For different sections of the Red River Basin, measured streamflow and satellite-derived Psur are compared in Figure 10. In the rainy season, streamflow from the catchments of all available stations typically lags behind the increase in Psur by 1 to 2 months, while the decline in both parameters around September occurs simultaneously. This is likely caused by water storage in aquifers and the soil profile, occurring up to the point of saturation after which all Psur will be discharged as surface runoff. River discharge in parts of the Red River Basin is largely managed, as several large man-made reservoirs are present aimed at flood buffering and hydropower generation [81]. Dry season flow is highest at Hoa Binh and Vu Quang, where artificial storage capacity in the upstream catchments is largest.
Table 7 lists the long-term Q/Psur values for each of the catchments. Some values deviate substantially from 100%, which indicates that the 2003–2012 ΔS term may not be negligible for these areas. The low 10-year average of 80.9% for Muong Te can be explained by the construction of several dams in the Chinese part of the Da basin. In previous work [82], at least nine hydropower reservoirs were identified that were commissioned in the years 2007–2009. The filling of these reservoirs in the preceding years has caused an average Q/Psur of 56.1% until March 2007, whereas for April 2007 till September 2012 a value of 99% is found, indicating an almost perfect closure of the water balance by satellite-derived Psur. The total volume of water stored in the new Chinese reservoirs in Da River and its tributaries between April 2003 and March 2007 is estimated at 22.7 km3. Another interesting finding is that annual Q/Psur values for the Hoa Binh catchment continuously exceed 100%, whereas the opposite is observed for the adjacent Yen Bai catchment. In combination with the satisfactory agreement between P, ETact and Q data in other catchments, and in the absence of any notable interbasin transfers (to our knowledge), this phenomenon may be partly explained by groundwater flow from the Thao basin to the Da basin.
To compare monthly Q and Psur, Table 7 lists the slope and R2 obtained from linear regression between both variables. For the entire gauged portion of the Red River Basin (upstream of Son Tay), 43% of rainfall surplus is converted to surface runoff. The highest Q/Psur value of 0.65 is found for Hoa Binh catchment, whereas only 33% of Psur contributes to surface runoff upstream of Yen Bai. A reason for this difference is likely the catchment topography, with a lower average slope in the upstream catchent of the latter station. In addition, average annual Psur is substantially higher in Hoa Binh with 730 mm as opposed to 460 mm for Yen Bai, increasing the frequency of occurrence of saturated conditions in the soil profile.
Although the multi-annual Q and Psur are congruent at the subcatchment scale, it is not obvious that a correlation on the monthly scale should be expected. Especially in dry months when the catchment storage is relatively empty, a low and stable Q is observed (likely driven by baseflow) that is not significantly affected by variability in monthly Psur. During wet months, however, the progression of the Q/Psur ratio is representative of the changing response of the catchment to rainfall. Table 7 lists average Q/Psur for each of the months in the rainy season. A similar pattern is observed for all catchments, in which the ratio increases as the rainy season progresses and exceeds 1 at the end of monsoon in September. This consistent increase of Q/Psur suggests that in the Red River Basin saturation excess processes are dominant in runoff generation, rather than Hortonian runoff occurring during high-intensity precipitation events [83,84]. Monthly Q/Psur values substantially higher than 1 could occur due to groundwater flow between catchments, or human actions; e.g. when large volumes of water are released from the reservoirs. These releases occur in particular during the monsoonal months, when flood buffering capacity is required and a maximum water level is maintained [85]. Although these management actions are expected to affect Q/Psur, the natural processes of streamflow generation still appear clearly in the figures in Table 7.
As correlation between Q and Psur is logically weak for specific months, it is not yet feasible to predict Q for every month solely from remote sensing. This could change when ETact GSDPs come available on a daily basis, which will enable a detailed investigation of the relation between cumulative Psur from the start of the hydrological year and the Q/Psur term [84]. However, a clear relation is observed between monthly Psur and ΔS, as the storage capacity of the Red River Basin is not fully satisfied for the major part of the year. Therefore, it is possible to express volumetric ΔS as a function of remotely sensed Psur. Figure 11 depicts a plot of monthly ΔS vs. Psur, upstream of Son Tay. A clockwise hysteresis pattern can be observed. Linear models were derived that enable the prediction of ΔS without the need for ground observations. From December until the start of the rainy season in April, the slope of the models is near to 1 with a relatively stable intercept in the order of 23–29 mm, which can be viewed as the contribution of groundwater to streamflow. The slope of the model decreases as storage fills up and the contribution of Psur to Q increases. As Psur values decrease in September and October due to declining rainfall, the low intercept is representative of the rainwater from previous months that is now taken out of storage to contribute to streamflow. Errors in the derived models for monsoonal months are partly caused by human interventions in Red River water management, and this approach is expected to work even better in more “natural” river basins.

4. Discussion

With the increasing availability of global actual evapotranspiration data in the public domain, in addition to rainfall and land use/land cover, it is now possible to quantify the main components of the water balance for river basins in a distributed manner. This paper shows that rainfall surplus can be successfully computed from global satellite-derived data products for monthly, annual and multi-annual time scales. The total annual water yield of 102.6 km3 computed for the entire Red River Basin is an estimation of long-term river outflow, which is especially valuable because of the lack of streamflow gauges in the Red River Delta [75]. In non-saturated conditions, spatially distributed monthly Psur is strongly related to changes in storage, and monthly ΔS can thus be quantitatively determined from satellite data. These findings demonstrate that assessments of rainfall surplus from satellite-derived P and ETact potentially facilitate sound water accounting in ungauged river basins that was previously impossible due to missing ground data.
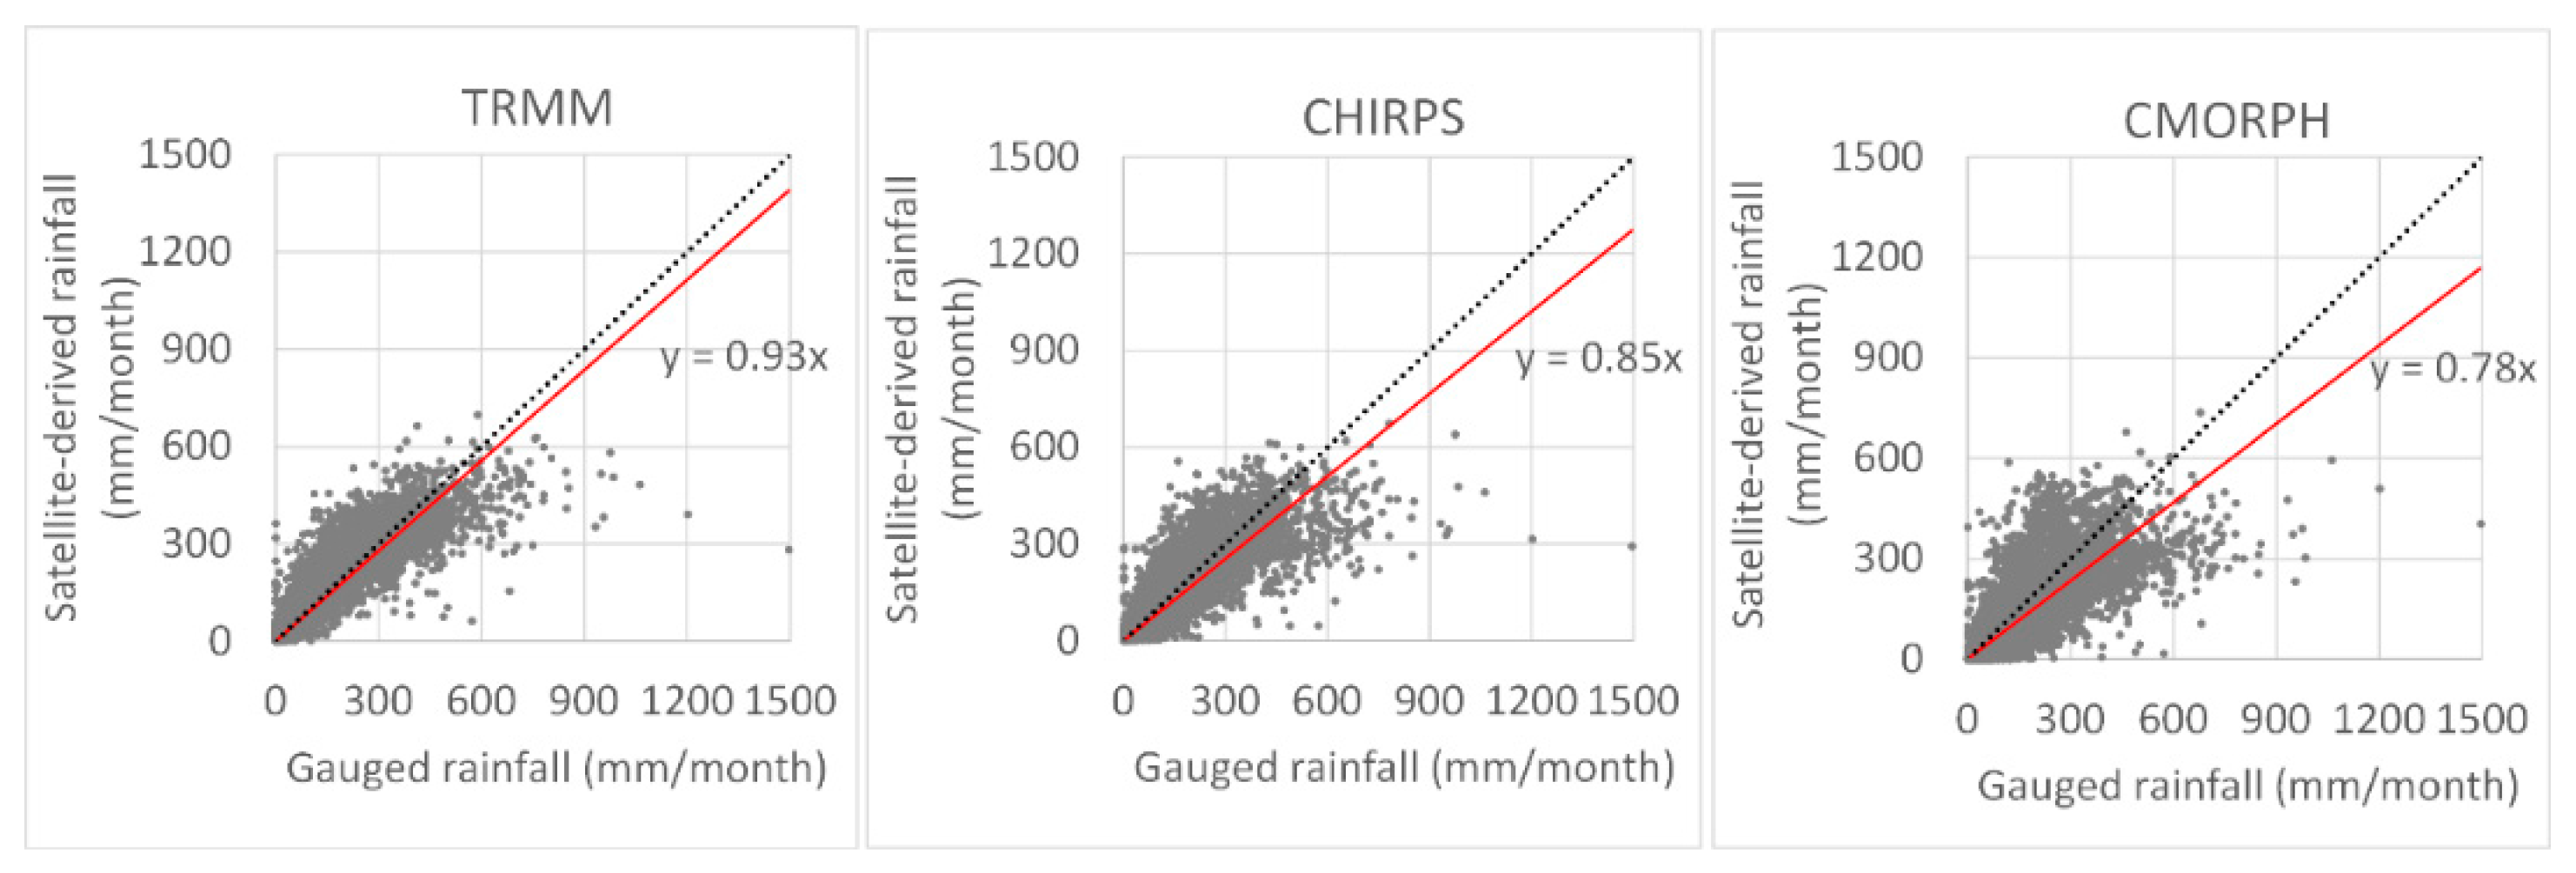
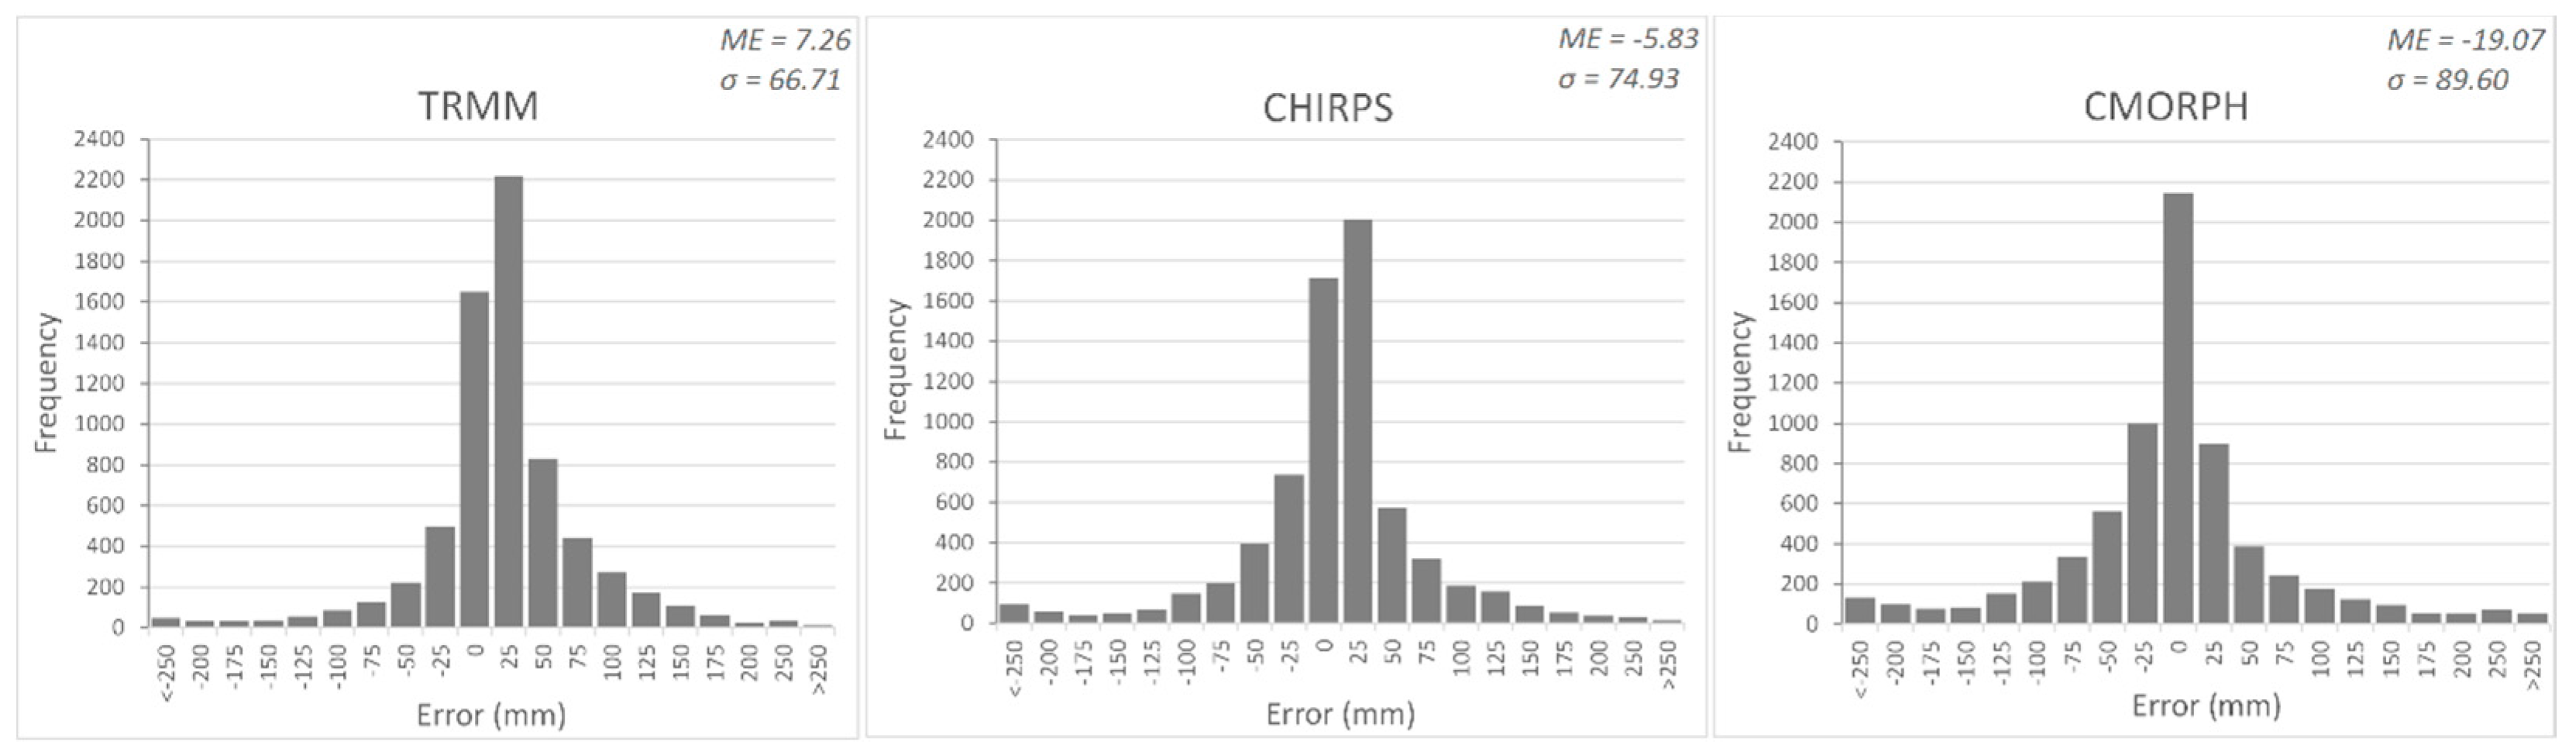
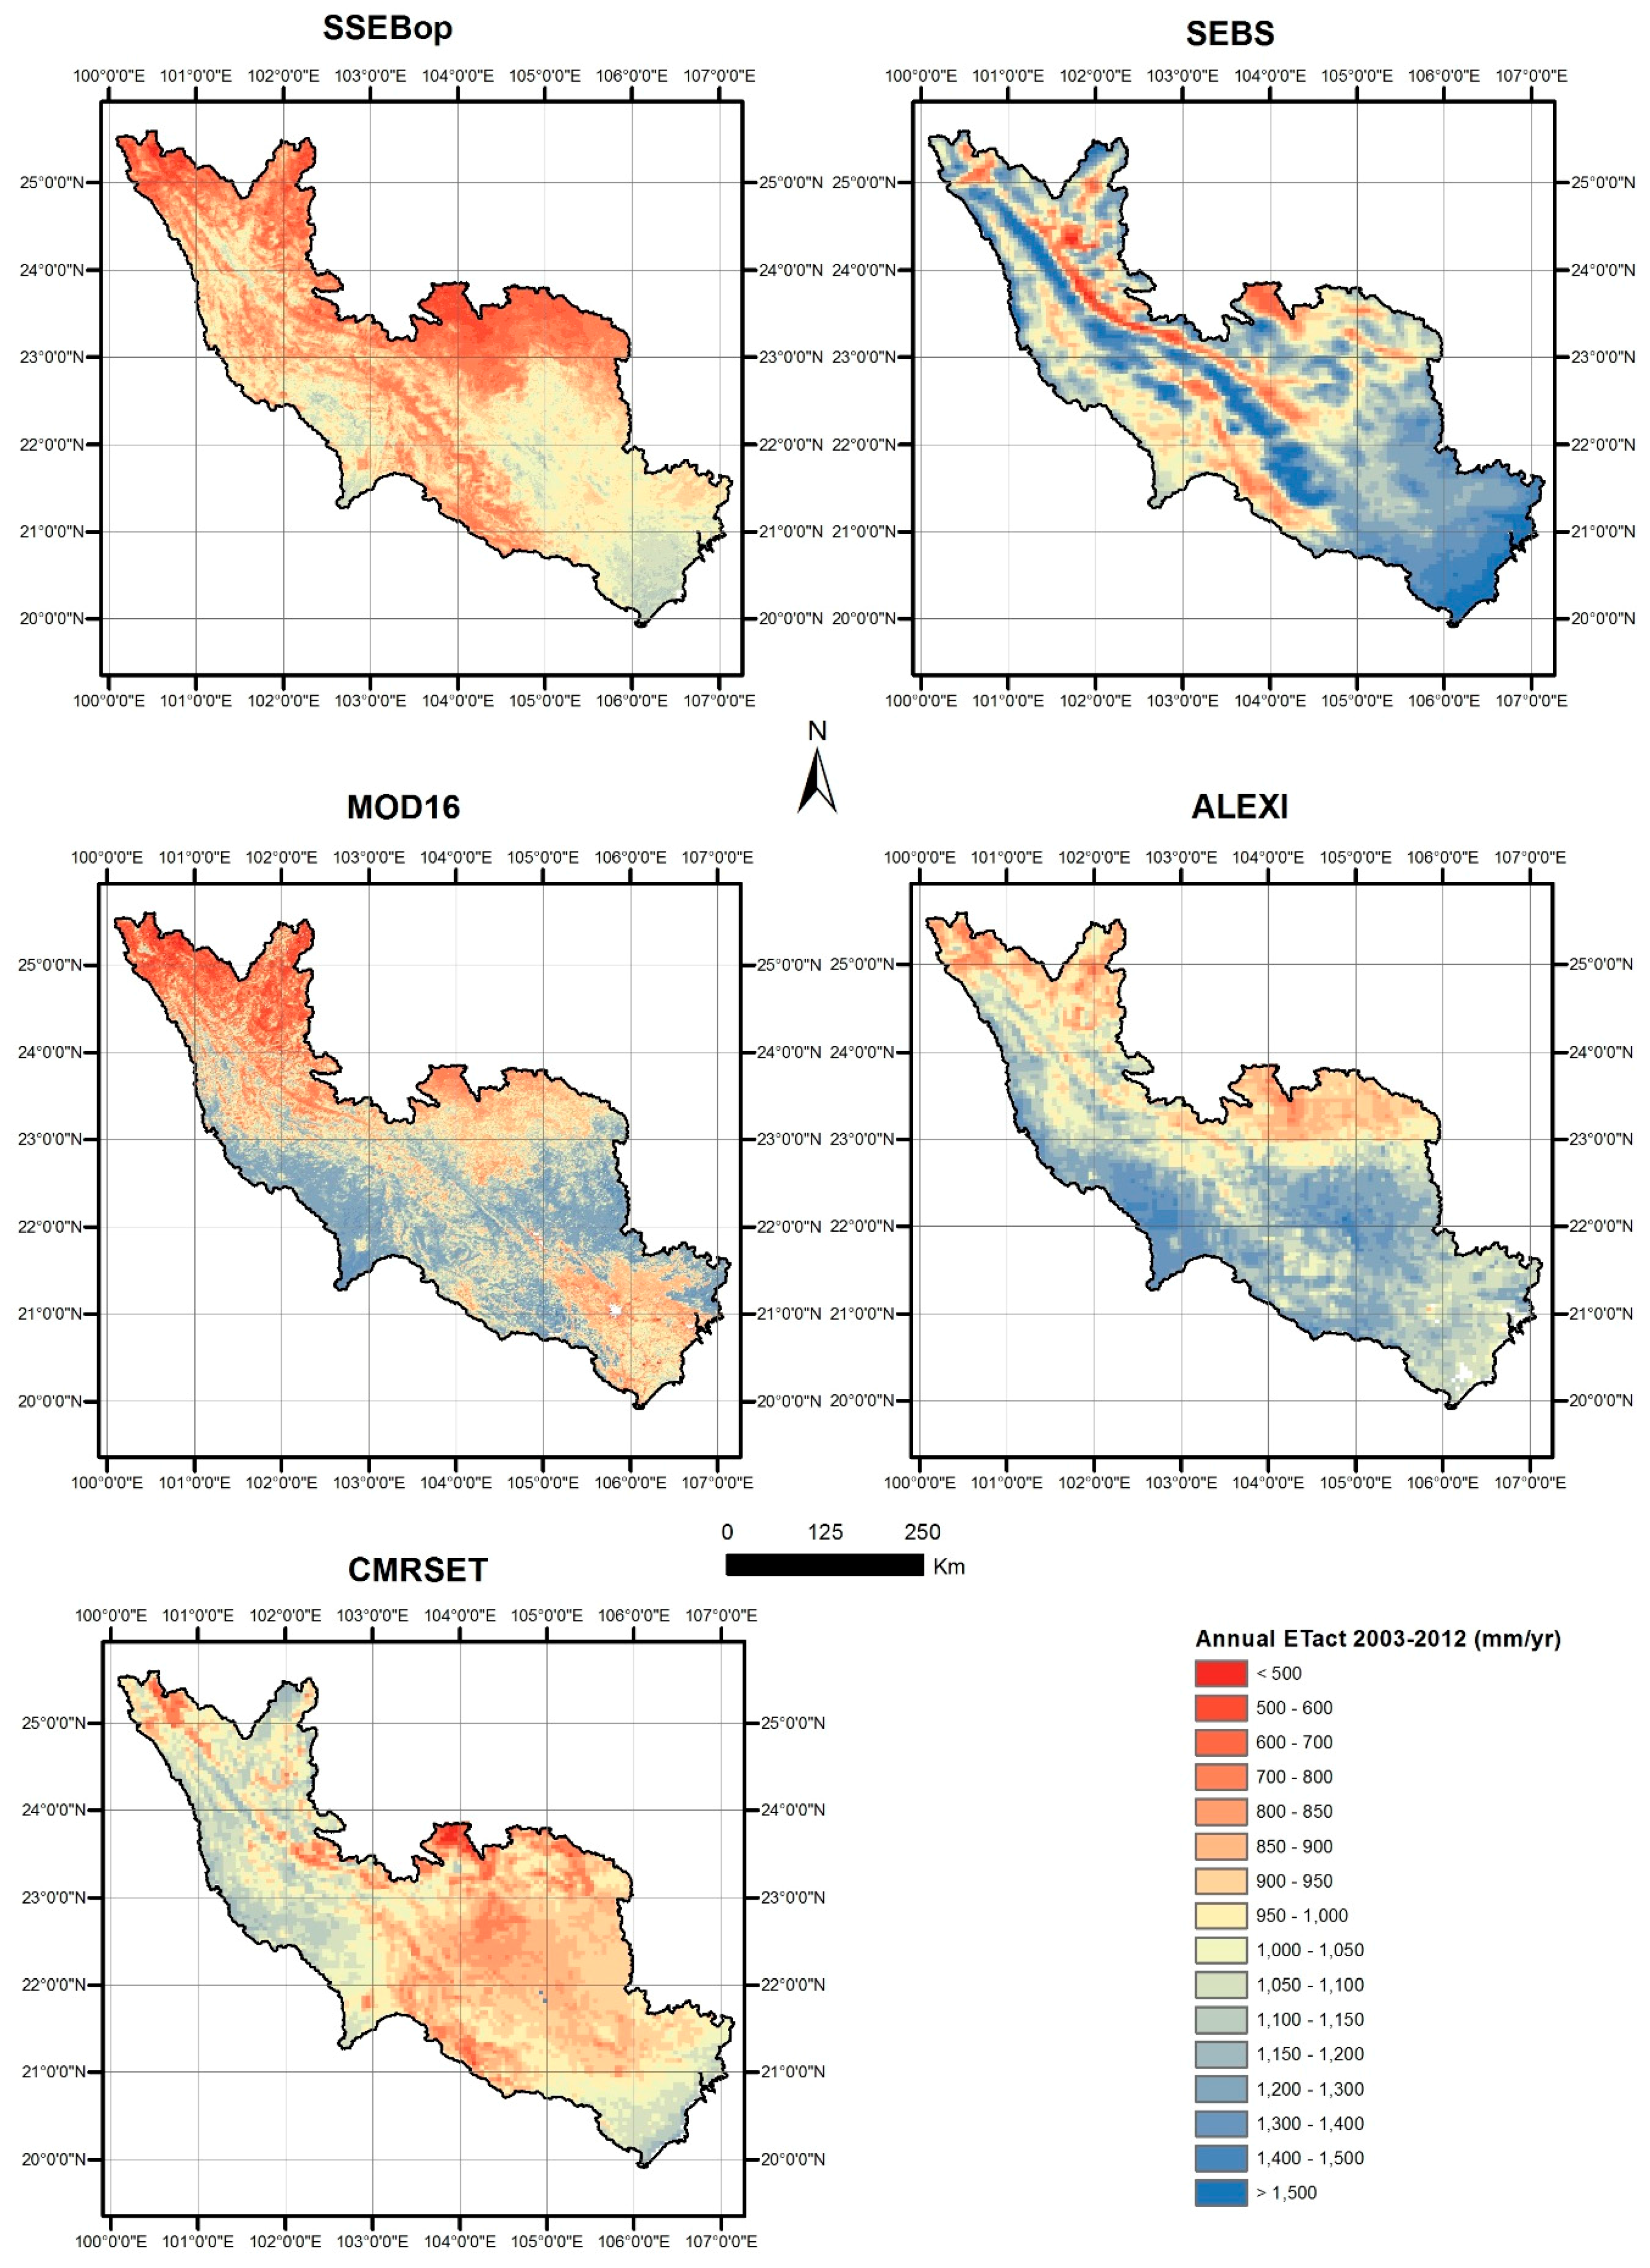
It was found that the SSEBop ETact product succeeds in closing the water balance of the Red River Basin with respect to TRMM rainfall and longer-term streamflow records, while the other products seem to have a tendency to overestimate ETact. The range of average annual ETact values according to different products is found to be rather large (268 mm/year) and illustrates the need for a thorough comparison. For areas with frequent cloud cover, a part of this range is likely attributed to the various ways in which the ETact algorithms deal with cloud-covered skies and data gaps. The observed difference between the individual models is somewhat inconsistent with the very low errors in satellite-derived ETact that were found in the review by Karimi and Bastiaanssen [12], which illustrates the current disparity between region-specific ET
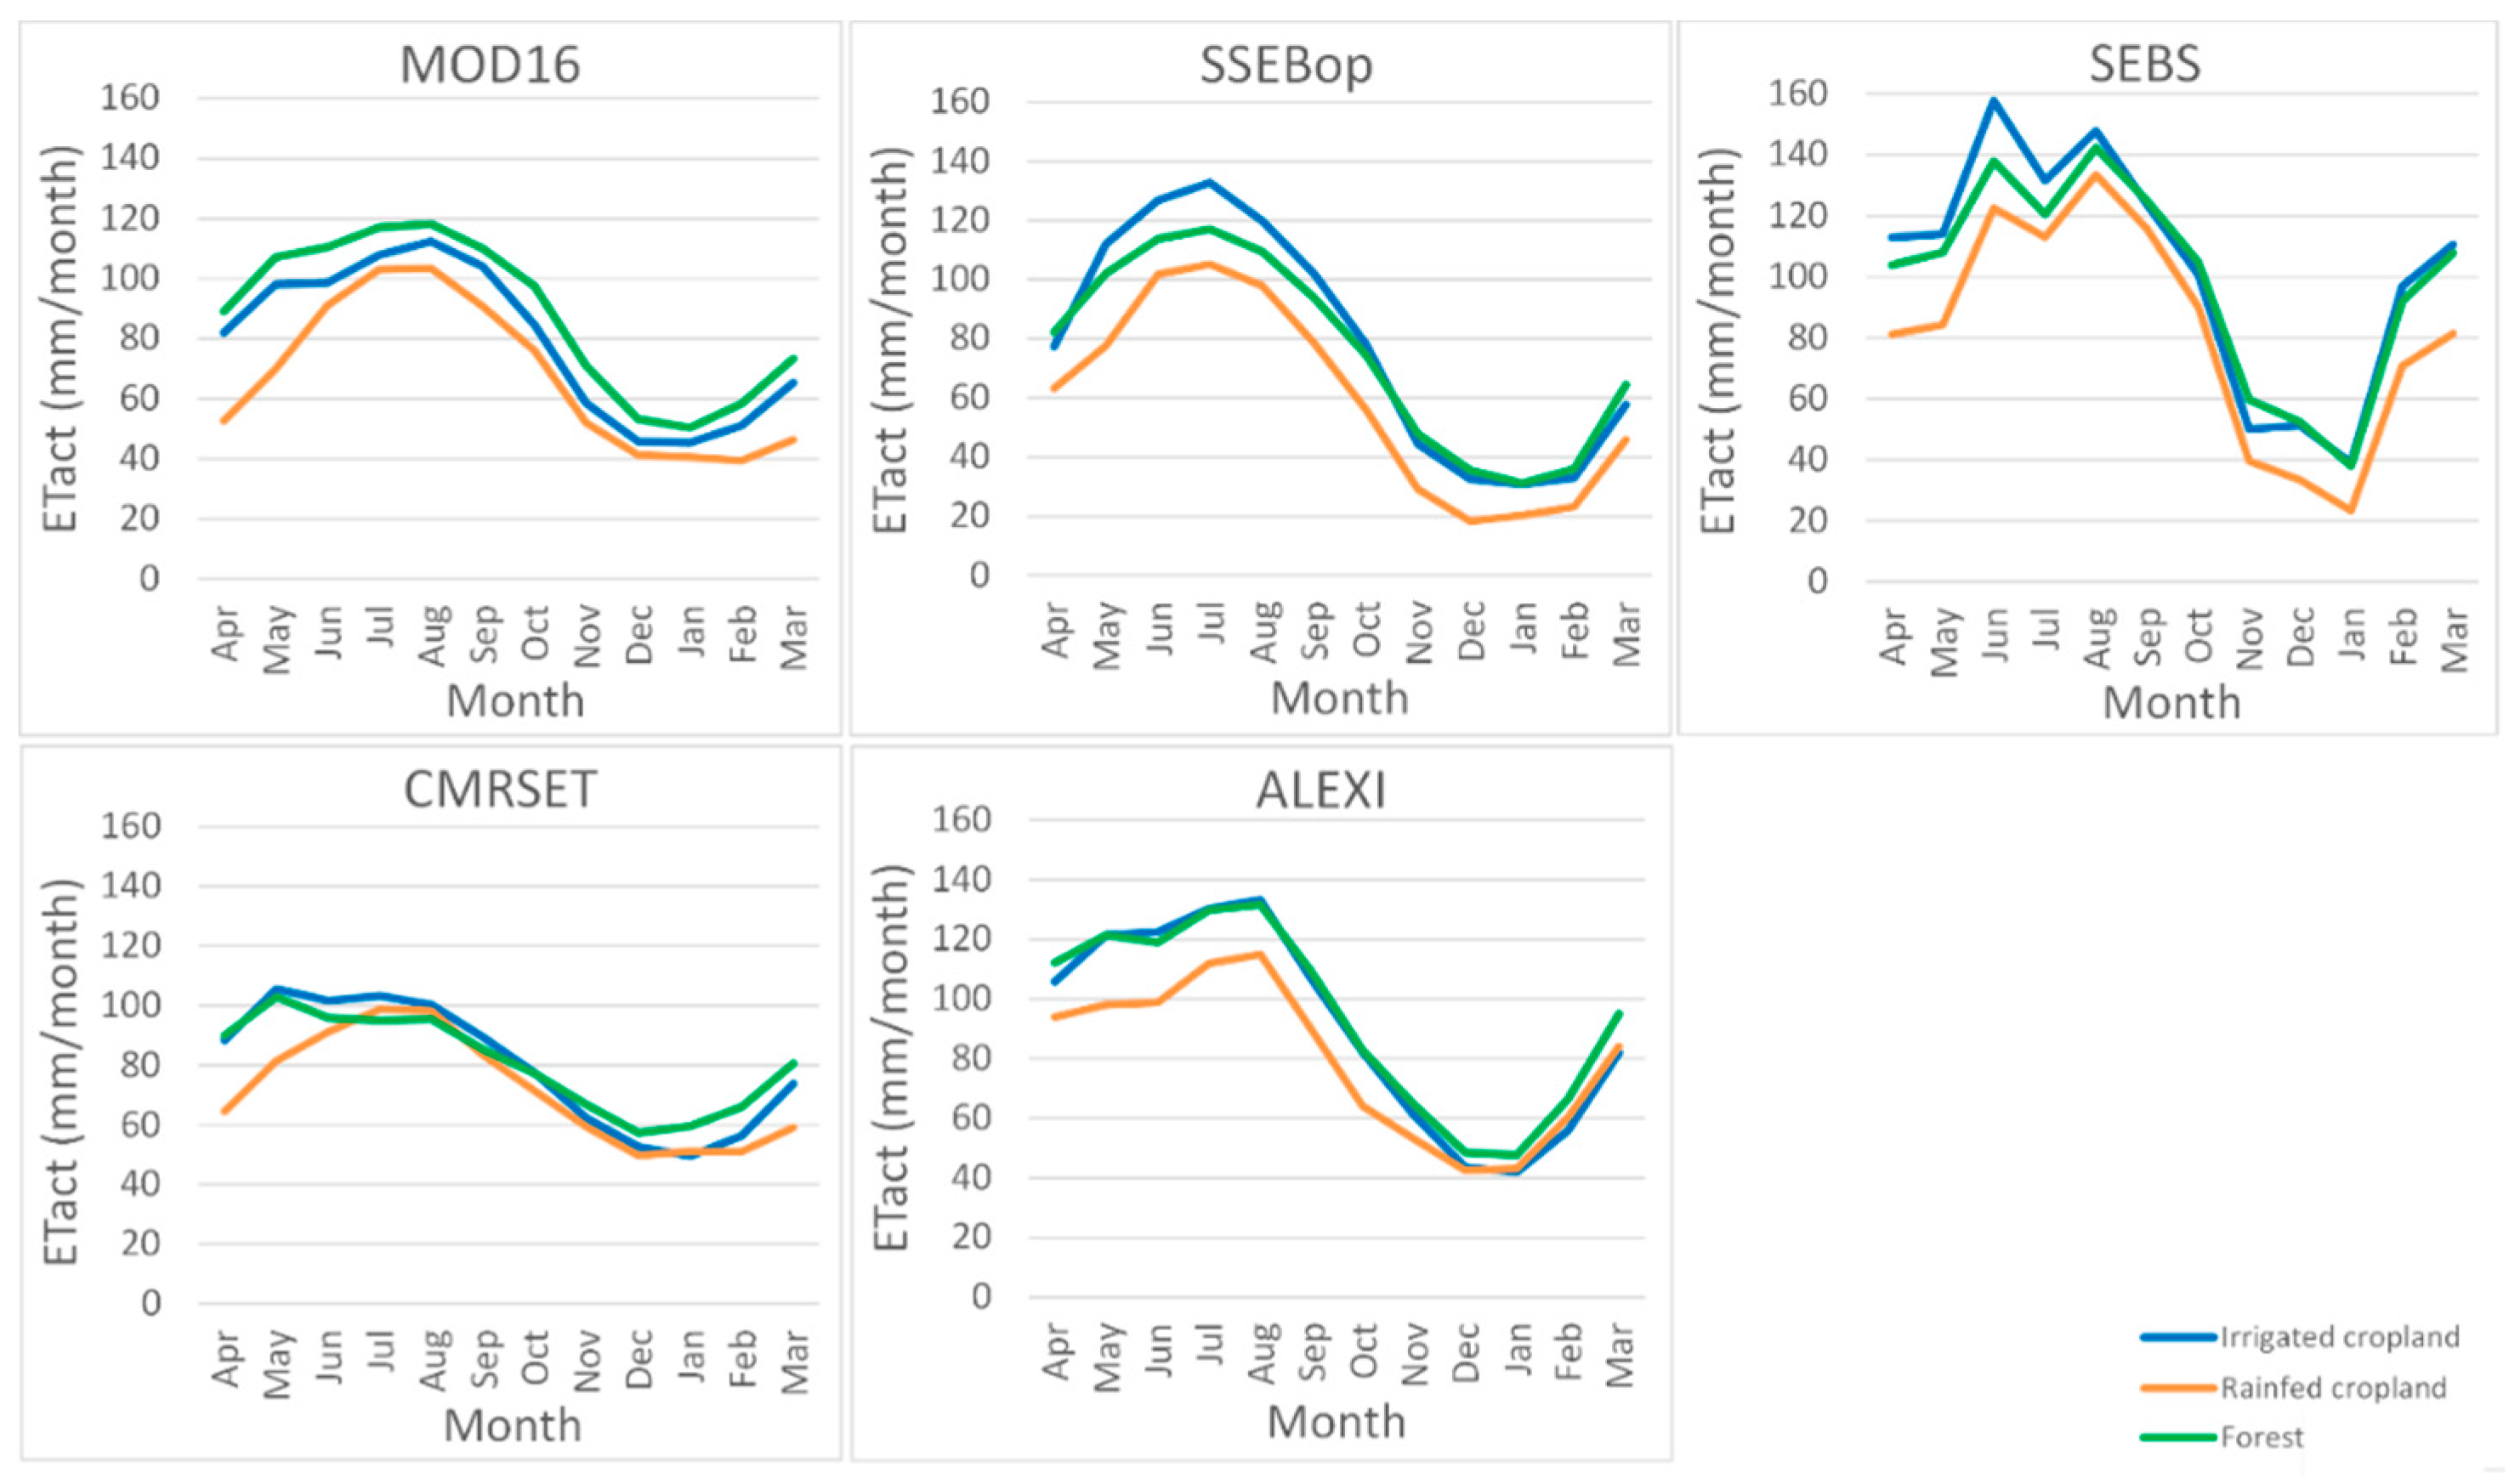
act estimate with opportunities for parameter-tuning and extractions from global datasets. It was found that for the Red River Basin spatial patterns of MOD16, SSEBop and ALEXI are similar, and this finding has been used to compute the areal ETact patterns from these three ETact products with equal weight. The fundamental differences between a relatively simple, largely LST-based model (SSEBop), an algorithm with more advanced physics incorporating temporal LST variability and a separation between evaporation and transpiration (ALEXI), and a method strongly reliant on LAI (MOD16), support the assumption that the selected models complement each other in terms of performance over a heterogeneous terrain. The consistency between satellite-derived Psur and measured Q in terms of both inter- and intra-annual variability, as well as their agreement for individual subcatchments, put confidence in the constructed ensemble ETact maps.
Previous studies in other basins have yielded differing outcomes regarding the relative performance of the respective ETact algorithms. Therefore, the appropriate choice of models for basin-scale normalization is expected to vary from basin to basin. In future studies, depending on the properties of the river basin at hand, different types of ensemble products may be suitable. It is advised that future research focuses on reviewing the strengths and weaknesses of the ETact GSDPs with respect to different LULC types and climate zones, with the aim to achieve a reliable satellite-derived ETact estimation on the global scale. When doing so, the uncertainties associated with each of the components of the water balance, including streamflow records, should receive sufficient attention. It should be noted that the ETact products applied in this research are in differing stages of development and substantial progress is to be expected in the next few years. For example, future versions of the ALEXI product will implement microwave-based LST [86] to provide estimates of ETact over all-sky conditions which is particularly important over the Red River basin during persistently cloudy periods. This use of microwave LST will help constrain estimates of ETact during such periods, which currently rely on gap-filling techniques with high uncertainty and are likely responsible for some of the overestimation of ETact seen in this study.
Analyses of global remote sensing products provide a valuable first outlook on the main hydrological processes within a river basin, especially after verification against the longer term total river outflow to ensure mass balance and consistency. Hydrological models are capable of providing complementary information, for example on non-linear sub-soil flow processes that determine runoff, infiltration, storage change, percolation and recharge. These processes govern the partitioning of rainfall surplus into groundwater and surface water. Models also facilitate analyses on a daily time scale, for which only a few ETact GSDPs are currently available. It is already common practice to use satellite-derived information, in particular P and LULC, as inputs to hydrological models. However, results of remote sensing-based quantifications of monthly ETact, Psur and ΔS, as well as multi-annual Q can also be used to train and constrain hydrological models and water management decision tools. Examples are already available in which remotely sensed ETact is used to constrain hydrological models, or for calibration purposes [87,88,89,90,91,92,93]. P minus ETact appears to be highly correlated with the root zone storage capacity [36]. By using satellite-derived information as a reality check, model performance can be improved. This is in particular relevant in areas with abundant water withdrawals, which require a lot of assumptions to simulate but are implicitly included in remotely sensed ETact [94].
Currently, much attention goes out to the development of global hydrological models (GHMs). Several reviews of the current state of art were recently published [95,96,97]. There are even ongoing attempts to create the first operational, hyper-resolution GHM [98]. Integration with remote sensing is identified as one of the promising trends in GHMs to reduce uncertainties [97]. The latest generation of GHMs is capable of spatially explicit assessments of the consumed fraction of applied irrigation water, thus no longer requiring an estimate of efficiencies as input [99,100]. However, these models still quantify water withdrawals for irrigation by supplying water until optimal growing conditions are achieved, an approach that is likely to lead to an overestimation of withdrawals [101]. Alternatively, non-physically based statistical methods are used to quantify water withdrawals for different water using sectors [102,103]. With ETact maps now readily available on the global scale, it is a logical next step to start incorporating these products in GHMs, either as model constraints or in the calibration procedure. This could lead to a more realistic representation of withdrawals [101,104,105], and therefore of non-consumed water and reuse.

5. Conclusions

This paper demonstrates how an integration of readily available global satellite-derived data products can shed light on river basin hydrology. With the availability of rainfall (P), land use/land cover (LULC) and the newly available actual evapotranspiration (ETact) data on the global scale, such analyses can now be performed for all river basins as pre-analyses to numerical hydrology studies. The consistency between different P and ETact products and downstream river discharge should first be evaluated by applying the law of mass conservation on the multi-annual scale. Even for a challenging basin in terms of atmospheric conditions such as the Red River Basin, satisfactory and meaningful conclusions were drawn. Based of 102.6 km3, of which only 29% is generated in China. Forests are the main water producer, while also irrigated cropland does not consume water on the annual scale. In addition, it proved possible to model monthly storage changes solely based on satellite derived P and ETact. The ratio of streamflow (Q) over rainfall surplus (Psur) was found to increase steadily during the rainy season, signifying the importance of saturation excess processes in runoff generation. This is a first step into determining the partitioning between fast surface runoff and slow groundwater runoff.
Although our comparison for the Red River shows that the range between values of individual evapotranspiration products is still substantial, it is concluded that there is a large potential for applying monthly remotely sensed ETact, Psur, storage changes and multi-annual Q to constrain or calibrate hydrological models. This facilitates quantification of hydrological processes that take place on the daily or weekly time scale, or processes that cannot be assessed by remote sensing alone, such as withdrawals, non-consumed water and reuse. Further studies are required to examine the performance of the ETact products for different geographical regions, climate zones and land use types, in order to ultimately facilitate the coupling between these products and global hydrological models. In the meantime, it is concluded that the proposed methodology based on spatial correlations among individual ETact products and absolute calibration of longer-term P − Q works well for the conditions encountered in the Red River basin.

Acknowledgments

Part of this research was funded by the CGIAR Water Land and Ecosystems (WLE) MK27 program. Funds for publishing in open access were provided by the Open Access Fund of Delft University of Technology. The authors are grateful to the following persons and institutes for making available the global ETact products: Albert van Dijk (University of Australia), Juan Pablo Guerschman (CSIRO) and Jorge Pena Arancibia (CSIRO) for CMRSET, and Xuelong Chen (ITC) for SEBS. Hydrometeorological data were acquired in the framework of the project Demonstration of Remote Sensing Information for Integrated Reservoir Management in the Red River Basin in Northern Vietnam, funded by the Government of The Netherlands. The authors are thankful to Dung Duc Le and Duc Anh Nguyen of VINWATER for their assistance in acquiring, processing and interpreting the hydrometeorological data, and to Lan Thanh Ha of IWRP for his valuable inputs.

Author Contributions

G.W.H. Simons and W.G.M. Bastiaanssen conceived and designed the research; G.W.H. Simons analyzed the data; G.W.H. Simons and W.G.M. Bastiaanssen wrote the paper with valuable inputs from L. A. Ngo regarding regional the hydrological context and interpretation of results; and C.R. Hain, M.C. Anderson and G.B. Senay contributed to algorithm development, processing of ETact data, and data quality analysis.

Conflicts of Interest

The authors declare no conflict of interest.

Appendix A. Rainfall Data

Table A1. Metadata of rainfall stations.
Station NameLatitudeLongitudeCountryElevation (m)Source
1Ba Vi21.10105.43Vietnam20NCHMF
2Bac Can22.15105.83Vietnam176GSOD
3Bac Ha22.53104.28Vietnam107NCHMF
4Bac Me22.73105.37Vietnam380NCHMF
5Bac Quang22.50104.87Vietnam NCHMF
6Bac Yen21.25104.42Vietnam65NCHMF
7Ban Cung20.75105.05Vietnam NCHMF
8Bao Lac22.95105.67Vietnam283NCHMF
9Binh Lu22.37103.61Vietnam636NCHMF
10Bounneua21.63101.88Lao PDR923GSOD
11Cao Bang22.67106.25Vietnam260GSOD
12Chiem Hoa22.15105.27Vietnam56NCHMF
13Cho Ra22.45105.72Vietnam210NCHMF
14Chuxiong25.02101.52China1773GSOD
15Co Noi21.13104.15Vietnam704NCHMF
16Cuc Phuong20.23105.72Vietnam NCHMF
17Dali25.70100.18China1992GSOD
18Dien Bien21.35103.00Vietnam NCHMF
19Dinh Hoa21.90105.63Vietnam NCHMF
20Guangnan24.07105.07China1251GSOD
21Ha Dong20.97105.77Vietnam8NCHMF
22Ha Giang22.82104.97Vietnam113NCHMF
23Ha Noi21.02105.80Vietnam6NCHMF
24Ham Yen22.07105.03Vietnam54NCHMF
25Hoa Binh20.82105.33Vietnam23NCHMF
26Hoang Su Phi22.75104.68Vietnam NCHMF
27Jiangcheng22.62101.82China1121GSOD
28Lai Chau22.05103.15Vietnam244NCHMF
29Lang Son21.83106.77Vietnam258GSOD
30Lao Cai22.50103.97Vietnam112NCHMF
31Lincang23.95100.22China1503GSOD
32Longzhou22.37106.75China129GSOD
33Luy Cen22.58104.40Vietnam133NCHMF
34Mai Chau20.65105.05Vietnam160NCHMF
35Mengzi23.38103.38China1302GSOD
36Moc Chau20.83104.68Vietnam958NCHMF
37Mu Cang Chai21.85104.08Vietnam975NCHMF
38Muong Cha21.97102.87Vietnam487NCHMF
39Muong Nhe22.18102.45Vietnam500NCHMF
40Muong Te22.37102.83Vietnam310NCHMF
41Nam Dinh20.43106.15Vietnam3NCHMF
42Nam Giang22.26103.17Vietnam NCHMF
43Nam Muc21.88103.30Vietnam494NCHMF
44Napo23.30105.95China794GSOD
45Nguyen Binh21.84104.65Vietnam NCHMF
46Nho Quan20.32105.75Vietnam12NCHMF
47Ninh Binh20.25105.98Vietnam2NCHMF
48Phu Ho21.45105.23Vietnam NCHMF
49Phu Lien20.80106.63Vietnam119GSOD
50Phu Ly20.52105.92Vietnam3NCHMF
51Phu Yen21.27104.63Vietnam182NCHMF
52Quynh Nhai21.85103.57Vietnam802NCHMF
53Sam Neua20.42104.07Lao PDR1000GSOD
54Sapa22.35103.82Vietnam1570NCHMF
55Simao22.77100.98China1303GSOD
56Sin Ho22.37103.23Vietnam1529NCHMF
57Son La21.33103.90Vietnam676NCHMF
58Son Tay21.13105.50Vietnam15NCHMF
59Tam Dao20.90104.45Vietnam NCHMF
60Tam Duong22.42103.48Vietnam900NCHMF
61Thai Nguyen21.60105.83Vietnam32GSOD
62Than Uyen21.95103.88Vietnam NCHMF
63Thanh Hoa19.80105.78Vietnam7GSOD
64Thanh Son21.19105.16Vietnam50NCHMF
65Thuan Chau21.43103.68Vietnam652NCHMF
66Tuan Giao21.58103.42Vietnam570NCHMF
67Tuyen Quang21.82105.22Vietnam81NCHMF
68Van Chan22.05104.15Vietnam257NCHMF
69Viengsay20.42104.23Lao PDR913GSOD
70Viet Tri21.27105.42Vietnam17NCHMF
71Vinh Yen22.27104.88Vietnam NCHMF
72Wujiaba25.02102.68China1892GSOD
73Yen Bai21.70104.87Vietnam NCHMF
74Yen Chau21.07104.27Vietnam59NCHMF
75Yuanjiang23.60101.98China398GSOD
76Yuanmou25.73101.87China1120GSOD
Figure A1. Spatial distribution of TRMM pixels with one (red) or two (green) rainfall gauges.
Remotesensing 08 00279 g012
Figure A2. Comparison of TRMM data with measured monthly rainfall averaged per pixel for gauges in pixels with multiple stations. The red line gives the linear regression best fit with 0 intercept.
Remotesensing 08 00279 g013

Appendix B. Maps of Annual ETact in the Red River Basin (2003–2012)

Figure A3. Overview of annual ETact in the Red River Basin according to five different GSDPs.
Remotesensing 08 00279 g014

Appendix C. Coefficient of Variation in Annual Average ETact

Figure A4. Map of the coefficient of variation (CV) of annual average ETact based on five different products.
Remotesensing 08 00279 g015

Appendix D. Streamflow Data

Table A2. Metadata of streamflow stations.
Station NameLatitudeLongitudeCountrySource
1Muong Te22.47102.62VietnamNCHMF
2Hoa Binh20.81105.32VietnamNCHMF
3Lao Cai22.50103.95VietnamNCHMF
4Yen Bai21.70104.88VietnamNCHMF
5Bac Me22.73105.37VietnamNCHMF
6Vu Quang21.57105.25VietnamNCHMF
7Son Tay21.15105.50VietnamNCHMF
Figure A5. Runoff in million cubic meters (MCM) generated per hydrological year in each of the subbasins, according to streamflow (Q) records.
Remotesensing 08 00279 g016

References

  1. Haddeland, I.; Heinke, J.; Biemans, H.; Eisner, S.; Flörke, M.; Hanasaki, N.; Konzmann, M.; Ludwig, F.; Masaki, Y.; Schewe, J.; et al. Global water resources affected by human interventions and climate change. PNAS 2014, 111, 3251–3256. [Google Scholar] [CrossRef] [PubMed]
  2. Wada, Y.; Bierkens, M.F.P. Sustainability of global water use: Past reconstruction and future projections. Environ. Res. Lett. 2014, 9, 104003. [Google Scholar] [CrossRef]
  3. Gleeson, T.; Wada, Y.; Bierkens, M.F.P.; van Beek, L.P.H. Water balance of global aquifers revealed by groundwater footprint. Nature 2012, 488, 197–200. [Google Scholar] [CrossRef] [PubMed]
  4. Simons, G.W.H.; Bastiaanssen, W.G.M.; Immerzeel, W.W. Water reuse in river basins with multiple users: A literature review. J. Hydrol. 2015, 522, 558–571. [Google Scholar] [CrossRef]
  5. Droogers, P.; Bouma, J. Simulation modelling for water governance in basins. Int. J. Water Resour. Dev. 2014, 30, 1–20. [Google Scholar] [CrossRef]
  6. Hoekstra, A.Y.; Chapagain, A.K.; Aldaya, M.M.; Mekonnen, M.M. The Water Footprint Assessment Manual; Earthscan Ltd: London, UK, 2011. [Google Scholar]
  7. Karimi, P.; Bastiaanssen, W.G.M.; Molden, D. Water Accounting Plus (WA+)—A water accounting procedure for complex river basins based on satellite measurements. Hydrol. Earth Syst. Sci. 2013, 17, 2459–2472. [Google Scholar] [CrossRef]
  8. United Nations. SEEA-Water System of Environmental-Economic Accounting for Water; United Nations: New York, NY, USA, 2012. [Google Scholar]
  9. Ahmad, M.U.D.; Bastiaanssen, W.G.M. Retrieving soil moisture storage in the unsaturated zone using satellite imagery and bi-annual phreatic surface fluctuations. Irrig. Drain. Syst. 2003, 17, 141–161. [Google Scholar] [CrossRef]
  10. Kidd, C.; Levizzani, V. Status of satellite precipitation retrievals. Hydrol. Earth Syst. Sci. 2011, 15, 1109–1116. [Google Scholar] [CrossRef]
  11. Anderson, M.C.; Allen, R.G.; Morse, A.; Kustas, W.P. Use of Landsat thermal imagery in monitoring evapotranspiration and managing water resources. Remote Sens. Environ. 2012, 122, 50–65. [Google Scholar] [CrossRef]
  12. Karimi, P.; Bastiaanssen, W.G.M. Spatial evapotranspiration, rainfall and land use data in water accounting—Part 1: Review of the accuracy of the remote sensing data. Hydrol. Earth Syst. Sci. 2015, 19, 507–532. [Google Scholar] [CrossRef]
  13. Asadullah, A.; McIntyre, N.; Kigobe, M. Evaluation of five satellite products for estimation of rainfall over Uganda/Evaluation de cinq produits satellitaires pour l’estimation des précipitations en Ouganda. Hydrol. Sci. J. 2008, 53, 1137–1150. [Google Scholar] [CrossRef]
  14. Stisen, S.; Sandholt, I. Evaluation of remote-sensing-based rainfall products through predictive capability in hydrological runoff modelling. Hydrol. Process. 2010, 24, 879–891. [Google Scholar] [CrossRef]
  15. Hessels, T.M. Comparison and Validation of Several Open Access Remotely Sensed Rainfall Products for the Nile Basin. Master’s Thesis, Delft University of Technology, Delft, The Netherlands, 2015. [Google Scholar]
  16. Khandu; Awange, J.L.; Forootan, E. An evaluation of high-resolution gridded precipitation products over Bhutan (1998–2012). Int. J. Climatol. 2015, 36, 1067–1087. [Google Scholar] [CrossRef]
  17. Liu, J.; Duan, Z.; Jiang, J.; Zhu, A. Evaluation of three satellite precipitation products TRMM 3B42, CMORPH, and PERSIANN over a Subtropical Watershed in China. Adv. Meteorol. 2015. [Google Scholar] [CrossRef]
  18. Toté, C.; Patricio, D.; Boogaard, H.; van der Wijngaart, R.; Tarnavsky, E.; Funk, C. Evaluation of satellite rainfall estimates for drought and flood monitoring in Mozambique. Remote Sens. 2015, 7, 1758–1776. [Google Scholar] [CrossRef]
  19. Mora, B.; Tsendbazar, N.E.; Herold, M.; Arino, O. Global land cover mapping: Current status and future trends. In Land Use and Land Cover Mapping in Europe; Manakos, I., Braun, M., Eds.; Springer: Heidelberg, Germany, 2014; pp. 411–427. [Google Scholar]
  20. Tsendbazar, N.E.; de Bruin, S.; Herold, M. Assessing global land cover reference datasets for different user communities. ISPRS J. Photogramm. Remote Sens. 2014, 103, 93–114. [Google Scholar] [CrossRef]
  21. Kalma, J.D.; McVicar, T.R.; McCabe, M.F. Estimating land surface evaporation: A review of methods using remotely sensed surface temperature data. Surv. Geophys. 2008, 29, 421–469. [Google Scholar] [CrossRef]
  22. Mu, Q.; Zhao, M.; Running, S.W. MODIS Global Terrestrial Evapotranspiration (ET) Product (MOD16A2/A3)—Algorithm Theoretical Basis Document Collection 5; NASA: Washington, DC, USA, 2013.
  23. Senay, G.B.; Bohms, S.; Singh, R.K.; Gowda, P.H.; Velpuri, N.M.; Alemu, H.; Verdin, J.P. Operational evapotranspiration mapping using remote sensing and weather datasets: A new parameterization for the SSEB approach. J. Am. Water Resour. Assoc. 2013, 49, 577–591. [Google Scholar] [CrossRef]
  24. Guerschman, J.P.; Van Dijk, A.I.J.M.; Mattersdorf, G.; Beringer, J.; Hutley, L.B.; Leuning, R.; Pipunic, R.C.; Sherman, B.S. Scaling of potential evapotranspiration with MODIS data reproduces flux observations and catchment water balance observations across Australia. J. Hydrol. 2009, 369, 107–119. [Google Scholar] [CrossRef]
  25. Chen, X.; Su, Z.; Ma, Y.; Yang, K.; Wen, J.; Zhang, Y. An improvement of roughness height parameterization of the Surface Energy Balance System (SEBS) over the Tibetan plateau. J. Appl. Meteorol. Climatol. 2013, 52, 607–622. [Google Scholar] [CrossRef]
  26. Anderson, M.C.; Kustas, W.P.; Norman, J.M.; Hain, C.R.; Mecikalski, J.R.; Schultz, L.; González-Dugo, M.P.; Cammalleri, C.; D’Urso, G.; Pimstein, A.; et al. Mapping daily evapotranspiration at field to continental scales using geostationary and polar orbiting satellite imagery. Hydrol. Earth Syst. Sci. 2011, 15, 223–239. [Google Scholar] [CrossRef] [Green Version]
  27. Velpuri, N.M.; Senay, G.B.; Singh, R.K.; Bohms, S.; Verdin, J.P. A comprehensive evaluation of two MODIS evapotranspiration products over the conterminous United States: Using point and gridded FLUXNET and water balance ET. Remote Sens. Environ. 2013, 139, 35–49. [Google Scholar] [CrossRef]
  28. Alemu, H.; Senay, G.; Kaptue, A.; Kovalskyy, V. Evapotranspiration variability and its association with vegetation dynamics in the Nile Basin, 2002–2011. Remote Sens. 2014, 6, 5885–5908. [Google Scholar] [CrossRef]
  29. Hu, G.; Jia, L.; Menenti, M. Comparison of MOD16 and LSA-SAF MSG evapotranspiration products over Europe for 2011. Remote Sens. Environ. 2015, 156, 510–526. [Google Scholar] [CrossRef]
  30. Hu, G.; Jia, L. Monitoring of evapotranspiration in a Semi-Arid Inland River Basin by combining microwave and optical remote sensing observations. Remote Sens. 2015, 7, 3056–3087. [Google Scholar] [CrossRef]
  31. Yilmaz, M.T.; Anderson, M.C.; Zaitchik, B.; Hain, C.R.; Crow, W.T.; Ozdogan, M.; Chun, J.A.; Evans, J. Comparison of prognostic and diagnostic surface flux modeling approaches over the Nile River basin. Water Resour. Res. 2014, 50, 386–408. [Google Scholar] [CrossRef]
  32. Trambauer, P.; Dutra, E.; Maskey, S.; Werner, M.; Pappenberger, F.; Van Beek, L.P.H.; Uhlenbrook, S. Comparison of different evaporation estimates over the African continent. Hydrol. Earth Syst. Sci. 2014, 18, 193–212. [Google Scholar] [CrossRef] [Green Version]
  33. Singh, R.; Senay, G. Comparison of four different energy balance models for estimating evapotranspiration in the Midwestern United States. Water 2015, 8. [Google Scholar] [CrossRef]
  34. Bhattarai, N.; Shaw, S.B.; Quackenbush, L.J.; Im, J.; Niraula, R. Evaluating five remote sensing based single-source surface energy balance models for estimating daily evapotranspiration in a humid subtropical climate. Int. J. Appl. Earth Obs. Geoinf. 2016, 49, 75–86. [Google Scholar] [CrossRef]
  35. Bastiaanssen, W.; Karimi, P.; Rebelo, L.-M.; Duan, Z.; Senay, G.; Muttuwatte, L.; Smakhtin, V. Earth observation based assessment of the water production and water consumption of Nile Basin agro-ecosystems. Remote Sens. 2014, 6, 10306–10334. [Google Scholar] [CrossRef]
  36. Wang-Erlandsson, L.; Bastiaanssen, W.G.M.; Gao, H.; Jägermeyr, J.; Senay, G.B.; Van Dijk, A.I.J.M.; Guerschman, J.P.; Keys, P.W.; Gordon, L.J.; Savenije, H.H.G. Global root zone storage capacity from satellite-based evaporation. Hydrol. Earth Syst. Sci. Discuss. 2016. [Google Scholar] [CrossRef]
  37. Hain, C.R.; Crow, W.T.; Anderson, M.C.; Yilmaz, M.T. Diagnosing neglected soil moisture source—Sink processes via a thermal infrared—Based two-source energy balance model. J. Hydrometeorol. 2015, 16, 1070–1086. [Google Scholar] [CrossRef]
  38. Li, Y.; He, D.; Ye, C. Spatial and temporal variation of runoff of red river basin in Yunnan. J. Geogr. Sci. 2008, 18, 308–318. [Google Scholar] [CrossRef]
  39. Le, T.P.Q.; Seidler, C.; Kändler, M.; Tran, T.B.N. Proposed methods for potential evapotranspiration calculation of the Red River basin (North Vietnam). Hydrol. Process. 2012, 26, 2782–2790. [Google Scholar] [CrossRef]
  40. Van Diep, N.; Khanh, N.H.; Son, N.M.; Van Hanh, N.; Huntjens, P. Integrated water resource management in the Red River Basin—Problems and cooperation opportunity. In Proceedings of the CAIWA International Conference on Adaptive and Integrated Water Management, Basel, Switzerland, 2–10 September 2007.
  41. Zhongyan, H. Changes of dry-wet climate in the dry season in Yunnan (1961–2007). Adv. Clim. Chang. Res. 2012, 2, 49–54. [Google Scholar]
  42. Kattelus, M.; Kummu, M.; Keskinen, M.; Salmivaara, A.; Varis, O. China’s southbound transboundary river basins: A case of asymmetry. Water Int. 2014, 40, 113–138. [Google Scholar] [CrossRef]
  43. Castelletti, a.; Pianosi, F.; Quach, X.; Soncini-Sessa, R. Assessing water reservoirs management and development in northern Vietnam. Hydrol. Earth Syst. Sci. 2012, 16, 189–199. [Google Scholar] [CrossRef]
  44. Devienne, S. Red River Delta: Fifty years of change. Moussons 2006, 9–10, 255–280. [Google Scholar] [CrossRef]
  45. Luu, T.N.M.; Garnier, J.; Billen, G.; Orange, D.; Némery, J.; Le, T.P.Q.; Tran, H.T.; Le, L.A. Hydrological regime and water budget of the Red River Delta (Northern Vietnam). J. Asian Earth Sci. 2010, 37, 219–228. [Google Scholar] [CrossRef]
  46. Klapetek, V.; Havrland, B.; Mazancova, J. Comparison of lowland rice irrigation systems in the red river basin (vietnam). Agric. Trop. Subtrop. 2010, 43, 113–118. [Google Scholar]
  47. Van Le, C. Return Flow and Reuse of Drainage Water in a Rice-Based Irrigation and Drainage Area in the Red River Basin, Vietnam; Faculty of Science, University of Copenhagen: Copenhagen, Denmark, 2012. [Google Scholar]
  48. Bui, D.D.; Kawamura, A.; Tong, T.N.; Amaguchi, H.; Nakagawa, N.; Iseri, Y. Identification of aquifer system in the whole Red River Delta, Vietnam. Geosci. J. 2011, 15, 323–338. [Google Scholar] [CrossRef]
  49. Vu, D.V.; Ouillon, S.; Tran, D.T.; La, V.C. Impact of the Hoa Binh Dam (Vietnam) on water and sediment budgets in the Red River basin and delta. 2014, 18, 333–370. [Google Scholar] [CrossRef]
  50. Gong, P.; Wang, J.; Yu, L.; Zhao, Y.; Zhao, Y.; Liang, L.; Niu, Z.; Huang, X.; Fu, H.; Liu, S.; et al. Finer resolution observation and monitoring of global land cover: First mapping results with Landsat TM and ETM+ data. Int. J. Remote Sens. 2013, 34, 2607–2654. [Google Scholar] [CrossRef]
  51. Chen, J.; Chen, J.; Liao, A.; Cao, X.; Chen, L.; Chen, X.; He, C.; Han, G.; Peng, S.; Lu, M.; et al. Global land cover mapping at 30m resolution: A POK-based operational approach. ISPRS J. Photogramm. Remote Sens. 2015, 103, 7–27. [Google Scholar] [CrossRef]
  52. Defourny, P.; Bicheron, P.; Brockmann, C.; Bontemps, S.; Van Bogaert, E.; Arino, O. The first 300 m global land cover map for 2005 using ENVISAT MERIS time series: A product of the GlobCover system. Proc. ISRSE 2009, 22, 1–4. [Google Scholar]
  53. Tateishi, R.; Hoan, N.T.; Kobayashi, T.; Alsaaideh, B.; Tana, G.; Phong, D.X. Production of global land cover data—GLCNMO2008. J. Geogr. Geol. 2014, 6. [Google Scholar] [CrossRef]
  54. NASA’s Goddard Space Flight Center MODIS Data Products. Available online: http://modis.gsfc.nasa.gov/ (accessed on 23 March 2016).
  55. Yu, L.; Wang, J.; Gong, P. Improving 30 m global land-cover map FROM-GLC with time series MODIS and auxiliary data sets: A segmentation-based approach. Int. J. Remote Sens. 2013, 34, 5851–5867. [Google Scholar] [CrossRef]
  56. Vuolo, F.; Atzberger, C. Improving land cover maps in areas of disagreement of existing products using NDVI time series of MODIS—Example for Europe<BR>Verbesserung von Landbedeckungskarten in Gebieten widersprüchlicher Grundlagen mit Hilfe der NDVI-Zeitreihe von MODIS—B. Photogramm. Fernerkund. Geoinf. 2014, 2014, 393–407. [Google Scholar]
  57. Johnston, R.; Hoanh, C.T.; Lacombe, G.; Lefroy, R.; Pavelic, P.; Fry, C. Managing Water in Rainfed Agriculture in the Greater Mekong Subregione. Available online: http://agris.fao.org/agris-search/search.do?recordID=QL2013000139 (accessed on 23 March 2016).
  58. Nguyen, D.; Wagner, W.; Naeimi, V.; Cao, S. Rice-planted area extraction by time series analysis of ENVISAT ASAR WS data using a phenology-based classification approach: A case study for Red River Delta, Vietnam. ISPRS Int. Arch. Photogramm. Remote Sens. Spat. Inf. Sci. 2015, XL-7/W3, 77–83. [Google Scholar] [CrossRef]
  59. Bontemps, S.; Defourny, P.; van Bogaert, E.; Arino, O.; Kalogirou, V.; Perez, J.R. Globcover 2009: Products Desciption and Validation Report. Available online: http://www.citeulike.org/group/15400/article/12770349 (accessed on 23 March 2016).
  60. IWMI Irrigated Area Map: Asia. Available online: http://waterdata.iwmi.org/Applications/IRRA/ (accessed on 23 March 2016).
  61. Vietnam Red River Delta Irrigation Management: Incomplete Recognition of Local Institutional Innovations. Available online: http://agris.fao.org/agris-search/search.do?recordID=GB2013201092 (accessed on 23 March 2016).
  62. Turral, H.; Malano, H.; Chien, N.V.; Esum, R. Development and specification of a service agreement and operational rules for La Khe irrigation system, Ha Dong, Vietnam. Irrig. Drain. 2002, 51, 129–140. [Google Scholar] [CrossRef]
  63. Nguyen, T.H. Improving Water Security for the Future through IWRM and Better Water Governance in the Red—ThaiBinh river basin (Vietnam). Available online: http://www.tecniberia.es/jornadas/documentos/papers/13_nguyen thuy hang_paper.pdf (accessed on 23 March 2016).
  64. Huffman, G.J.; Bolvin, D.T. TRMM and Other Data Precipitation Data Set Documentation; NASA: Greenbelt, MD, USA, 2013.
  65. Funk, C.C.; Peterson, P.J.; Landsfeld, M.F.; Pedreros, D.H.; Verdin, J.P.; Rowland, J.D.; Romero, B.E.; Husak, G.J.; Michaelsen, J.C.; Verdin, A.P. A quasi-global precipitation time series for drought monitoring. US Geol. Surv. Data Ser. 2014, 832, 4. [Google Scholar]
  66. Joyce, R.J.; Janowiak, J.E.; Arkin, P.A.; Xie, P. CMORPH: A method that produces global precipitation estimates from passive microwave and infrared data at high spatial and temporal resolution. J. Hydrometeorol. 2004, 5, 487–503. [Google Scholar] [CrossRef]
  67. Liu, T.; Liu, L.; Luo, Y.; Lai, J. Simulation of groundwater evaporation and groundwater depth using SWAT in the irrigation district with shallow water table. Environ. Earth Sci. 2015, 74, 315–324. [Google Scholar] [CrossRef]
  68. Le, T.; Al-Juaidi, F.; Sharif, H. Hydrologic simulations driven by satellite rainfall to study the hydroelectric development impacts on river flow. Water 2014, 6, 3631–3651. [Google Scholar] [CrossRef]
  69. Cheema, M.J.M.; Bastiaanssen, W.G.M. Local calibration of remotely sensed rainfall from the TRMM satellite for different periods and spatial scales in the Indus Basin. Int. J. Remote Sens. 2012, 33, 2603–2627. [Google Scholar] [CrossRef]
  70. Vernimmen, R.R.E.; Hooijer, A.; Mamenun; Aldrian, E.; van Dijk, A.I.J.M. Evaluation and bias correction of satellite rainfall data for drought monitoring in Indonesia. Hydrol. Earth Syst. Sci. 2012, 16, 133–146. [Google Scholar] [CrossRef]
  71. Anderson, M.C.; Norman, J.M.; Mecikalski, J.R.; Otkin, J.A.; Kustas, W.P. A climatological study of evapotranspiration and moisture stress across the continental United States based on thermal remote sensing: 2. Surface moisture climatology. J. Geophys. Res. Atmos. 2007, 112, 1–13. [Google Scholar] [CrossRef]
  72. Savoca, M.E.; Senay, G.B.; Maupin, M.A.; Kenny, J.F.; Perry, C.A. Actual Evapotranspiration Modeling Using the Operational Simplified Surface Energy Balance (SSEBop) Approach; Scientific Investigations Report 2013-5126; US Geological Survey: Reston, Virginia, 2013. [Google Scholar]
  73. Anderson, M.C.; Zolin, C.A.; Hain, C.R.; Semmens, K.; Tugrul Yilmaz, M.; Gao, F. Comparison of satellite-derived LAI and precipitation anomalies over Brazil with a thermal infrared-based evaporative stress index for 2003–2013. J. Hydrol. 2015, 526, 287–302. [Google Scholar] [CrossRef]
  74. Zomer, R.J.; Trabucco, A.; Bossio, D.A.; Verchot, L.V. Climate change mitigation: A spatial analysis of global land suitability for clean development mechanism afforestation and reforestation. Agric. Ecosyst. Environ. 2008, 126, 67–80. [Google Scholar] [CrossRef]
  75. Duc, N.H.; Shintani, T.; Umeyama, M. Estimation of freshwater-discharge distribution for multi-estuary branches in the Red River System in Vietnam. In Proceedings of the 34th World Congress of the International Association for Hydro-Environment Research and Engineering, Brisbane, Australia, 26 June–1 July 2011.
  76. McMillan, H.; Krueger, T.; Freer, J. Benchmarking observational uncertainties for hydrology: Rainfall, river discharge and water quality. Hydrol. Process. 2012, 26, 4078–4111. [Google Scholar] [CrossRef]
  77. Di Baldassarre, G.; Montanari, A. Uncertainty in river discharge observations: A quantitative analysis. Hydrol. Earth Syst. Sci. 2009, 13, 913–921. [Google Scholar] [CrossRef]
  78. Pelletier, P.M. Uncertainties in the single determination of river discharge: A literature review. Can. J. Civ. Eng. 1988, 15, 834–850. [Google Scholar] [CrossRef]
  79. Hofste, R.W. Comparative Analysis among Near-Operational Evapotranspiration Products for the Nile Basin Based on Earth Observations; Delft University of Technology: Delft, The Netherlands, 2014. [Google Scholar]
  80. Kono, Y.; Tuan, D.D. Effect of water control on rice cultivation in the Red River Delta, Vietnam: A case study in the Nhue River irrigation system. Southeast Asian Stud. 1995, 32, 425–445. [Google Scholar]
  81. IMRR. IMRR Project Report: System Characterization; Politecnico di Milano: Milano, Italy, 2011. [Google Scholar]
  82. Van De Giesen, N.; Rutten, M.; Coerver, B.; Simons, G. Demonstration of an operational decision support system for reservoir managers in the Da River based on open-access remote sensing data and models. In Vietnam Water Cooperation Initiative (VACI); NAWAPI: Hanoi, Vietnam, 2015. [Google Scholar]
  83. Liu, B.M.; Collick, A.S.; Zeleke, G.; Adgo, E.; Easton, Z.M.; Steenhuis, T.S. Rainfall-discharge relationships for a monsoonal climate in the Ethiopian highlands. Hydrol. Process. 2008, 22, 1059–1067. [Google Scholar] [CrossRef]
  84. Easton, Z.; Awulachew, S.; Steenhuis, T. Hydrological processes in the Blue Nile. In The Nile River Basin—Water, Agriculture, Governance and Livelihoods; International Water Management Institute: Colombo, Sri Lanka, 2012. [Google Scholar]
  85. Ngo, L. Optimising Reservoir Operation; Technical University of Denmark: Kongens Lyngby, Denmark, 2006. [Google Scholar]
  86. Holmes, T.R.H.; Crow, W.T.; Hain, C.; Anderson, M.C.; Kustas, W.P. Diurnal temperature cycle as observed by thermal infrared and microwave radiometers. Remote Sens. Environ. 2015, 158, 110–125. [Google Scholar] [CrossRef]
  87. Immerzeel, W.W.; Droogers, P. Calibration of a distributed hydrological model based on satellite evapotranspiration. J. Hydrol. 2008, 349, 411–424. [Google Scholar] [CrossRef]
  88. Vervoort, R.W.; Miechels, S.F.; van Ogtrop, F.F.; Guillaume, J.H.A. Remotely sensed evapotranspiration to calibrate a lumped conceptual model: Pitfalls and opportunities. J. Hydrol. 2014, 519, 3223–3236. [Google Scholar] [CrossRef]
  89. Carroll, R.W.H.; Pohll, G.M.; Morton, C.G.; Huntington, J.L. Calibrating a basin-scale groundwater model to remotely sensed estimates of groundwater evapotranspiration. JAWRA J. Am. Water Resour. Assoc. 2015, 51, 1114–1127. [Google Scholar] [CrossRef]
  90. Muthuwatta, L.A.L.P.; Booij, M.J.; Rientjes, T.O.M.H.M. Calibration of a semi-distributed hydrological model using discharge and remote sensing data. New App. Hydrol. Predict. Data Sparse Reg. 2009, 333, 52–58. [Google Scholar]
  91. Livneh, B.; Lettenmaier, D.P.D. Multi-criteria parameter estimation for the unified land model. Hydrol. Earth Syst. Sci. 2012, 16, 3029–3048. [Google Scholar] [CrossRef]
  92. Winsemius, H.C.; Savenije, H.H.G.; Bastiaanssen, W.G.M. Constraining model parameters on remotely sensed evaporation: Justification for distribution in ungauged basins? Hydrol. Earth Syst. Sci. 2008, 12, 1403–1413. [Google Scholar] [CrossRef]
  93. Cheema, M.J.M.; Immerzeel, W.W.; Bastiaanssen, W.G.M. Spatial quantification of groundwater abstraction in the irrigated Indus Basin. Groundwater 2014, 52, 25–36. [Google Scholar] [CrossRef] [PubMed]
  94. Van Eekelen, M.W.; Bastiaanssen, W.G.M.; Jarmain, C.; Jackson, B.; Ferreira, F.; van der Zaag, P.; Saraiva Okello, A.; Bosch, J.; Dye, P.; Bastidas-Obando, E.; et al. A novel approach to estimate direct and indirect water withdrawals from satellite measurements: A case study from the Incomati basin. Agric. Ecosyst. Environ. 2015, 200, 126–142. [Google Scholar] [CrossRef]
  95. Bierkens, M.F.P. Global hydrology 2015: State, trends, and directions. Water Resour. Res. 2015, 51, 4923–4947. [Google Scholar] [CrossRef]
  96. Döll, P.; Douville, H.; Güntner, A.; Müller Schmied, H.; Wada, Y. Modelling freshwater resources at the Global Scale: Challenges and prospects. Surv. Geophys. 2015, 37, 195–221. [Google Scholar] [CrossRef]
  97. Sood, A.; Smakhtin, V. Global hydrological models: A review. Hydrol. Sci. J. 2014, 60, 549–565. [Google Scholar] [CrossRef]
  98. Bierkens, M.F.P.; Bell, V.A.; Burek, P.; Chaney, N.; Condon, L.E.; David, C.H.; de Roo, A.; Döll, P.; Drost, N.; Famiglietti, J.S.; et al. Hyper-resolution global hydrological modelling: what is next? Hydrol. Process. 2015, 29, 310–320. [Google Scholar] [CrossRef]
  99. Jägermeyr, J.; Gerten, D.; Heinke, J.; Schaphoff, S.; Kummu, M.; Lucht, W. Water savings potentials of irrigation systems: Global simulation of processes and linkages. Hydrol. Earth Syst. Sci. 2015, 19, 3073–3091. [Google Scholar] [CrossRef]
  100. Wada, Y.; Wisser, D.; Bierkens, M.F.P. Global modeling of withdrawal, allocation and consumptive use of surface water and groundwater resources. Earth Syst. Dyn. 2014, 5, 15–40. [Google Scholar] [CrossRef]
  101. Peña-Arancibia, J.L.; Mainuddin, M.; Kirby, J.M.; Chiew, F.H.S.; McVicar, T.R.; Vaze, J. Assessing irrigated agriculture’s surface water and groundwater consumption by combining satellite remote sensing and hydrologic modelling. Sci. Total Environ. 2016, 542, 372–382. [Google Scholar] [CrossRef] [PubMed]
  102. Vandecasteele, I.; Bianchi, A.; Batista E Silva, F.; Lavalle, C.; Batelaan, O. Mapping current and future European public water withdrawals and consumption. Hydrol. Earth Syst. Sci. 2014, 18, 407–416. [Google Scholar] [CrossRef]
  103. Yamada, H.G.; Yoshikawa, S.; Koirala, S.; Kanae, S. Spatial and temporal estimation of global water withdrawals from 1950 to 2000 based on statistical data. J. Jpn. Soc. Civ. Eng. Ser. B1 Hydraul. Eng. 2012, 68, I_217–I_222. [Google Scholar] [CrossRef]
  104. Droogers, P.; Immerzeel, W.W.; Lorite, I.J. Estimating actual irrigation application by remotely sensed evapotranspiration observations. Agric. Water Manag. 2010, 97, 1351–1359. [Google Scholar] [CrossRef]
  105. Santos, C.; Lorite, I.J.; Tasumi, M.; Allen, R.G.; Fereres, E. Integrating satellite-based evapotranspiration with simulation models for irrigation management at the scheme level. Irrig. Sci. 2008, 26, 277–288. [Google Scholar] [CrossRef]
Figure 1. The Red River Basin. Elevation was obtained from the Shuttle Radiometer Topography Mission (SRTM) data, and the main river network and catchment boundaries were derived from the SRTM elevation map. The stream network downstream of Son Tay mainly consists of irrigation canals and was provided by the Institute of Water Resource Planning (IWRP) in Vietnam.
Remotesensing 08 00279 g001
Figure 2. Normalized Difference Vegetation Index (NDVI time series of three main Land Use / Land Cover (LULC) classes in 2000–2014 based on the 250 meter MODIS NDVI products MOD13Q2 and MYD13Q2. “Forest” is comprised of all forested classes in the Globcover 2009 product.
Remotesensing 08 00279 g002
Figure 3. LULC map of the Red River Basin.
Remotesensing 08 00279 g003
Figure 4. Comparison of monthly rain gauge data with three satellite products for the overlapping period January 2003–December 2014. The dashed line indicates a 1:1 correspondence and the red line gives the linear regression best fit with 0 intercept.
Remotesensing 08 00279 g004
Figure 5. Frequency distributions of the error in monthly rainfall. Indicated are the mean error (ME) and standard deviation (σ) in mm.
Remotesensing 08 00279 g005
Figure 6. Average monthly ETact for three LULC types.
Remotesensing 08 00279 g006
Figure 7. Annual ETact averaged in the Red River Basin for the period January 2003–December 2012.
Remotesensing 08 00279 g007
Figure 8. Map of annual average rainfall surplus in the Red River Basin based on January 2003–December 2012. Also indicated are the largest dams that provide opportunities for water storage. Hoa Binh and Thac Ba dam were operational during this entire period, Tuyen Quang and Son La dam were commissioned in 2008 and 2011, respectively.
Remotesensing 08 00279 g008
Figure 9. Rainfall surplus during February 2010–April 2010 (a) and June–August 2008 (b), respectively, the driest spring rice season and the wettest three-monthly period in the time series under consideration.
Remotesensing 08 00279 g009
Figure 10. Graphs of upstream rainfall surplus (Psur) from remote sensing and measured streamflow (Q) for each of the available discharge stations.
Remotesensing 08 00279 g010
Figure 11. Monthly changes in storage upstream of Son Tay station (ΔS) plotted against the rainfall surplus (Psur). Dashed lines indicate the lines of best fit for each month (colored) and the entire year (black). For each month, the derived linear model is given on the right with its respective coefficient of determination (R2).
Remotesensing 08 00279 g011
Table 1. Evaluated rainfall GSDPs for the Red River Basin. The basin-wide mean rainfall (μ) and year-to-year standard deviation (σ) are reported for the overlapping period (January 2003–December 2014). April–September and October–March rainfall statistics are listed separately to reflect the regional seasonality of rainfall.
ProductTemporal CoverageOriginal/Applied ResolutionKey ReferencesAnnual P (mm)Apr-Sep P (mm)Oct-Mar Rainfall (mm)
μσμσμσ
TRMM 3B43 v7January 1998–October 20150.25°/25 km[64]1545.7121.81301.669.9244.161.0
CHIRPS v1.8January 1981–present0.05°/5 km[65]1403.2115.21223.188.4180.040.2
CMORPHDecember 2002–present0.25°/25 km[66]1169.3173.21070.8150.898.539.5
Table 2. Other pairwise validation statistics for three satellite products (S) based on all available station records (G) during the overlapping period (January 2003–December 2014).
IndicatorFormulaCHIRPSTRMMCMORPH
Pearson correlation coefficient r (−) r = ( G G ¯ ) ( S S ¯ ) ( G G ¯ ) 2 ( S S ¯ ) 2 0.8510.8840.786
Relative Mean Absolute Error RMAE (−) R M A E = 1 n *   | ( S G ) | G ¯ 0.3270.2960.427
Nash-Sutcliffe Model Efficiency Coefficient NS (−) N S =   1 ( S G ) 2 ( G G ¯ ) 2 0.7210.7770.585
Bias (−) B i a s =   ( S ) ( G ) 0.9561.0550.857
Table 3. Properties of evaluated ETact products for the Red River Basin. The basin-wide mean ETact (μ) and year-to-year standard deviation (σ) are reported for the overlapping period (January 2003–December 2012). Temporal coverages indicate the time series of each product that were (made) available for this study.
ProductTemporal CoverageOriginal/Applied ResolutionKey ReferencesAnnual ETact 2003–2012 (mm)Apr-Sep ETact (mm)Oct-Mar ETact (mm)
μσμσμσ
MOD16(A2)January 2000–December 2015926 m/1 km[22,29]1008.921.0625.710.5383.210.1
SSEBopJanuary 2003–December 20131 km/1 km[23,72]885.836.8613.911.4271.925.1
SEBSJanuary 2001–December 20135 km/5 km[25]1153.865.2724.922.2428.949.6
CMRSETJanuary 2000–December 20120.05°/5 km[24]960.247.2564.523.1395.726.8
ALEXIJanuary 2003–December 20140.05°/5 km [71,73]1103.533.470912.8394.525.5
Table 4. TRMM rainfall (P), measured streamflow at Son Tay (Q) and ETact from each of the products for the overlapping period of hydrological years. Only the area upstream of the gauging station has been considered.
Hydr. yearP (mm)Q (mm)P − Q (mm)ETact (mm)
MOD16SSEBopSEBSALEXICMRSET
2003/20041401.0604.3796.71023.0821.51084.11110.1946.4
2004/20051590.3703.0887.3984.4860.71144.81059.1911.5
2005/20061452.5701.4751.11023.4836.31065.71094.1916.1
2006/20071519.2656.4862.91006.5826.91077.71124.7918.8
2007/20081615.8761.3854.51018.3883.41196.51028.6870.0
2008/20091793.1948.7844.41017.1884.81128.11067.81007.3
2009/20101386.4674.6711.81006.5821.21024.71124.3978.7
2010/20111482.5594.8887.7970.0917.01167.71065.5986.3
2011/20121423.8531.8892.01005.8891.71165.71152.41001.2
Average1518.3686.3832.01006.1860.41117.21091.8948.5
Table 5. Pearson correlation coefficient of annually averaged ETact pixel values in the entire Red River basin. Bold values are higher than 0.5.
ALEXICMRSETMOD16SEBSSSEBop
ALEXI 0.2490.6790.1810.714
CMRSET0.249 0.0950.4080.419
MOD160.6790.095 0.1110.539
SEBS0.1810.4080.111 0.383
SSEBop0.7140.4190.5390.383
Table 6. Overview of consumptive use and water production per LULC class in the Red River Basin for the period 2003–2012.
LULC ClassArea (km2)P (mm/Year)P (km3/Year)ETact (mm/Year)ETact (km3/Year)μ Psur (mm/Year)σ Psur (mm/Year)Produced (km3/Year)
Irrigated—double or triple crop22,655.81591.536.1890.320.2701.2256.115.9
Rainfed—single crop18,898.51175.122.2736.813.9438.4261.28.3
Mosaic vegetation (<50% cropland)20,925.81586.433.2886.518.6699.9304.714.6
Closed to open broadleaved evergreen or semi-deciduous forest32,431.41601.651.9948.730.8652.9345.121.2
Closed broadleaved deciduous forest1817.31534.12.8860.21.6674.0363.61.2
Open broadleaved deciduous forest/woodland4281.51411.36.0880.63.8530.7349.32.3
Open needleleaved deciduous or evergreen forest11,948.41477.517.7857.610.2620.0347.97.4
Closed to open mixed broadleaved and needleleaved forest3460.11327.74.6839.42.9488.3299.21.7
Closed to open shrubland46,406.21522.570.7913.442.4609.1338.428.3
Closed to open herbaceous vegetation396.51633.30.6958.10.4675.2180.70.3
Urban areas593.61618.41.0852.50.5765.9168.30.5
Total165,178.1 249.1 146.4 102.6
Table 7. Comparison of streamflow Q and rainfall surplus Psur for each catchment, with slopes and R2 for linear relationships between monthly Q and upstream Psur. Also given are the values of Q/Psur during the rainy season. All values represent the 2003–2012 period.
StationQ/Psur (%)Q/Psur Slope (−)R2Monsoonal Q/Psur
MayJuneJulyAugustSeptember
Bac Me98.40.600.660.370.551.071.781.68
Muong Te80.90.490.610.150.280.610.801.03
Vu Quang101.00.500.670.710.540.910.861.57
Yen Bai87.20.330.650.520.430.450.611.39
Hoa Binh125.90.650.720.590.710.940.982.21
Son Tay107.20.430.710.740.560.710.791.43

