


Abstract
The most complex but potentially most severe impacts of climate change are caused by extreme weather events. In a globally connected economy, damages can cause remote perturbations and cascading consequences—a ripple effect along supply chains. Here we show an economic ripple resonance that amplifies losses when consecutive or overlapping weather extremes and their repercussions interact. This amounts to an average amplification of 21% for climate-induced heat stress, river floods, and tropical cyclones. Modeling the temporal evolution of 1.8 million trade relations between  7000 regional economic sectors, we find that the regional responses to future extremes are strongly heterogeneous also in their resonance behavior. The induced effect on welfare varies between gains due to increased demand in some regions and losses due to demand or supply shortages in others. Within the current global supply network, the ripple resonance effect of extreme weather is strongest in high-income economies—an important effect to consider when evaluating past and future economic climate impacts.
Export citation and abstract BibTeX RIS

Original content from this work may be used under the terms of the Creative Commons Attribution 4.0 license. Any further distribution of this work must maintain attribution to the author(s) and the title of the work, journal citation and DOI.
1. Introduction
Climate change due to anthropogenic greenhouse gas emissions is likely to intensify both weather extremes [1] and their impact on society [2, 3]. Disruptions by extreme weather events impact the health sector [4, 5] as well as the economy through perturbations of income [6], employment [7], economic growth [8, 9], energy supply [10, 11], and food security [12, 13]. In the aftermath of an extreme weather event, regions react in a variety of ways. Some might not manage to recover in between subsequent events [14] others might even profit from disasters when the economy is build back more resilient or more efficient after the shock [15, 16]. On an inter-regional level, local production shocks induced by extreme events can, via price and demand fluctuations in the highly interconnected global trading network, result in losses or gains in production or consumption elsewhere in the world [17–19].
The short and long-term economic impact of each of individual disaster categories by themselves have been studied in regional case studies [20–22] as well as on the individual regional or even at the global level [23–25]. Additionally, events such as heat stress, fluvial floods, and tropical storms, can also overlap spatially as well as temporally, often referred to as compound events [26]. This paper contributes to this literature, which so far mostly focuses on the natural science perspective or regards only local direct economic consequences [27]. We here focus on how local and cross-regional economic repercussions of such events can interact due to trade and production supply linkages in a non-linear way [28] either amplifying or mitigating the economic losses caused by the individual events. Additionally, disasters due to extreme weather events (e.g. flooding of factories) can lead not only to direct local (production) output losses, but also to indirect losses due to the propagation of losses in the global trade network causing economic ripple effects [29]. Thus, the question arises of whether accounting for the interaction of these losses is important, and whether doing so amplifies or mitigates overall losses at a global level.
2. Methods summary
Here we model the response of the global supply network to heat stress [30, 31], river floods [25, 32], and tropical cyclone events [33, 34] for the years 2020–2039. The daily time series of the events are derived from an ensemble of four global climate models, each forced by two representative concentration pathways for all three event categories, as well as five hydrological models for river floods and five tropical cyclones realizations (8 time series for heat stress, 40 time series for river floods and tropical cyclones; see section 2 for details). From these we derive direct output losses. For heat stress, we use a linear reduction in local labor productivity for selected economic sectors for every degree warmer than a daily local temperature of 27 ∘C [30]. For the duration of a river flood in an area, production capacity is reduced by the relative amount of affected area for all non-service sectors. Similarly, the productivity of all non-service sectors vanishes when an area is on the track of a hurricane with wind speed exceeding 64 knots. This translation is rather simplistic and does not take account for short-term adaptation only by allowing for limited efforts to use additional production capacity at higher costs. During the short actual duration of each event we believe this linear translation to be a valid assumption. After the disaster has ceased, direct production capacity recovers depending on on flood depth and wind speed, respectively, thereby accounting for additional cleanup efforts. The production recovery of an affected area is exponential (80% per day). By overlapping the direct output loss time series (i.e. local impacts) of those three extreme event types we generate a direct output loss time series, where individual extreme events can overlap spatially and/or temporally. Following [28], we refer to these as consecutive disasters (200 time series for consecutive disaster scenarios).
We translate these regional direct output losses into overall losses (direct plus indirect losses) using the loss-propagation model Acclimate [18], which includes a complex network of 26 sectors per region, i.e. representative firms, and one consumer within each of the 256 regions of the model (184 nations as well as 51 US-states and 32 Chinese provinces). Each consumer consumes each of the 26 goods independent of the others. Similar to firms each good in general is supplied by many firms producing that good in different regions. This results in about 1.8 million interconnections between 7236 economic agents. Local profit optimization, causing demand and production changes, enables firms to react to short-term production, supply, or price shocks. Those economic shocks are depicted as deviations from the baseline, which rely on static multi-regional input-output data from the Eora database 5 [35] for the year 2015. Perturbed supply can lead to regional economic benefits through temporary production extension or result in loss cascades along supply chains. Inventories and transport delay may buffer this loss propagation as supply shortages do not directly constrain other firms' production. Consumption optimization by each regional consumer causes demand shifts which cast back to the firms' production behavior. There is hence a two-way feedback between consumers and producers. With its endogenous prices and agent-based daily dynamics, the Acclimate model is particularly suited to assess the global distribution of the consequences of unanticipated short-term shocks such as those by the three disaster types considered here.
3. Results
Due to inertia in the climate system the different carbon emission scenarios yield temperature scenarios that are well within model uncertainty within the next two decades [1]. Accordingly, we combine the individual years of the different scenarios into a full ensemble to improve statistics similar to previous publications [25, 32]. For that, we derive annual values of indirect losses from daily losses as computed by Acclimate. We then compare two situations. On the one hand, we use simulations with all three classes of weather extremes occurring together (i.e. consecutive disaster scenarios). The corresponding quantities, such as the consumption losses and production losses, are referred to as total quantities. On the other hand, we sum the results of three separate simulation classes with each having only one category of weather extremes. Their resulting quantities are denoted as aggregated. For direct losses, generally, the sum of the direct output losses of the three classes of weather extremes (aggregated direct losses) equals the losses of consecutively occurring disasters (total direct losses) (see section 2 for details). Using an ensemble of projected weather extremes of three disaster categories, enables us to get a broad range of consecutive disaster events, spatially as well as temporally. Accordingly, in the ensemble we observe disasters of very different sizes and combinations.
3.1. Consecutive disasters increase global consumption losses
Global welfare, measured as the sum of the final consumption of all regions, decreases in response to the direct losses in both cases, the aggregated as well as the total case (figure 1). The local production reductions are passed on via the supply network as supply and price shocks up to the final consumer. The latter usually just has the option to consume less, because of lack of supply or in response to increasing prices. Thus, price inflation of goods and services decreases consumption in the disasters aftermath (see section 2 for details).
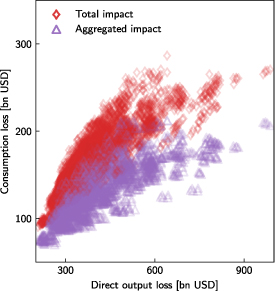
Figure 1. Global consumption losses are higher when impacts interact. Global annual consumption losses as they depend on annual direct output losses. For the total impact (red diamond) consumption losses are higher than for the aggregated sum of independent impacts (purple triangle) also for the same direct losses. This amplification is shown in figure 2. Each data point represents one year within the ensemble. Consumption and direct output losses are with respect to the baseline consumption and production, respectively.
Download figure:
Standard image High-resolution imageGlobally, we observe an economic ripple resonance of extreme weather events. We define this resonance as the amplification of regional and global economic disruptions that result from the interaction of the economic repercussions of individual event impacts. Here, total annual consumption losses are larger than the aggregated losses from single disaster scenarios for the whole simulated ensemble (figures 1 and 2(A)). Specifically, the resonance leads to both an additional consumption losses that is independent of the level of direct losses (the resonance offset
C0), and a linear amplification of consumption losses with increasing direct losses (the resonance amplification factor
A). Consequently, losses from consecutive disasters are always larger than the sum of their individual scenarios, and this difference grows with the size of direct losses, e.g. for stronger disruptive events. We thus observe an increase of global total consumption losses  compared to aggregated consumption losses
  with, on average,
  . The global resonance offset
  indicates the extent to which consumption losses in the global trading network are intensified for consecutive disasters (figure 2(A)). The resonance amplification factor
  of global losses implies that an increase of 10bn USD of aggregated consumption losses yield to an increase of more than 12bn USD of total consumption losses. In order to help modelers account for this effect, we provide tables of the amplification factors and resonance offsets for regions commonly used in integrated assessment models in the appendix (available online at stacks.iop.org/ERL/16/114010/mmedia).
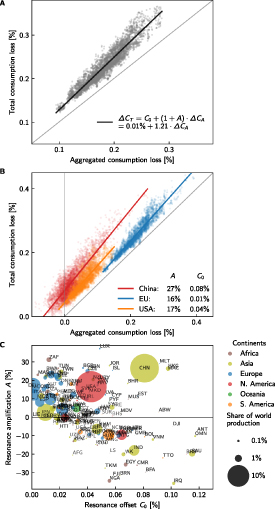
Figure 2. Economic ripple resonance—consumption losses of consecutive disasters are increased in comparison to losses of aggregated single disasters. (A), (B) Annual consumption losses for the total impact over those for the aggregated sum of independent impacts, globally ((A), grey dots) as well as for China, EU, and the USA ((B), colored dots). Each data point represents one year within the ensemble. Losses are relative to the (unperturbed) baseline consumption. The solid lines depict the resonance analysis with resonance amplification factor A and resonance offset C0. (C) Resonance amplification factor and offset per country. The area of each circle represents the country's share of the world production, its color depicts the geographic region. A few extreme outliers (of economically small countries) are not in the visual range.
Download figure:
Standard image High-resolution imageThe global enhancement of welfare losses via economic ripple resonance can be explained by non-linear price inflation due to rising demand (figure 3). If a firm increases its demand to some of its suppliers due to supply shortages elsewhere, the price increases non-linearly due to additional production costs. These higher prices and output losses are likely to be passed down the supply chain to the consumer, who has a lower consumption amount for a higher price. If other suppliers fail, due to economic repercussions of different weather extremes, these price deviations may interfere and the resulting declines in consumption can be intensified. Hence spatial and temporal consecutive disasters can amplify indirect consumer losses. It is important to note that individual extreme weather events are not responsible for the ripple resonance. Rather, the overlap of economic repercussions caused by several extreme events resonate and thus trigger the enhancement and amplification of consumption losses.
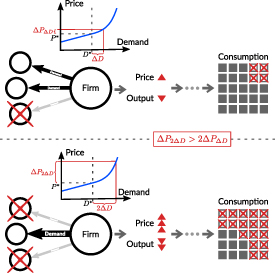
Figure 3. Non-linear price increase due to increasing demand—consumption response to ripple resonance. Upper panel: due to a supplier outage, a firm shifts its demand to other suppliers (of the same commodity/service). Consequent prices ( ) grow non-linearly with increasing demand (
 ) due to extra costs for additional production, potentially reducing the firm's output. This price increase and supply shortage propagates through the supply network and leads to fewer consumption goods and services for a higher price for the consumer. Lower panel: if more suppliers fail, the fewer remaining suppliers face more demand (
 ), which increases the price enormously (
 ). In fact, a price change due to a doubling of the demand change is greater than twice the price change due to a demand change (
 ). A firm therefore produces less but that for a significantly higher price. At the end of the supply chain, the high expenditure for less goods and services result in a drastic reduction in consumption.
Download figure:
Standard image High-resolution image3.2. Regional welfare losses increase due to ripple resonance
Additionally, various regional direct losses (e.g. varying exposure to natural hazards), network effects (e.g. interference of demand anomalies), and market effects (e.g. strong price fluctuations) may result in regionally heterogeneous responses to the economic ripple resonance (figure 2(B)). In the following, we look at the summed results for the largest economic blocs, the United States of America, China, and the European Union, which consist of their federal states, provinces, and national states, respectively. Explicitly resolving their internal trade dynamics allows us to provide more specific insights for these economic blocs. They are of high economic relevance and exhibit robust sub-regional data resolution. Since we use the economic network of 2015, we refer to the EU as the former pre-Brexit European Union with 28 member states.
Locally, the EU experiences less relative direct output losses in contrast to the USA and China (figure 4). Nevertheless, production losses elsewhere can cause—via the supply network—local consumption losses. This is the case in the EU, where consumers experience higher total and aggregated consumption losses than Chinese or US consumers (figure 2(B)). Most other regions, except Canada and the northern US states, experience higher output losses than the EU. These production losses impact the EU via supply shortages. Additionally, the EU faces increased demand from outside as other regions seek substitutes for directly impact suppliers. In response to this scarcity the EU increases its production and exports (figure S1) and, following market principle, this scarcity yields an increase in prices for EU products. These higher prices (on the 'world market' in our model) are not passed on solely to customers abroad, but also to customers inside the EU (figure S1). Since national supply is generally stronger than imports the non-EU consumers experience less of the price pressure from the EU than consumers within the union. The trade within the EU is about a factor 10 higher than with the outside. Due to this the EU consumer experiences the increased prices more clearly, because they are more directly dependent on the products and prices of the EU firms. Thus, the advantage of the EU firms—increased production and higher prices—becomes a disadvantage for their own consumers.
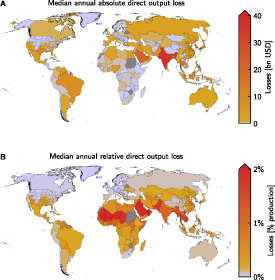
Figure 4. Median annual direct output losses due to heat stress, river floods, and tropical cyclones. Regional maps of (A) absolute and (B) relative median annual direct output losses due to heat stress, river floods and tropical cyclones. Regions with absolute or relative direct annual output losses below USD 1bn or 0.2% of baseline (unperturbed) production are depicted in light purple.
Download figure:
Standard image High-resolution imageThe ripple resonance further intensifies the EU's consumption losses with a resonance amplification factor similar to the USA,  and
and  . Thus, domestic production losses and resulting demand shifts and price increases, due to stronger disasters, similarly intensify consumption losses for the USA and the EU. Hence, under climate change and without adequate adaptation measures, we expect more frequent heat stress and more intense tropical storms as well as their superposition to contribute to a larger welfare decline in the USA and EU.
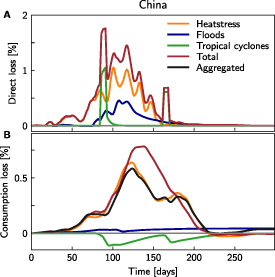
For China, the ripple resonance of consecutive disasters has a crucial impact on its economy, which experiences significantly higher losses of consumption due to heat stress than due to flooding (figure 5). Nevertheless, the overlapping of event categories (total impact) causes an increase in consumption losses which exceeds the sum of the separate losses (aggregate impact). Here, China exhibits a resonance amplification factor of  . This implies that a fourfold increase of aggregated consumption losses roughly translates to a fivefold increase in total consumption losses. Furthermore, China experiences one of the highest resonance offsets (
 ). With such a high loss offset China is able to mitigate consumption losses for each disaster category individually; decreased foreign supply can be buffered by increasing domestic production.
Figure 5. Ripple resonance of consecutive disasters has a crucial impact on the Chinese economy—sample time series of direct output losses and resulting changes in consumption. The disaster categories heat stress, river floods, tropical cyclones, the aggregation of them and consecutive disasters are depicted in orange, blue, green, black and red, respectively. Upper panel (A): temporal evolution of direct output losses for China due to different disaster categories for one sample year and sample bio-physical time series. Lower panel (B): temporal evolution of corresponding consumption losses. It is important to note that the consumption losses are not solely due to domestic production losses but rather reflect the repercussions on consumers of disrupted supply chains and global market effects.
Download figure:
Standard image High-resolution image
However, this coping mechanism is less effective against consecutive disasters. In fact, Chinese consumption depicts a qualitative response shift; potential consumption gains (negative losses) of aggregated single disaster scenarios turn into consumption losses for consecutive disasters (figure 2(B)). In other words, measured by changes in consumption, China can change from a net-winner (aggregated impacts) to a net-loser (total impacts). This hints that single case assessments of extreme events may not only underestimate regional welfare losses but may even leave it undetected.
Even for prominent global economic players, domestic trade has a much greater weight than foreign trade. Therefore, domestic production losses are largely redistributed in the internal market. Chinese firms have a strong exposure to all three extreme events (figure 5) especially compared to the EU and USA (figure 4). For isolated extreme events, the Chinese market is able to mitigate part of the direct output losses. However, when considering regional consecutive disasters, the economic repercussions are superimposed within the Chinese trade network—a domestic ripple resonance effect—which results in disproportionately higher consumption losses (figure 5). Thus, for consecutive disasters, the Chinese economy is no longer able to mitigate these overlapping losses; they are too severe to be compensated by non-domestic trading partners, even for a major trading power as China. Accordingly, when firms or policy makers prepare for disasters they should not only consider individual but also the interactions of several events.
In conclusion, the three biggest economic blocs, China, the European Union, and the United States of America are affected differently by the three disaster categories and the resulting economic repercussions. This follows from their different embedding within the international trade network, their unequal balance of trade between one another, and their heterogeneous domestic economic structure. Accordingly, they exhibit different resilience to extreme events (figure 2(B)).
3.3. Heterogeneous response to economic ripple resonance among countries
Between individual countries a broader spectrum of response behavior emerges (figure 2(C)). Every country shows a positive resonance offset for total consumption losses. But, in contrast to China, the EU, and the USA, some economies, including Brazil, Canada, India, Mexico, Russia, and Sweden, exhibit a negative resonance amplification factor. In these regions, the discrepancy between total consumption losses and aggregated consumption losses shrinks with growing losses and therefore the increase in losses is mitigated in consecutive disaster scenarios (figure S2). Such a negative resonance amplification can be caused by competing producers experiencing higher indirect production outages for single disaster scenarios. These then lower their purchasing prices due to less demand of production and consumption goods.
Further analysis suggests that the resonance amplification tends to become smaller as the direct output losses relative to baseline production output increase (figure S3). Consecutive disasters cause more production than single disasters, which could partly lead to less demand and therefore to lower commodity prices. Countries which experience already high direct output losses from single events, e.g. heat stress in India, may benefit from these lower prices due to consecutive disasters compared to single disaster events. We also compare the regions' response for different income levels as well as to economic output (figure S4). This shows that, mostly low-income countries tend to exhibit a negative resonance amplification factor, whereas higher-income countries tend to perceive positive amplification. A distinct correlation between resonance offset or amplification factor, on the one hand, and national share of world production, on the other hand, has not been identified. However, there is a trend that countries with stronger mitigation reactions (negative amplification factor) are prone to a higher resonance offset (figure 2(C)).
It is important to note that all countries have a positive resonance offset and total consumption losses exceed aggregated consumption losses in most countries. From this follows that a comprehensive consideration of extreme events reveals higher national welfare losses which are caused by economic ripple resonance. Even if some nations depict a negative amplification rate, the majority of economic production ( of global production) lies in regions with a positive amplification factor.
The resonance offsets and amplification factors for all regions used in the simulations are given in table S2. In order to help estimate the economic costs of extreme events, we also apply our estimation of quantifying the ripple resonance to the regions of different Integrated Assessment Models (see tables S3–S8). We hope this helps to transfer aggregated consumption losses of various studies to their corresponding losses for consecutive disasters.
4. Discussion
Our study shows an economic ripple resonance within the global supply network, which causes consecutive disasters to trigger higher consumption losses compared to separate single disaster categories. In general, this loss intensification becomes even more amplified for increasing losses. However, the extent or even the trend of loss amplification can vary substantially across regions. The three biggest economic blocs (China, EU, USA) exhibit strong amplification due to ripple resonance of consecutive disasters, despite different exposure to extreme events. On a national level, China's economic wealth, which grew outstandingly in recent decades, is particularly at risk due to China's exposure to several natural hazards. Apart from this, nations with small direct output losses from extreme weather events should become aware of their embedding in the global trade network. They also experience an increase in consumption losses due to overlapping extreme events in other countries. While we find first hints regarding the source of different resonance behavior—there is a trend indicating that high-income countries experience a higher resonance amplification—the underlying cause of different regional responses requires further in-depth research. The high resolution of the economic data from China, the EU, and the USA enables us to resolve their internal dynamics in more depth.
Socioeconomic modeling is subject to the inherent limitations of its assumptions and to certain uncertainties—nevertheless, this study explores and stresses the qualitative effect of ripple resonance. In this study, we focus on only three event categories, heat stress [30], floods [25], and tropical cyclones [33, 34], as well as on one particular economic network of 2015. Repeating our analysis on the economic network of 2012 reproduces the magnitude and trend of our results (figure S5). Previous studies indicate that reduced trade tends to hinder the mitigation of economic losses due to weather extremes [25]. New trade agreements or protectionist measures would likely alter the overall economic response to extreme weather events and thus could lead to a different ripple resonance effect. As the economic ripple resonance is a non-linear effect, further extreme event categories and different baseline networks may lead to different resonance quantities. With the overall effect of an increase in losses when considering the total impact, we would further expect a stronger ripple resonance with more event categories. The same argumentation holds for a stronger increase in disaster frequency and severity than in the period we consider here (2020–2039). In order to consider a full range of potential meteorological time series, we here use an ensemble of four global climate models, two representative concentration pathways, five hydrological models, and five tropical cyclones realizations, overall minimizing outlier effects.
Numerous profound studies assess the economic impacts of individual extreme weather events. The results of our study suggest that considering only individual damages or event categories likely leads to an underestimation of their overall economic losses. On that line, our study potentially even underestimates this effect, as we only focus on three disaster categories. Also, the economic interactions studied here happen on top of other economic activity and shocks. Thus, in reality, further interactions will occur; we can here, naturally, only show this effect in its isolation.
Overall, our study demonstrates the importance of considering the interaction of the economic response to consecutive events in order to grasp the full picture of the economic impacts of climate change. As human-induced climate change progresses, the frequency and intensity of extreme weather events is likely to increase, leading to a high probability of increasing direct production losses and consequently to higher consumption losses. Thus, resonating economic effects leading to insufficient adaptation and a false sense of preparedness—these kinds of resonances should be considered for further adaptation measures and mitigation efforts.
Acknowledgments
This research has received funding from the German Academic Scholarship Foundation and the German Federal Ministry of Education and Research (BMBF) under the research Projects CLIC (FKZ: 01LA1817C), QUIDIC (01LP1907A), and SLICE (FKZ: 01LA1829A), from the Horizon 2020 Framework Programme of the European Union (Grant Agreement No. 820712), as well as from the Leibniz foundation under the research Project ENGAGE (SAW-2016-PIK-1).
Data availability statement
The data that support the findings of this study are openly available at the following URL/DOI: https://zenodo.org/record/4935179. The implementation of the Acclimate model is available as open source on https://github.com/acclimate/acclimate with identifier 10.5281/zenodo.853345, the implementation of the disaggregation algorithm can be found on https://github.com/swillner/libmrio (10.5281/zenodo.832052).
Author contributions
K K, S W, C O, and A L designed the research. T G and S W provided the tropical cyclone and river flood input data, respectively. S W and C O developed the Acclimate model. K K conducted the analysis. K K, S W, C O, and A L analyzed and interpreted the results, wrote the manuscript with contributions from all authors. All authors discussed the results.
Conflict of interest
The authors declare that they have no competing interests.