the Creative Commons Attribution 4.0 License.
the Creative Commons Attribution 4.0 License.
 | 04 Feb 2019
Impacts of meteorology and emissions on summertime surface ozone increases over central eastern China between 2003 and 2015
Likun Xue
Longlei Li
Jintai Lin
Ruijing Ni
Yingying Yan
Lulu Chen
Juan Li
Qingzhu Zhang
Wenxing Wang
Recent studies have shown that surface ozone (O3) concentrations over central eastern China (CEC) have increased significantly during the past decade. We quantified the effects of changes in meteorological conditions and O3 precursor emissions on surface O3 levels over CEC between July 2003 and July 2015 using the GEOS-Chem model. The simulated monthly mean maximum daily 8 h average O3 concentration (MDA8 O3) in July increased by approximately 13.6 %, from 65.5±7.9 ppbv (2003) to 74.4±8.7 ppbv (2015), comparable to the observed results. The change in meteorology led to an increase in MDA8 O3 of 5.8±3.9 ppbv over the central part of CEC, in contrast to a decrease of about ppbv over the eastern part of the region. In comparison, the MDA8 O3 over the central and eastern parts of CEC increased by 3.5±1.4 and 5.6±1.8 ppbv due to the increased emissions. The increase in averaged O3 in the CEC region resulting from the emission increase (4.0±1.9 ppbv) was higher than that caused by meteorological changes (3.1±4.9 ppbv) relative to the 2003 standard simulation, while the regions with larger O3 increases showed a higher sensitivity to meteorological conditions than to emission changes. Sensitivity tests indicate that increased levels of anthropogenic non-methane volatile organic compounds (NMVOCs) dominate the O3 increase over the eastern part of CEC, and anthropogenic nitrogen oxides (NOx) mainly increase MDA8 O3 over the central and western parts and decrease O3 in a few urban areas in the eastern part. Budget analysis showed that net photochemical production and meteorological conditions (transport in particular) are two important factors that influence O3 levels over the CEC. The results of this study suggest a need to further assess the effectiveness of control strategies for O3 pollution in the context of regional meteorology and anthropogenic emission changes.
- Article
(10648 KB) -
Supplement
(2738 KB) - BibTeX
- EndNote


Tropospheric ozone (O3) is a major atmospheric oxidant and the primary source of hydroxyl radicals (OH), which control the atmospheric oxidizing capacity (Seinfeld and Pandis, 2016). In the troposphere, O3 is produced by the photochemical oxidation of hydrocarbons, carbon monoxide (CO) and nitrogen oxides (NOx) in the presence of sunlight and can be transported from the stratosphere (Crutzen, 1973; Danielsen, 1968). It is an important greenhouse gas with a positive radiative forcing of 0.4 (0.2–0.6) W m−2 (IPCC, 2013), and it has adverse effects on human health and ecosystem productivity (Monks et al., 2015).
Surface O3 concentrations increased globally during the 20th century. Almost all available monitoring data from 1950–1979 until 2000–2010 for the Northern Hemisphere indicate an increase of 1–5 ppbv per decade (Cooper et al., 2014; Gaudel et al., 2018; Monks et al., 2015), although the trends have varied regionally since the 1990s. The O3 concentrations in rural and remote areas of Europe showed an increasing trend until 2000, but then tended to level off or decline (Oltmans et al., 2013; Parrish et al., 2014; Yan et al., 2018b). In the eastern US, summertime O3 has continued declining since 1990, whereas springtime O3 in the western US shows large interannual variability (Lin et al., 2015). At some remote sites in the western US, only small increases (0.00–0.43 ppbv yr−1) have been recorded (Cooper et al., 2012). In comparison with Europe and North America, the O3 concentrations in China have shown significant increasing trends since the 1990s (Ding et al., 2008; Ma et al., 2016, Sun et al., 2016; X. Xu et al., 2008; W. Xu et al., 2016, 2018). Ding et al. (2008) reported an increase of 3 ppbv yr−1 in the afternoon boundary-layer O3 concentrations in summer over Beijing using aircraft data obtained by the Measurement of Ozone and Water Vapor by Airbus In-Service Aircraft (MOZAIC) program during 1995–2005. The maximum daily 8 h average O3 concentration (MDA8 O3) at Shangdianzi (SDZ), a rural site near Beijing, showed a significant increase at a rate of about 1.1 ppbv yr−1 from 2003 to 2015 (Ma et al., 2016). Sun et al. (2016) reported an increase of 1.7–2.1 ppbv yr−1 at Mt. Tai during summertime from 2003 to 2015. In recent years, high O3 concentrations have been widely observed in China, especially in central eastern China (CEC: 103 to 120∘ E, 28 to 40∘ N) during the summertime (Lu et al., 2018; Wang et al., 2006, 2017; Xue et al., 2014). All of these results indicate that CEC might continue to experience worsening O3 air pollution. In this study, we quantify the effects of several factors on O3 changes and propose some suggestions to control surface O3 in the future.
The level of O3 in the troposphere is mainly determined by the abundance of its precursors, including both anthropogenic and natural emissions, and the meteorological conditions (Logan, 1985). The anthropogenic NOx emissions in China continued rising until the launch of the Twelfth Five-Year Plan (2011–2015), which enforced a series of stringent NOx emission control measures (China State Council, 2011). However, anthropogenic emissions of non-methane volatile organic compounds (NMVOCs) continue to increase unabated (Li et al., 2017a; Zheng et al., 2018). Biomass burning also makes an important contribution to O3 formation (Real et al., 2007; Yamaji et al., 2010), and biogenic emissions of isoprene and monoterpenes contribute to O3 levels, which are influenced by meteorological variations (Fu and Liao, 2012). Meteorological parameters, such as wind, temperature and humidity, can influence O3 concentrations via mechanisms related to transport, chemical production and loss, and deposition (Monks, 2000; Zhao et al., 2010). Studies in the past 2 decades have shown that O3 and its precursors can be transported across regions and even hemispheres, as it has a lifetime of several days to weeks in the troposphere (Jacob et al., 1999; Lin et al., 2008; Verstraeten et al., 2015). For example, Ni et al. (2018) showed significant foreign contributions to springtime O3 over China. In addition, the stratosphere–troposphere exchange (STE) is another important process affecting the tropospheric O3 burden, especially in the midlatitudes of the Northern Hemisphere during springtime (Hess and Zbinden, 2013). However, currently there is still large variation in quantifying the contribution of each factor to the O3 trends among different models and study regions (Zhang et al., 2014a).
Previous studies have revealed the important effects of changing emission levels and varying climate conditions on tropospheric O3 in different regions. Lou et al. (2015) found that the effect of variations in meteorological conditions on the interannual variability in surface O3 was larger than that of variations in anthropogenic emissions in eastern China from 2004 to 2012. Using the GEOS-Chem model, Yan et al. (2018a) found that interannual climate variability is the main driver of daytime O3 variability in the US, although the reduction of anthropogenic emissions of NOx increased the nighttime O3 concentrations due to reduced O3 titration. The effects of the East Asian summer monsoon on surface O3 have been analyzed by observational and modeling studies (He et al., 2008; Wang et al., 2011; Zhao et al., 2010). Given the scarcity of previous research, it is necessary to further quantify the contributions of emissions and meteorological conditions to surface O3 levels to deepen our understanding of the factors influencing O3 changes in China.
This is a follow-up study of Sun et al. (2016), who found a significant increase in summertime O3 at a regional site in north China from 2003 and 2015. We integrate the global GEOS-Chem model and its Asian nested model to investigate the spatial distributions of surface O3 over the whole CEC region and to quantify the relative contributions from changes in meteorological and anthropogenic emissions between 2003 and 2015. We identify the key factors that affect O3 changes and make a policy recommendation for O3 control in CEC in the future. Section 2 briefly introduces the GEOS-Chem model and simulation scenarios. Comparisons of the simulated and observed O3 concentrations are made in Sect. 3. We quantify the individual effects of meteorological conditions and emissions on O3 changes in Sects. 4 and 5, respectively. In Sect. 6, we discuss important processes influencing O3 changes. Section 7 concludes the paper.
2.1 Model description
A nested model coupled with the global chemical transport model GEOS-Chem v11-01 (http://wiki.seas.harvard.edu/geos-chem/index.php/GEOS-Chem_v11-01\#v11-01_public_release, last access: 30 September 2018) is used to simulate the surface O3 concentrations and distributions over CEC in July of 2003 and 2015. The meteorological field is taken from MERRA-2 as assimilated by the Goddard Earth Observing System (GEOS) at NASA's Global Modeling and Assimilation Office. The global model and its nested model, covering China and Southeast Asia (60 to 150∘ E, 11∘ S to 55∘ N), are configured to have horizontal spatial resolutions of and , respectively, by latitude and longitude, and 47-layer reduced grids in the vertical direction with 10 layers (each ∼130 m in thickness) below 850 hPa. The models are run with the full standard NOx–Ox–hydrocarbon–aerosol tropospheric chemistry (Mao et al., 2013) for January to August of 2003 and 2015, including the spin-up time of 6 months (January to June) for each simulation, but only the results for July are discussed in this paper. The results of August 2003 and 2015 are discussed in the Supplement to confirm the result of this study. Since the crop residue burning usually lasts from late May to late June over CEC and the emissions had varied greatly over the past decade, which introduces large uncertainty in the evaluation of impacts from anthropogenic emissions (Chen et al., 2017; Wu et al., 2018), we do not focus on the O3 change simulations in June. For comparison, we also conducted model simulations for July 2004 and July 2014, and the results supported the major findings obtained from 2003 and 2015 (see results in the Supplement). We use the Linoz stratospheric ozone chemistry mechanism for stratospheric O3 production (McLinden et al., 2000) and the nonlocal planetary boundary layer (PBL) mixing scheme for vertical mixing of air tracers in the PBL (Holtslag and Boville, 1993; Lin and McElroy, 2010).
Global anthropogenic emissions of NOx and CO for 2003 and 2008 are taken from EDGAR v4.2 (Emission Database for Global Atmospheric Research, http://edgar.jrc.ec.europa.eu/overview.php?v=42, last access: 5 June 2018). NMVOC emissions are taken from the RETRO (REanalysis of TROpospheric chemical composition) inventory for 2000, but the emissions of C2H6 and C3H8 follow Xiao et al. (2008). For Europe, the US, Asia, China, Canada and Mexico, the anthropogenic emissions are taken from EMEP (from 2003 to 2012; Auvray et al., 2005), NEI2011 (base year: 2011; annual scale factors: 2006–2013; ftp://aftp.fsl.noaa.gov/divisions/taq/, last access: 5 June 2018), MIX (from 2008 to 2010; Li et al., 2017b), MEIC (2008 and 2014; http://meicmodel.org, last access: 6 June 2018), CAC (NOx and CO: from 2003 to 2008 (scaled to 2010); http://www.ec.gc.ca/pdb/cac/cac_home_e.cfm, last access: 2 October 2018), and BRAVO (1999; Kuhns et al., 2003), respectively. Over China, the CO, NOx and NMVOC emissions from MEIC for 2008 are scaled to 2003 based on the interannual variability in Regional Emission inventory in ASia (REAS-v2; Kurokawa et al., 2013), but the anthropogenic emissions for 2014 are taken directly without being scaled to 2015. According to Zheng et al. (2018), the anthropogenic NOx and NMVOC emissions in China decreased by about 6 % and 2 % from 2014 to 2015, respectively, so here we may slightly overestimate the NOx and NMVOC emissions. Daily biomass burning emissions are taken from the Global Fire Emission Database v4 (GFED4) (Randerson et al., 2012). Biogenic emissions in the GEOS-Chem model are calculated online from the MEGAN v2.1 scheme (Guenther et al., 2012). Natural NOx emissions from lightning are parameterized following Price and Rind (1992) and are further constrained by the LIS/OTD satellite data (Murray et al., 2012). We obtain the vertical profile of the lightning NOx based on Ott et al. (2010) and calculate the soil NOx emissions online following Hudman et al. (2012).
2.2 Model simulations
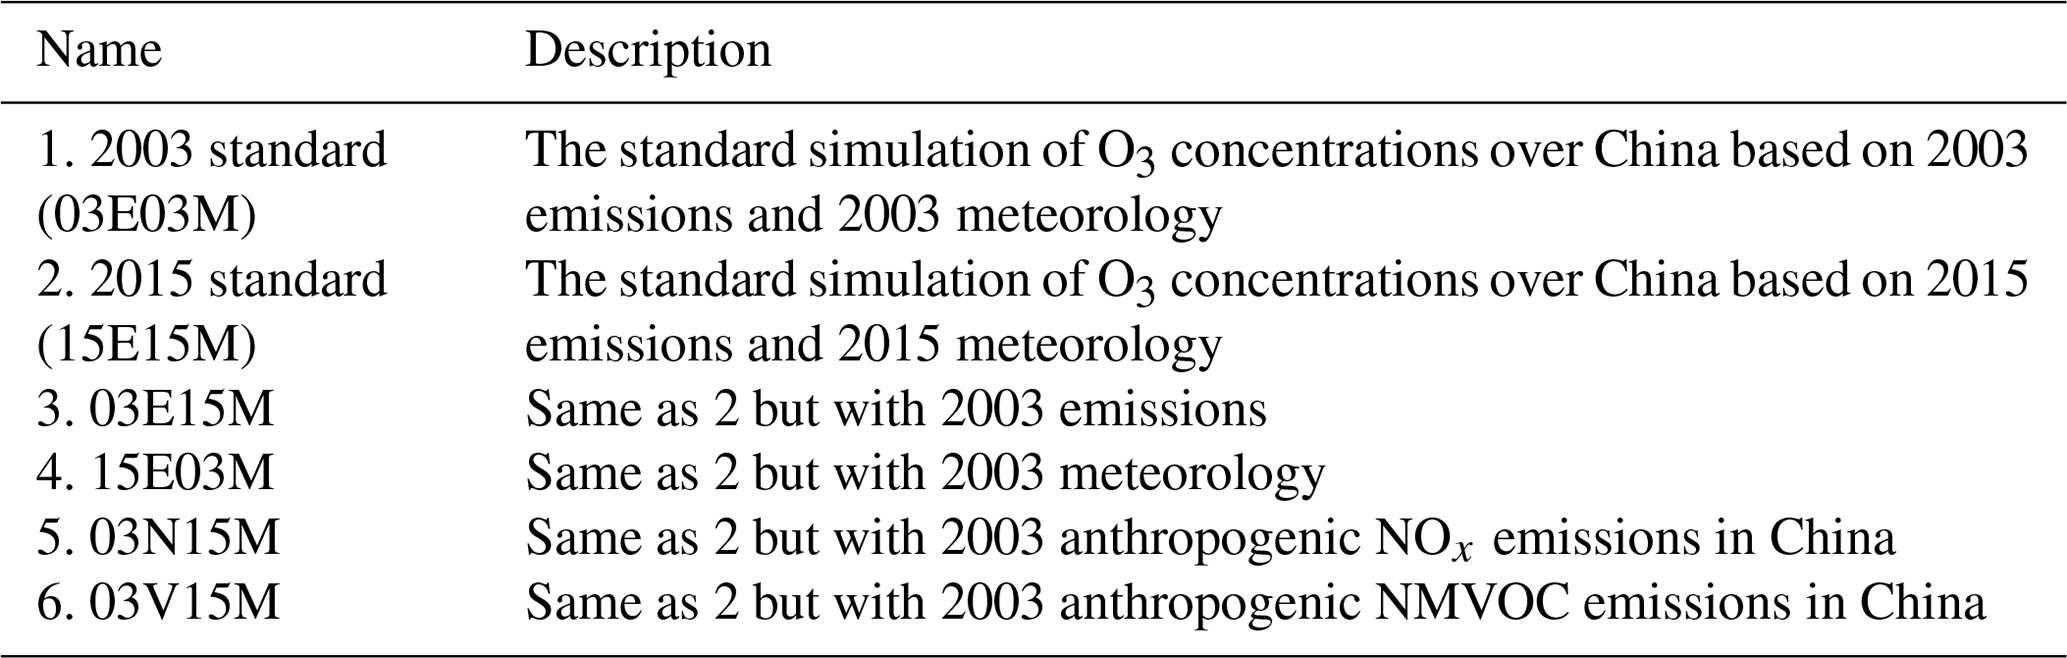
Table 1 summarizes the six model scenarios we set to identify the contributions from the changes in meteorological conditions and emissions between 2003 and 2015. We refer to the scenario using the emissions described in the previous section as the standard simulation and define the standard simulations for 2003 and 2015 as 03E03M and 15E15M (2003 emissions + 2003 meteorology and 2015 emissions + 2015 meteorology). In this case, the difference between O3 concentrations for 03E03M and 15E15M (denoted as 15E15M − 03E03M) is due to the combined effect of changes in emissions and meteorology between 2003 and 2015. Similarly, scenarios with 2003 emissions + 2015 meteorology and 2015 emissions + 2003 meteorology are defined as 03E15M and 15E03M, respectively. The contribution of the change in meteorological conditions can thus be calculated by the difference between the simulated O3 concentrations in the 03E15M and 03E03M scenarios (03E15M − 03E03M). Similarly, the contribution of emission changes can be calculated by 15E03M − 03E03M (or 15E15M − 03E15M). The contribution of the meteorological change based on the 2015 standard simulation is given by 15E15M − 15E03M. Since the amount of O3 formed responds nonlinearly to the NOx and NMVOC emissions, the sum of (03E15M − 03E03M) and (15E03M − 03E03M) does not equal (15E15M − 03E03M). However, we can still compare these two scenarios to quantify the effects of meteorology and emission changes.
We then investigate the effect of anthropogenic emissions (NOx and NMVOCs) on surface O3 concentrations based on the 2015 simulations. We replace the anthropogenic NOx or NMVOC emissions in the 2015 standard simulation with corresponding emissions for 2003 and keep the meteorology field, biomass burning and natural emissions (NOx from soil and lightning, biogenic VOCs (BVOCs), etc.) unchanged (03N15M and 03V15M, respectively). The contributions of anthropogenic NOx and NMVOC emission changes can be calculated by the differences between 15E15M (the 2015 standard simulation) and 03N15M (the 2003 NOx emission simulation) and between 15E15M and 03V15M (the 2003 NMVOC emission simulation), respectively.
3.1 Model evaluation
In this section, we evaluate the model's performance by comparing the simulated surface O3 concentrations with observations from baseline sites and the network of the Chinese National Environmental Monitoring Center (http://datacenter.mee.gov.cn/aqiweb2/getAirQualityDailyEn, last access: 2 October 2018 (in English) and http://datacenter.mee.gov.cn/websjzx/queryIndex.vm, last access: 2 October 2018 (in Chinese)).
For 2003 and 2004, only a few nonurban sites over CEC have surface O3 measurements available. We selected six rural/baseline sites for the model evaluation: Mt. Tai (36.25∘ N, 117.10∘ E; 1534 m a.s.l.), Mt. Hua (34.49∘ N, 110.09∘ E; 2064 m a.s.l.), Mt. Huang (30.13∘ N, 118.15∘ E; 1840 m a.s.l.), SDZ (40.65∘ N, 117.12∘ E; 293 m a.s.l.), Lin'an (30.30∘ N, 119.73∘ E; 139 m a.s.l.), and Cape D'Aguilar (22.22∘ N, 114.25∘ E; 60 m a.s.l.) (see Fig. S1 for the locations of these sites). The monthly mean O3 concentrations at these six sites were taken from the literature (Li et al., 2007; Meng et al., 2009; Wang et al., 2009; Fan et al., 2013; Sun et al., 2016). We compare the simulated surface O3 concentrations with the 2003 observations for Mt. Tai and Cape D'Aguilar but with the 2004 observations for the other four sites (Fig. 1a). The simulated surface O3 in 2004 was also compared against these observations in Fig. S2.
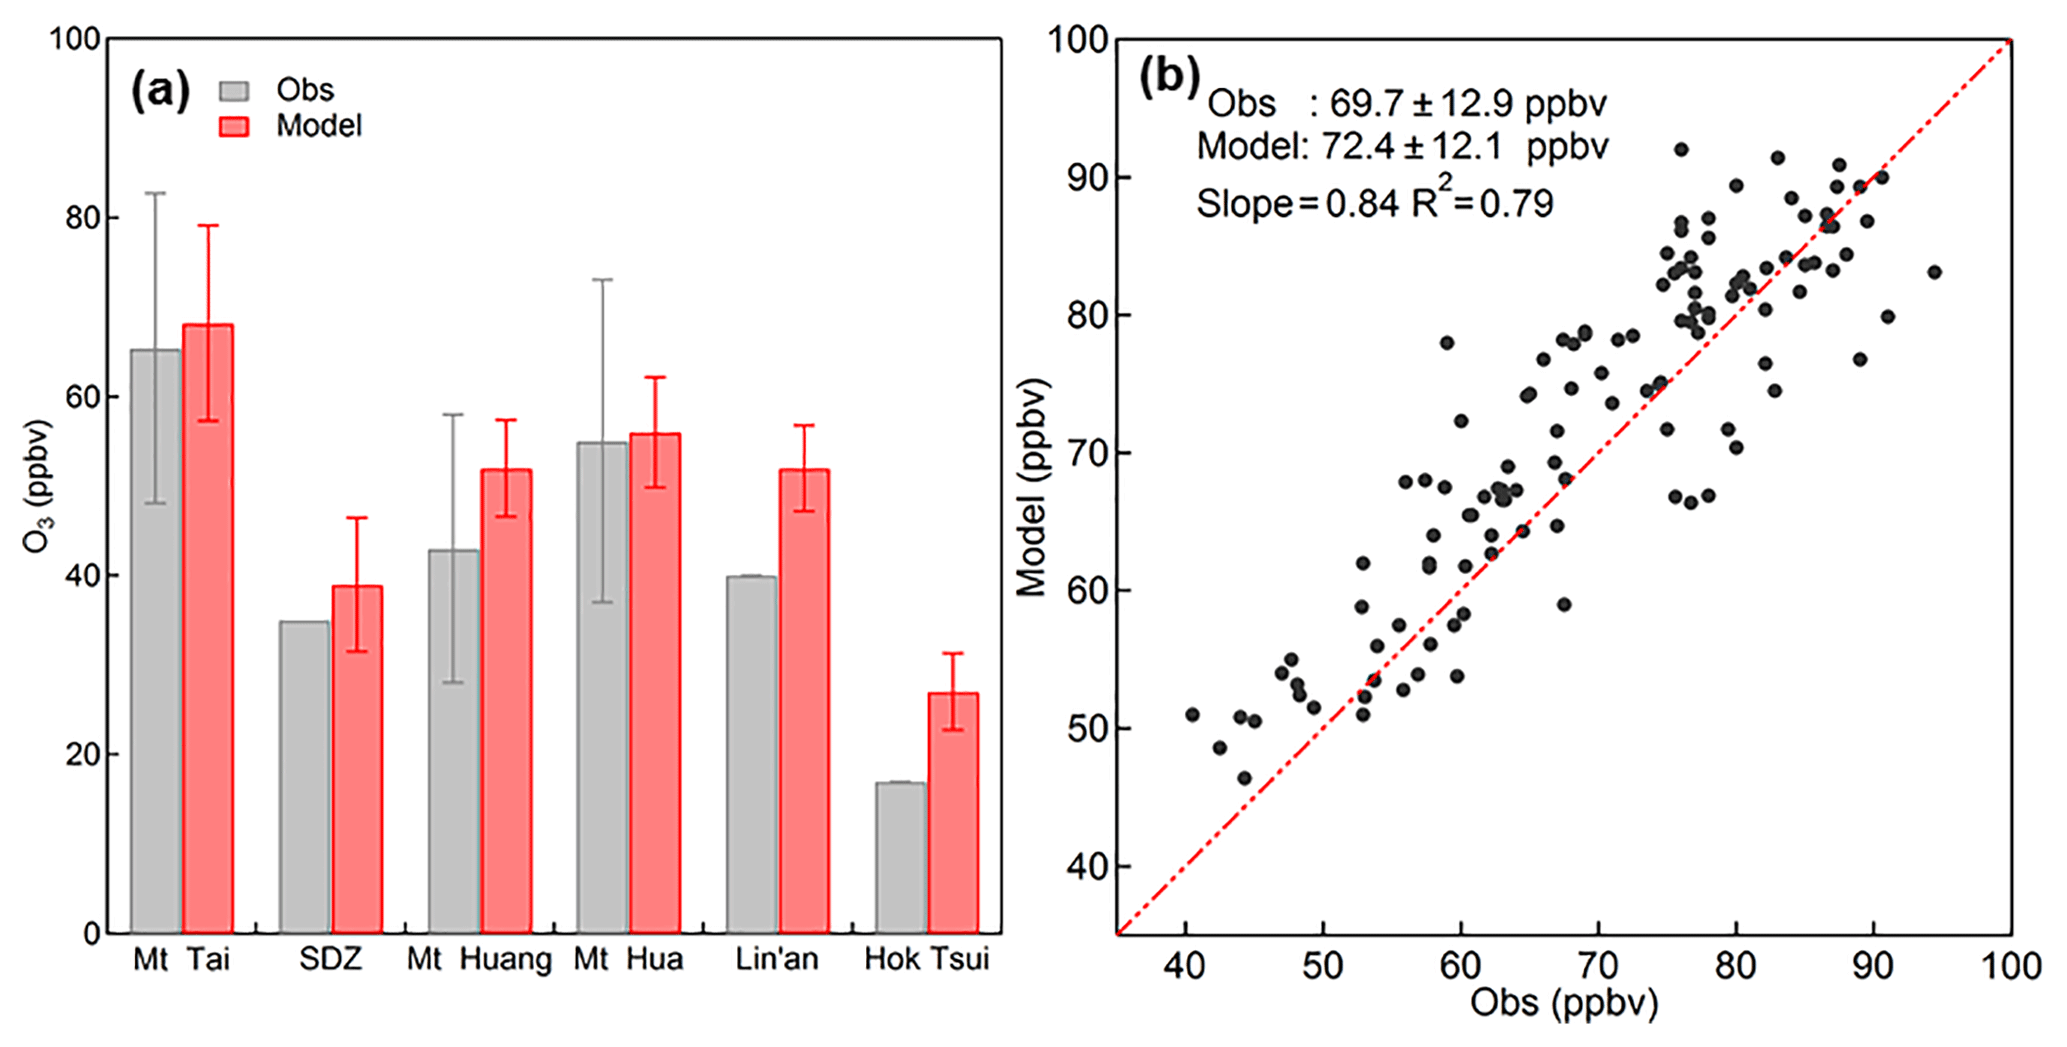
Figure 1(a) Comparison of observed and simulated monthly mean concentrations of surface O3 in July 2003. (Mt. Tai: July 2003; SDZ: Shangdianzi station: July 2004; Mt. Huang: July 2004; Mt. Hua: July 2004; Lin'an: July 2004; Cape D'Aguilar (or Hok Tsui in a): July 2003). (b) Correlation between observed and modeled monthly mean MDA8 O3 in July 2015 at 115 stations in eastern China.
Figure 1a compares the observed and simulated monthly mean O3 concentrations at the six sites. The simulated O3 concentrations match the observations at Mt. Tai, SDZ, and Mt. Hua well, with only minor positive biases (1–4 ppbv). In contrast, the model overestimates the O3 concentrations at Mt. Huang, Lin'an, and Cape D'Aguilar by approximately 10 ppbv. These sites in the south sector are often rainy or cloudy during summer, so the overestimation of O3 is likely to be due to the model's underestimation of precipitation and cloud cover (Ni et al., 2018). The overestimation at the Cape D'Aguilar coastal site of Hong Kong also reflects that the model resolution is insufficient to capture the local terrains and transport pathway (Ni et al., 2018). Similar results were obtained from the comparison between observed and simulated monthly mean O3 concentrations at the six sites in July 2004 (see Fig. S2).
For 2015, the simulated O3 concentrations are compared with observations by the network of the Chinese National Environmental Monitoring Center over east China (Fig. 1b). To avoid the influence of local emission and photochemical and deposition processes on small scales in urban areas, we selected one nonurban site to represent the O3 concentrations of each city over CEC. In general, the selected nonurban sites are suburban or rural sites, which are far away from the urban and industrialized areas. For cities where no nonurban sites are available, we chose the stations that are least affected by local pollution (i.e., sites relatively far away from traffic roads, factories, power plants). As a result, 115 nonurban sites were selected to represent 115 cities in east China. For MDA8 O3, the model results are highly correlated with the observations at most sites (R2=0.79). The model only overestimates the monthly MDA8 O3 by approximately 2.7±5.9 ppbv over CEC.
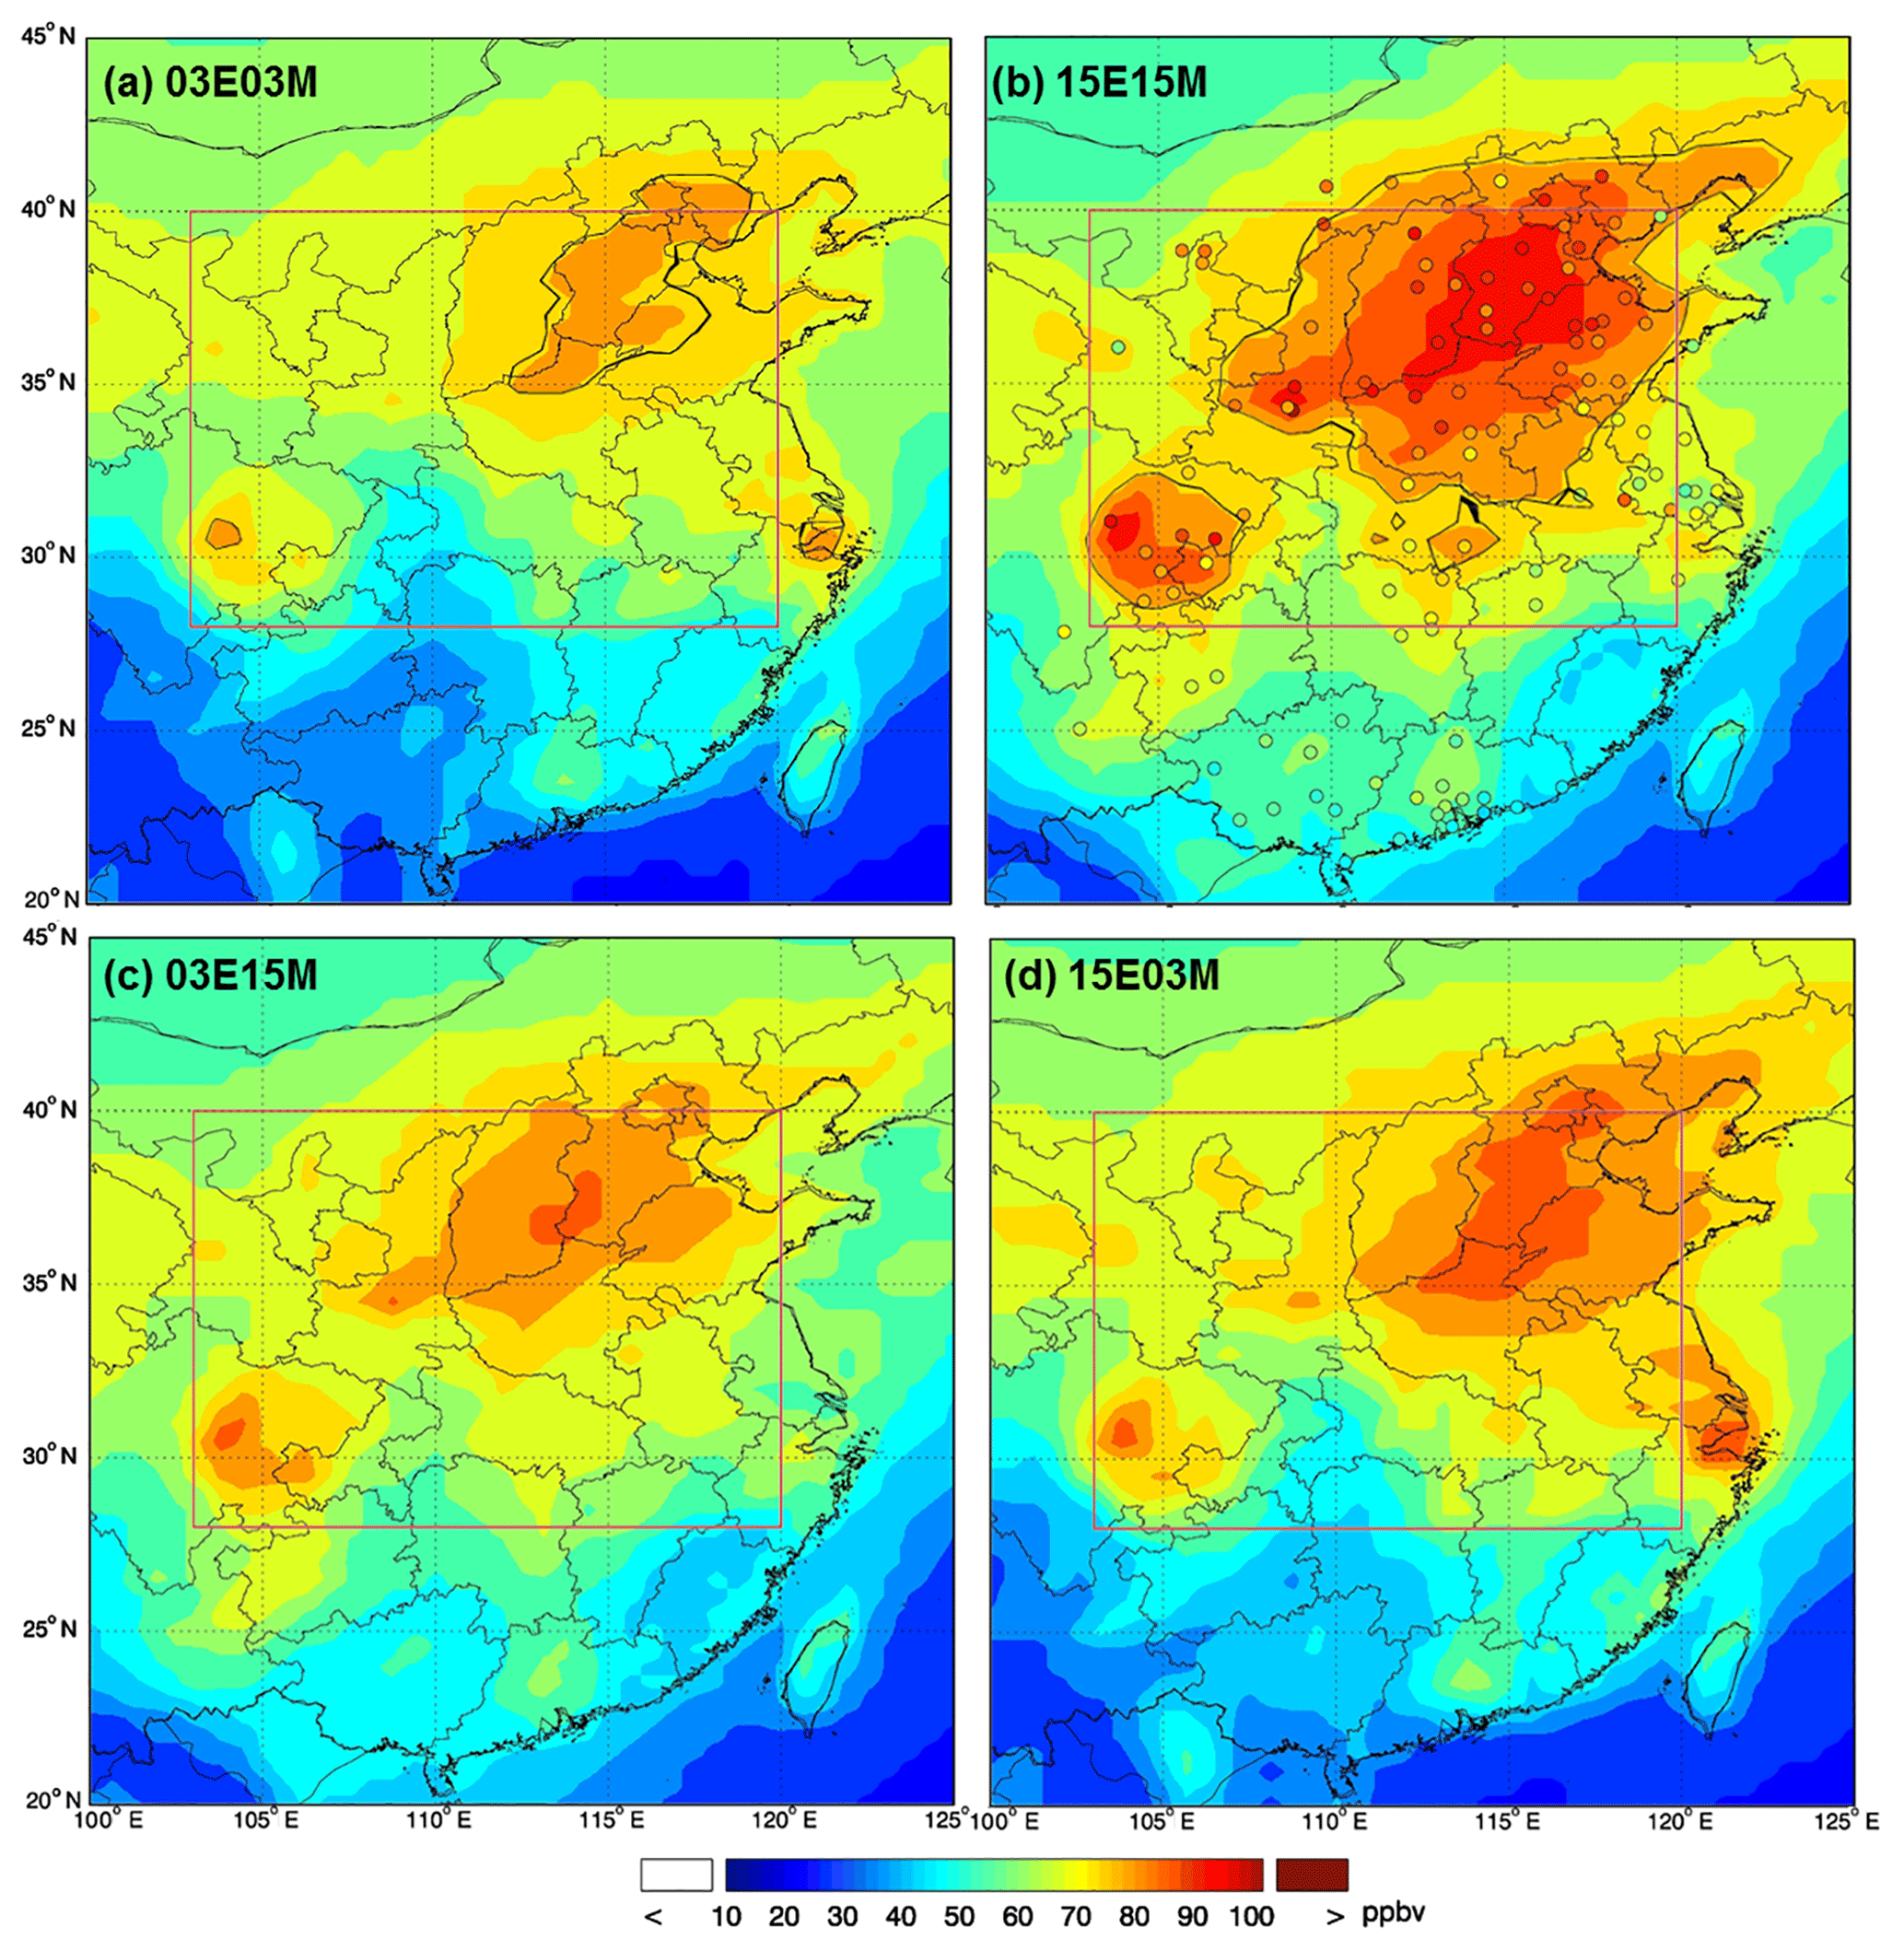
Figure 2Monthly mean spatial distributions of surface MDA8 O3 in July over east China. (a) 03E03M: 2003 standard simulation; (b) 15E15M: 2015 standard simulation; (c) 03E15M: 2003 emission + 2015 meteorology; (d) 15E03M: 2015 emission + 2003 meteorology. Black contours in (a) and (b) indicate the regions with MDA8 O3>75 ppbv. Filled circles in (b) show the observed MDA8 O3 at 115 sites of the network of the Chinese National Environmental Monitoring Center. The red rectangle represents the central eastern China region (CEC: 103–120∘ E, 28–40∘ N).
The model also captures the spatial distribution of MDA8 O3 very well. It ranges from 40–60 ppbv in the south to 80–100 ppbv in the north of CEC (Fig. 2b), patterns similar to those reported by Lin et al. (2009) and Lou et al. (2015). Time series and diurnal variations in hourly O3 concentrations from the model and observations at Mt. Tai in 2003 and nine representative sites in 2015 are compared in Figs. S3, S4 and S5. The nine observation sites are carefully selected to be far away from urban areas in the capital cities of nine provinces and municipalities, including Beijing, Tianjin, Ji'nan, Taiyuan, Zhengzhou, Wuhan, Chongqing, Changsha and Nanjing. The model reproduces the time series of O3 with a normalized mean bias of 4 % at Mt. Tai. The overestimation of O3 concentrations in the afternoon is likely to be due to the overestimated precursor emissions in the model. For the nine sites, the model captures most day-to-day variability and diurnal variations (Figs. S4 and S5). However, it produces larger biases during the night, mostly due to the titration of NO and a lower inversion layer (Yan et al., 2018a). We also compared the simulated diurnal variations in CO and NO2 in the nine cities against the observational data (see Figs. S6 and S7). Overall, the model captures most diurnal variations in CO and NO2. The underestimation of CO by the model may be due to the underestimation of emissions and/or the excessive OH (Yan et al., 2014; Young et al., 2013). The large bias in NO2 may be due to the effect of local emissions. Another reason for the discrepancy between observed and modeled NO2 is the overestimation by the measurements based on catalytic conversion of other oxidized nitrogen species to NO (Xu et al., 2013).
The observed yearly average MDA8 O3 at SDZ station increased by about 10.9 ppbv from 2004 to 2014 (Ma et al., 2016), comparable to the simulated result, which showed an increase of about 9.5 ppbv from July 2003 to July 2015. In addition, the observed results of Sun et al. (2016) reported the MDA8 O3 at Mt. Tai increased from 75.9±15.9 to 102.1±28.1 ppbv in July–August from 2003 to 2015, which is higher than the simulated result in this study (i.e., from 71.1±10.0 ppbv in July 2003 to 90.4±18.5 ppbv in July 2015). Nonetheless, the model captures the significant increase in surface O3 levels over CEC between July 2003 and July 2015.
3.2 Spatial distribution and diurnal variation simulated in different model scenarios
Figure 2 shows the simulated spatial distribution of monthly mean surface MDA8 O3 over eastern China (100 to 125∘ E, 20 to 50∘ N) for July 2003 and July 2015. The model simulates relatively high O3 concentrations over the North China Plain and Sichuan Basin, where anthropogenic emissions of O3 precursors are high. In July 2003, only a small area in CEC had an MDA8 O3 exceeding the Level II National Ambient Air Quality Standard (75 ppbv) (Fig. 2a), but in July 2015 it had expanded to nearly half of this region. Table 2 shows the monthly mean MDA8 O3 over CEC. The regional mean MDA8 O3 increased from 65.5±7.9 ppbv in July 2003 to 74.4±8.7 ppbv in July 2015, showing an increase of about 8.9±3.9 ppbv in 12 years. According to the limited reports of observed long-term (>10 years) changes of O3 concentrations, we find significant increases in summertime O3 (1–3 ppbv yr−1) in the north part (Beijing), east part (Mt. Tai) and south part (Lin'an) of CEC over the past 2 decades (Ding et al., 2008; Ma et al., 2016; Sun et al., 2016; Xu et al., 2008; Zhang et al., 2014b). Our results show that both daily mean O3 concentration and MDA8 O3 were significantly higher in July 2015 than in July 2003 over most areas of CEC (Fig. 3). The spatial distributions of MDA8 O3 in July 2004 and 2014 in Fig. S8 present patterns similar to in July 2003 and 2015. The regional mean MDA8 O3 increased from 67.8±6.2 ppbv in July 2004 to 74.8±9.8 ppbv in July 2014. In addition, the regional mean MDA8 O3 increased from 63.4±4.9 ppbv in August 2003 to 73.8±5.0 ppbv in August 2015 (Fig. S9). These results are comparable to those derived from the comparison between July 2003 and July 2015. A detailed description is provided in the Supplement. As the MDA8 O3 over southwestern China did not exceed the Level II National Ambient Air Quality Standard in July 2015, we do not focus our analysis on this area in the following sections.
Table 2Monthly mean (standard deviation) MDA8 O3 over CEC based on four model simulations. ΔMDA8 O3 represents the difference in MDA8 O3 concentrations between the 2015 standard simulation and 2003 standard simulation: ΔMDA8 O3=MDA8 O3 (2015) – MDA8 O3 (2003). MDA8 O3>75 ppbv indicates the region of MDA8 O3 exceeding the Level II National Ambient Air Quality Standard (75 ppbv) in July 2015.
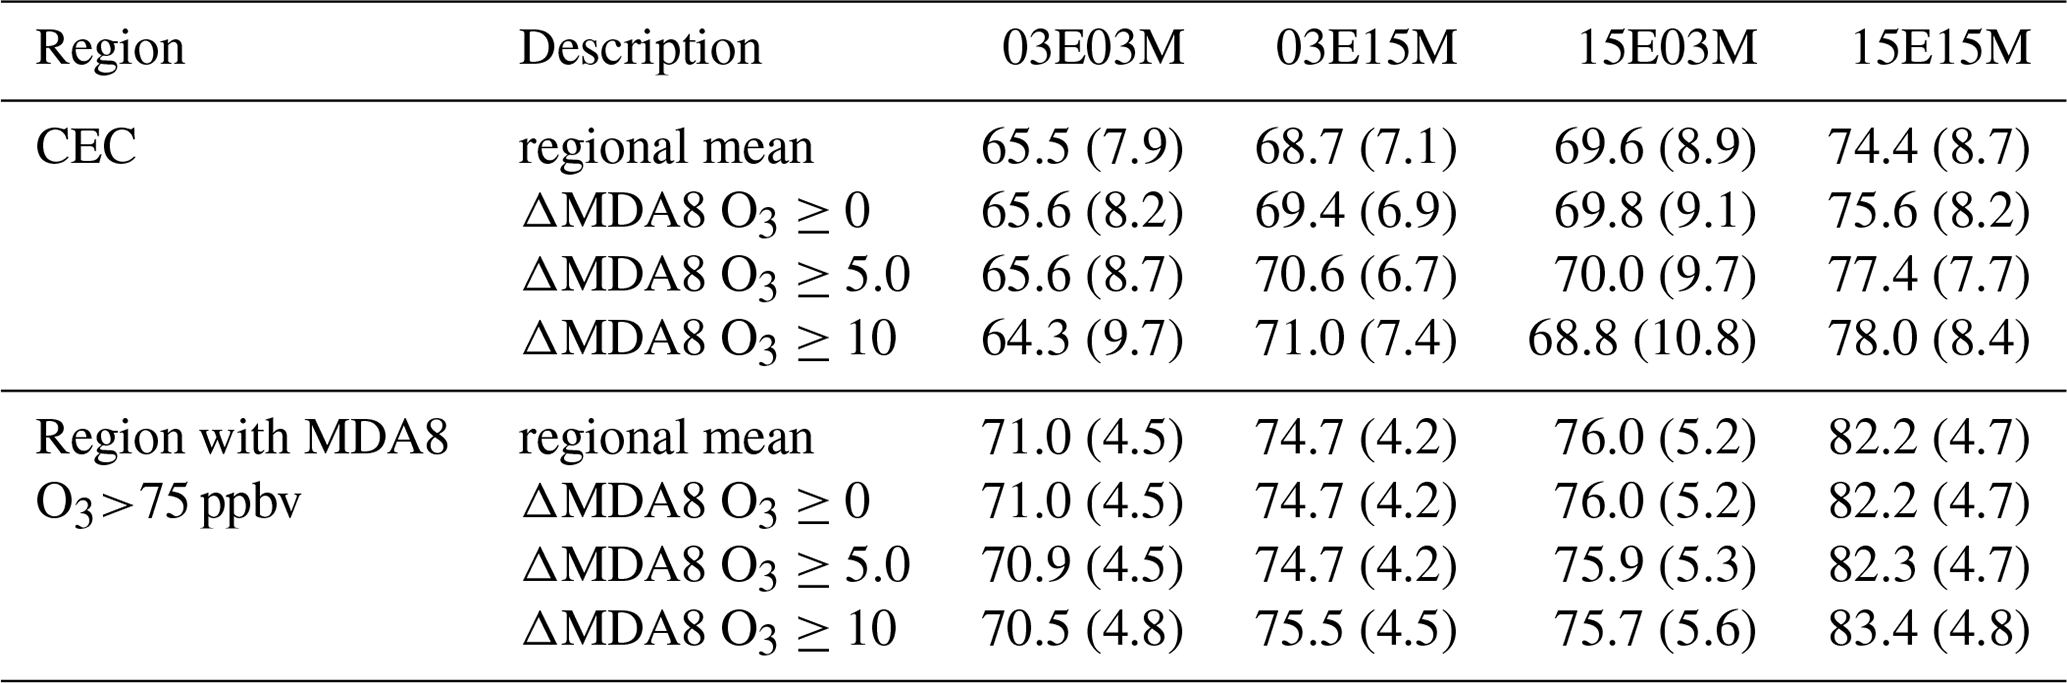

Figure 3Differences in monthly mean surface O3 in July of 2003 and 2015 (2015–2003) for daily mean O3 (a) and MDA8 O3 (b) simulated by 2003 and 2015 standard simulations.

Figure 4Averaged diurnal variations in surface O3 over CEC derived from four simulation results.
The diurnal variation in O3 over CEC illustrated in Fig. 4 shows that O3 increases by 4.9–6.7 ppbv before dawn (02:00–07:00 LT) and by 8.5–9.0 ppbv in the afternoon (13:00–18:00 LT). The much more significant increase in O3 in the afternoon in July 2015 is likely to be due to the stronger photochemical production, which is affected by both meteorological conditions and O3 precursor emissions. The slight increase in nighttime O3 reflects the residual effect of the daytime increase, despite strong nighttime titration by NO. This result is very different from the trends over the US, where summertime daytime O3 declined over the past decades is contrasted with the nighttime growth in all seasons (Yan et al., 2018a). Considering that the nighttime O3 is easily titrated by NO and the MDA8 O3 is a good indicator for the overall O3 pollution condition, we focus on the MDA8 O3 changes over CEC between July 2003 and July 2015 instead of daily mean O3.
We performed sensitivity tests to investigate the effects of meteorology and emissions on the MDA8 O3 over CEC. The contributions of meteorological change to the change in MDA8 O3 are defined by the 03E15M − 03E03M and 15E15M − 15E03M simulations. Here we discuss only 03E15M − 03E03M in detail, as the results of 15E15M − 15E03M are similar. The spatial distributions of O3 precursors (NO2 and NMVOCs) for the different simulation scenarios and their differences are shown in Figs. S10 and S11, which can better explain these results. A detailed description is given in the Supplement.
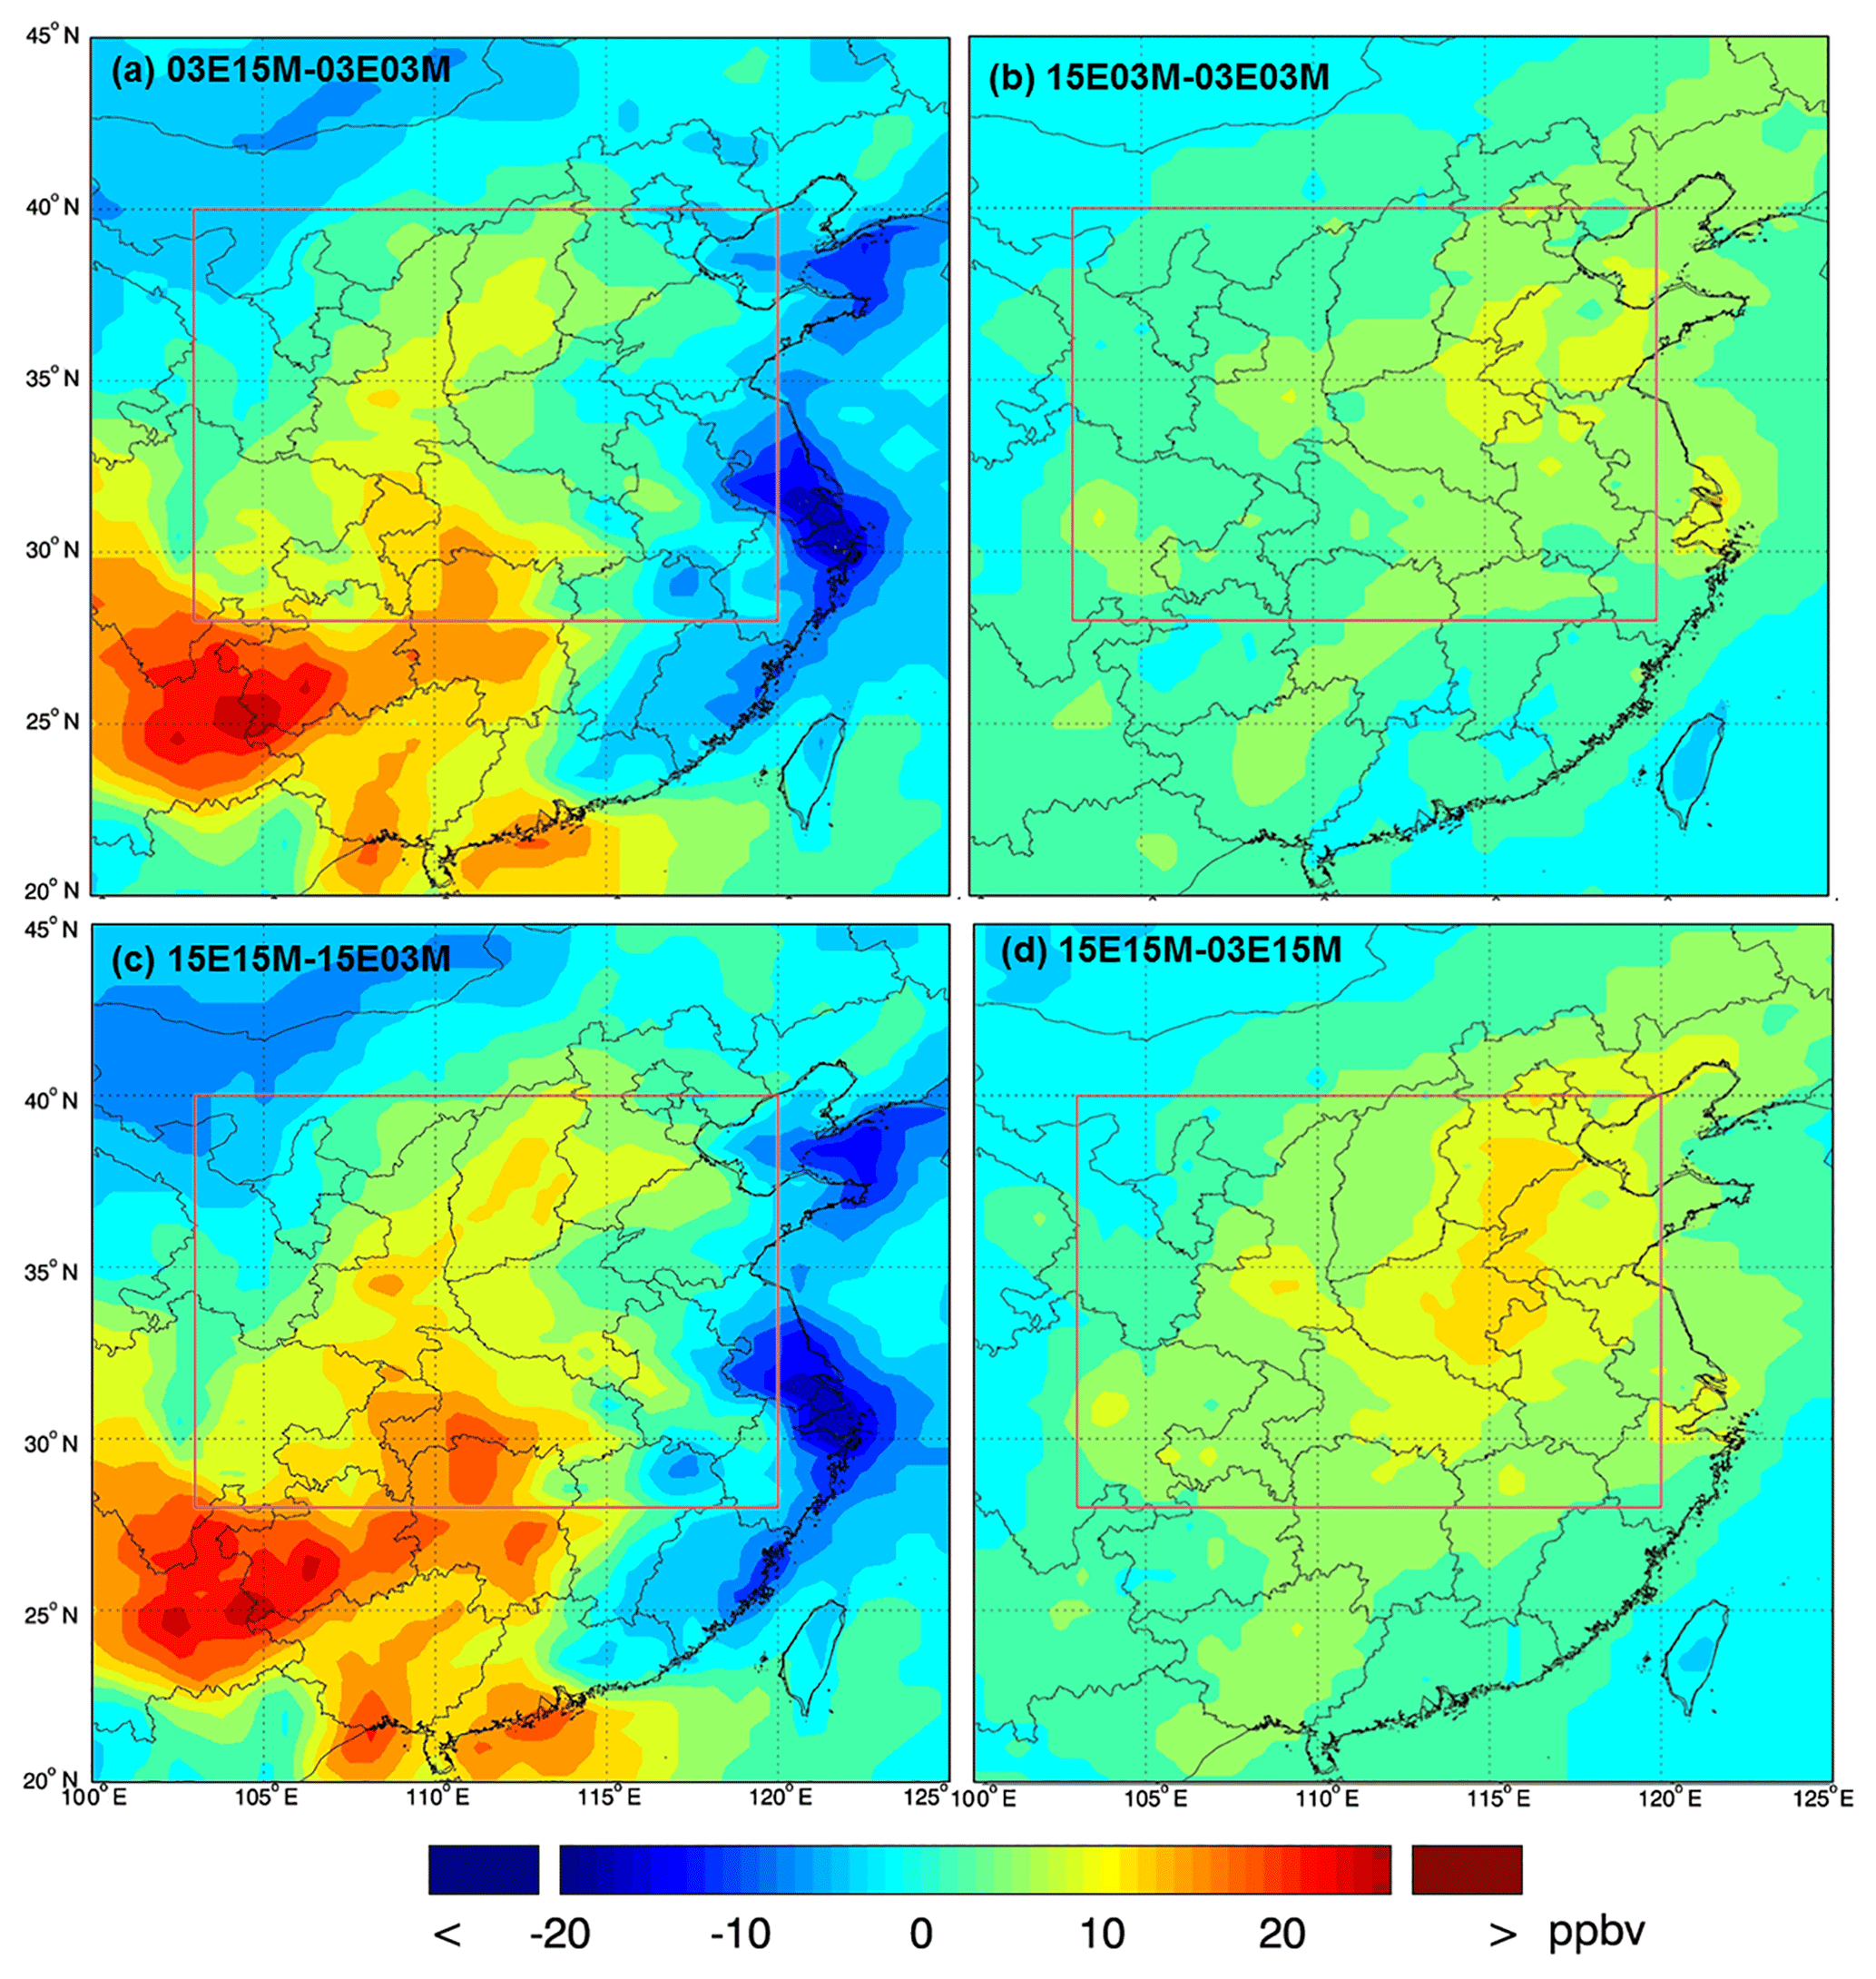
Figure 5(a) Contributions of meteorological changes to surface MDA8 O3, comparing 03E15M and 03E03M (2003 standard) simulations. (b) Contributions of emission changes to surface MDA8 O3, comparing 15E03M and 03E03M (2003 standard) simulations. (c) Contributions of meteorological changes to surface MDA8 O3, comparing 15E15M (2015 standard) and 15E03M simulations. (d) Contributions of emission changes to surface MDA8 O3, comparing 15E15M (2015 standard) and 03E15M simulations.
The regional averaged MDA8 O3 simulated by 03E15M is 68.7±7.1 ppbv, comparable to that simulated by 15E03M (69.6±8.9 ppbv), indicating the comparable contributions made by the changes in meteorology and in emissions. Figure 5 shows the spatial distribution of MDA8 O3 changes among different simulation scenarios. The regional mean MDA8 O3 of CEC is approximately 5.8±3.9 ppbv (5 %–95 % interval: −0.1–12.4 ppbv) higher in scenario 03E15M than in 03E03M (Fig. 5a) over the central part of CEC (106 to 115∘ E, 28 to 40∘ N). Over the eastern coastal areas (115 to 120∘ E, 28 to 40∘ N), however, the MDA8 O3 in the former scenario is less than in the latter by approximately ppbv (5 %–95 % interval: −6.8–3.8 ppbv), indicating great spatial variation in the influence of meteorological changes.
Atmospheric circulation patterns complicate the prediction of O3 concentrations in a specific region (He et al., 2012). The geopotential height map in Fig. S12 shows a high-pressure system over CEC at 850 hPa in July 2015. It is well known that high-O3-pollution events preferentially occur under high-pressure conditions (Wild et al., 2004; Zhao et al., 2009; Xu et al., 2011). This is because the relatively high geopotential height induces a stable weather condition. Neither horizontal nor vertical transport is strong, which favors the accumulation of atmospheric pollutants such as surface O3. We found that in July 2015 the wind speeds over the southern and eastern boundaries of CEC were much lower than those in July 2003 (Fig. S13), leading to much lower O3 flux across these two boundaries. The low O3 over southern CEC in July 2003 was mainly due to the strong southwesterly wind, decreasing O3 levels in this area. However, a large amount of O3 and its precursors from the central part of CEC was transported to the eastern coastal area, which increased O3 concentrations there (refer to Table 4: about 1343 Gg month−1 of O3 transported out across the east boundary). Conversely, in July 2015, only a small amount of O3 (refer to Table 4: −61 Gg month−1) and its precursors was transported away from the ocean by the weak southeasterly winds, which only decreased the O3 levels in the coastal area. However, in the central part of CEC, the wind was weak, leading to accumulating O3 pollution in this area. As a result, the O3 concentrations increased in the central part of CEC and decreased in the eastern coastal area in July 2015 compared to July 2003. More detailed and quantitative results on O3 transport flux will be discussed in Sect. 6.
In addition to the wind, air temperature and relative humidity are two other important meteorological parameters that can affect atmospheric O3 concentrations. High temperatures tend to accelerate the rate of ozone-related photochemical reactions, promoting O3 production (Ramsey et al., 2014). Cloud indirectly affects O3 pollution by blocking solar radiation, thus affecting the emission of BVOCs and the photochemical production of O3 (Lin et al., 2009). Figure S14 shows the simulated monthly mean spatial distributions of air temperature and relative humidity in July 2003 and July 2015. The simulated air temperatures in 2003 and 2015 were 300.6±3.2 and 300.5±3.2 K, respectively, almost at the same level. The simulated relative humidity in 2003 was 82±10 %, a little higher than in 2015 (77±12 %). The average net O3 production over CEC simulated by 03E03M (11.7 ppbv day−1) is very close to that simulated by 03E15M (11.9 ppbv day−1) (Table 4), suggesting that meteorological factors in 2003 and 2015 did not greatly change O3 photochemical reactions. Therefore, neither air temperature nor relative humidity plays an important role in explaining the difference in surface O3 between 2003 and 2015.
We summarize the regional mean O3 over CEC and the regions with MDA8 O3 >75 ppbv in Table 2. To avoid the influence of uneven spatial distributions of O3 concentration changes, we performed a gradient analysis, which selected different levels for the difference of MDA8 O3 (ΔMDA8 O3) between 2003 standard and 2015 standard simulation (15E15M − 03E03M). The differences in MDA8 O3 were analyzed in four ways: regional mean, ΔMDA8 O3≥0 ppbv, ΔMDA8 O3≥5 ppbv and ΔMDA8 O3≥10 ppbv. For the regional mean over CEC, the increase in MDA8 O3 driven by meteorology is approximately 3.1±4.9 ppbv, from 65.5±7.9 ppbv (03E03M) to 68.7±7.1 ppbv (03E15M). Where ΔMDA8 O3≥10 ppbv, mostly over the central part of CEC, the MDA8 O3 increases by 6.7±3.4 ppbv from 64.3±9.7 ppbv to 71.0±7.4 ppbv due to the meteorological change. Thus, the meteorological conditions have a greater impact on the O3 change when the difference between 2003 and 2015 is higher than 10 ppbv. Similar results are also found in regions with MDA8 O3>75 ppbv, where the increase in the O3 concentration is approximately 3.6±3.2 and 5.1±2.5 ppbv for the regional mean and for the ΔMDA8 O3≥10 case, respectively. This indicates that surface O3 levels are more sensitive to meteorological conditions in regions with larger O3 increase.
As described above, the impact of emission changes on MDA8 O3 between 2003 and 2015 can be estimated by 15E03M − 03E03M or 15E15M − 03E15M. Here we discuss 15E03M − 03E03M in detail. Similar results were found from 15E15M − 03E15M.
Figure 5b shows the contributions of emission changes to surface O3 levels. The emission change leads to an increase in MDA8 O3 over most areas of CEC, and it has a much smaller spatial variability than the meteorological change does (Fig. 5a). Compared to the influence of the meteorological change (03E15M − 03E03M: 3.1±4.9 ppbv), the increase in emissions leads to a higher regional mean O3 increase (15E03M − 03E03M: 4.0±1.9 ppbv) over CEC (Table 2). The changes in NO2 and NMVOCs also indicate the impact of emission changes is larger than that of meteorological change (Figs. S10 and S11). In contrast, for the case of ΔMDA8 O3≥10 ppbv, the influence of emission change on O3 (15E03M − 03E03M: 4.5±2.1 ppbv) is smaller than that of the meteorological field change (03E15M − 03E03M: 6.7±3.4 ppbv). The increases in MDA8 O3 due to emission change are about 3.5±1.4 ppbv (5 %–95 % interval: 1.6–6.0 ppbv) and 5.6±1.8 ppbv (5 %–95 % interval: 2.2–8.4 ppbv) over the central and eastern parts of CEC, which are different from the spatial pattern caused by meteorological change. It is worth noting that in the polluted regions where MDA8 O3>75 ppbv, the contribution of emission change increases from 5.0±1.8 ppbv for the ΔMDA8 O3≥0 ppbv case to 5.2±1.7 ppbv for the ΔMDA8 O3≥10 ppbv case, whilst the contribution of meteorology change increases from 3.7±3.2 to 5.0±2.5 ppbv. Even if the ΔMDA8 O3 is greater than 10 ppbv, the O3 increase caused by emission change is still a little higher than that caused by meteorological change, indicating the dominant effect of emissions on O3 pollution in the highly polluted regions.
Table 3Emissions of NOx, CO and NMVOCs over CEC for July 2003 and July 2015, including anthropogenic emissions and biogenic emissions. Units: NO, CO and CH2O: Gg month−1; others: Gg C month−1.
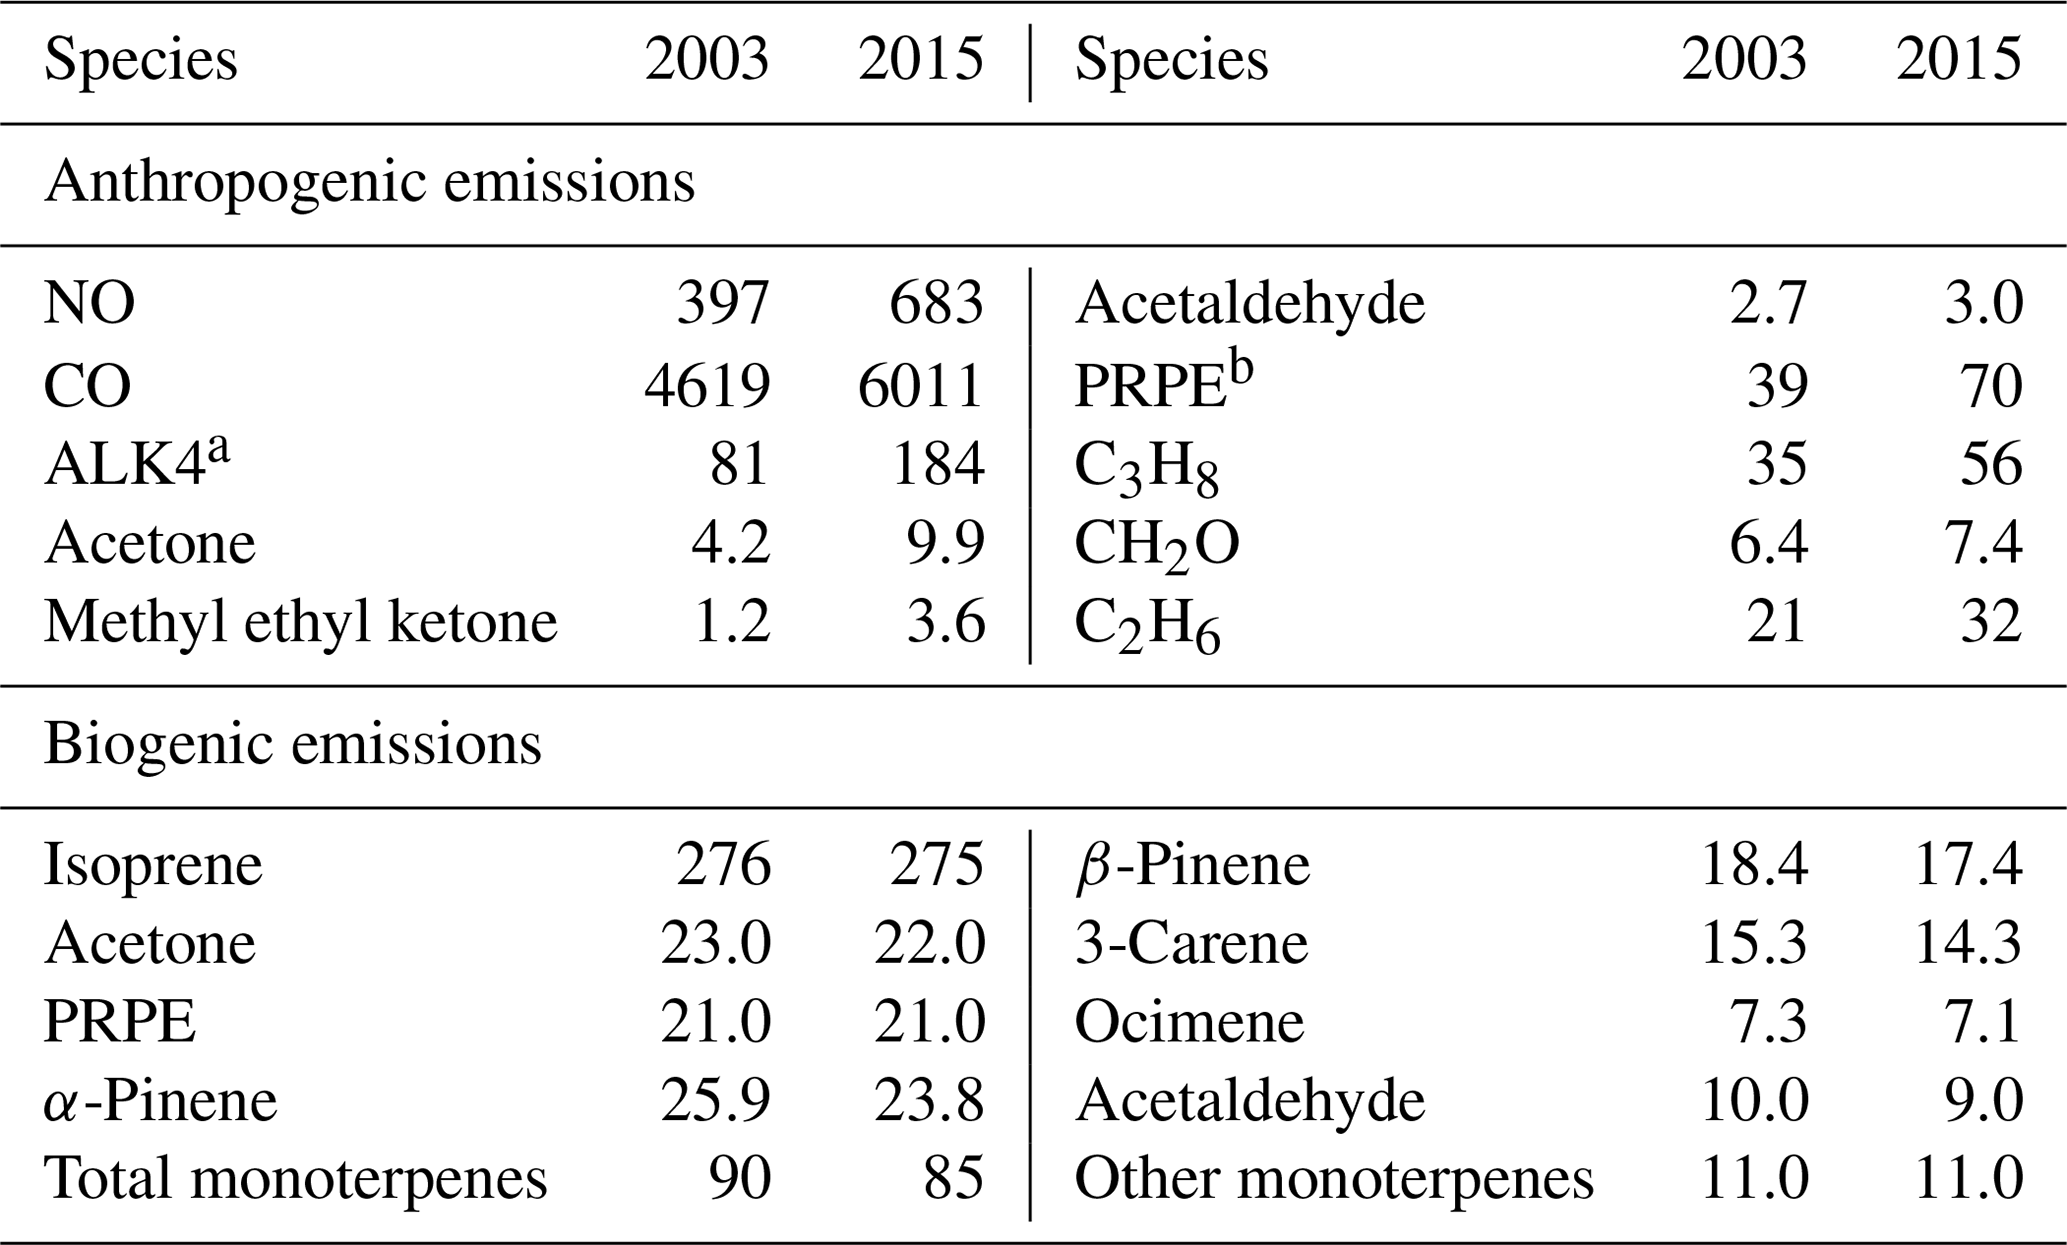
a ALK4: alkanes and other nonaromatic compounds that react only with OH and have kOH between 5×10³ and 1×10⁴ ppm−1 min−1. b PRPE: OLE1+OLE2, OLE1: alkenes (other than ethene) with kOH<7×10⁴ ppm−1 min−1; OLE2: alkenes with kOH>7×10⁴ ppm−1 min−1.
We summarize the emissions of NOx, CO and NMVOCs over CEC for July 2003 and July 2015 in Table 3. The anthropogenic NOx emissions increased from 397 Gg month−1 in July 2003 to 683 Gg month−1 in July 2015. The anthropogenic NMVOCs also increased significantly, with the NMVOC emissions increasing from 190 Gg C month−1 in July 2003 to 365 Gg C month−1 in July 2015. The spatial distributions of anthropogenic NOx and NMVOC emissions in Figs. S15 and S16 also indicate significant increases from 2003 to 2015. Anthropogenic CO emissions increased from 4619 Gg month−1 in July 2003 to 6011 Gg month−1 in July 2015. The natural BVOCs, which are greatly affected by meteorological conditions, remained unchanged between 2003 and 2015. Biomass burning often occurs sequentially from south to north in CEC in the spring harvest season and lasts from late May to late June (Chen et al., 2017). In July, the biomass burning emissions generally decrease to approximately 1 % of the anthropogenic emissions (not shown). Therefore, the effect of the emission change on O3 is primarily due to anthropogenic emissions of NOx and NMVOCs.
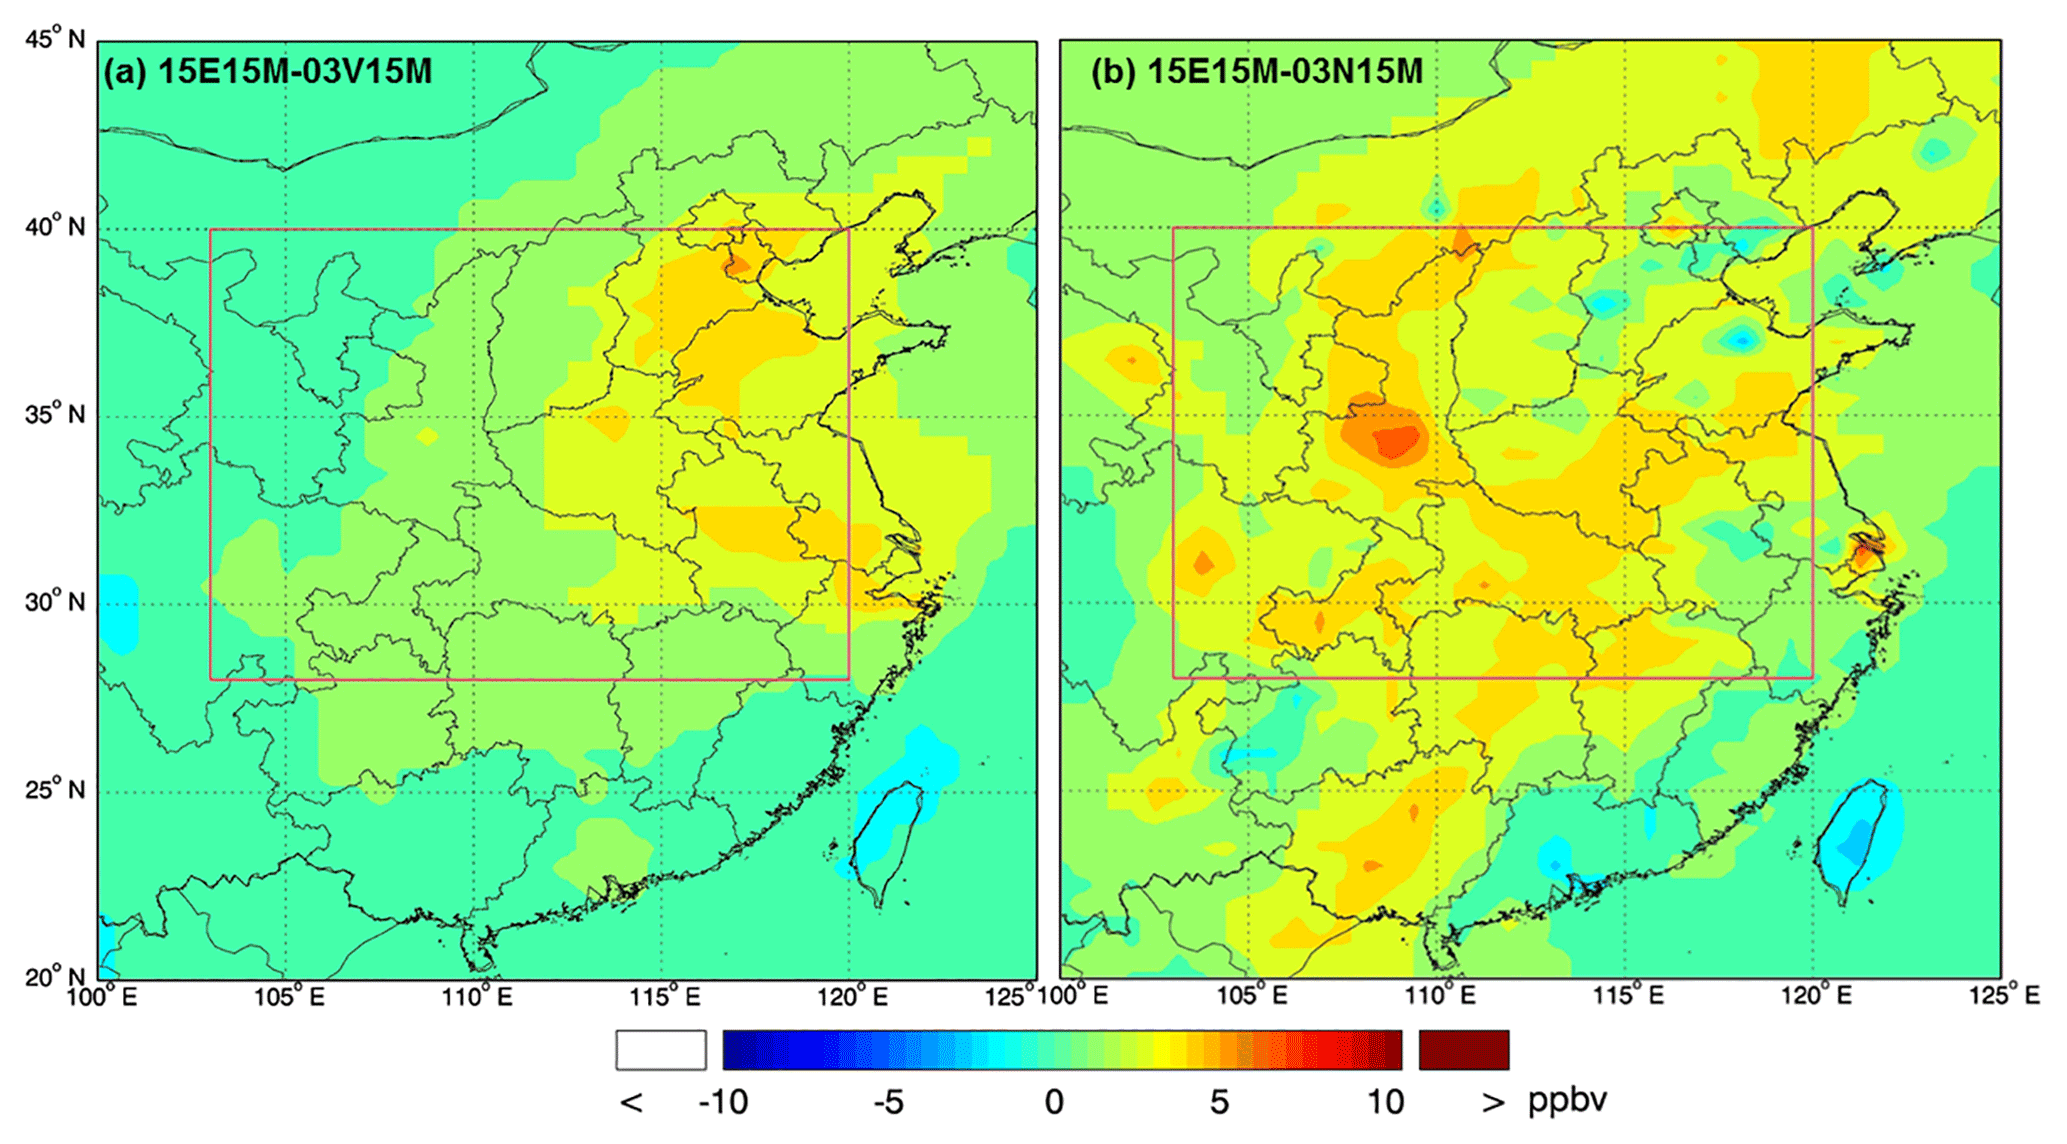
Figure 6Effects of anthropogenic NMVOCs (a) and NOx (b) emission changes on surface MDA8 O3 concentrations between 2003 and 2015 when other emissions and meteorological parameters are fixed at 2015 levels.
To separate the effect of anthropogenic emissions from the effect of natural emission on O3 variability, we conducted two further simulations, 03N15M and 03V15M (see Sect. 2.2). Figure 6 shows the spatial distribution of the MDA8 O3 differences between the 2015 standard simulation and these two simulations. Anthropogenic NMVOCs (Fig. 6a) have a great impact on MDA8 O3 over the eastern part of CEC, increasing MDA8 O3 by approximately 2.5±0.8 ppbv (5 %–95 % interval: 1.1–3.7 ppbv). The emissions of NMVOCs increased greatly over the eastern part of CEC (see Fig. S16). The change in MDA8 O3 due to anthropogenic NMVOCs varies from −0.5 to 5.1 ppbv over different subregions of CEC, with a regional mean of 1.4±1.1 ppbv. The effect of anthropogenic NOx (Fig. 6b), in comparison, is more complicated. From 2003 to 2015, MDA8 O3 declined in some cities such as Tianjin, Ji'nan, Taiyuan and Nanjing in the eastern part of CEC, but increased in the central and western parts (regional mean: 2.8±0.9 ppbv, 5 %–95 % interval: 1.4–4.1 ppbv). The change in MDA8 O3 due to anthropogenic NOx varies from −3.1 to 6.7 ppbv, with a regional mean of 2.5±1.1 ppbv over CEC (5 %–95 % interval: −0.2–3.3 ppbv). The reduction of O3 in the urban area is likely to be due to the abundant NOx from industrial and traffic sources. Beijing shows a slight decrease in NOx emissions, leading to a slight change in O3 levels. In most rural areas of CEC, O3 formation tends to be limited by the concentrations of NOx (the so-called NOx-limited regime). Thus, O3 is increased significantly as we increase the anthropogenic emissions of NOx. A VOC-limited regime in a few urban areas and a NOx-limited or transition regime in regional rural areas of CEC have been reported in some observational and model simulation studies (Wang et al., 2017, and references therein). The change in BVOC emissions only leads to a small change in MDA8 O3 over CEC, resulting in an increase in the O3 level of only 0.3 ppbv (not shown), mostly due to the change in meteorological conditions. Therefore, if the meteorological conditions are fixed as the 2015 conditions, the increase in anthropogenic NMVOCs is the most important factor responsible for the O3 increase over the eastern part of CEC, whereas NOx emissions tend to increase MDA8 O3 over central and western parts but decrease it in a few urban areas over eastern parts of CEC.
Ozone concentrations are determined by chemical and dynamic processes including transport, chemical production and loss, and deposition. In this section, we discuss the effects of these processes on the surface O3 over CEC.
Table 4Horizontal and vertical flux (Gg month−1), photochemical production and loss (Gg month−1; the numbers in the parentheses are in ppbv day−1), and dry deposition (Gg month−1) of O3 over CEC from the surface to 850 hPa based on four types of simulations. For horizontal flux, positive values indicate eastward or northward transport. For vertical fluxes, positive values indicate upward transport. “Total” refers to the sum of horizontal and vertical transport. Net photochemical O3 production is the difference between production and loss of O3.
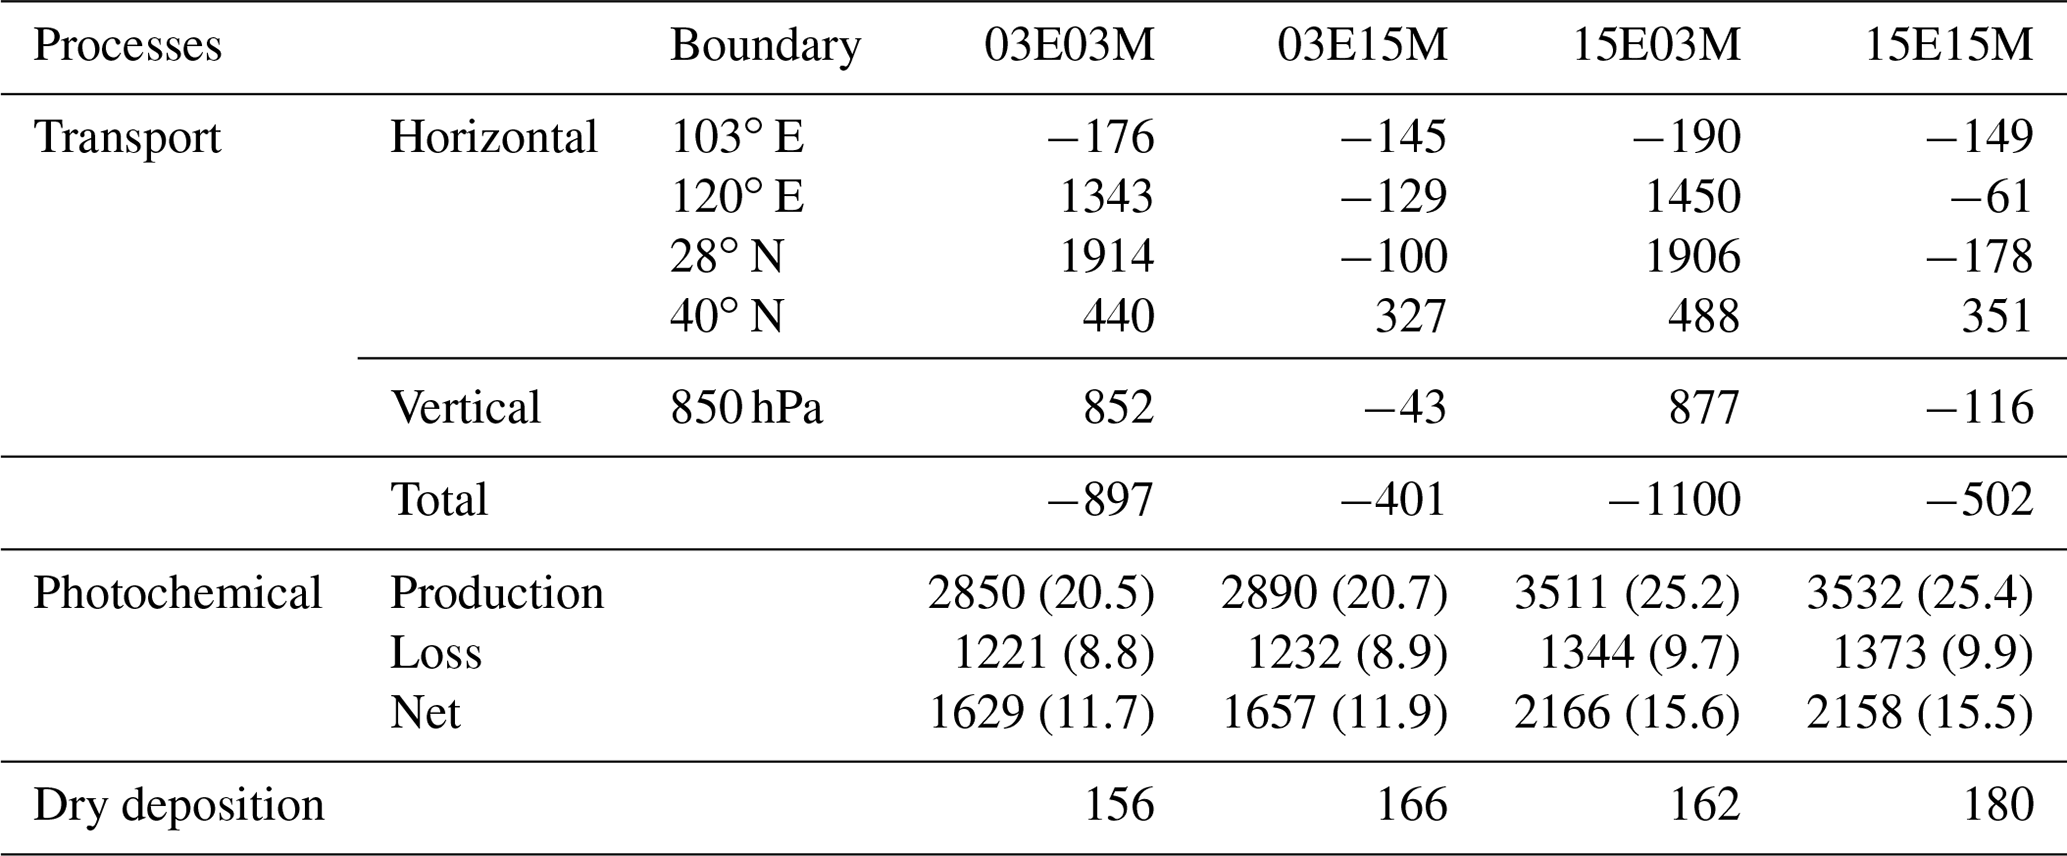
Table 4 documents the horizontal and vertical mass fluxes of O3 over CEC at four boundaries (north, east, south and west). The flux at each boundary was calculated from the surface to 850 hPa. In July 2003, the air flows into CEC through the south boundary, and then out across the other three boundaries. In contrast, the air masses flow into this area across the east boundary in July 2015, and then out across the left three boundaries. The larger O3 flux from each boundary in July 2003 is due to stronger winds. Compared to the 03E03M simulation (−897 Gg month−1; negative value means export of O3 from this region), 03E15M shows a much lower O3 flux (−401 Gg month−1), indicating that weather conditions in 2015 play a more important role in pollutant accumulation, which is consistent with our analysis in Sect. 4. The larger O3 flux in 15E03M (−1100 Gg month−1) in comparison to the 03E03M simulation, however, is mostly due to the increased precursor emissions in 2015.
Table 4 also shows the chemical production and loss of O3 over CEC from the surface to 850 hPa. The net photochemical production of O3 in July 2015 (2158 Gg month−1 or 15.5 ppbv day−1) is higher than that in July 2003 (1629 Gg month−1 or 11.7 ppbv day−1). By comparing the 03E03M simulation with the 03E15M simulation, we find that the weather conditions in 2015 do not promote excessive net O3 production (03E15M: 1657 Gg month−1 or 11.9 ppbv day−1), almost the same level as 03E03M simulation. In comparison, due to more O3 precursor emissions in 2015, the net O3 production by 15E03M (2166 Gg month−1 or 15.6 ppbv day−1) is much higher than the 03E03M simulation. The net photochemical O3 production in this study is similar to the result of Li et al. (2007), who reported a net production of 10–32 ppbv day−1 at three mountain sites over CEC in 2004. Deposition (mainly dry deposition) is another factor that affects O3 concentrations. The 03E15M simulation shows an increase in O3 dry deposition by only 10 Gg month−1, compared to the 03E03M simulation (156 Gg month−1). Thus dry deposition is less affected by changes in weather conditions.
As shown in Table 4, the O3 budget analysis indicates CEC is a strong photochemical source region in both 2003 and 2015. The photochemically produced O3 is mostly exported by transport and to a lesser extent removed by dry deposition. In July 2003, about half of the net photochemically formed O3 in the CEC region was removed by transport (897 out of 1629 Gg month−1). In comparison, only one-fourth of the net photochemically produced O3 (502 out of 2158 Gg month−1) was transported out of CEC in July 2015. Comparing the results of the 2003 and 2015 standard simulations (15E15M − 03E03M), we find less O3 export from CEC in 2015 than in 2003, which means about 395 Gg month−1 (2015–2003) of O3 was accumulated in this region. In addition, net O3 production increased by 529 Gg month−1 and O3 dry deposition only increased by 24 Gg month−1 from the 2003 standard simulation to 2015 standard simulation. As a result, the increase in O3 concentrations from July 2003 to July 2015 should be due to the enhanced photochemical production (mainly due to the increased emissions) and the weakened export (due to the meteorological conditions).
In this study, we used the global GEOS-Chem model and its Asian nested model to simulate surface O3 over central eastern China between July 2003 and July 2015. We found that the regional averaged concentration of MDA8 O3 increased from 65.5±7.9 ppbv in 2003 to 74.4±8.7 ppbv in 2015. The increase in the regional average MDA8 O3 due to emission changes (4.0±1.9 ppbv) is higher than that caused by meteorological changes (3.1±4.9 ppbv) compared with the 2003 standard simulation. The effects of meteorological changes have a larger spatial variability than those of emission changes. The increase in anthropogenic NMVOC emissions increased O3 over the eastern part of CEC, whereas the increased anthropogenic NOx emissions dominated the increase in O3 over the central and western parts of CEC but decreased O3 levels in a few urban areas over eastern CEC. The O3 formation over most areas is in a NOx-limited or transition regime, whereas a few urban areas tend to be in a VOC-limited regime. The increase in surface O3 is mainly via photochemical production and transport processes. The meteorological conditions (mostly due to wind patterns) in July 2015 tended to accumulate pollution and reduced O3 export over the central part of CEC and thus enhanced O3 levels there. Air temperature and relative humidity do not promote the O3 production in July 2015. The increased net O3 photochemical production is mostly due to increased precursor emissions.
Our results have implications for the formulation of effective control strategies for O3 air pollution in CEC. Although the simulated average effect of emission changes is larger than the effect of meteorological changes, the regions with larger O3 increases (e.g., ΔMDA8 O3≥10 ppbv) show a higher sensitivity to meteorology than to emission changes. The results imply that assessment of the effectiveness of regional and urban O3 control strategies needs to be placed in the context of meteorology. The O3 transport flux analysis further suggests that large-scale regional transport is an important contributor to the surface O3 increases from 2003 to 2015. Transport issues in local O3 control strategies should go beyond transport from neighboring areas (e.g., cities) and account for the long-distance transport (e.g., across provinces).
The underlying research data can be accessed upon contact with the corresponding author (Likun Xue; xuelikun@sdu.edu.cn).
The supplement related to this article is available online at: https://doi.org/10.5194/acp-19-1455-2019-supplement.
LS processed the data, conducted the GEOS-Chem simulation and wrote the paper. LX designed the research, supervised the data analysis and revised the paper. YW supervised the data analysis. LL, JL, RN, YY, LC and JL assisted with the model simulation and helped in the data analysis and paper correction. QZ and WW helped in paper correction.
The authors declare that they have no conflict of interest.
This article is part of the special issue “Regional transport and transformation of air pollution in eastern China”. It is not associated with a conference.
This research was supported by the National Key Research and Development
Program of China (2016YFC0200500), the National Natural Science Foundation
of China (41675118, 91544213, 41775115), the Qilu Youth Talent Program of
Shandong University, the Jiangsu Collaborative Innovation Center for Climate
Change and the Taishan Scholars (ts201712003). The model simulations were
performed at the Supercomputing Center of Shandong University in Weihai. We thank
the Chinese National Environmental Monitoring Center for providing the
observation data. Lei Sun acknowledges the support of the China Scholarship
Council. We also appreciate the three anonymous reviewers for their helpful
comments to improve the original submission.
Edited by: David Parrish
Reviewed by: three anonymous referees
Auvray, M. and Bey, I.: Long-range transport to Europe: Seasonal variations and implications for the European ozone budget, J. Geophys. Res.-Atmos, 110, D11303, https://doi.org/10.1029/2004JD005503, 2005.
Chen, J., Li, C., Ristovski, Z., Milic, A., Gu, Y., Islam, M. S., Wang, S., Hao, J., Zhang, H., He, C., Guo, H., Fu, H., Miljevic, B., Morawska, L., Thai, P., Fat, L., Pereira, G., Ding, A., Huang, X., and Dumka, U.: A review of biomass burning: Emissions and impacts on air quality, health and climate in China, Sci. Total Environ., 579, 1000–1034, https://doi.org/10.1016/j.scitotenv.2016.11.025, 2017.
China State Council: Twelfth Five-Year Plan on National Economy and Social Development of the People's Republic of China, available at: http://www.gov.cn/2011lh/content_1825838.htm, 2011 (in Chinese).
Cooper, O. R., Gao, R. S., Tarasick, D., Leblanc, T., and Sweeney, C.: Long-term ozone trends at rural ozone monitoring sites across the United States, 1990–2010, J. Geophys. Res.-Atmos., 117, D22307, https://doi.org/10.1029/2012JD018261, 2012.
Cooper, O. R., Parrish, D., Ziemke, J., Balashov, N., Cupeiro, M., Galbally, I., Gilge, S., Horowitz, L., Jensen, N., Lamarque, J.-F., Naik, V., Oltmans, S., Schwab, J., Shindell, D., Thompson, A., Thouret, V., Wang, Y., and Zbinden, R.: Global distribution and trends of tropospheric ozone: An observation-based review, Elem. Sci. Anth., 2, 000029, https://doi.org/10.12952/journal.elementa.000029, 2014.
Crutzen, P.: A discussion of the chemistry of some minor constituents in the stratosphere and troposphere, Pure Appl. Geophys., 106, 1385–1399, https://doi.org/10.1007/BF00881092, 1973.
Danielsen, E. F.: Stratospheric-tropospheric exchange based on radioactivity, ozone and potential vorticity, J. Atmos. Sci., 25, 502–518, https://doi.org/10.1175/1520-0469(1968)025<0502:STEBOR>2.0.CO;2, 1968.
Ding, A. J., Wang, T., Thouret, V., Cammas, J.-P., and Nédélec, P.: Tropospheric ozone climatology over Beijing: analysis of aircraft data from the MOZAIC program, Atmos. Chem. Phys., 8, 1–13, https://doi.org/10.5194/acp-8-1-2008, 2008.
Fan, Y., Fan, S. Zhang, H, Zu, F., Meng, Q., and He, J.: Characteristics of SO2, NO2, O3 volume fractions and their relationship with weather conditions at Linan in summer and winter, Trans. Atmos. Sci., 36 121–128, https://doi.org/10.13878/j.cnki.dqkxxb.2013.01.013, 2013 (in Chinese).
Fu, Y. and Liao, H.: Simulation of the interannual variations of biogenic emissions of volatile organic compounds in China: Impacts on tropospheric ozone and secondary organic aerosol, Atmos. Environ., 59, 170–185, https://doi.org/10.1016/j.atmosenv.2012.05.053, 2012.
Gaudel, A., Cooper, O. R., Ancellet, G., Barret, B., Boynard, A., Burrows, J. P., Clerbaux, C., Coheur, P. F., Cuesta, J., Cuevas Agulló, E., and Doniki, S.: Tropospheric Ozone Assessment Report: Present-day distribution and trends of tropospheric ozone relevant to climate and global atmospheric chemistry model evaluation, Elem. Sci. Anth., 6, 39, https://doi.org/10.1525/elementa.291, 2018.
Guenther, A. B., Jiang, X., Heald, C. L., Sakulyanontvittaya, T., Duhl, T., Emmons, L. K., and Wang, X.: The Model of Emissions of Gases and Aerosols from Nature version 2.1 (MEGAN2.1): an extended and updated framework for modeling biogenic emissions, Geosci. Model Dev., 5, 1471–1492, https://doi.org/10.5194/gmd-5-1471-2012, 2012.
He, J., Wang, Y., Hao, J., Shen, L., and Wang, L.: Variations of surface O3 in August at a rural site near Shanghai: Influences from the West Pacific subtropical high and anthropogenic emissions, Environ. Sci. Pollut. Res., 19, 4016–4029, https://doi.org/10.1007/s11356-012-0970-5, 2012.
He, Y. J., Uno, I., Wang, Z. F., Pochanart, P., Li, J., and Akimoto, H.: Significant impact of the East Asia monsoon on ozone seasonal behavior in the boundary layer of Eastern China and the west Pacific region, Atmos. Chem. Phys., 8, 7543–7555, https://doi.org/10.5194/acp-8-7543-2008, 2008.
Hess, P. G. and Zbinden, R.: Stratospheric impact on tropospheric ozone variability and trends: 1990–2009, Atmos. Chem. Phys., 13, 649–674, https://doi.org/10.5194/acp-13-649-2013, 2013.
Holtslag, A. A. M. and Boville, B. A.: Local versus nonlocal boundary-layer diffusion in a global climate model, J. Clim., 6, 1825–1842, https://doi.org/10.1175/1520-0442(1993)006<1825:LVNBLD>2.0.CO;2, 1993.
Hudman, R. C., Moore, N. E., Mebust, A. K., Martin, R. V., Russell, A. R., Valin, L. C., and Cohen, R. C.: Steps towards a mechanistic model of global soil nitric oxide emissions: implementation and space based-constraints, Atmos. Chem. Phys., 12, 7779–7795, https://doi.org/10.5194/acp-12-7779-2012, 2012.
IPCC: Climate change 2013: The physical science basis, in: Contribution of Working Group I to the Fifth Assessment Report of the Intergovernmental Panel on Climate Change, edited by: Stocker, T. F., Qin, D., Plattner, G.-K., Tignor, M., Allen, S. K., Boschung, J., Nauels, A., Xia, Y., Bex, V., and Mildgley, P. M., Cambridge University Press, Cambridge, United Kingdom and New York, 1–1535, 2013.
Jacob, D. J., Logan, J. A., and Murti, P. P.: Effect of rising Asian emissions on surface ozone in the United States, Geophys. Res. Lett., 26, 2175–2178, https://doi.org/10.1029/1999GL900450, 1999.
Kuhns, H., Green, M., Etyemezian, V., Watson, J., and Pitchford, M.: Big Bend Regional Aerosol and Visibility Observational (BRAVO) Study Emissions Inventory, Report prepared for BRAVO Steering Committee, Desert Research Institute, Las Vegas, Nevada, 2003.
Kurokawa, J., Ohara, T., Morikawa, T., Hanayama, S., Janssens-Maenhout, G., Fukui, T., Kawashima, K., and Akimoto, H.: Emissions of air pollutants and greenhouse gases over Asian regions during 2000–2008: Regional Emission inventory in ASia (REAS) version 2, Atmos. Chem. Phys., 13, 11019–11058, https://doi.org/10.5194/acp-13-11019-2013, 2013.
Li, J., Wang, Z., Akimoto, H., Gao, C., Pochanart, P., and Wang, X.: Modeling study of ozone seasonal cycle in lower troposphere over east Asia, J. Geophys. Res.-Atmos., 112, D22S25, https://doi.org/10.1029/2006JD008209, 2007.
Li, M., Liu, H., Geng, G., Hong, C., Liu, F., Song, Y., Tong, D., Zheng, B., Cui, H., Man, H., Zhang, Q., and He, K.: Anthropogenic emission inventories in China: A review, Natl. Sci. Rev., 4, 834–866, https://doi.org/10.1093/nsr/nwx150, 2017a.
Li, M., Zhang, Q., Kurokawa, J.-I., Woo, J.-H., He, K., Lu, Z., Ohara, T., Song, Y., Streets, D. G., Carmichael, G. R., Cheng, Y., Hong, C., Huo, H., Jiang, X., Kang, S., Liu, F., Su, H., and Zheng, B.: MIX: a mosaic Asian anthropogenic emission inventory under the international collaboration framework of the MICS-Asia and HTAP, Atmos. Chem. Phys., 17, 935–963, https://doi.org/10.5194/acp-17-935-2017, 2017b.
Lin, J. T. and McElroy, M. B.: Impacts of boundary layer mixing on pollutant vertical profiles in the lower troposphere: Implications to satellite remote sensing, Atmos. Environ., 44, 1726–1739, https://doi.org/10.1016/j.atmosenv.2010.02.009, 2010.
Lin, J. T., Wuebbles, D. J., and Liang, X. Z.: Effects of intercontinental transport on surface ozone over the United States: Present and future assessment with a global model, Geophys. Res. Lett., 35, L02805, https://doi.org/10.1029/2007GL031415, 2008.
Lin, M., Holloway, T., Oki, T., Streets, D. G., and Richter, A.: Multi-scale model analysis of boundary layer ozone over East Asia, Atmos. Chem. Phys., 9, 3277–3301, https://doi.org/10.5194/acp-9-3277-2009, 2009.
Lin, M., Fiore, A. M., Horowitz, L. W., Langford, A. O., Oltmans, S. J., Tarasick, D., and Rieder, H. E.: Climate variability modulates western US ozone air quality in spring via deep stratospheric intrusions, Nat. Commun., 6, 7105, https://doi.org/10.1038/ncomms8105, 2015.
Logan, J. A.: Tropospheric ozone: Seasonal behavior, trends, and anthropogenic influence, J. Geophys. Res.-Atmos., 90, 10463–10482, https://doi.org/10.1029/JD090iD06p10463, 1985.
Lou, S., Liao, H., Yang, Y., and Mu, Q.: Simulation of the interannual variations of tropospheric ozone over China: Roles of variations in meteorological parameters and anthropogenic emissions, Atmos. Environ., 122, 839–851, https://doi.org/10.1016/j.atmosenv.2015.08.081, 2015.
Lu X., Hong J., Zhang L., Cooper OR.,Schultz MG., Xu X., Wang T., Gao M., Zhao Y., and Zhang Y., Environ. Sci. Technol. Lett., 5, 487–494, 2018.
Ma, Z., Xu, J., Quan, W., Zhang, Z., Lin, W., and Xu, X.: Significant increase of surface ozone at a rural site, north of eastern China, Atmos. Chem. Phys., 16, 3969–3977, https://doi.org/10.5194/acp-16-3969-2016, 2016.
Mao, J., Paulot, F., Jacob, D. J., Cohen, R. C., Crounse, J. D., Wennberg, P. O., Keller, C. A., Hudman, R. C., Barkley, M. P., and Horowitz, L. W.: Ozone and organic nitrates over the eastern United States: Sensitivity to isoprene chemistry, J. Geophys. Res.-Atmos., 118, 11256–11268, https://doi.org/10.1002/jgrd.50817, 2013.
McLinden, C. A., Olsen, S. C., Hannegan, B., Wild, O., Prather, M. J., and Sundet, J.: Stratospheric ozone in 3-D models: A simple chemistry and the cross-tropopause flux, J. Geophys. Res.-Atmos., 105, 14653–14665, https://doi.org/10.1029/2000JD900124, 2000.
Meng, Z. Y., Xu, X. B., Yan, P., Ding, G. A., Tang, J., Lin, W. L., Xu, X. D., and Wang, S. F.: Characteristics of trace gaseous pollutants at a regional background station in Northern China, Atmos. Chem. Phys., 9, 927–936, https://doi.org/10.5194/acp-9-927-2009, 2009.
Monks, P. S.: A review of the observations and origins of the spring ozone maximum, Atmos. Environ., 34, 3545–3561, https://doi.org/10.1016/S1352-2310(00)00129-1, 2000.
Monks, P. S., Archibald, A. T., Colette, A., Cooper, O., Coyle, M., Derwent, R., Fowler, D., Granier, C., Law, K. S., Mills, G. E., Stevenson, D. S., Tarasova, O., Thouret, V., von Schneidemesser, E., Sommariva, R., Wild, O., and Williams, M. L.: Tropospheric ozone and its precursors from the urban to the global scale from air quality to short-lived climate forcer, Atmos. Chem. Phys., 15, 8889–8973, https://doi.org/10.5194/acp-15-8889-2015, 2015.
Murray, L. T., Jacob, D. J., Logan, J. A., Hudman, R. C., and Koshak, W. J.: Optimized regional and interannual variability of lightning in a global chemical transport model constrained by LIS/OTD satellite data, J. Geophys. Res.-Atmos., 117, D20307 https://doi.org/10.1029/2012JD017934, 2012.
Ni, R., Lin, J., Yan, Y., and Lin, W.: Foreign and domestic contributions to springtime ozone over China, Atmos. Chem. Phys., 18, 11447–11469, https://doi.org/10.5194/acp-18-11447-2018, 2018.
Oltmans, S. J., Lefohn, A. S., Shadwick, D., Harris, J. M., Scheel, H. E., Galbally, I., Tarasick, D. W., Johnson, B. J., Brunke, E. G., Claude, H., Zeng, G., Nichol, S., Schmidlin, F., Davies, J., Cuevas, E., Redondas, A., Naoe, H., Nakano, T., and Kawasato, T.: Recent tropospheric ozone changes: A pattern dominated by slow or no growth, Atmos. Environ., 67, 331–351, https://doi.org/10.1016/j.atmosenv.2012.10.057, 2013.
Ott, L. E., Pickering, K. E., Stenchikov, G. L., Allen, D. J., DeCaria, A. J., Ridley, B., Lin, R. F., Lang, S., and Tao, W. K.: Production of lightning NOx and its vertical distribution calculated from three-dimensional cloud-scale chemical transport model simulations, J. Geophys. Res.-Atmos., 115, D04301, https://doi.org/10.1029/2009JD011880, 2010.
Parrish, D., Lamarque, J. F., Naik, V., Horowitz, L., Shindell, D., Staehelin, J., Derwent, R., Cooper, O., Tanimoto, H., Volz-Thomas, A., Gilge, S., Scheel, H.-E., Steinbacher, M., and Fröhlich, M.: Long-term changes in lower tropospheric baseline ozone concentrations: Comparing chemistry-climate models and observations at northern midlatitudes, J. Geophys. Res.-Atmos., 119, 5719–5736, https://doi.org/10.1002/2013JD021435, 2014.
Price, C. and Rind, D.: A simple lightning parameterization for calculating global lightning distributions, J. Geophys. Res.-Atmos., 97, 9919–9933, https://doi.org/10.1029/92JD00719, 1992.
Ramsey, N. R., Klein, P. M., and Moore, B.: The impact of meteorological parameters on urban air quality, Atmos. Environ., 86, 58–67, https://doi.org/10.1016/j.atmosenv.2013.12.006, 2014.
Randerson, J., Chen, Y., Werf, G., Rogers, B., and Morton, D.: Global burned area and biomass burning emissions from small fires, J. Geophys. Res., 117, G04012, https://doi.org/10.1029/2012JG002128, 2012.
Real, E., Law, K. S., Weinzierl, B., Fiebig, M., Petzold, A., Wild, O., Methven, J., Arnold, S., Stohl, A., Huntrieser, H., Roiger, A., Schlager, H., Stewart, D., Avery, M., Sachse, G., Browell, E., Ferrare, R., and Blake, D.: Processes influencing ozone levels in Alaskan forest fire plumes during long-range transport over the North Atlantic, J. Geophys. Res.-Atmos., 112, D10S41, https://doi.org/10.1029/2006JD007576, 2007.
Seinfeld, J. H. and Pandis, S. N.: Atmospheric Chemistry and Physics: From Air Pollution to Climate Change, John Wiley & Sons, 2016.
Sun, L., Xue, L., Wang, T., Gao, J., Ding, A., Cooper, O. R., Lin, M., Xu, P., Wang, Z., Wang, X., Wen, L., Zhu, Y., Chen, T., Yang, L., Wang, Y., Chen, J., and Wang, W.: Significant increase of summertime ozone at Mount Tai in Central Eastern China, Atmos. Chem. Phys., 16, 10637–10650, https://doi.org/10.5194/acp-16-10637-2016, 2016.
Verstraeten, W. W., Neu, J. L., Williams, J. E., Bowman, K. W., Worden, J. R., and Boersma, K. F.: Rapid increases in tropospheric ozone production and export from China, Nat. Geosci., 8, 690, https://doi.org/10.1038/ngeo2493, 2015.
Wang, T., Ding, A., Gao, J., and Wu, W. S.: Strong ozone production in urban plumes from Beijing, China, Geophys. Res. Lett., 33, L21806, https://doi.org/10.1029/2006GL027689, 2006.
Wang, T., Wei, X. L., Ding, A. J., Poon, C. N., Lam, K. S., Li, Y. S., Chan, L. Y., and Anson, M.: Increasing surface ozone concentrations in the background atmosphere of Southern China, 1994–2007, Atmos. Chem. Phys., 9, 6217–6227, https://doi.org/10.5194/acp-9-6217-2009, 2009.
Wang, T., Xue, L., Brimblecombe, P., Lam, Y. F., Li, L., and Zhang, L.: Ozone pollution in China: A review of concentrations, meteorological influences, chemical precursors, and effects, Sci. Total Environ., 575, 1582–1596, https://doi.org/10.1016/j.scitotenv.2016.10.081, 2017.
Wang, Y., Zhang, Y., Hao, J., and Luo, M.: Seasonal and spatial variability of surface ozone over China: contributions from background and domestic pollution, Atmos. Chem. Phys., 11, 3511–3525, https://doi.org/10.5194/acp-11-3511-2011, 2011.
Wild, O., Pochanart, P., and Akimoto, H.: Trans-Eurasian transport of ozone and its precursors, J. Geophys. Res.-Atmos., 109, D11302, https://doi.org/10.1029/2003JD004501, 2004.
Wu, J., Kong, S., Wu, F., Cheng, Y., Zheng, S., Yan, Q., Zheng, H., Yang, G., Zheng, M., Liu, D., Zhao, D., and Qi, S.: Estimating the open biomass burning emissions in central and eastern China from 2003 to 2015 based on satellite observation, Atmos. Chem. Phys., 18, 11623–11646, https://doi.org/10.5194/acp-18-11623-2018, 2018.
Xiao, Y., Logan, J. A., Jacob, D. J., Hudman, R. C., Yantosca, R., and Blake, D. R.: Global budget of ethane and regional constraints on US sources, J. Geophys. Res.-Atmos., 113, D21306, https://doi.org/10.1029/2007JD009415, 2008.
Xu, W., Lin, W., Xu, X., Tang, J., Huang, J., Wu, H., and Zhang, X.: Long-term trends of surface ozone and its influencing factors at the Mt Waliguan GAW station, China – Part 1: Overall trends and characteristics, Atmos. Chem. Phys., 16, 6191–6205, https://doi.org/10.5194/acp-16-6191-2016, 2016.
Xu, W., Xu, X., Lin, M., Lin, W., Tarasick, D., Tang, J., Ma, J., and Zheng, X.: Long-term trends of surface ozone and its influencing factors at the Mt Waliguan GAW station, China – Part 2: The roles of anthropogenic emissions and climate variability, Atmos. Chem. Phys., 18, 773–798, https://doi.org/10.5194/acp-18-773-2018, 2018.
Xu, W. Y., Zhao, C. S., Ran, L., Deng, Z. Z., Liu, P. F., Ma, N., Lin, W. L., Xu, X. B., Yan, P., He, X., Yu, J., Liang, W. D., and Chen, L. L.: Characteristics of pollutants and their correlation to meteorological conditions at a suburban site in the North China Plain, Atmos. Chem. Phys., 11, 4353–4369, https://doi.org/10.5194/acp-11-4353-2011, 2011.
Xu, X., Lin, W., Wang, T., Yan, P., Tang, J., Meng, Z., and Wang, Y.: Long-term trend of surface ozone at a regional background station in eastern China 1991–2006: enhanced variability, Atmos. Chem. Phys., 8, 2595–2607, https://doi.org/10.5194/acp-8-2595-2008, 2008.
Xu, Z., Wang, T., Xue, L. K., Louie, P. K. K., Luk, C. W. Y., Gao, J., Wang, S. L., Chai, F. H., and Wang, W. X.: Evaluating the uncertainties of thermal catalytic conversion in measuring atmospheric nitrogen dioxide at four differently polluted sites in China, Atmos. Environ., 76, 221–226, https://doi.org/10.1016/j.atmosenv.2012.09.043, 2013.
Xue, L. K., Wang, T., Gao, J., Ding, A. J., Zhou, X. H., Blake, D. R., Wang, X. F., Saunders, S. M., Fan, S. J., Zuo, H. C., Zhang, Q. Z., and Wang, W. X.: Ground-level ozone in four Chinese cities: precursors, regional transport and heterogeneous processes, Atmos. Chem. Phys., 14, 13175–13188, https://doi.org/10.5194/acp-14-13175-2014, 2014.
Yamaji, K., Li, J., Uno, I., Kanaya, Y., Irie, H., Takigawa, M., Komazaki, Y., Pochanart, P., Liu, Y., Tanimoto, H., Ohara, T., Yan, X., Wang, Z., and Akimoto, H.: Impact of open crop residual burning on air quality over Central Eastern China during the Mount Tai Experiment 2006 (MTX2006), Atmos. Chem. Phys., 10, 7353–7368, https://doi.org/10.5194/acp-10-7353-2010, 2010.
Yan, Y., Lin, J., and He, C.: Ozone trends over the United States at different times of day, Atmos. Chem. Phys., 18, 1185–1202, https://doi.org/10.5194/acp-18-1185-2018, 2018a.
Yan, Y., Pozzer, A., Ojha, N., Lin, J., and Lelieveld, J.: Analysis of European ozone trends in the period 1995–2014, Atmos. Chem. Phys., 18, 5589–5605, https://doi.org/10.5194/acp-18-5589-2018, 2018b.
Yan, Y.-Y., Lin, J.-T., Kuang, Y., Yang, D., and Zhang, L.: Tropospheric carbon monoxide over the Pacific during HIPPO: two-way coupled simulation of GEOS-Chem and its multiple nested models, Atmos. Chem. Phys., 14, 12649–12663, https://doi.org/10.5194/acp-14-12649-2014, 2014.
Young, P. J., Archibald, A. T., Bowman, K. W., Lamarque, J.-F., Naik, V., Stevenson, D. S., Tilmes, S., Voulgarakis, A., Wild, O., Bergmann, D., Cameron-Smith, P., Cionni, I., Collins, W. J., Dalsøren, S. B., Doherty, R. M., Eyring, V., Faluvegi, G., Horowitz, L. W., Josse, B., Lee, Y. H., MacKenzie, I. A., Nagashima, T., Plummer, D. A., Righi, M., Rumbold, S. T., Skeie, R. B., Shindell, D. T., Strode, S. A., Sudo, K., Szopa, S., and Zeng, G.: Pre-industrial to end 21st century projections of tropospheric ozone from the Atmospheric Chemistry and Climate Model Intercomparison Project (ACCMIP), Atmos. Chem. Phys., 13, 2063–2090, https://doi.org/10.5194/acp-13-2063-2013, 2013.
Zhang, L., Jacob, D. J., Yue, X., Downey, N. V., Wood, D. A., and Blewitt, D.: Sources contributing to background surface ozone in the US Intermountain West, Atmos. Chem. Phys., 14, 5295–5309, https://doi.org/10.5194/acp-14-5295-2014, 2014a.
Zhang, Q., Yuan, B., Shao, M., Wang, X., Lu, S., Lu, K., Wang, M., Chen, L., Chang, C.-C., and Liu, S. C.: Variations of ground-level O3 and its precursors in Beijing in summertime between 2005 and 2011, Atmos. Chem. Phys., 14, 6089–6101, https://doi.org/10.5194/acp-14-6089-2014, 2014b.
Zhao, C., Wang, Y., and Zeng, T.: East China Plains: A `basin' of ozone pollution, Environ. Sci. Technol., 43, 1911–1915, https://doi.org/10.1021/es8027764, 2009.
Zhao, C., Wang, Y., Yang, Q., Fu, R., Cunnold, D., and Choi, Y.: Impact of East Asian summer monsoon on the air quality over China: View from space, J. Geophys. Res.-Atmos., 115, D09301, https://doi.org/10.1029/2009JD012745, 2010.
Zheng, B., Tong, D., Li, M., Liu, F., Hong, C., Geng, G., Li, H., Li, X., Peng, L., Qi, J., Yan, L., Zhang, Y., Zhao, H., Zheng, Y., He, K., and Zhang, Q.: Trends in China's anthropogenic emissions since 2010 as the consequence of clean air actions, Atmos. Chem. Phys., 18, 14095–14111, https://doi.org/10.5194/acp-18-14095-2018, 2018.
- Abstract
- Introduction
- Model and simulations
- Simulated and observed O3 concentrations
- Impacts of meteorology on surface O3
- Impact of emission changes on surface O3
- Budget analyses
- Conclusions
- Data availability
- Author contributions
- Competing interests
- Special issue statement
- Acknowledgements
- References
- Supplement