Selection Criteria and Assessment of the Impact of Traffic Accessibility on the Development of Suburbs


1
College of Applied Technical Sciences, Aleksandra Medvedeva 20, 18000 Niš, Serbia
2
Faculty of Technical Sciences, University of Novi Sad, 21000 Novi Sad, Serbia
3
Department of logistics, Military Academy, University of Defense in Belgrade, 11000 Belgrade, Serbia
*
Author to whom correspondence should be addressed.
Sustainability 2018, 10(6), 1977; https://doi.org/10.3390/su10061977
Submission received: 9 April 2018
/
Revised: 6 June 2018
/
Accepted: 7 June 2018
/
Published: 12 June 2018
(This article belongs to the Section Sustainable Urban and Rural Development)
Abstract
:When defining criteria that have an influence on traffic accessibility in suburbs, it is necessary to take into account the specificity of a concrete urban unit. In existing scientific papers, the authors have dealt with the impact of the remoteness of settlements and their accessibility from the city center. The main aims of this paper are to define and quantify the criteria that have the greatest influence on traffic accessibility in suburban areas, that is, to develop a model of traffic accessibility. This model refers to traffic accessibility in suburban areas, where an urban public transport system is operational and represents a qualitative approach to research. Research has shown that factors such as a network of public transport (PT) lines, a network of accessible roads in a settlement, travel time, and timetables are of great importance in the description and generation of a new model. This model was tested in 23 suburban districts with regard to the needed walking time. The Fuzzy AHP (FAHP) method, one of the most popular methods for multi-criteria decision making, was used. Based on the results presented in this paper, it is expected that the application of this model will enable development and sustainability in suburban areas, as well as greater social equality and involvement of dwellers (especially the younger generation) in social activities, in view of achieving a better quality of life.

1. Introduction
Traffic accessibility as a function of public transport strengthens the economy, deals with the conservation of energy and resources, reduces congestion, improves the quality of air and our health, provides critical assistance in emergency situations and catastrophes, increases the development and value of real estate, increases mobility in small urban and rural communities, and reduces health costs. All of this contributes to a better quality of life.
This paper aims to develop a model for the assessment of the impact criteria of traffic accessibility, which could (to a smaller or a greater extent, if previously stated facts are taken into account) influence the development of suburban areas. The city of Niš in Serbia was taken as an example. Relevant criteria for traffic accessibility were described and measured (taking into account social equality). These criteria influence the reduction of the usage of passenger vehicles in suburban areas and create a more favorable environment for urban public transport in view of improving efficiency of the transport system and its sustainable development. As instruments of transport policy, measures that can be taken to manage the transportation needs of users (passengers) do not ask for great material investment, making them even more attractive. In accordance with this, the following hypotheses were tested:
- ‒
- Is it possible to define criteria for traffic accessibility as generators of the development and sustainability of suburban areas, as well as demographic development within them?
- ‒
- By selecting the key criteria, is it possible to assess the influence of traffic accessibility on the development of suburban areas?
Similarly, the issue was raised as to whether the improvement of traffic accessibility will lead to an increase in population mobility from suburban areas or whether better and higher-quality public transport will influence the decrease of population migration in suburban areas.
Тhere are authors whose research is based on the sustainability and accessibility of settlements, but only in the sense of planning, real estate value, distance and accessibility from the town center and its contents. Temporal and spatial components of settlement accessibility are taken into account, but there is no data on traffic accessibility through infrastructure in the settlement, level of household motorization, comfort in a vehicle, and tariff systems or the cost of transport. This paper represents a qualitative approach and not an analytical one. Experts were consulted to measure the different criteria. This approach is in essence based upon opinion and not mathematical or scientific accuracy. Therefore, the starting point in this paper is the fact that it is possible, based on current experience, to gain an insight into the potentials of a new approach to observing traffic accessibility, especially in suburban areas where the urban public transport system is operative.
This paper has been organized into several sections. Section 2 describes the demography in suburban areas, defines traffic accessibility, and establishes the groups of criteria that describe traffic accessibility. Section 3 presents in two parts the research methodology that was used in this paper. The first part discusses the mathematical procedure used to select the important criteria to evaluate traffic accessibility. In the second part, fuzzy rules for the assessment of the impact of traffic accessibility are provided, on the basis of previously-set criteria. Section 4 shows the results of the conducted research, that is, the testing of the model by observing the city of Niš. The last two chapters contain the discussion and conclusion.
Literature Review
Traditional public transport implies the movement of vehicles on a fixed route, with fixed stops and according to a predefined time schedule of departures. Therefore, the main disadvantage of this mode of transport is the incompatibility with passenger requirements. This practically means that rural residents who do not have another transport alternative are forced to adapt their transportation needs to the defined way of public transport functioning. Many residents are thus forced to give up certain travel wishes, and this often implies the abandonment of searching for jobs outside the place of residence, the abandonment of education, healthcare, cultural and sporting events, and the like [1,2].
Only 32% of all rural municipalities have access to public transport services; thus, if the 28% of communities that have limited access to public transport are taken into account, it becomes clear that the remaining 40% of the population in suburban areas is left without the option of public transport [3]. A recent survey determined that 92% of Canadians thinks that public transport makes their community a better place to live in [4].
According to Donnges (1999), accessibility is based on three elements [5]:
- Household location;
- Location of content and services;
- A transport system that connects the first two elements.
However, the listed elements are physical and regulatory elements of accessibility, and the characteristics of households and individuals are omitted. For example, low-income households may not be able to access specific content because transport services are expensive [2,6,7,8].
By the beginning of this century, rural transport policy measures focused on ensuring mobility. This meant that a passenger car should offer an appropriate alternative, so that the principle of sustainability is respected. Such solutions are usually expensive and state subsidies are needed. However, in Norway, instead of a passenger car, an alternative to travel was offered [9]. This idea changed the approach to addressing accessibility issues—instead of bringing rural people closer to the content, the content approaches them. This method has experienced rapid expansion, and Great Britain was one of the first countries to accept it [10].
In the paper by Ambarwati et al. (2014), the aim was the analysis of strategy improvement for public transport systems. The research was conducted and analyzed using microscopic data in order to assess the impact of settlement development in suburban areas by improving public transport [11]. This paper speaks about different combinations of public transport systems that could take into account a decrease in travel time of 35%, which would lead to an increase in the use of public transport.
The international project MORECO (mobility and residence costs) explains the conjuncture between future places of living and accessibility. Special emphasis is put on the consequences that the uncontrollable spread of settlements cause to public transport services. The main goal of the project was to promote sustainable mobility through the development of a polycentric system of settlements. The main operative goal of the project was to promote the implementation of decisions made by private and public actors on locations that are close to public transport stops [12]. Many economic, social and ecological problems worldwide are, after all, urban problems; cities are located where the people are. The expression “quality of life” is usually used not only in the area of environment and land use, but also in planning economic development and infrastructure [13].
Litman (2017) writes about the concept of accessibility and the ways it can be incorporated into transport planning. Many factors can have an impact on accessibility, including moveability (physical motion), quality of transport, connectedness of traffic systems, mobility, and land use [14].
Simeunović (2012) carried out a systematic analysis of the integration of a transport offer within the public transport system and quantified its influence on accessibility. The quantification of the influence of transport offer integration on accessibility was carried out including space as a limiting factor, as well as other factors such as time, cost and general impact on travel realization [15]. The analyses confirmed that the integration of a transport offer had a significant influence on accessibility in linear-type networks for suburban corridors.
A huge contribution was made in the dissertation by Ranković-Plazinić (2015), which defines a methodology for the classification of urban and rural settlements, and types of rural settlements in relation to traffic accessibility. The specificity of rural population transport requirements was determined, as well as the factors that influence the mobility and selection of the forms of transport [16]. A survey was conducted among households in selected rural settlements in four municipalities in Serbia.
As a result of the review of the existing scientific literature, it can be concluded that accelerated development and industrialization in the past decades has led to the depopulation of suburban (rural) areas and, consequently, their marginalization in relation to modern socio-economic relations. This has had a negative impact on the quality of life of rural residents, which significantly depends on the quality of the public transport system and its performance, in order to provide a satisfactory level of accessibility and opportunities. This practically means that rural residents who do not have a transport alternative have to adapt their transportation needs to the defined way in which public transport functions. As a result, many residents are forced to give up on certain travel wishes, and this often implies the abandonment of searching for jobs outside the place of residence, education, health care, cultural and sporting events, and the like [1,2].
2. Base of Research
This section elaborates the demography of suburban areas in the general sense, defines the term traffic accessibility and sets the influential criteria that characterize accessibility in settlements.
2.1. Demography in Suburban Settlements
Settlements are the permanent or temporary place of residence of people, in which new production and other activities related to their social and private lives are visible. They are divided into urban (urban) and suburban (rural).
A rural community with a relatively high population may look drastically different from a rural community of a similar size with a smaller population [17]. One definition cited by the Economic Research Service (USDA) in the USA describes rural areas as non-metropolitan regions. According to this definition, almost two-thirds of the total of 3142 regions are rural, and rural communities account for 17% of the population (49 million people) [18].
On a global scale, more people live in urban areas than in rural areas, and 47% of the world’s population lived in urban areas in 2014. In 1950, 30% of the world’s population lived in urban areas, and by 2050, 66% of the population is expected to be urban [19]. It is expected that the world’s urban population will increase significantly in the coming decades. By the middle of the 21st century, the world’s urban population is likely to be the size of the current total population [20].
2.2. Accessibility
Accessibility as a term should be regarded as the extent to which potential passengers, who have certain transportation needs, have access to the city area.
Accessibility is a broad term that refers to the ease of reaching contents in the settlement. It can be defined in several different ways:
“Accessibility is an ability or easiness of reaching different destinations or places that offer the possibility for a desired activity” [21];
“Accessibility describes the location of the area in relation to possibilities, activities or means that exist in other areas or in the very area, where “area” stands for a region, a city or a corridor” [22];
“Accessibility implies that people can reach certain content at a reasonable cost, for a reasonable time and with reasonable easiness” [2];
“Accessibility stands for a range of possibilities and choices that people have concerning working places, services, friends and family” [23];
“Accessibility refers to the easiness of reaching goods, services, activities and destinations, which are altogether called possibilities” [24].
The SEU [2] report determines that accessibility depends upon:
- ‒
- Existence of transport services connecting people and content;
- ‒
- Informing people about transport services;
- ‒
- Physical and financial limitations of access to transportation services
- ‒
- Remoteness of content and activities
Accessibility can be:
- ‒
- Spatial—referring to the spatial arrangement of contents in relation to users who set the requirements for their use;
- ‒
- Temporal—referring to the time when a certain service is offered during the day, week or a longer period of time in relation to the available time of users for this service.
The spatial measurement of accessibility in Australia is represented by the ARIA index (Accessibility/Remoteness Index of Australia). A method to calculate the ARIA index is based on the measurement of the shortest distance (measured at traffic arteries) from a settlement and five categories of content centers that people travel to in order to have access to goods or services [25].
The measurement of traffic accessibility in certain areas of South Africa observes the ease of access to the following content: closest ambulance, hospital, primary school, secondary school, grocery store, public transport stop, post office, and center for social welfare [26]. It is not specifically defined in relation to which form of transport accessibility is observed, but is measured by time needed for travel by the “usual” form of transport. Authors [27] have suggested that the index of accessibility of a certain content for poor households in India is calculated on the basis of time spent on travel, then the form of transport, and finally the quality of transport service.
Accessibility and other criteria/factors can be measured exactly. One study explains how transport connectivity is measured in London [28]. Here the authors describe the different tools used for connectivity assessment and the techniques they are based on. They present three main types of connectivity assessment, which can be undertaken either for London today or for future scenarios, once the city’s population and transport networks have changed. Accessibility is the most difficult to measure, because it requires taking into account land use, mobility and mobility substitutes, but most accurately reflects the ultimate goal of transportation, and allows the widest range of transport problems and solutions to be considered. For example, an accessibility perspective may identify low-cost solutions to transportation problems, such as improving local walkability; encouraging a land use mix such that common destinations such as stores, schools and parks are located near residential areas; and improving communication services for isolated people and communities [29].
2.3. Set of Criteria of Traffic Accessibility
The first phase involves the identification and classification of criteria. In this phase, it is recommendable to use information on the functioning of the analyzed systems. It was also necessary to classify criteria according to their type, sub-system they belong to, and the level of decision-making.
A certain number of set elements of the preliminary criteria were identified on the basis of physical, functional and other characteristics of the system, which was the subject of the study. The second part of the preliminary criteria was defined on the basis of scientific and practical research and the analysis of literature on the subject. The third part of the set of preliminary criteria was identified on the basis of earlier experience with similar projects worldwide. Combining these three approaches, the number of set elements of the preliminary criteria for the assessment of the impact of traffic accessibility was obtained.
On the basis of the experience and recommendations mentioned above, as well as the opinion of relevant experts, it is suggested that the assessment of traffic accessibility be made based on 13 factors (sub-criteria) categorized into four groups (Table 1).
Network of public transport lines: Public transport in rural areas is characterized by long distances, long travel times, a relatively small number of departures, the non-directness of lines, and low profitability. Forms of public transport that function in rural areas worldwide [30,31,32,33] can be classified into two groups:
- Traditional public transport—referring mainly to buses (in some cases to the railway if accessible), characterized by a fixed mode of operation
- Non-traditional public transport—referring to other forms of public transport, which can be further categorized as:
- ‒
- Demand-responsive transport (DRT)
- ‒
- Transport services that integrate the transport of goods and passengers
- ‒
- Transport services that encompass several purposes
Remoteness of the railway: Although the rail system has a great advantage in the daily functioning of people and goods, the general use of its capacity is not sufficient and varies depending on the region in the country.
Characteristics of the settlement: In hilly and mountainous areas, households are usually spatially separated from one another, i.e., they belong to a broken type of settlement, and in such cases, it is difficult to provide adequate infrastructure and traffic connections to urban areas. Suburban settlements adjacent to cities are sure to have better access to amenities, necessary resources, better infrastructure, and offer faster integration into contemporary socio-economic flows.
Possession of a car in the household: According to Plazinic-Rankovic (2015), the availability of cars for rural inhabitants can be considered a measure of the comfort in planning a trip, given the number and quality of other transport alternatives. The possession of a means of transport by a household does not necessarily mean that it is available to all members or drivers in the household. If there are no other transport options, other members of the household will have less accessibility to content outside the local environment [16].
Built infrastructure: Infrastructure in suburban areas is often poorer than in urban ones. It is often old, damaged, or prone to damage. The density of the traffic network is smaller, and the quality of the roads is subject to change. In addition, internet connection coverage, as well as mobile and fixed networks, also vary from one suburb to another.
Network of access roads: Access roads in suburbs that connect a place of living (source) with a travel destination are envisioned as a branched network of traffic arteries, which could connect a settlement with different centers, thus fulfilling travel purposes. A network of road traffic arteries can be divided into suburban roads, town roads, and streets. Undoubtedly, the existence of a greater (smaller) number of entries, that is, exits from the settlement, can increase (decrease) its accessibility in terms of alternative ways of reaching it, thus affecting the mobility of residents.
Remoteness from the most significant contents: The distance from individual content, in spatial or temporal form, can be a determinant of rurality in terms of accessibility. In general, in England, a fixed value of 15 min to 20 min of travel is on foot [34]. This value is used for general content accessibility, but others are used for individual content.
Comfort in a vehicle: The quality of service is based on the behavioral approach, i.e., the subjective experience of certain parameters and the entire transport service, which results in the objectively realized use of public transport, which is, as a rule, different from the expected use. Comfort in a vehicle means no crowds, cleanliness, temperature, vehicle illumination, number of seats, easy movement through the vehicle, etc.
Travel time: Travel time consists of the time needed to walk from one’s residence to the public transport stop, time spent waiting, time spent on travel in a vehicle, transient time (if any), and the time taken to walk from the stop to the final destination. The time taken to walk to catch public transport in suburban areas is tolerated, depending on the remoteness of the settlement from the city, size of the settlement, development of the street network, and the scope of transport needs.
Transfer points: This is one of the most important elements of public transport. A network consists of a transfer point and a line, and represents the essence of the organization. It is composed of a network of PT lines and timetables (on the basis of transfer points) for functional and efficient transportation.
Timetable: Timetables prescribe the mode of operation of vehicles on a prescribed line during the day. Its primary goal is to satisfy the authoritative transport needs of passengers during the day, envisaging an acceptable waiting time. Since timetables define the time of departure, that is the time of arrival of a vehicle and the follow-up interval between individual vehicles, the control of a timetable should be based on checks of punctuality and the even distribution of intervals.
Transport costs: It can be said that the cost of transportation is primarily a social category. It cannot cover the costs of the public transport system, and especially the development of this system, as well as competitive and high-quality public transport.
Tariff system: Every city with an organized public transport system faces the problem of choosing an optimal tariff system for its network. The complexity of the task is reflected in requirements that take into consideration the interests of passengers and transport organizers. The applied tariff system should also consider the interest of the whole community.
3. Methodology
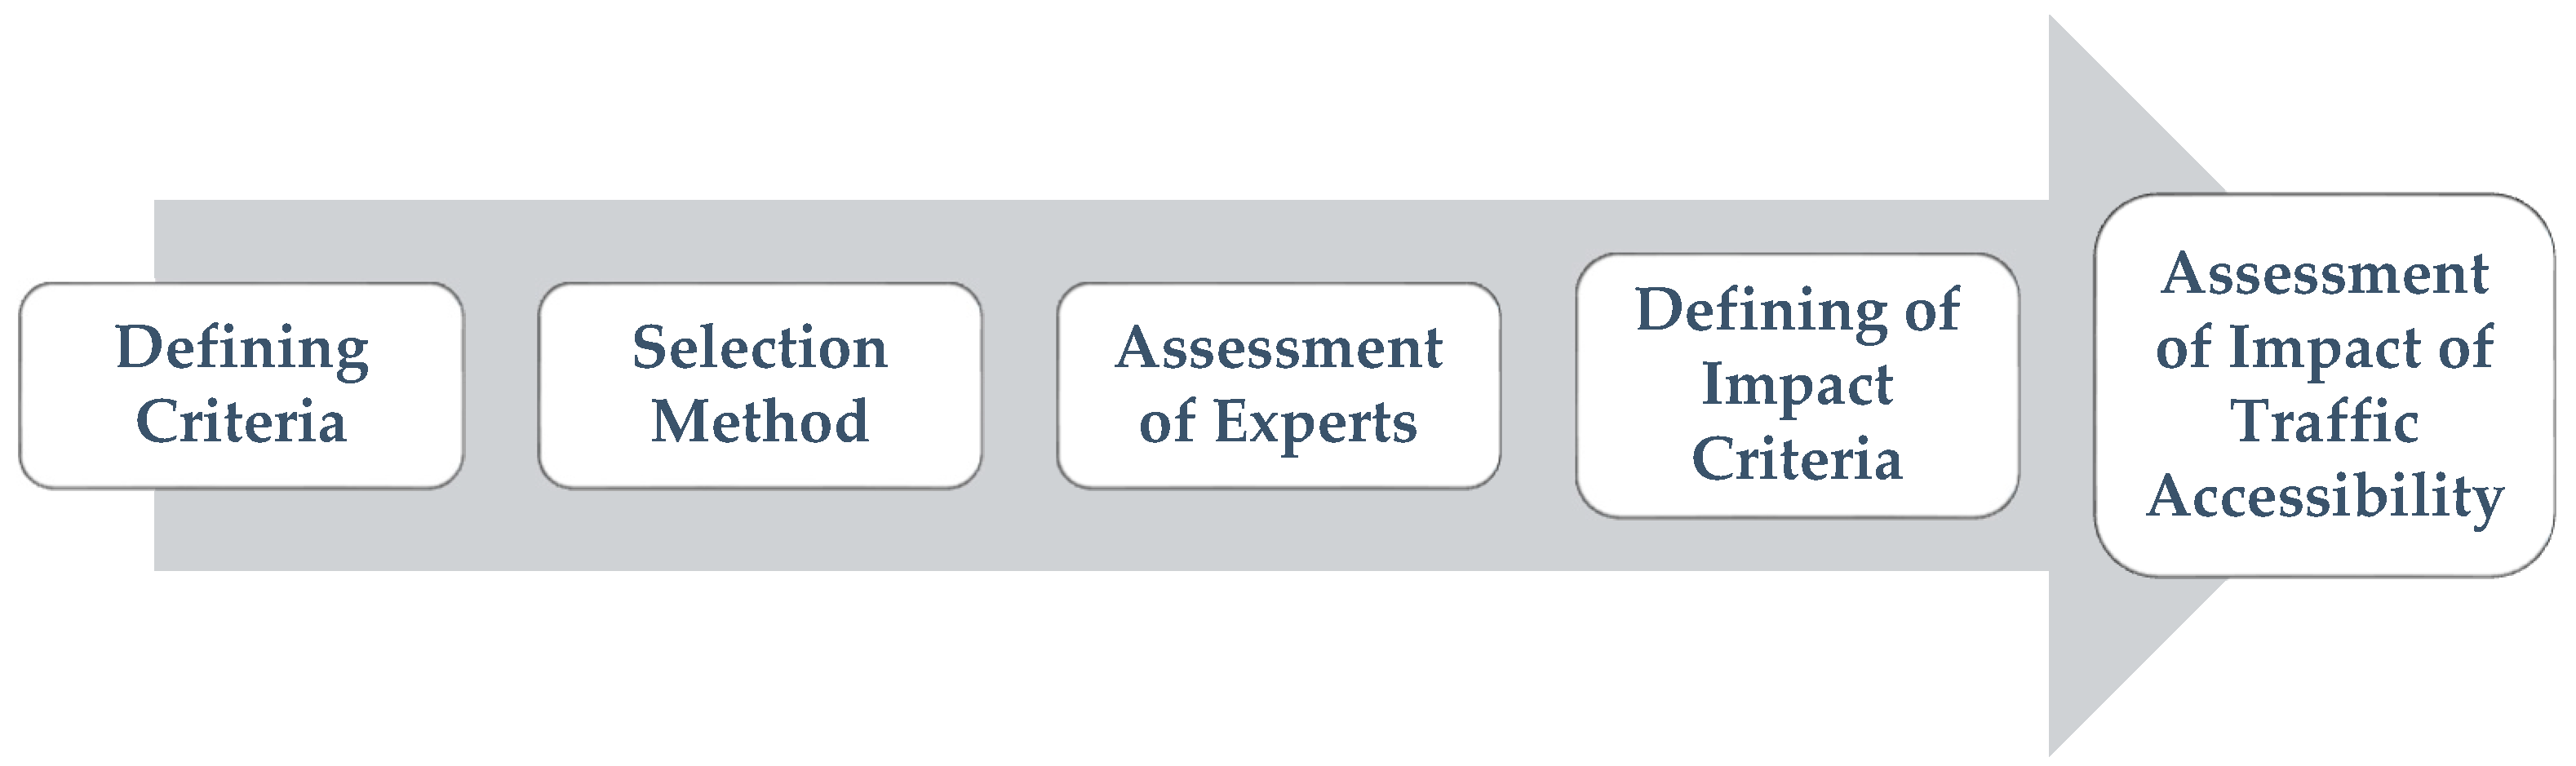
The methodology in this report consists of several parts. For all levels of assessment, the methodology must be harmonized in the following respects: general approach to method selection, assessment, selection of relevant criteria and method of measurement, which needs to be consistent for each suburban area. Therefore, as a first step, criteria are defined and grouped accordingly. Subsequently, depending on the aim of the research, a method of multi-criteria decision-making was selected. The next step involved the formation of a group of experts who assessed and defined the traffic accessibility criteria. Finally, according to model rules, the impact of the criteria on traffic accessibility was evaluated for suburbs (Figure 1).
The selection criteria for traffic accessibility that have an impact on the development of suburbs is a complicated process. It requires a detailed and permanent analysis of all relevant factors, which can have a smaller or greater impact. In order to identify the right criteria and sub-criteria that affect traffic accessibility, it is necessary to possess real knowledge of transportation systems, city infrastructure, demographic conditions, geographical surroundings, and fields related to decision-making and management.
In selecting the best assessment or decision-making method for criteria selection, research and the scientific literature in this field show that the problem could be solved by applying the multi-criteria decision-making method. The analytic hierarchy process (AHP) is a multi-criteria method that supports decision making with conflict criteria and alternatives. It has been thoroughly studied and improved through various scientific papers at prestigious universities worldwide [35,36,37]. The AHP method has great significance for problem structuring and the decision-making process. Comparison was later carried out by pairs of elements in the hierarchy (aims, criteria and alternatives). These assessments can be made as comparisons between two elements at a set level of the hierarchy, taking into account their influence at a higher level. The comparison of the elements in pairs reveals the relevance of a specific element in comparison to another to meet the level of the aims and the criteria [38].
This paper applies the extended method for making decisions—the fuzzy analytical hierarchical process (FAHP).
Let X = {x_1, x_2, …, x_n} be a set of objects, and U = {u_1, u_2, …, u_m} set of goals. According to the methodology of the expanded analysis by Chang (1996), for each taken object, an expanded analysis of the goal uj was carried out. The values of the extended analysis m for each object can be presented as follows [39]:
where is fuzzy triangular numbers.
Chang’s extended analysis contains the following steps:
Step 1: Values of fuzzy extensions for i-th object are:
In order to obtain the expression , it is necessary to carry out additional fuzzy operations with m values of extended analysis, given in the following expressions:
and
Inverse vector:
Step 2: Level of probability S2 > S1 is defined as:
For comparison of S1 and S2, both values are required V (S1 ≥ S2) и V(S2 ≥ S1).
Step 3: The level of probability that states that the convex fuzzy number is greater than k convex number Si (i = 1, 2, …, k) can be defined by the expression:
The weight vector is shown by the following expression:
where:
and Ai (i = 1, 2, …, n) n of the element.
Step 4: Through normalization, the weight vector is:
where W does not represent a fuzzy number.
Through the application of the fuzzy AHP method, the main disadvantage of the classical AHP method is alleviated, and this is indicated by an insufficiently large scale of comparisons. To this end, a different scale has been developed, based on fuzzy triangular numbers, where the decision-maker has the ability to evaluate the significance of the criteria much more closely and with ease. In Table 2, linguistic variables are converted into triangular fuzzy numbers:
When defining the set of criteria and sub-criteria for assessment of the impact of traffic accessibility on the development of suburbs, an expert economics team from the fields of transport systems and public transport was consulted.
Detailed calculations for the selection of the relevant criteria of the model to assess the impact of traffic accessibility as well as the final values of other groups of criteria are provided in Appendix A.
Quantification of the Criteria of Traffic Accessibility
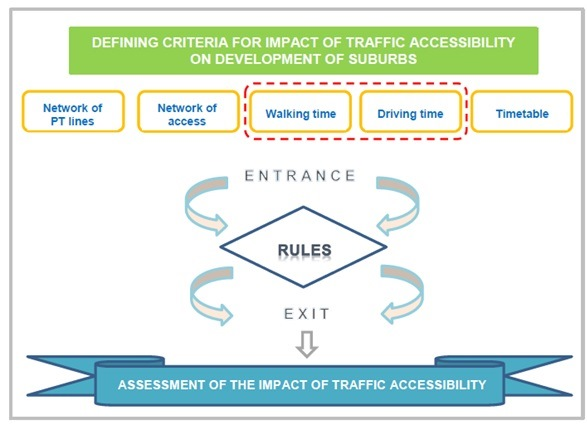
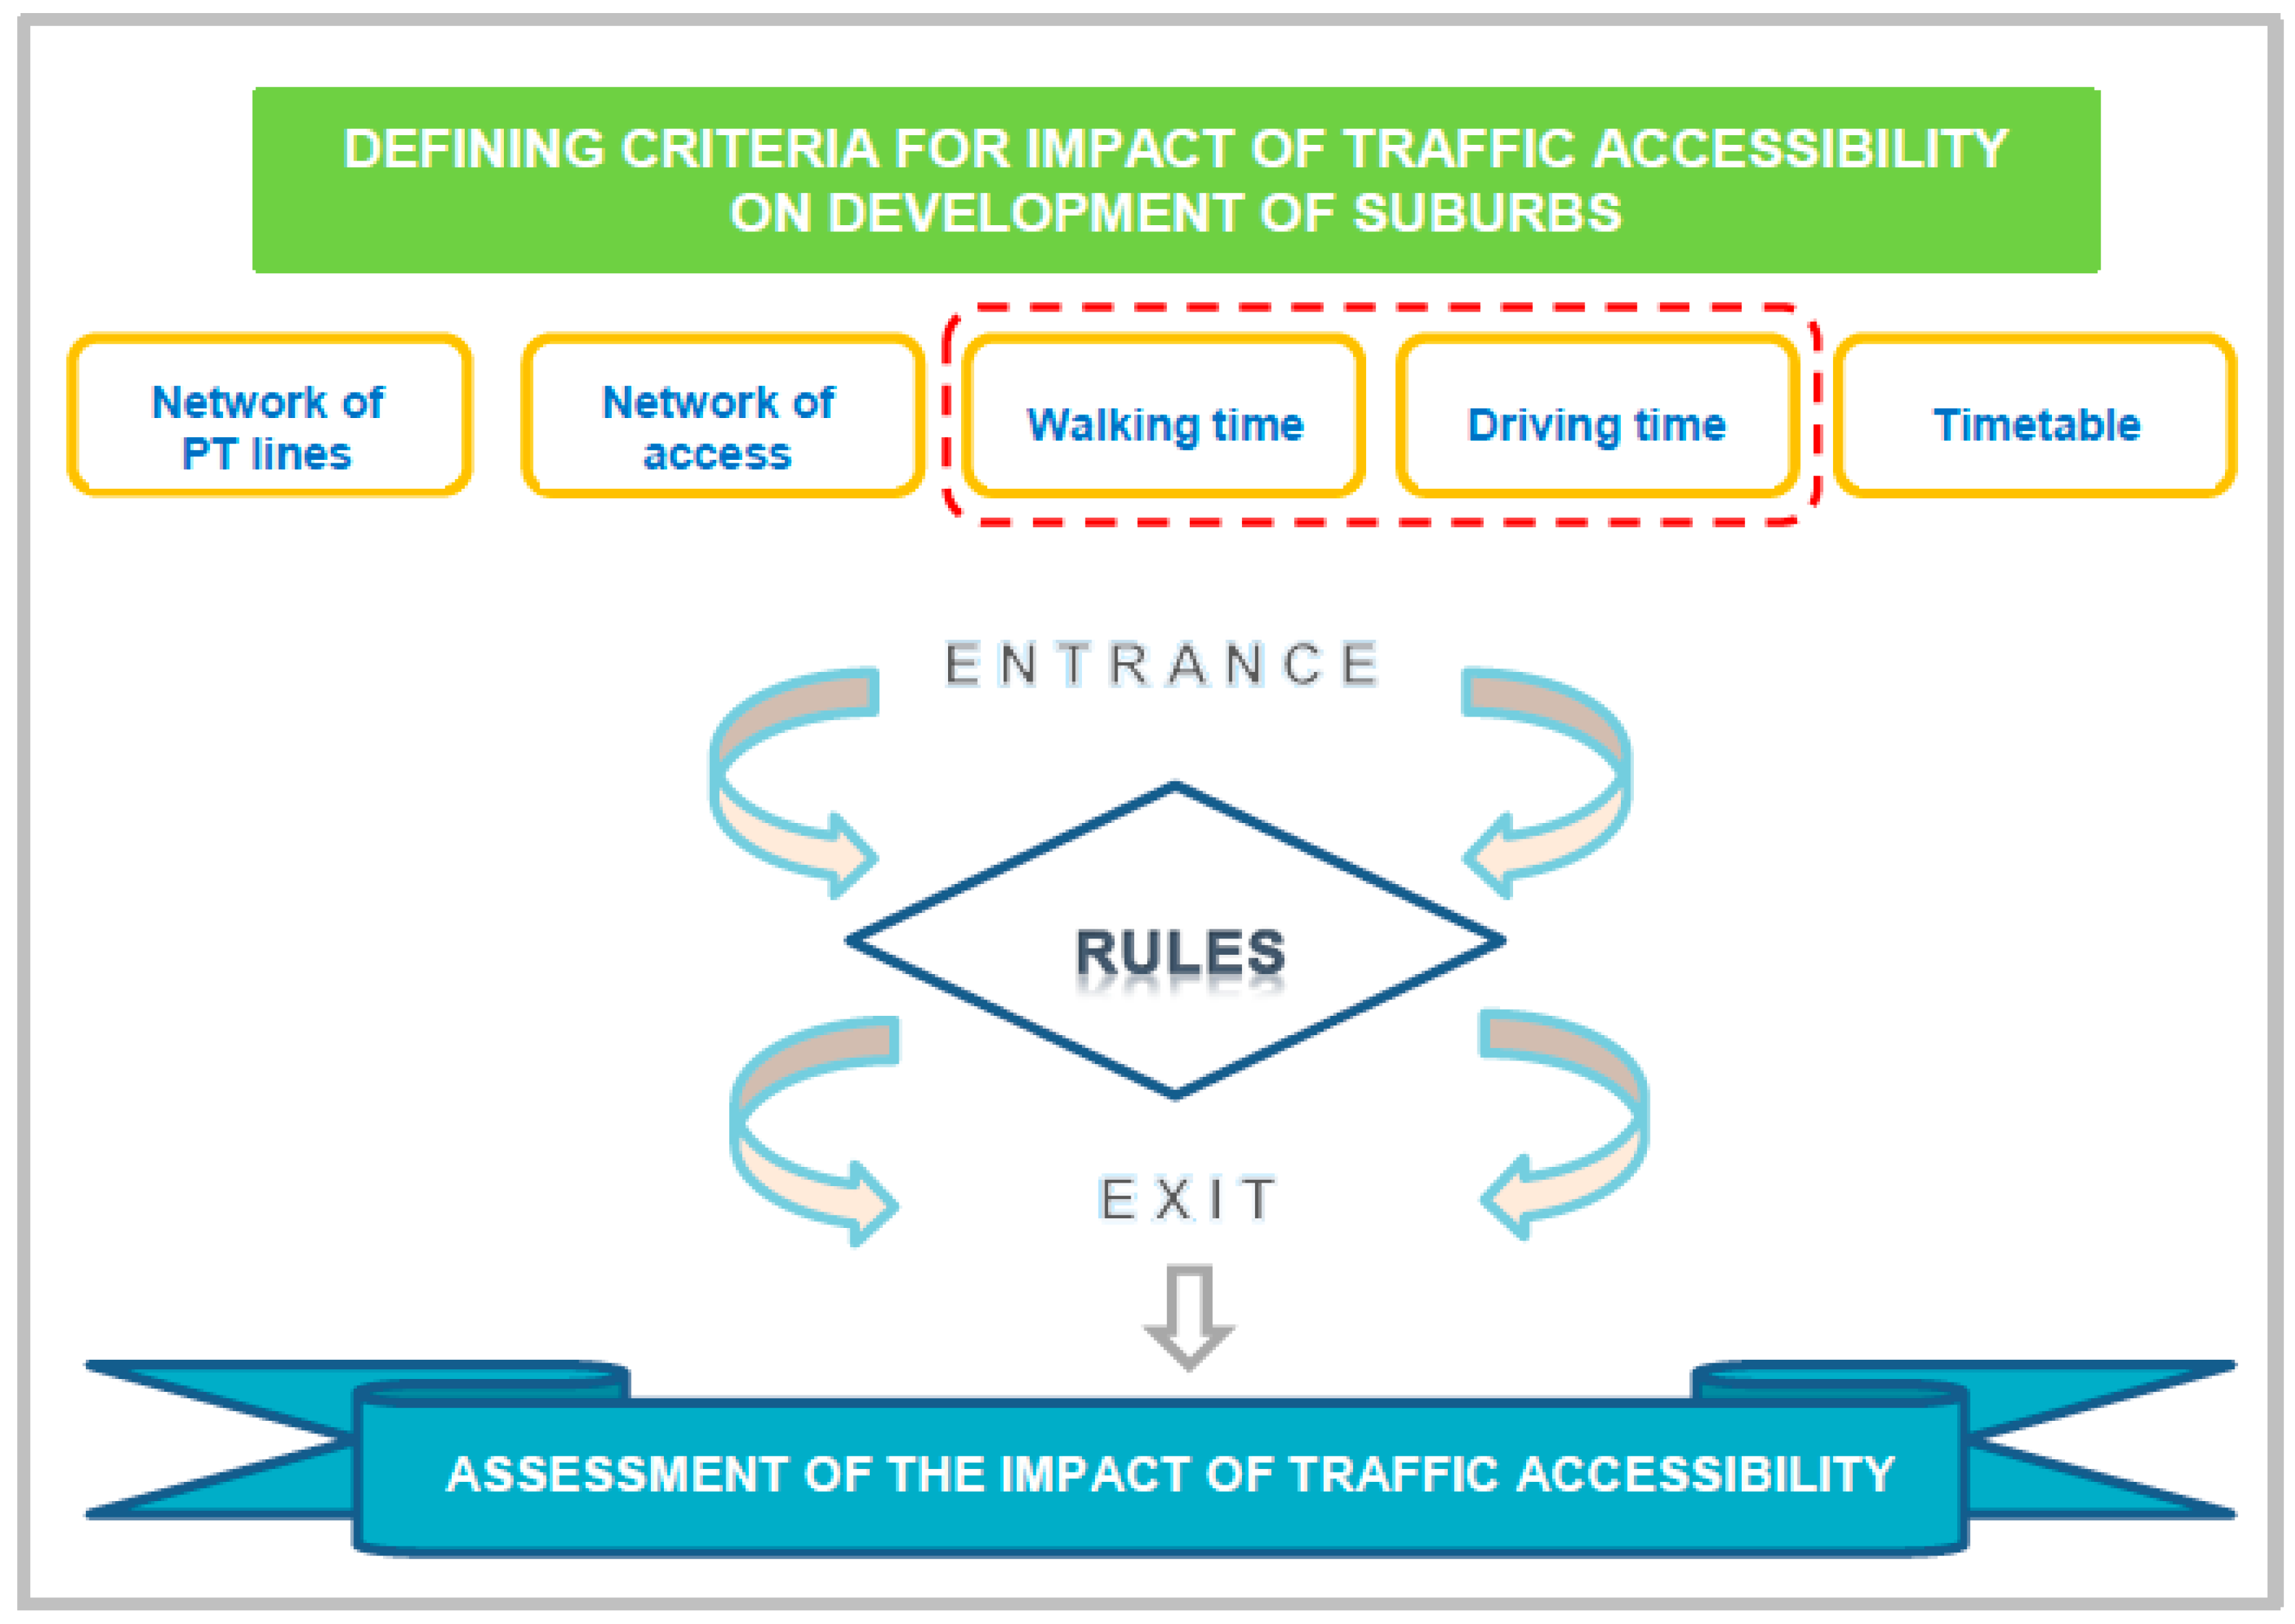
Previously selected criteria (network of PT lines, network of access roads, travel time and timetable) were used in the development of the model to assess traffic accessibility. Since journey time is a complex term, for further analysis it will be divided into two parts: walking time and driving time. The fuzzy output variable evaluates traffic accessibility in suburban areas (Figure 2).
The model proposed in this paper was developed in a way that has not been used in the literature so far. It contains parameters (for the quality of service and public transport system for the observed area) from a transportation and spatial group of criteria. Parameters referring directly to humans (settlement dwellers) have been included as well, from an economic and social point of view.
Fuzzy output variable A, as well as the fuzzy input variables B, C, D, E, and F are taken into consideration. Fuzzy output variable A estimates the assessment of the impact of traffic accessibility in suburban settlements. It is assumed that the traffic accessibility assessment can be “Insufficient”, “Good” or “Excellent”, and the quantification of the estimation is from 0 to 10 (Figure 3). The functions of affiliation are defined as follows:
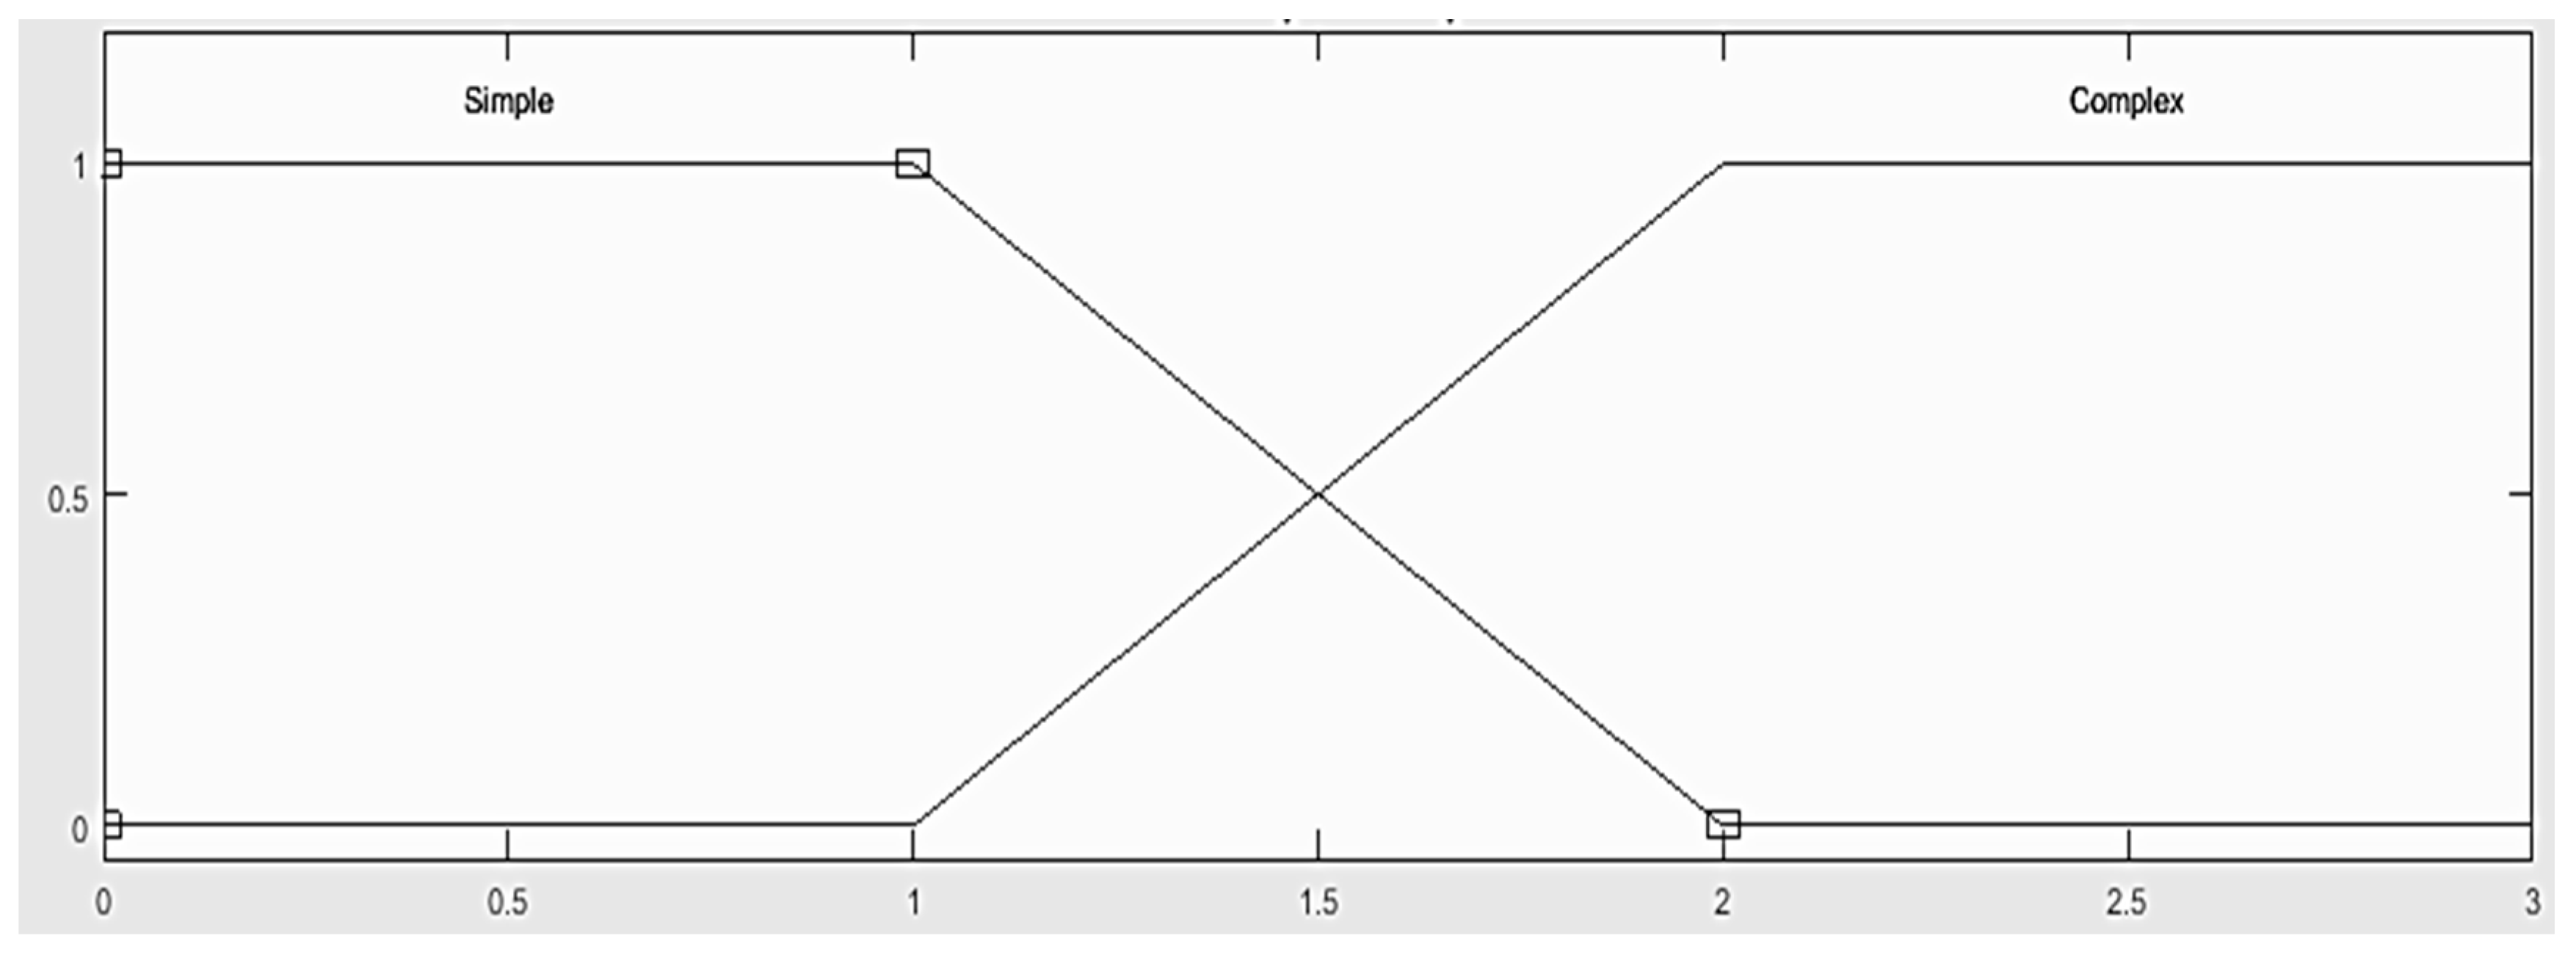
Fuzzy input variable B represents a network of public transport lines in settlements. In this case, it is assumed that the PT line network can be “Simple” (if it exists or passes through a settlement of less than two lines) or “Complex” (if there are (or passes through a settlement of) two or more lines) (Figure 4):
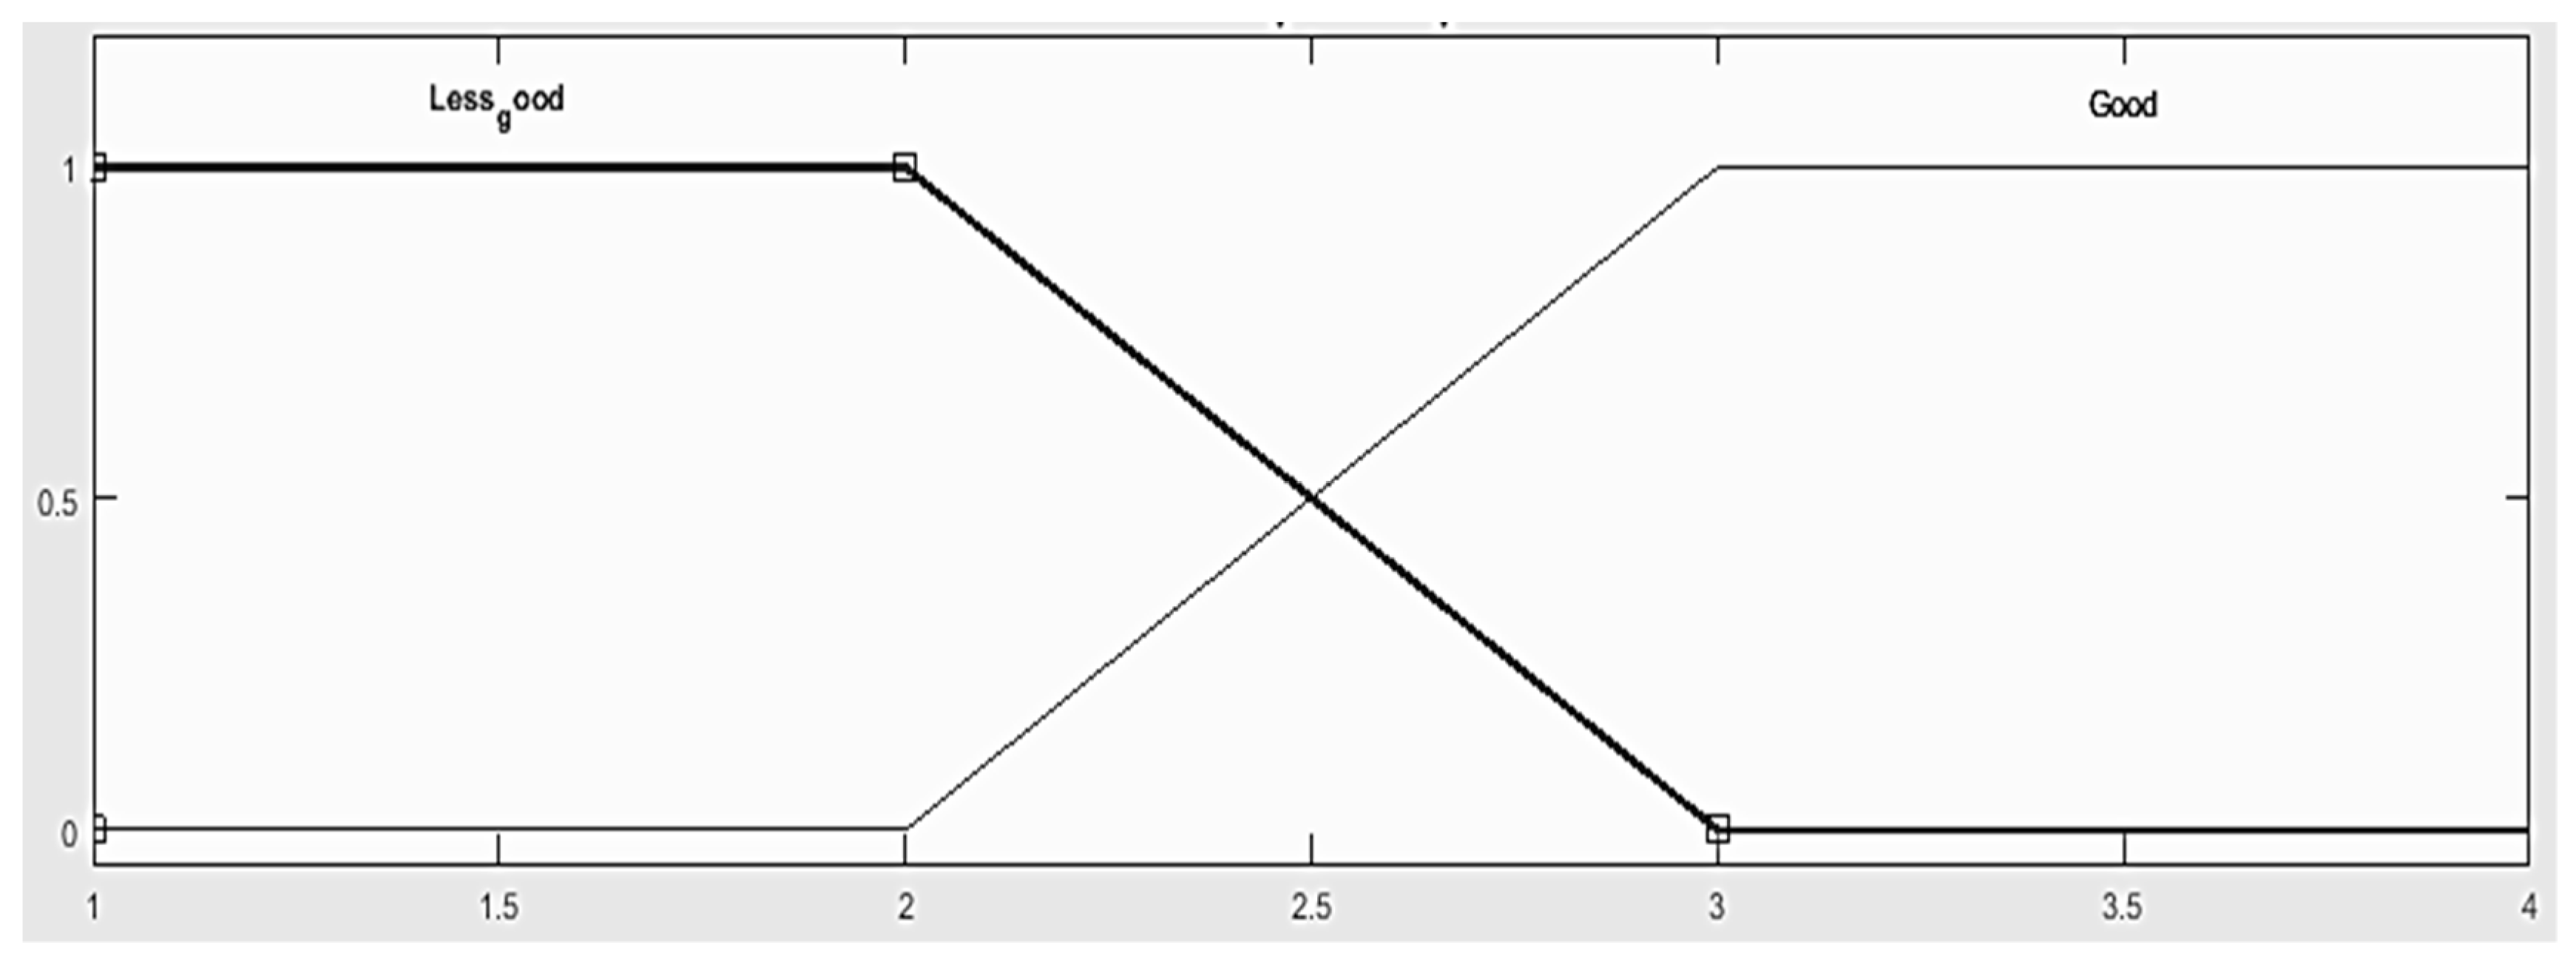
The fuzzy input variable C describes a network of access roads. It is assumed that the network of access roads can be “Less Good” (if there is a maximum of two access roads in the settlement from different directions that according to the technical exploitation characteristics correspond to the movement of public transport vehicles) or “Good” (if there are more than two access roads in the settlement from different directions that according to the technical exploitation characteristics correspond to the movement of public transport vehicles) (Figure 5):
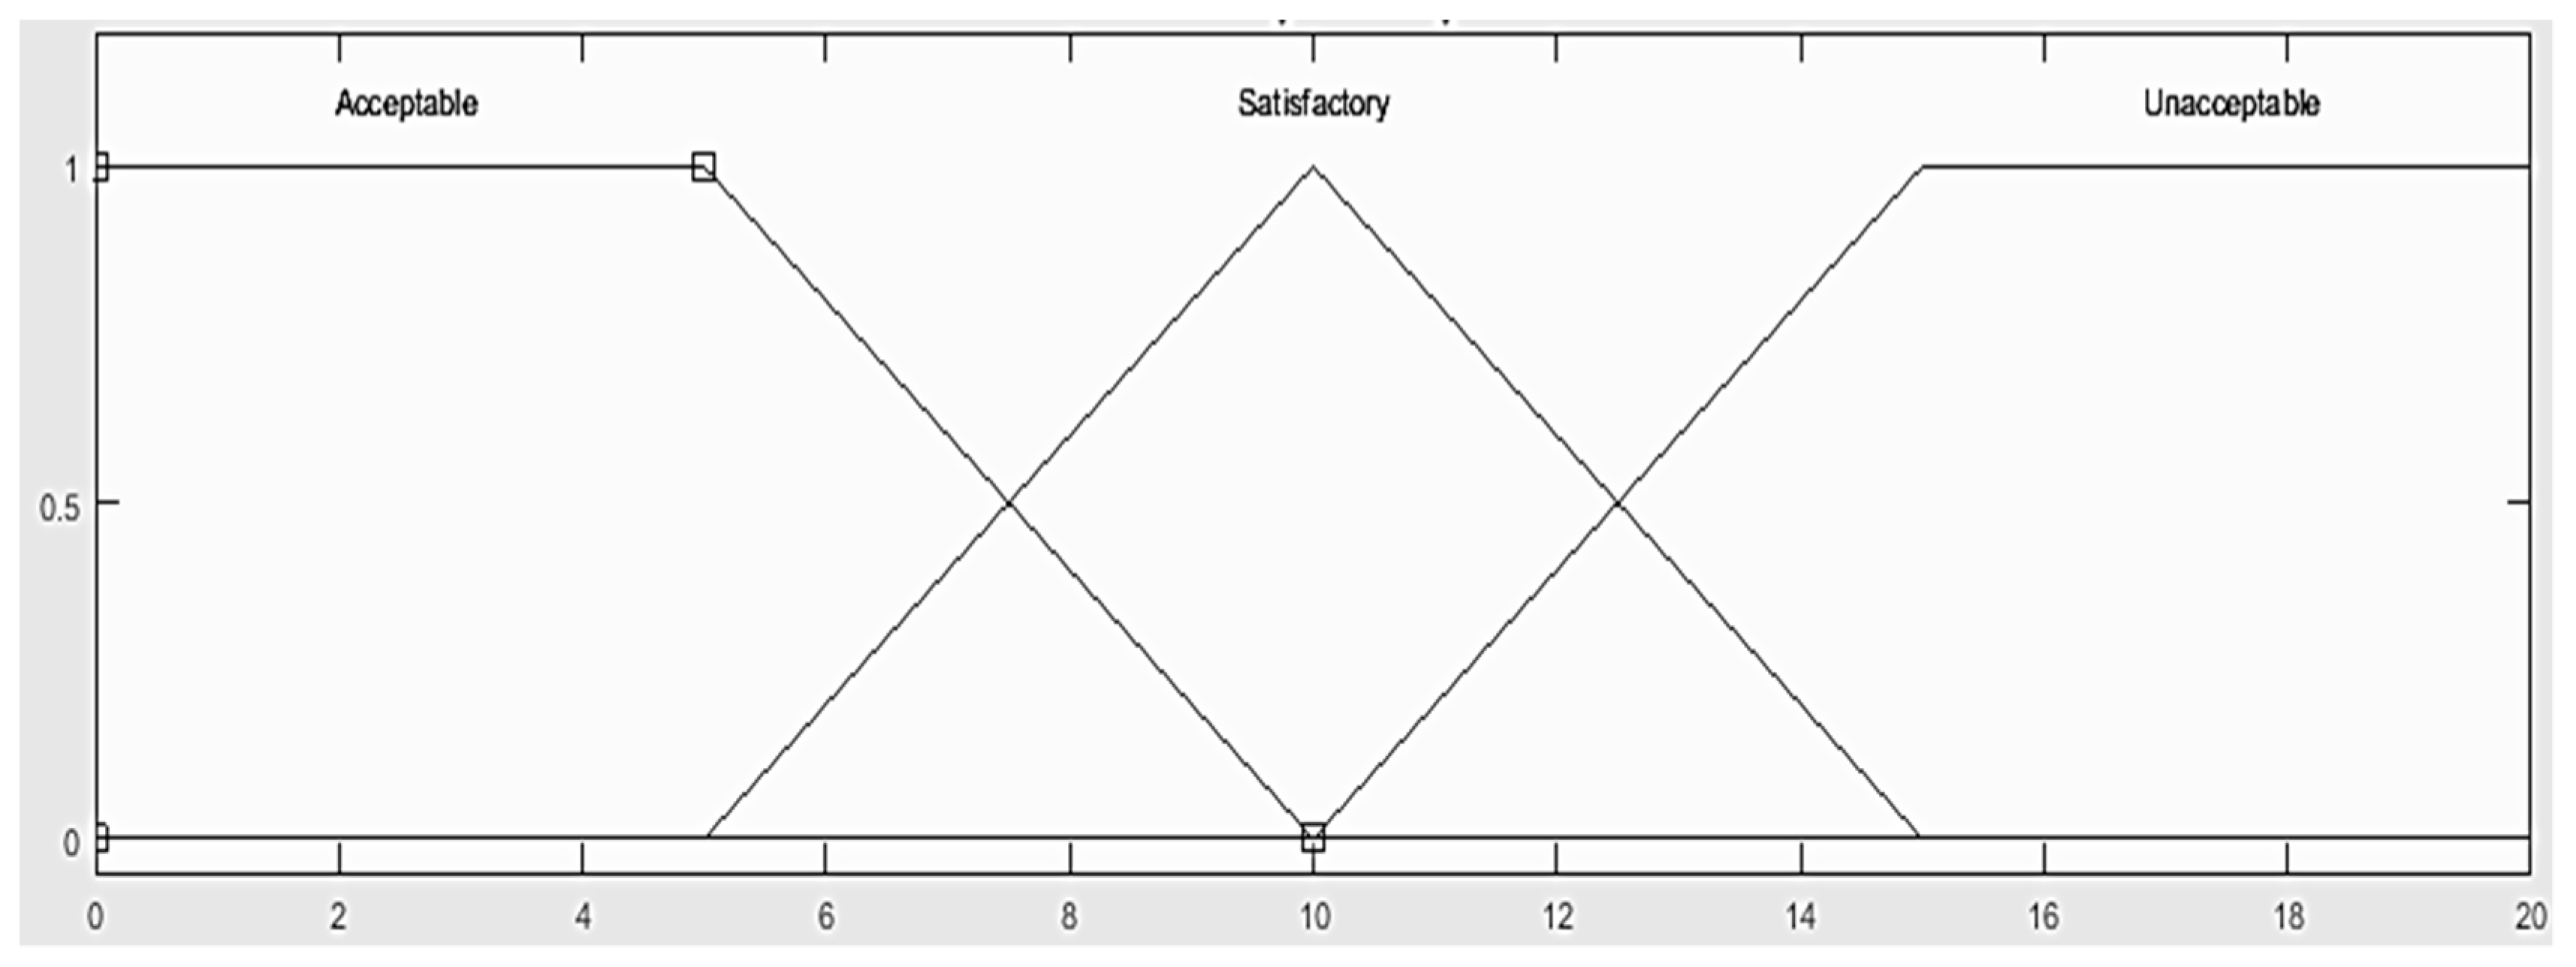
The fuzzy input variable D describes the time taken to walk from the place of residence to the stop in the observed settlement and vice versa. The time, that is, the walking distance, does not have to be measured on roads and built surfaces, because it is often the case that in suburban settlements there are shortcuts that cannot be classified into classical pedestrian paths. It is assumed that the walking time may be “Acceptable”, “Satisfactory” or “Unacceptable” (Figure 6). The functions of affiliation are defined as follows:
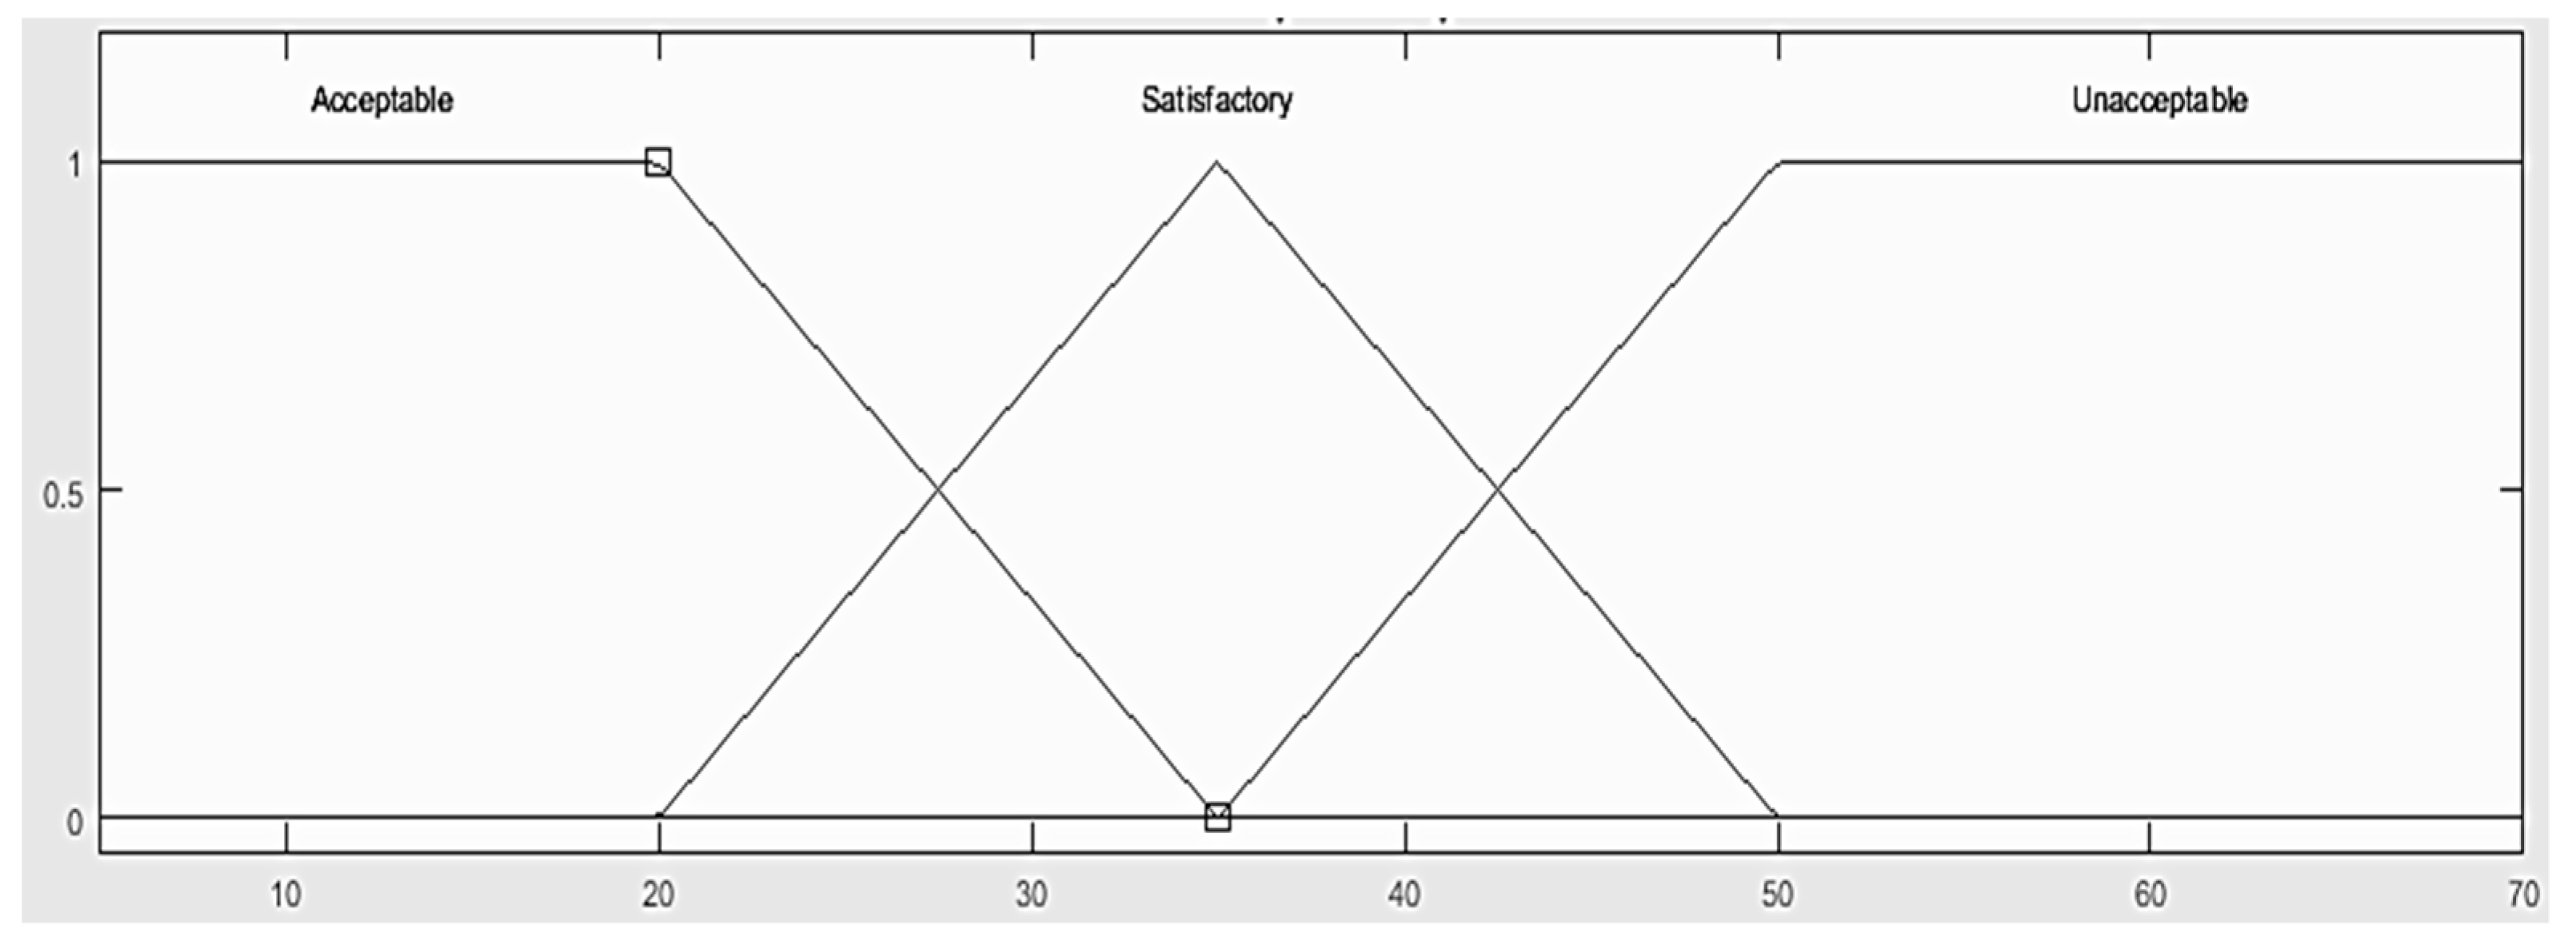
The fuzzy input variable E describes the driving time of the vehicle from the entry point in the settlement to the exit point at the destination of the journey with intermittent holdings at the interconnectors and vice versa. It is assumed that this driving time may be “Acceptable”, “Satisfactory” or “Unacceptable” (Figure 7). The functions of affiliation are defined as follows:
The fuzzy input variable F describes the timetable and is an important parameter to assess traffic accessibility. It is assumed that the timetable, depending on the number of departures that the settlement has during a working day, may be “Inappropriate”, “Average” or “Relevant” (Figure 8). The functions of affiliation are defined as follows:
Input variables in fuzzy systems represent linguistic variables that take different values, (network of PT lines, network of accessible roads, walking time, driving time and timetable). The adequate level of qualification is determined for all possible values of the output variable. Defuzzification is carried out on reviewing the level of qualification of certain values of the output variable. It implies the choice of one value of the output variable. The center of gravity (COG) method is the principal method of defuzzification, which calculates the center of gravity of the qualification function with the MATLAB software.
In fuzzy models that evaluate the assessment of criteria for traffic accessibility, a weight factor of 1 is attributed to the rules that are of equal likelihood, and 0.5 and 0, respectively, for those that are less likely and virtually impossible. The algorithm of approximate reasoning, developed in this paper, is in Appendix B.
4. Results
When defining the set of criteria and sub-criteria for the assessment of the impact of traffic accessibility on the development of suburbs, an expert economy team made up of five professionals from the fields of transport systems and public transport was consulted in the city of Niš. The number of experts who took part in this research was limited due to the impossibility of involving more experts who live and work in the territory of the city of Nis. When forming the model to define and assess the criteria for traffic accessibility, it was required that all experts come from the urban unit territory.
On the selection of the criteria (Appendix A), the rules in order to obtain an assessment of the impact of traffic accessibility (fuzzy output) were formed. Model testing was carried out on the test area of the city of Niš, in which the PT system works.
4.1. Description of the Test Area
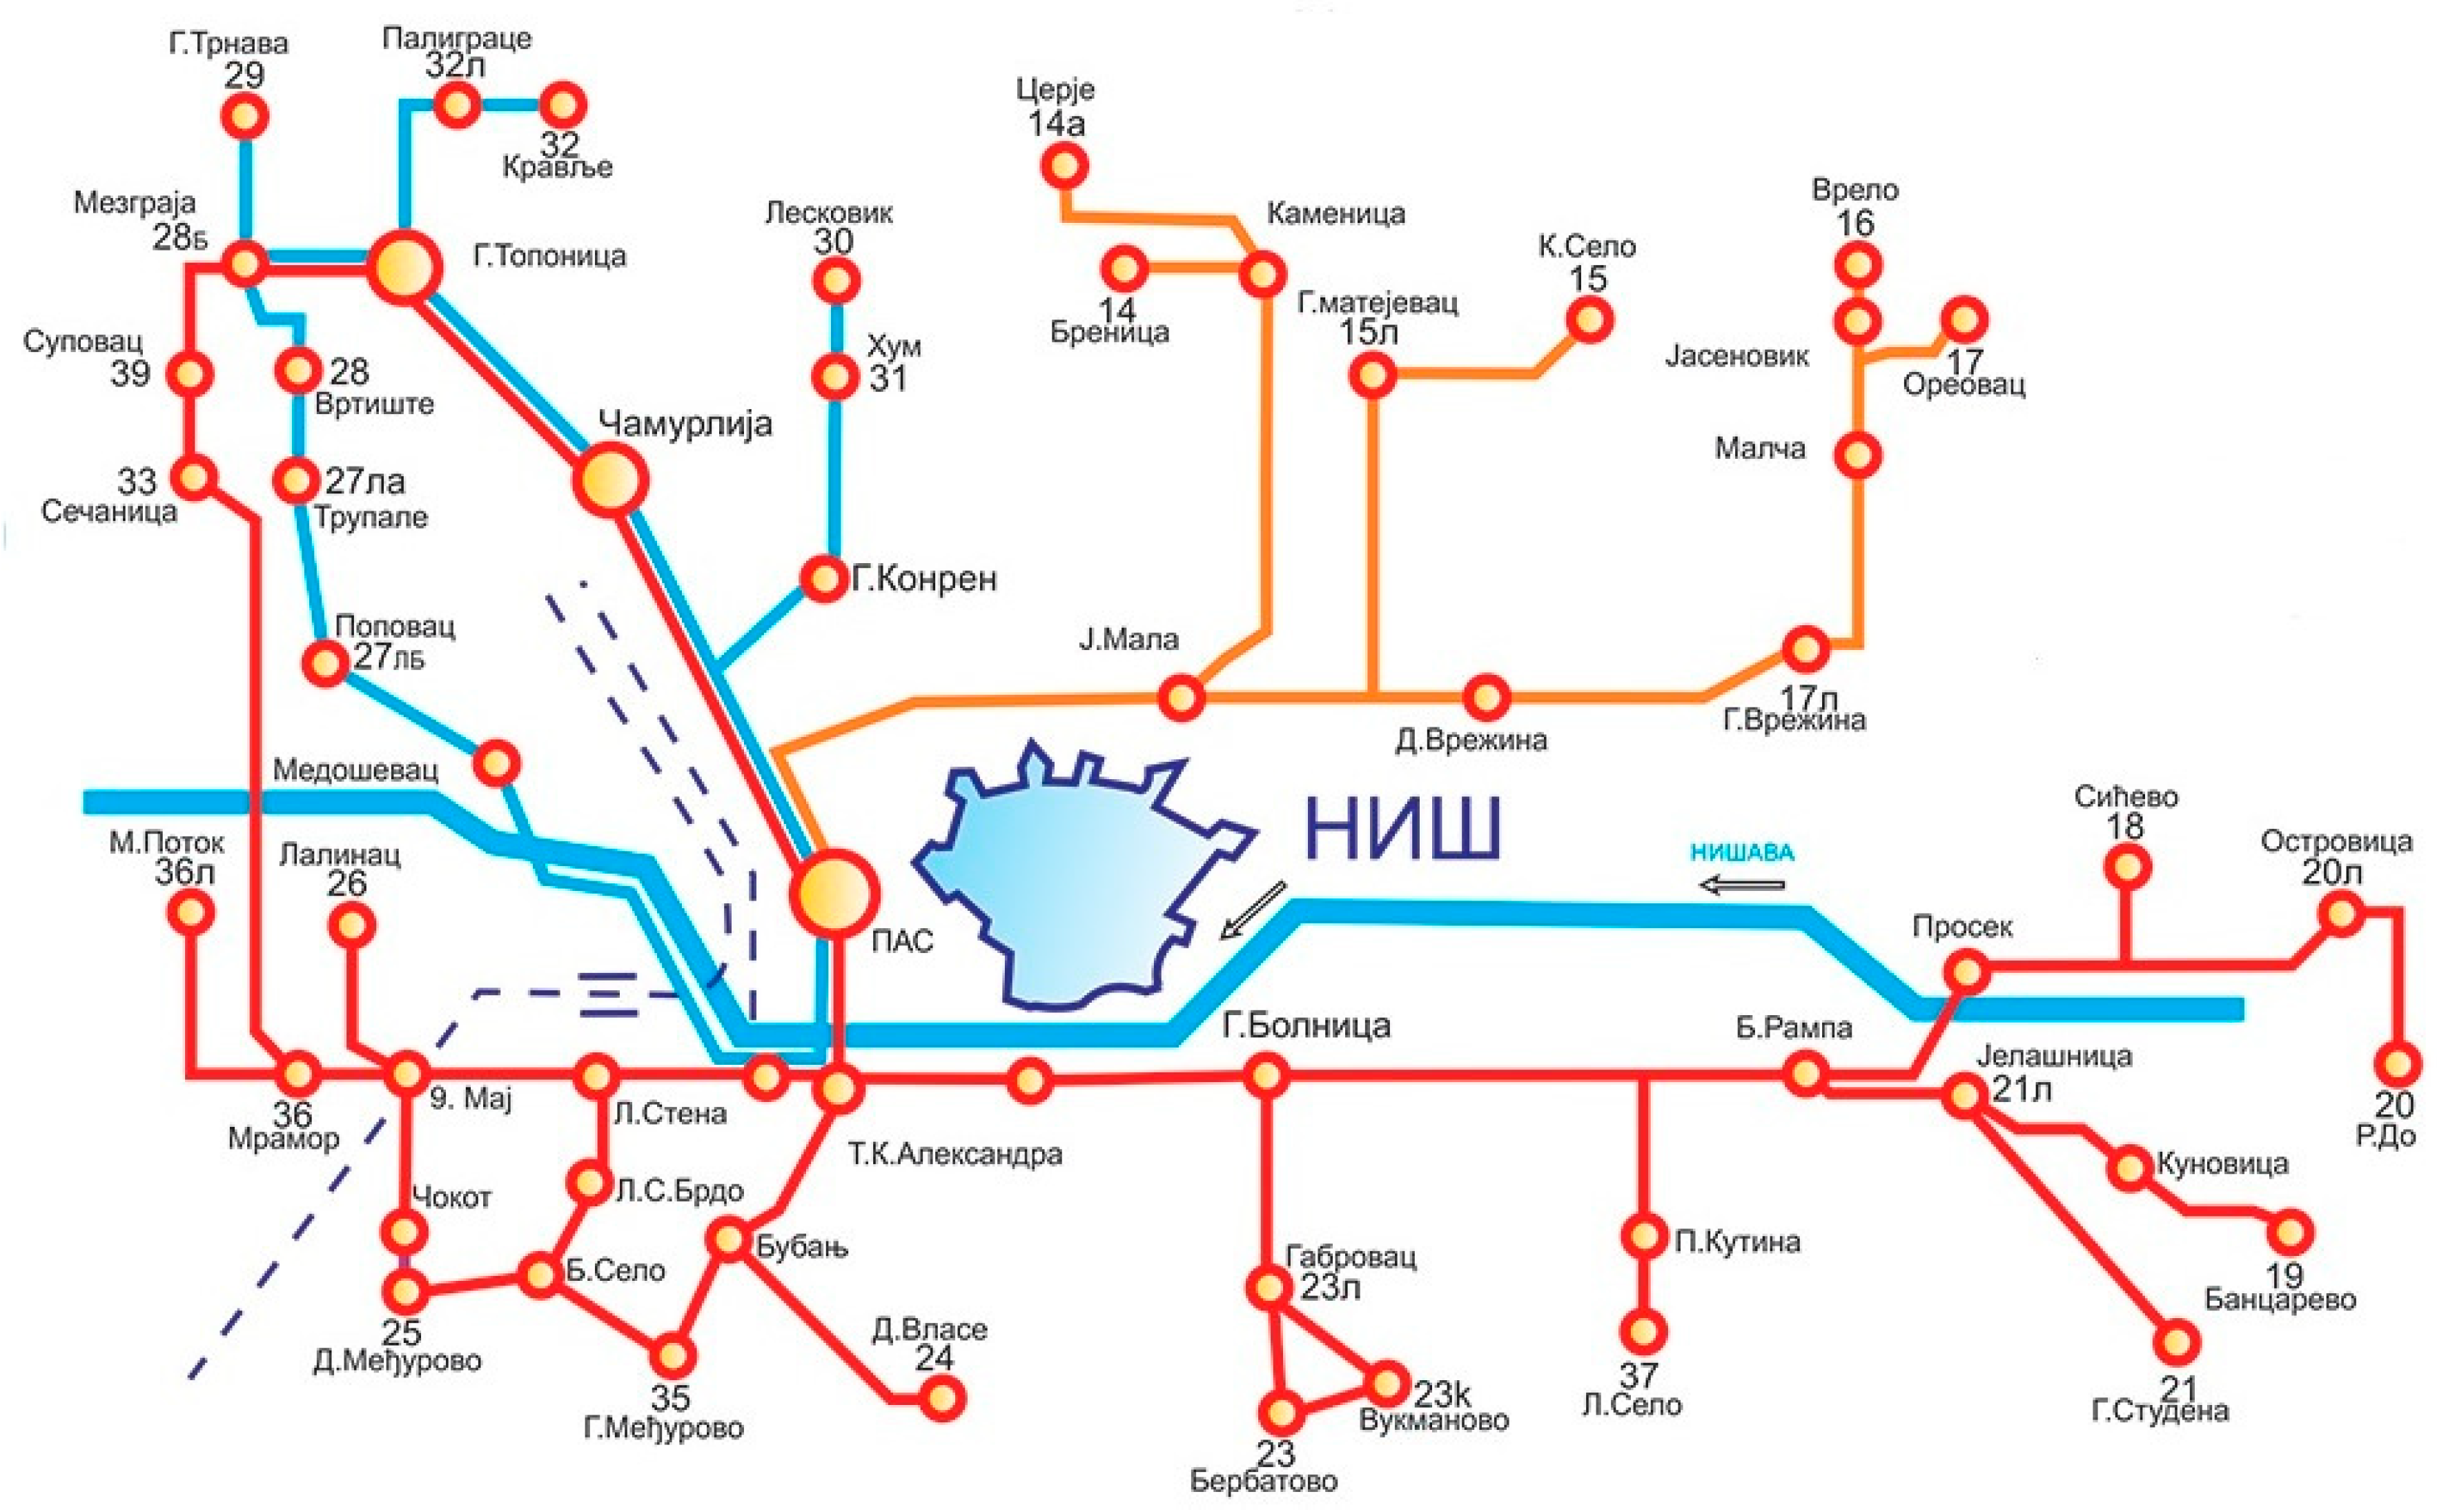
The city of Niš is located in the basin of Niš at 43°19′ north latitude and 21°54′ east longitude. It covers an area of around 596.6 km2 and according to the citizen registration statistics for 2011, has 260,237 inhabitants [41]. The city of Niš has a unique monocentric structure, which is the outcome of its geographic position and structure. Niš has a recorded amount of travel from the periphery towards the center, due to a great concentration of people in the central city area and the large number of activities that are found there. Its urban public transport system consists of 45 lines, of which 14 are city and 31 are local lines (Figure 9). The entire PT network is serviced by buses, and there exists a tariff system consisting of four different zones.
4.2. Experimental Results of the Model
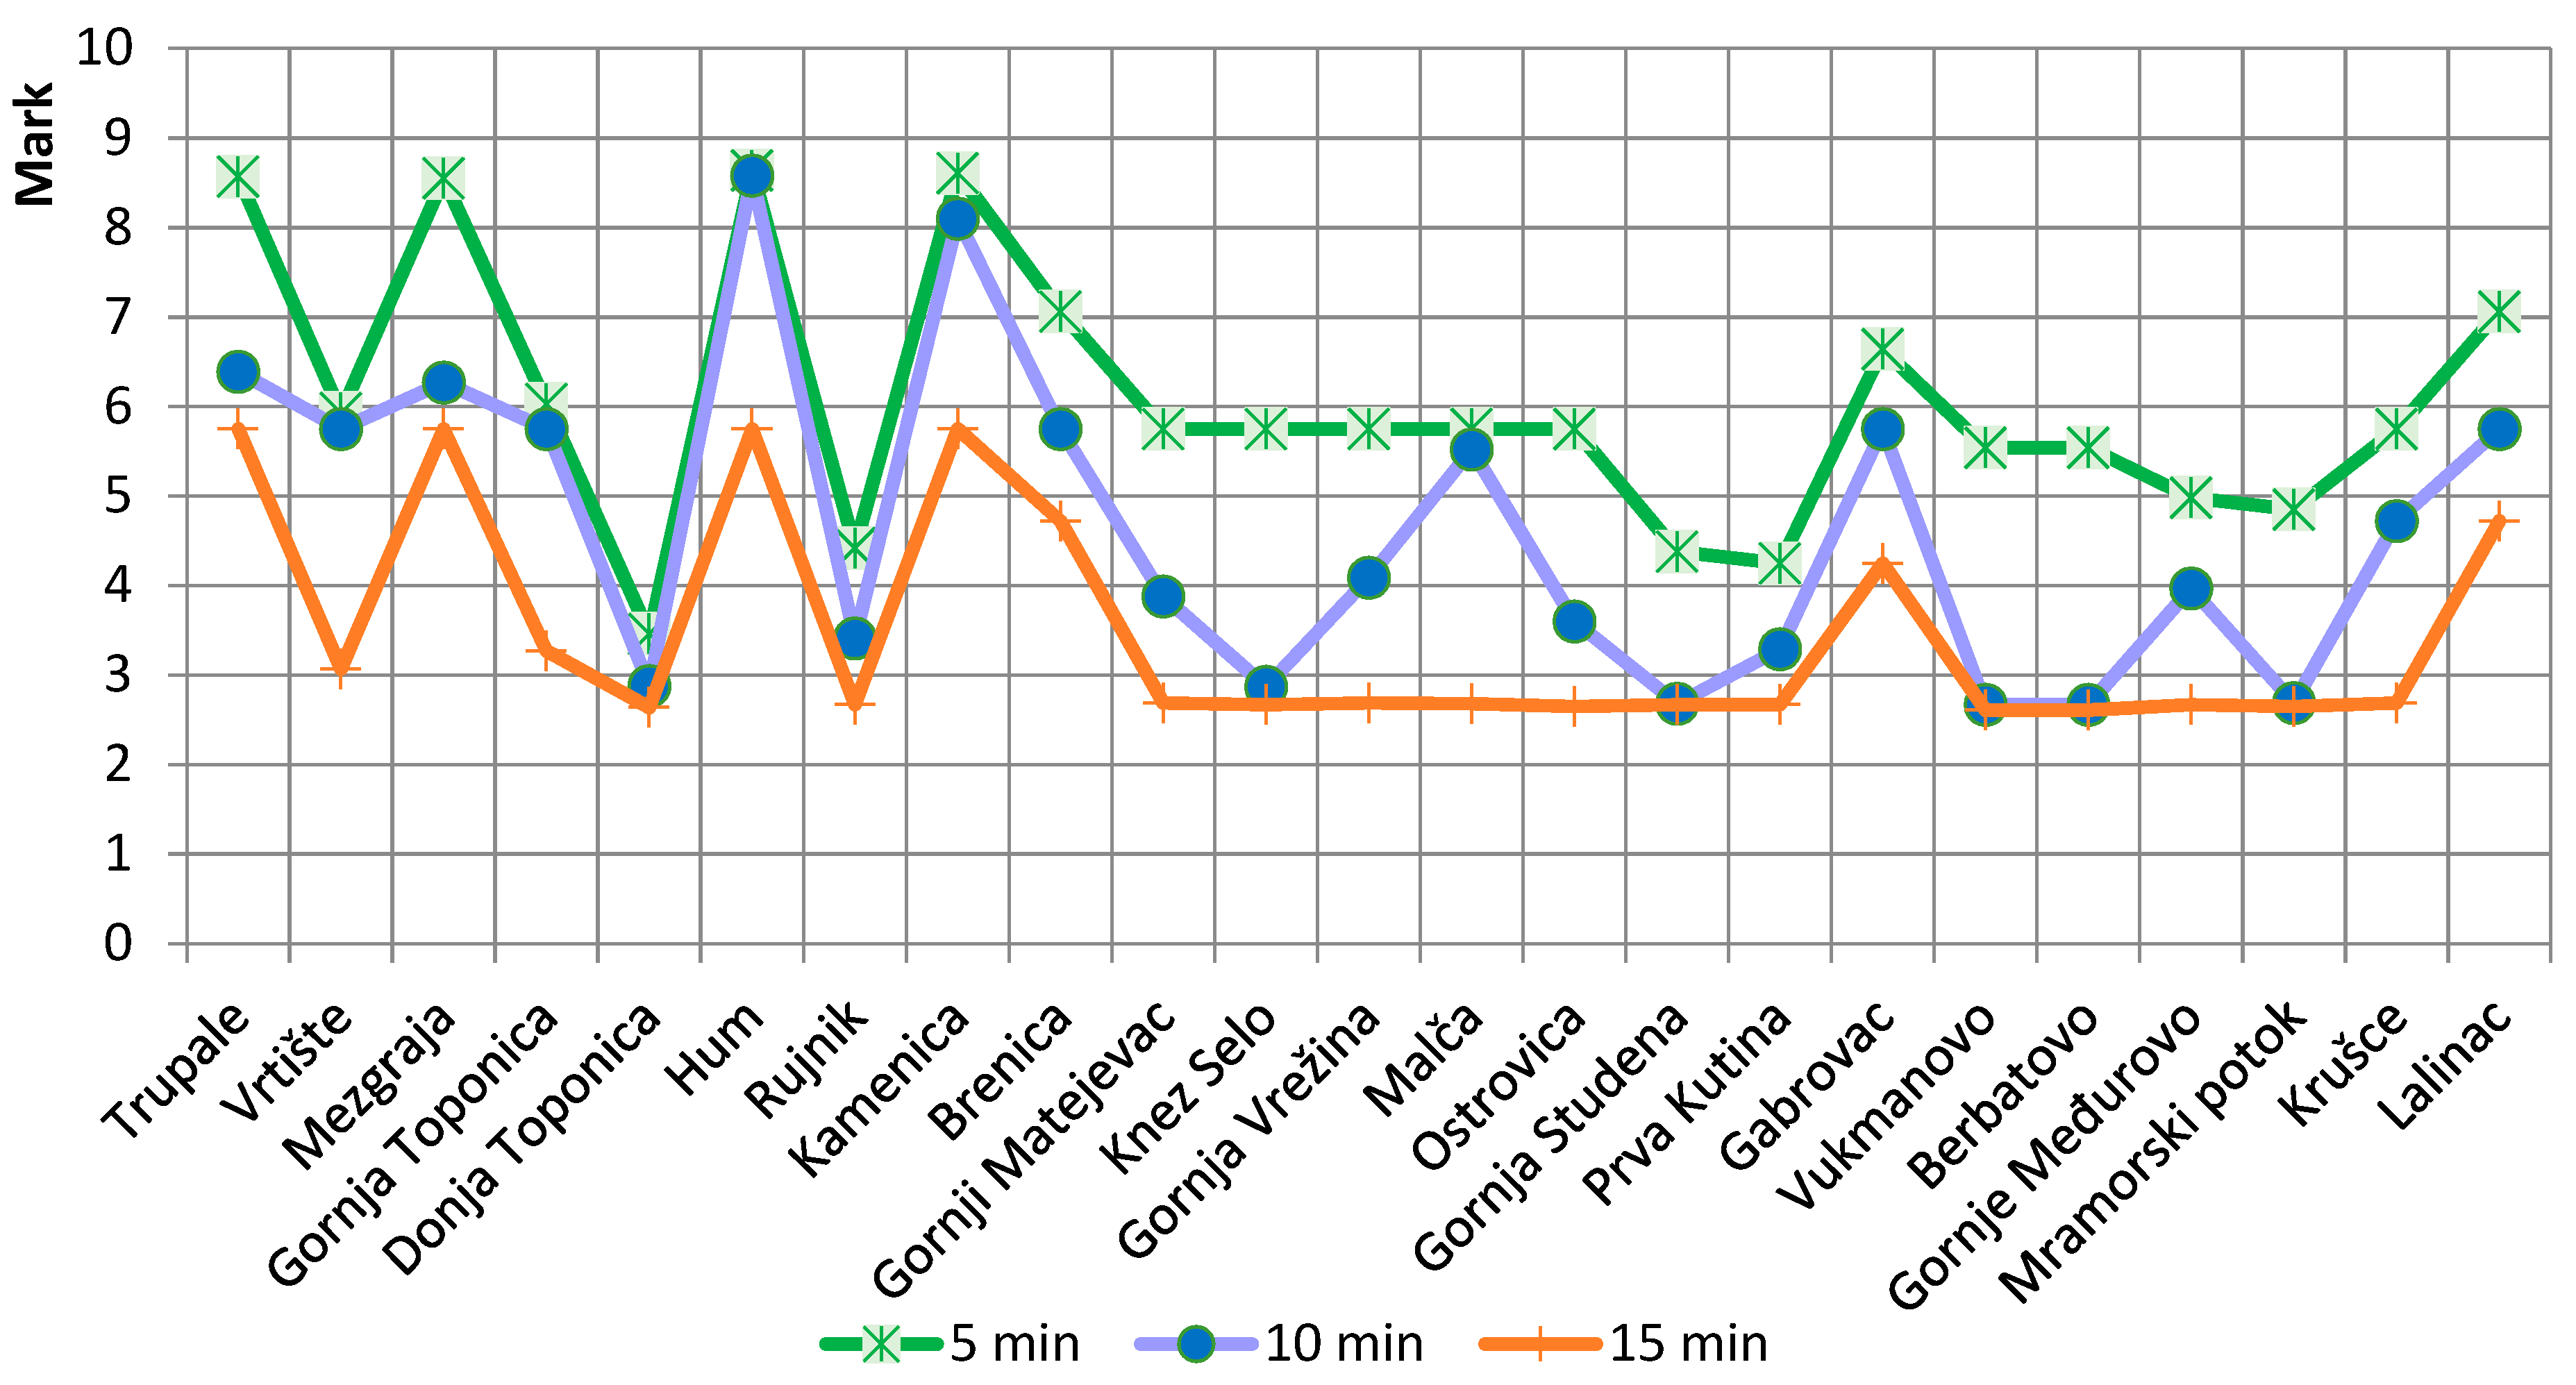
The assessment of traffic accessibility in the suburban settlements was obtained as a result of the partial operation of each of the selected criteria (network of public transport lines, network access roads, walking time, driving time, and timetable). The determination of the walking time is a complex process that depends on the distance of the households (spatial distribution) to the nearest stop in the settlement, the type of terrain (flatland, hilly), the number of stops, and the type of pavement (asphalt, earthy road). For this reason, the walking time values of 5 min, 10 min and 15 min were the most acceptable (Table 3).
The proposed fuzzy model, developed in this paper, was tested in the territory of the municipality of Niš, in 23 selected suburban settlements within the public transport system transport lines (Figure 10).
5. Discussion
By reviewing the literature, scientific papers and research, as well as consulting with experts from relevant fields, a total of 13 criteria for assessing the impact of traffic accessibility in suburban settlements were identified. They are classified into four groups: transport, space, quality of service and system quality. Economic experts who are directly in touch with the analyzed problematics were involved in assessing the significance of certain criteria within each group of criteria.
A multi-criteria analysis using the FAHP method identified from each group the criteria that are a priority in assessing the impact of traffic accessibility. The criteria that in the normalized ranks gained an advantage over the others in the group were network of PT lines, network access roads, travel time (walking and driving), and timetable.
The selected criteria with the highest relative weight from each group were used to develop models to assess the traffic accessibility in suburban settlements, with the help of fuzzy logic features. The model proposed here consists of 108 rules, and gives weight to each rule. The quantification of the sets of criteria in the fuzzy models was made using the Mamdani fuzzy locking system (centroid defasification), the minimization method for the “AND” operator, and the maximization method for the “OR” operator.
For 23 suburban settlements in the observed territory, traffic access estimates for different walking time values are shown in Figure 10. For five-minute walking, the traffic accessibility estimates ranged from 8.64 to 3.46. The highest score for 10-minute walking was 8.58, while the lowest was 2.67. For 15-minute walking, the traffic accessibility estimates of the settlements ranged from 5.75 to 2.61. In all three cases, the suburbs Hum (8.64; 8.58; 5.75) and Kamenica (8.61; 8.1; 5.75) had the highest traffic accessibility. The worst assessment of traffic accessibility included the suburbs of Gornja Studena (4.38; 2.68; 2.67) and Donja Toponica (3.46; 2.88; 2.64).
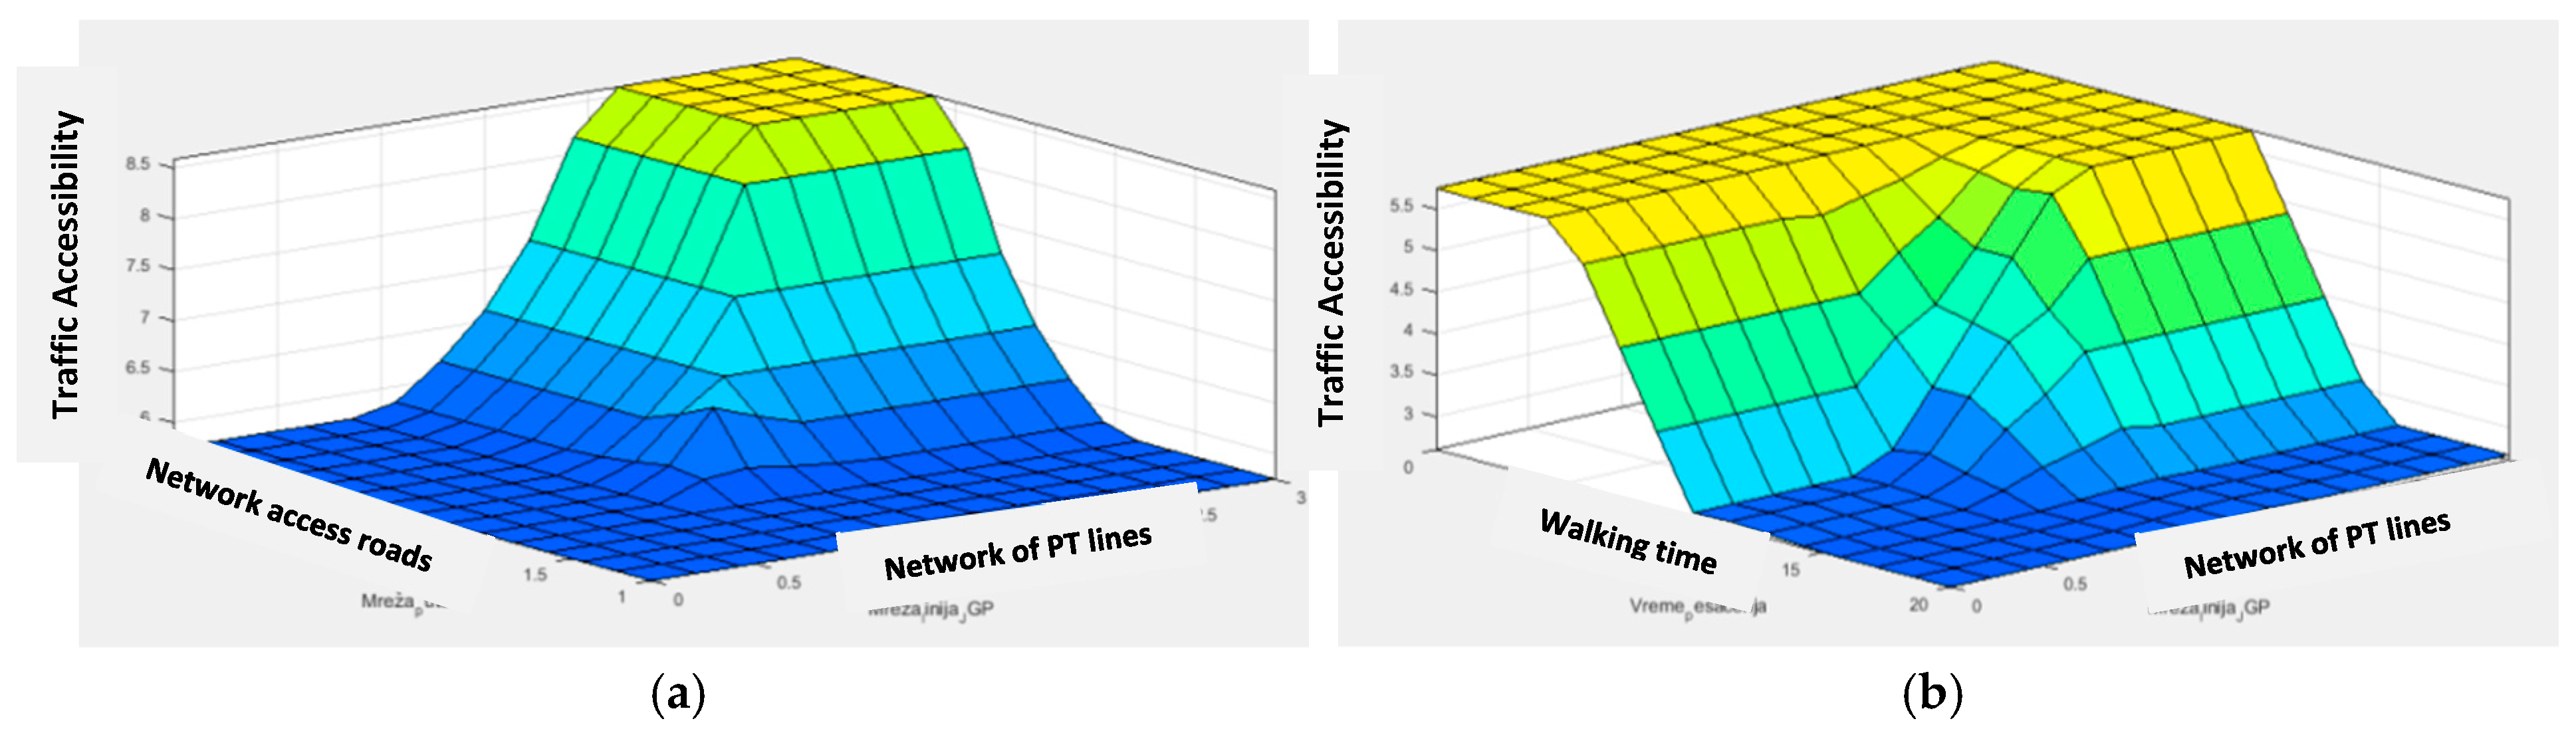
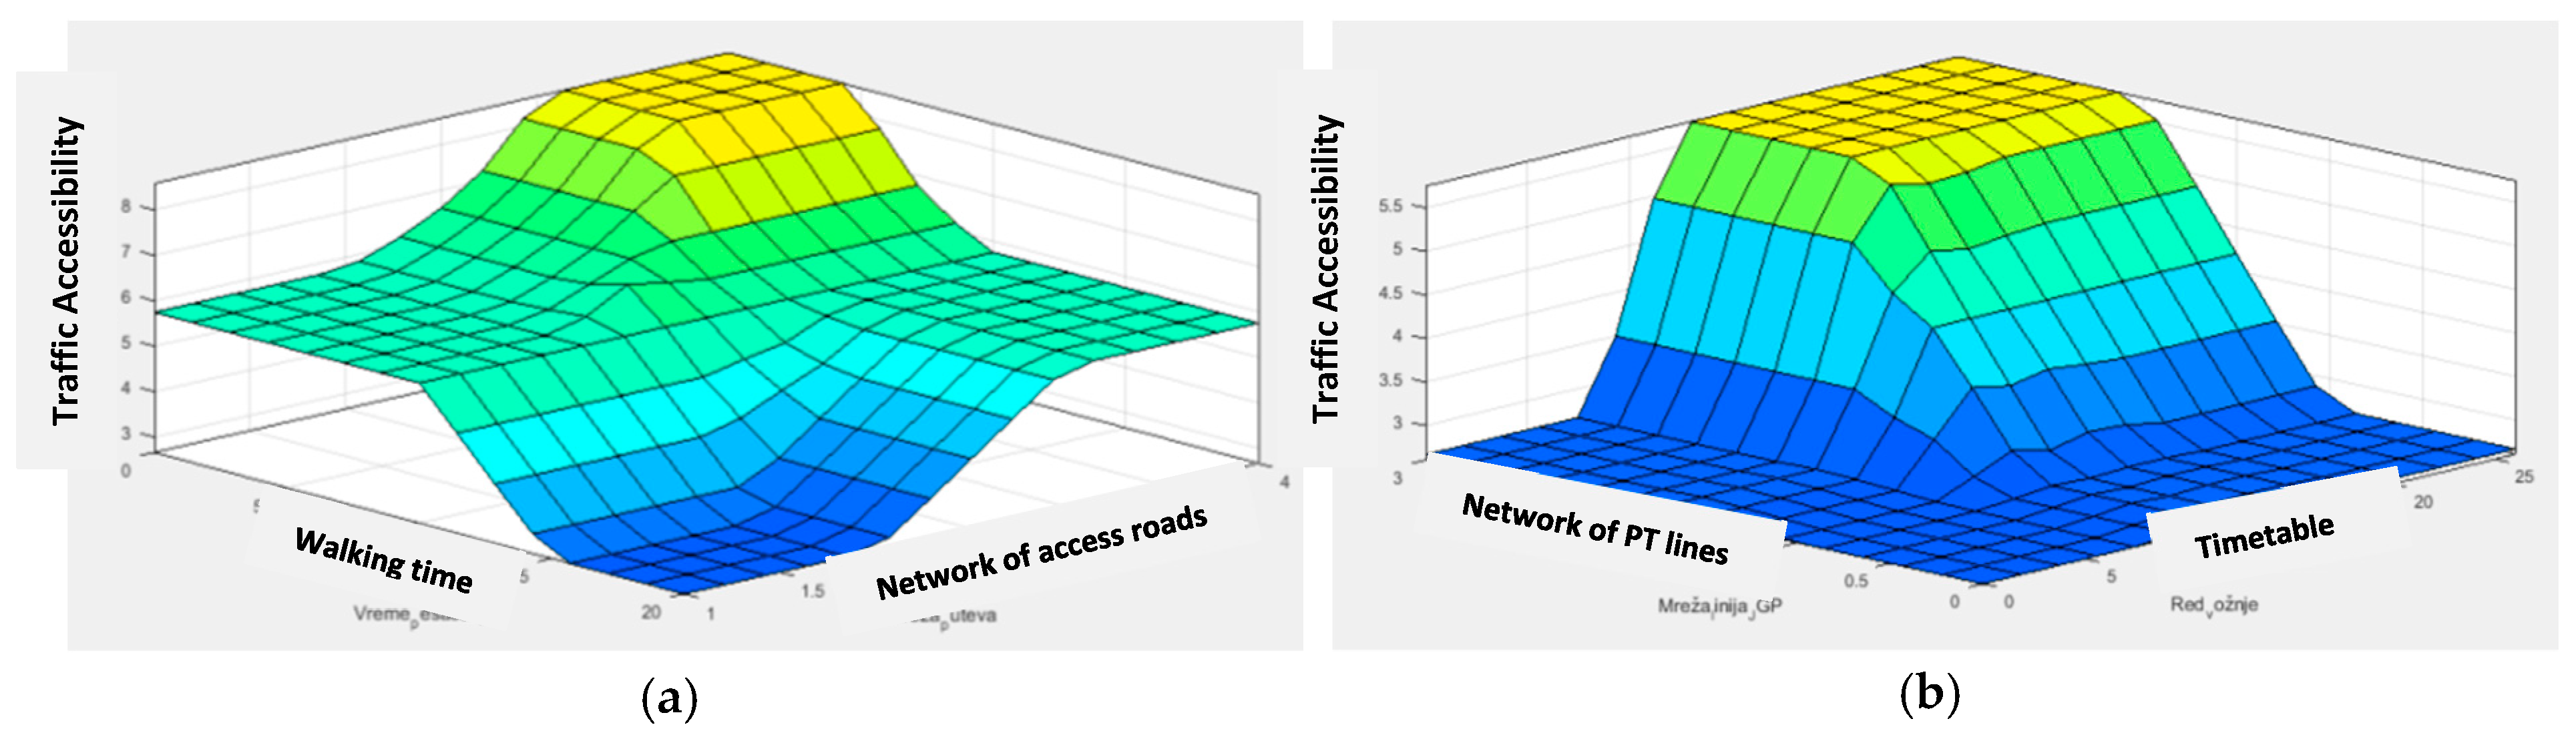
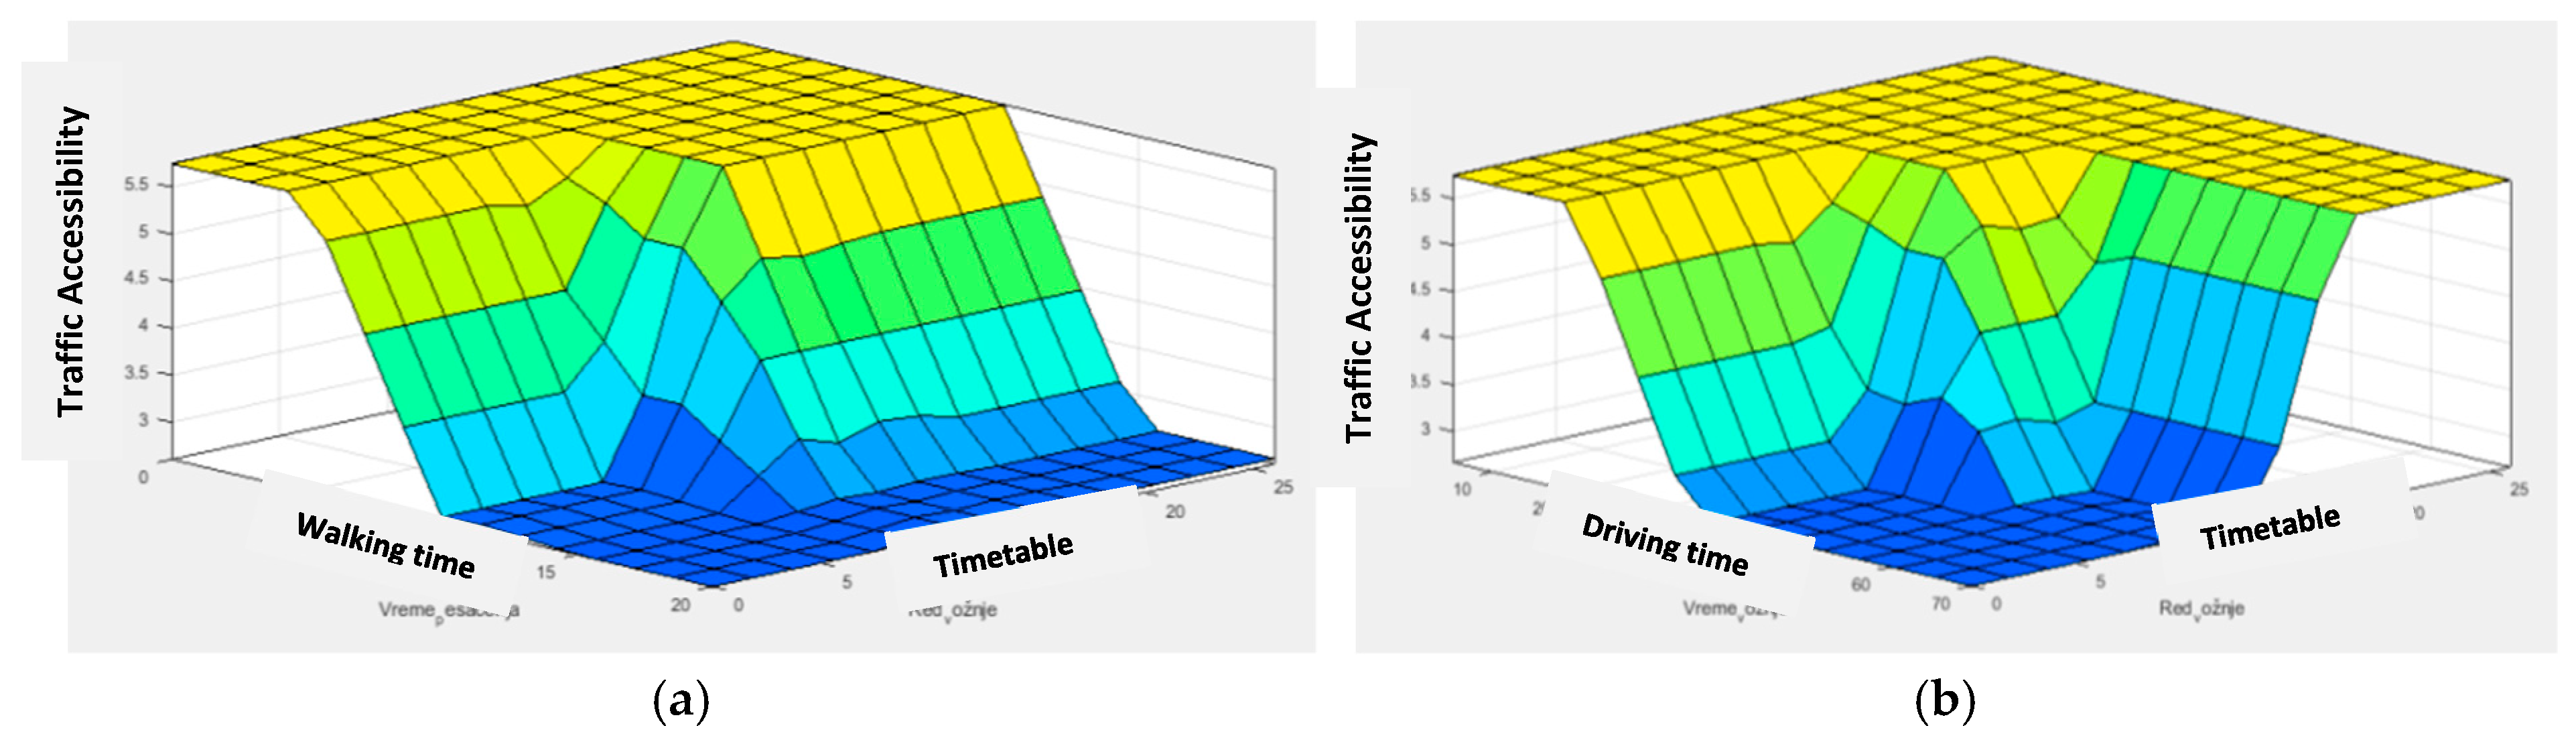
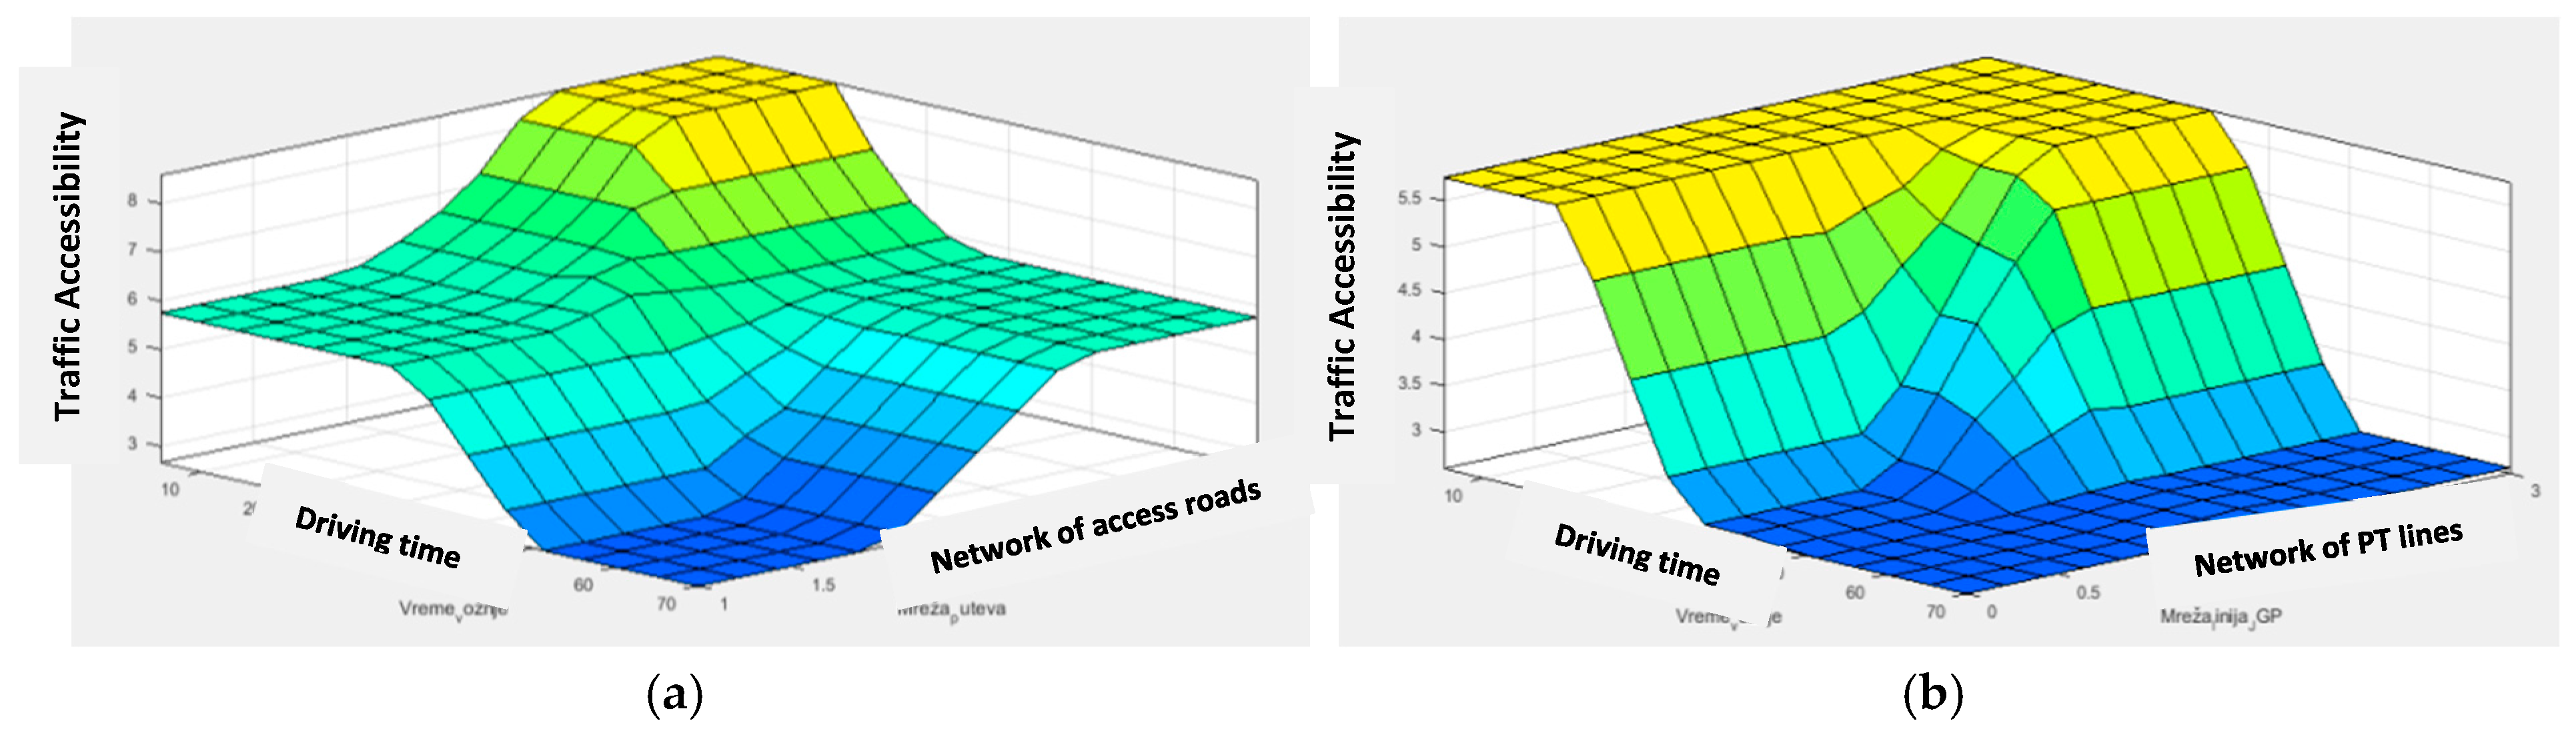
A graphic interpretation of the output fuzzy variable is shown by a tri-dimensional surface using a constant value of pairs of criteria (Figure 11, Figure 12, Figure 13 and Figure 14). This surface shows a gradual change in color, with no sudden drops or sharp recesses. This determines that the adopted values of the criteria were good and that the rules of the model are correctly set. The yellow on the surface represents the highest assessment of the impact of traffic accessibility, whereas dark blue stands for the lowest. Classified according to the pairs of criteria, a change in the output variable can be represented easily, by altering the constant of one and/or the other criterion. Moreover, the diagrams show which pairs of criteria have, in general, better or less good assessments of the impact of the output variable. The ratio of the following input pairs—walking time–network of roads and driving time–network of roads—show a favorable distribution of the assessment of the impact of traffic accessibility, while the values of the input criteria ‘driving time–timetable’ offer the best results for the assessment of the impact of traffic accessibility in the proposed model.
The research conducted in this paper is the first of its kind. This pilot research or case study on the city of Niš serves as a methodological experiment and offers a good insight into the criteria that are of special importance for the understanding of the impact of traffic accessibility on suburban areas. The assessment of traffic accessibility, obtained as a result of the partial influence of each of the selected criteria, shows that the model defined in this paper puts forth arguments for local authorities to introduce necessary measures.
At the beginning of the paper, two main hypotheses were established, which were confirmed throughout the research. By defining a greater number of different impact factors on traffic accessibility and by applying the method for multi-criteria decision-making, it was possible to select dominant criteria that represent the generators of development and sustainability of suburban areas, in a similar way as the accessibility criteria were defined by Litman [14,24]. The identification of such criteria confirmed the assumption of the first hypothesis, while the results confirmed that the studied factors have significance in defining relevant criteria.
Selecting the relevant criteria, setting the rules and conditions, and the quantification of the ranked criteria were performed according to their significance, which enabled the sorting of suburban areas into those with insufficient, good and excellent accessibility. Ranković-Plazinić [16] defined the types of rural settlement in relation to accessibility, which is a good basis for the implementation of this model. This created an opportunity for the assessment of the criteria for traffic accessibility. Based on this, through the selection and assessment of suburban areas for the case study of the city of Niš, the second research hypothesis was confirmed.
6. Conclusions
This kind of model may improve the present situation, because it will, on the one hand, reduce the interest of suburban dwellers in moving to cities, and, on the other hand, increase the interest of certain categories of citizens to move to suburban areas where they can have healthier and more favorable living conditions; this is already a trend in a large number of European cities. This means that a passenger car should offer an appropriate alternative, but also that the principle of sustainability should be respected, according to Teigen [9].
In order that rural areas be competitive in terms of living conditions and attractive for economic investment, it is necessary to ensure adequate infrastructure and a higher quality of public transport, that is, traffic accessibility, which was one of Ambarwati’s findings [11]. Since rural communities have many specific characteristics, their transport needs are also very specific; this is why a deeper understanding of the transport needs is required in order to suggest concrete measures for the social, economic and ecological development of rural areas. In the system of urban public transport there are three interest groups, namely the local community, carriers and users (passengers). Representatives of the local authorities make strategic decisions regarding the development of certain settlements or urban units, and they should therefore be interested in their improvement, which is completely in line with the methodology that was defined in this paper.
The context in which decisions regarding the implementation of measures is made should have strong ties with the impacts that will be assessed, the aims that should be reached and the target groups (users of public transport) that should be taken into consideration. Therefore, the impact assessment must be based on the results of direct observations or other experiments. It can be concluded that the political and strategic framework for this concept, provided in this paper, is the most important aspect for the implementation of the set measures, which is an issue for which regional and local authorities should be responsible.
The scientific contribution of this paper is primarily the development of a model for the assessment of traffic accessibility in suburban areas where the urban public transport system is operational. This transcends the existing models by keeping the settlements competitive in terms of living standards, as well as making them attractive for economic investment. Through the definition and quantification of significant criteria for traffic accessibility, first steps were made towards the development of a new model. The developed model for the assessment of traffic accessibility showed good results.
In order to strengthen the bond between the parameters in this model, it is necessary to have broad knowledge of the natural, social, economic and other characteristics of a settlement. Also, for similar research in the future, the research area would need to be broader, that is, with less limitations than in this case. This means that the number of experts would need to be greater and their professional interests would need to encompass wider social and natural areas.
The application of these results in real life is multifaceted and may effect an improvement of the quality of life, the accessibility of different services, the systematic development of settlements and a possible decrease in the migration of residents from suburban areas.
Author Contributions
M.S. and P.G. conceived and designed the experiments; V.P. and V.L. performed the experiments and analyzed the data; M.S. and P. G. wrote the paper.
Conflicts of Interest
The authors declare no conflict of interest.
Appendix A
Table A1 shows a fuzzy matrix for the comparison of a group of transport criteria. (A1—Network of PT lines; A2—Remoteness of the railway; A3—Characteristics of the settlement; A4—Possession of a car in the household).

Table A1.
Compatibility matrix for a group of transport criteria.
| A1 | A2 | A3 | A4 | ||
|---|---|---|---|---|---|
| A1 | E1 | (1, 1, 1) | (5/2, 3, 7/2) | (1, 1, 1) | (1, 1, 1) |
| E2 | (1, 1, 1) | (1, 1, 1) | (1, 1, 1) | (3/2, 2, 5/2) | |
| E3 | (1, 1, 1) | (3/2, 2, 5/2) | (3/2, 2, 5/2) | (1/2, 1, 3/2) | |
| E4 | (1, 1, 1) | (3/2, 2, 5/2) | (1/2, 1, 3/2) | (3/2, 2, 5/2) | |
| E5 | (1, 1, 1) | (3/2, 2, 5/2) | (3/2, 2, 5/2) | (1, 1, 1) | |
| A2 | E1 | (2/7, 1/3, 2/5) | (1, 1, 1) | (2/7, 1/3, 2/5) | (2/7, 1/3, 2/5) |
| E2 | (1, 1, 1) | (1, 1, 1) | (1, 1, 1) | (3/2, 2, 5/2) | |
| E3 | (2/5, 1/2, 2/3) | (1, 1, 1) | (1, 1, 1) | (2/3, 1, 2) | |
| E4 | (2/5, 1/2, 2/3) | (1, 1, 1) | (2/3, 1, 2) | (1, 1, 1) | |
| E5 | (2/5, 1/2, 2/3) | (1, 1, 1) | (2/5, 1/2, 2/3) | (2/9, 1/4, 2/7) | |
| A3 | E1 | (1, 1, 1) | (5/2, 3, 7/2) | (1, 1, 1) | (1, 1, 1) |
| E2 | (1, 1, 1) | (1, 1, 1) | (1, 1, 1) | (3/2, 2, 5/2) | |
| E3 | (2/5, 1/2, 2/3) | (1, 1, 1) | (1, 1, 1) | (2/3, 1, 2) | |
| E4 | (2/3, 1, 2) | (1/2, 1, 3/2) | (1, 1, 1) | (1/2, 1, 3/2) | |
| E5 | (2/5, 1/2, 2/3) | (3/2, 2, 5/2) | (1, 1, 1) | (2/5, 1/2, 2/3) | |
| A4 | E1 | (1, 1, 1) | (5/2, 3, 7/2) | (1, 1, 1) | (1, 1, 1) |
| E2 | (2/5, 1/2, 2/3) | (2/5, 1/2, 2/3) | (2/5, 1/2, 2/3) | (1, 1, 1) | |
| E3 | (2/3, 1, 2) | (1/2, 1, 3/2) | (1/2, 1, 3/2) | (1, 1, 1) | |
| E4 | (2/5, 1/2, 2/3) | (1, 1, 1) | (2/3, 1, 2) | (1, 1, 1) | |
| E5 | (1, 1, 1) | (7/2, 4, 9/2) | (3/2, 2, 5/2) | (1, 1, 1) |
Table A2.
Average and normalized weight criteria for a group of transport criteria.
| Criteria | W′ | W | Rank |
|---|---|---|---|
| Network of PT lines—A1 | 1 | 0.435 | 1 |
| Remoteness of the railway—A2 | 0.070 | 0.031 | 4 |
| Characteristics of the settlement—A3 | 0.610 | 0.265 | 3 |
| Possession of a car in the household—A4 | 0.619 | 0.269 | 2 |
Table A3.
Relative rank of significance of particular criteria on the basis of comparisons within the criteria group.
Table A3.
Relative rank of significance of particular criteria on the basis of comparisons within the criteria group.
| Criteria | Sub-Criteria | W′ | W |
|---|---|---|---|
| Transport | Network of PT lines | 1 | 0.435 |
| Remoteness of the railway | 0.070 | 0.031 | |
| Characteristics of the settlement | 0.610 | 0.265 | |
| Possession of a car in the household | 0.619 | 0.269 | |
| Space | Built infrastructure | 0.961 | 0.333 |
| Network of access roads | 1 | 0.437 | |
| Remoteness from the most significant contents | 0.920 | 0.319 | |
| Quality of service | Comfort in a vehicle | 0.502 | 0.206 |
| Travel time | 1 | 0.411 | |
| Transfer points | 0.931 | 0.383 | |
| System quality | Timetable | 1 | 0.378 |
| Transport costs | 0.934 | 0.354 | |
| Tariff system | 0.708 | 0.268 |
Appendix B
Table A4.
Network of “simple” PT lines.
| Network of “Less Good” Access Roads | ||||
| Walking Time | Driving Time | Timetable | Traffic Accessibility | Weight |
| Acceptable | Acceptable | Inappropriate | GOOD | 0.5 |
| Acceptable | Acceptable | Average | GOOD | 1 |
| Acceptable | Acceptable | Relevant | GOOD | 1 |
| Acceptable | Satisfactory | Inappropriate | INSUFFICIENT | 0.5 |
| Acceptable | Satisfactory | Average | GOOD | 0.5 |
| Acceptable | Satisfactory | Relevant | GOOD | 0.5 |
| Acceptable | Unacceptable | Inappropriate | INSUFFICIENT | 0.5 |
| Acceptable | Unacceptable | Average | INSUFFICIENT | 0.5 |
| Acceptable | Unacceptable | Relevant | GOOD | 0.5 |
| Satisfactory | Acceptable | Inappropriate | INSUFFICIENT | 0.5 |
| Satisfactory | Acceptable | Average | GOOD | 0.5 |
| Satisfactory | Acceptable | Relevant | GOOD | 0.5 |
| Satisfactory | Satisfactory | Inappropriate | INSUFFICIENT | 1 |
| Satisfactory | Satisfactory | Average | INSUFFICIENT | 0.5 |
| Satisfactory | Satisfactory | Relevant | INSUFFICIENT | 0.5 |
| Satisfactory | Unacceptable | Inappropriate | INSUFFICIENT | 1 |
| Satisfactory | Unacceptable | Average | INSUFFICIENT | 1 |
| Satisfactory | Unacceptable | Relevant | INSUFFICIENT | 0.5 |
| Unacceptable | Acceptable | Inappropriate | INSUFFICIENT | 1 |
| Unacceptable | Acceptable | Average | INSUFFICIENT | 0.5 |
| Unacceptable | Acceptable | Relevant | INSUFFICIENT | 0.5 |
| Unacceptable | Satisfactory | Inappropriate | INSUFFICIENT | 1 |
| Unacceptable | Satisfactory | Average | INSUFFICIENT | 1 |
| Unacceptable | Satisfactory | Relevant | INSUFFICIENT | 0.5 |
| Unacceptable | Unacceptable | Inappropriate | INSUFFICIENT | 1 |
| Unacceptable | Unacceptable | Average | INSUFFICIENT | 1 |
| Unacceptable | Unacceptable | Relevant | INSUFFICIENT | 1 |
| Network of “Good” Access Roads | ||||
| Walking Time | Driving Time | Timetable | Traffic Accessibility | Weight |
| Acceptable | Acceptable | Inappropriate | GOOD | 1 |
| Acceptable | Acceptable | Average | INSUFFICIENT | 0.5 |
| Acceptable | Acceptable | Relevant | INSUFFICIENT | 0.5 |
| Acceptable | Satisfactory | Inappropriate | GOOD | 0.5 |
| Acceptable | Satisfactory | Average | GOOD | 1 |
| Acceptable | Satisfactory | Relevant | GOOD | 1 |
| Acceptable | Unacceptable | Inappropriate | GOOD | 0.5 |
| Acceptable | Unacceptable | Average | GOOD | 0.5 |
| Acceptable | Unacceptable | Relevant | GOOD | 1 |
| Satisfactory | Acceptable | Inappropriate | GOOD | 0.5 |
| Satisfactory | Acceptable | Average | GOOD | 1 |
| Satisfactory | Acceptable | Relevant | GOOD | 1 |
| Satisfactory | Satisfactory | Inappropriate | INSUFFICIENT | 0.5 |
| Satisfactory | Satisfactory | Average | GOOD | 0.5 |
| Satisfactory | Satisfactory | Relevant | GOOD | 0.5 |
| Satisfactory | Unacceptable | Inappropriate | INSUFFICIENT | 0.5 |
| Satisfactory | Unacceptable | Average | INSUFFICIENT | 0.5 |
| Satisfactory | Unacceptable | Relevant | GOOD | 0.5 |
| Unacceptable | Acceptable | Inappropriate | INSUFFICIENT | 0.5 |
| Unacceptable | Acceptable | Average | GOOD | 0.5 |
| Unacceptable | Acceptable | Relevant | GOOD | 0.5 |
| Unacceptable | Satisfactory | Inappropriate | INSUFFICIENT | 1 |
| Unacceptable | Satisfactory | Average | INSUFFICIENT | 0.5 |
| Unacceptable | Satisfactory | Relevant | INSUFFICIENT | 0.5 |
| Unacceptable | Unacceptable | Inappropriate | INSUFFICIENT | 1 |
| Unacceptable | Unacceptable | Average | INSUFFICIENT | 1 |
| Unacceptable | Unacceptable | Relevant | INSUFFICIENT | 0.5 |
Table A5.
Network of “complex” PT lines.
| Network of “Less Good” Access Roads | ||||
| Walking Time | Driving Time | Timetable | Traffic Accessibility | Weight |
| Acceptable | Acceptable | Inappropriate | GOOD | 1 |
| Acceptable | Acceptable | Average | EXCELLENT | 0.5 |
| Acceptable | Acceptable | Relevant | EXCELLENT | 0.5 |
| Acceptable | Satisfactory | Inappropriate | GOOD | 0.5 |
| Acceptable | Satisfactory | Average | GOOD | 1 |
| Acceptable | Satisfactory | Relevant | GOOD | 1 |
| Acceptable | Unacceptable | Inappropriate | GOOD | 0.5 |
| Acceptable | Unacceptable | Average | GOOD | 0.5 |
| Acceptable | Unacceptable | Relevant | GOOD | 1 |
| Satisfactory | Acceptable | Inappropriate | GOOD | 0.5 |
| Satisfactory | Acceptable | Average | GOOD | 1 |
| Satisfactory | Acceptable | Relevant | GOOD | 1 |
| Satisfactory | Satisfactory | Inappropriate | INSUFFICIENT | 0.5 |
| Satisfactory | Satisfactory | Average | GOOD | 0.5 |
| Satisfactory | Satisfactory | Relevant | GOOD | 0.5 |
| Satisfactory | Unacceptable | Inappropriate | INSUFFICIENT | 0.5 |
| Satisfactory | Unacceptable | Average | INSUFFICIENT | 0.5 |
| Satisfactory | Unacceptable | Relevant | GOOD | 0.5 |
| Unacceptable | Acceptable | Inappropriate | INSUFFICIENT | 0.5 |
| Unacceptable | Acceptable | Average | GOOD | 0.5 |
| Unacceptable | Acceptable | Relevant | GOOD | 0.5 |
| Unacceptable | Satisfactory | Inappropriate | INSUFFICIENT | 1 |
| Unacceptable | Satisfactory | Average | INSUFFICIENT | 0.5 |
| Unacceptable | Satisfactory | Relevant | INSUFFICIENT | 0.5 |
| Unacceptable | Unacceptable | Inappropriate | INSUFFICIENT | 1 |
| Unacceptable | Unacceptable | Average | INSUFFICIENT | 1 |
| Unacceptable | Unacceptable | Relevant | INSUFFICIENT | 0.5 |
| Network of “Good” Access Roads | ||||
| Walking Time | Driving Time | Timetable | Traffic Accessibility | Weight |
| Acceptable | Acceptable | Inappropriate | EXCELLENT | 0.5 |
| Acceptable | Acceptable | Average | EXCELLENT | 1 |
| Acceptable | Acceptable | Relevant | EXCELLENT | 1 |
| Acceptable | Satisfactory | Inappropriate | GOOD | 1 |
| Acceptable | Satisfactory | Average | EXCELLENT | 0.5 |
| Acceptable | Satisfactory | Relevant | EXCELLENT | 0.5 |
| Acceptable | Unacceptable | Inappropriate | GOOD | 1 |
| Acceptable | Unacceptable | Average | GOOD | 1 |
| Acceptable | Unacceptable | Relevant | EXCELLENT | 0.5 |
| Satisfactory | Acceptable | Inappropriate | GOOD | 1 |
| Satisfactory | Acceptable | Average | EXCELLENT | 0.5 |
| Satisfactory | Acceptable | Relevant | EXCELLENT | 0.5 |
| Satisfactory | Satisfactory | Inappropriate | GOOD | 0.5 |
| Satisfactory | Satisfactory | Average | GOOD | 1 |
| Satisfactory | Satisfactory | Relevant | GOOD | 1 |
| Satisfactory | Unacceptable | Inappropriate | GOOD | 0.5 |
| Satisfactory | Unacceptable | Average | GOOD | 0.5 |
| Satisfactory | Unacceptable | Relevant | GOOD | 1 |
| Unacceptable | Acceptable | Inappropriate | GOOD | 0.5 |
| Unacceptable | Acceptable | Average | GOOD | 1 |
| Unacceptable | Acceptable | Relevant | GOOD | 1 |
| Unacceptable | Satisfactory | Inappropriate | INSUFFICIENT | 0.5 |
| Unacceptable | Satisfactory | Average | GOOD | 0.5 |
| Unacceptable | Satisfactory | Relevant | GOOD | 0.5 |
| Unacceptable | Unacceptable | Inappropriate | INSUFFICIENT | 0.5 |
| Unacceptable | Unacceptable | Average | INSUFFICIENT | 0.5 |
| Unacceptable | Unacceptable | Relevant | GOOD | 0.5 |
References
- Pezzini, M. Rural policy lessons from OECD countries. In Proceedings of the International Conference on European Rural Transport Policy at the Crossroads, Aberdeen, UK, 29 June–1 July 2000. [Google Scholar]
- Social Exclusion Unit. Making the Connections: Final Report on Transport and Social Exclusion; Social Exclusion Unit: London, UK, 2003. [Google Scholar]
- Brown, D.M.; Stommes, E.S. Public Transportation Challenges and Opportunities; Economic Research Service, USDA: Washington, DC, USA, 2004. [Google Scholar]
- Canadian Urban Transit Association. The Public Cares about Public Transit: VIP Makes an Impact; Canadian Transit Forum: Toronto, ON, Canada, 2002. [Google Scholar]
- Donnges, C. Rural Access and Employment: The Laos Experience; International Labour Office: Geneva, Switzerland, 1999. [Google Scholar]
- Allen, J.; O’Donnell, F.; Kavanagh, T.; Barron, S.; Daly, L.; O’Callaghan, E.; O’Briain, D. Report of the Interdepartmental Working Group on Rural Transport; Department of the Environment and Local Government of Republic of Ireland: Dublin, Ireland, 2001. [Google Scholar]
- Farrington, J.H. The new narrative of accessibility: its potential contribution to discourses in (transport) geography. J. Transp. Geogr. 2007, 15, 319–330. [Google Scholar] [CrossRef]
- Grieco, M.S. Transport and social exclusion: New policy grounds, new policy options. In Proceedings of the 10th International Conference on Travel Behaviour Research, Lucerne, Switzerland, 10–15 August 2003. [Google Scholar]
- Teigen, H. Car Dependence in Rural Norway—A Significant Problem for Sustainable Growth? Working Paper; University of Lillehammer: Lillehammer, Norway, 1996. [Google Scholar]
- Gray, D.; Farrington, J.; Shaw, J.; Martin, S.; Roberts, D. Car dependence in rural Scotland: Transport policy, devolution and the impact of the fuel duty escalator. J. Rural Stud. 2001, 17, 113–125. [Google Scholar] [CrossRef]
- Ambarwati, L.; Verhaeghe, R.; Pel, A.J.; Van Arem, B. Development of Public Transport System Strategies to Control Urban Sprawl. IACSIT Int. J. Eng. Technol. 2014, 6, 261–266. [Google Scholar] [CrossRef]
- Gulič, A. Mobilnost i Troškovi Stanovanja: Saznanja i Usmerenja Projekta MORECO. Naučno Stručni Skup Palić, 2015. Available online: http://moreco.uirs.si/LinkClick.aspx?fileticket=RJGvamBIV-c%3D&tabid=556 (accessed on 15 February 2018).
- Moore, T.; Pulidindi, J. Understanding Urban Transportation Systems; Center for Research and Innovation, National League of Cities: Washington, DC, USA, 2011. [Google Scholar]
- Litman, T. Evaluating Accessibility for Transportation Planning—Measuring People’s Ability to Reach Desired Goods and Activities; Victoria Transport Policy Institute: Victoria, BC, Canada, 2017. [Google Scholar]
- Simeunović, M. Modeliranje integracije transportne ponude u cilju povećanja saobraćajne pristupačnosti. Ph.D. Thesis, Fakultet tehničkih nauka Novi Sad, Univerzitet u Novom Sadu, Novi Sad, Serbia, 2012. [Google Scholar]
- Ranković-Plazinić, B. Održivo Planiranje Saobradaja za Ruralna Područja. Ph.D. Thesis, Saobraćajni Fakultet u Beogradu, Univerzitet u Beogradu, Belgrade, Serbia, 2015. [Google Scholar]
- Environmental Protection Agency. Supporting Sustainable Rural Communities. Partnership for Sustainable Communities—In collaboration with the U.S. Department of Agriculture, United States, 2011. Available online: https://www.epa.gov/sites/production/files/documents/2011_11_supporting-sustainable-rural-communities.pdf (accessed on 10 February 2018).
- U.S. Department of Agriculture Economic Research Service. Rural Population and Migration Briefing Room. 2015. Available online: http://www.ers.usda.gov/Briefing/Population/ (accessed on 30 January 2018).
- Department of Economic and Social Affairs. World Urbanization Prospects; United Nations: New York, NY, USA, 2014. [Google Scholar]
- United Nations Economic Commission for Europe. Sustainable Urban Mobility and Public Transport in Unece Capitals; United Nations: New York, NY, USA; Geneva, Switzerland, 2015. [Google Scholar]
- Creightney, C.D. Transport and Economic Performance: A Survey of Developing Countries; No. WORLD BANK TP-232; World Bank: Washington, DC, USA, 1993. [Google Scholar]
- Wegener, M.; Eskelinen, H.; Fürst, F.; Schürmann, C.; Spiekermann, K. Criteria for the Spatial Differentiation of the EU Territory: Geographical Position; Forschungen 102.2; Federal Office for Building and Regional Planning: Bonn, Germany, 2001. [Google Scholar]
- Department for Transport of United Kingdom. Towards a Sustainable Transport System: Supporting Economic Growth in a Low Carbon World; The Stationery Office: London, UK, 2007; Volume 7226. [Google Scholar]
- Litman, T. Evaluating Accessibility for Transportation Planning: Measuring People’s Ability to Reach Desired Goods and Activities; Victoria Transport Policy Institute: Victoria, BC, Canada, 2008. [Google Scholar]
- Rostami, S. Application of the Transport Needs Concept to Rural New South Wales: A GIS-Based Analysis. Ph.D. Thesis, University of New South Wales, Sidney, Australia, 2005. [Google Scholar]
- Serwadda-Luwaga, J.; Shabalala, N. Measuring Rural Poverty: Baseline Statistics for the Integrated Sustainable Rural Development Strategy; Statistics South Africa: Pretoria, South Africa, 2002. [Google Scholar]
- Sarkar, A.K.; Ghosh, D. Meeting the accessibility needs of rural poor. IASSI Q. 2000, 18, 1–5. [Google Scholar]
- Major of London. Assessing Transport Connectivity in London; Transport for London: London, UK, 2015. [Google Scholar]
- Litman, T. Measuring Transportation—Traffic, Mobility and Accessibility; Victoria Transport Policy Institute: Victoria, BC, Canada, 2011. [Google Scholar]
- Jeuring, R.; Lightfoot, G.; Sanfeliu, R.; Majano, A.; Prastacos, P.; Vanseveren, J.; Anderson, P.G. VIRGIL (Verifying and Strengthening Rural Access to Transport Services): Deliverable 1 Final Report for WP1—Overview of Best Practices in Rural Transport; ETT SA: Madrid, Spain, 2000. [Google Scholar]
- Joint Commitee on Arts, Sport, Tourism, Community, Rural and Gaeltacht Affairs; Report on Rural Transport Provision; Joint Commitee on Arts, Sport, Tourism, Community, Rural and Gaeltach Affairs: Dublin, Ireland, 2010; Available online: https://www.drugsandalcohol.ie/13060/ (accessed on 1 February 2018).
- Logan, P. Best practice demand-responsive transport (DRT) policy. Road Transp. Res. 2007, 16, 50–59. [Google Scholar]
- White, P. Equitable Access: Remote and Rural Communities’ Transport Needs’; Discussion Paper No. 2011-19; International Transport Forum on Transport for Society: Leipzig, Germany, 2011. [Google Scholar]
- Northern Ireland Statistics and Research Agency. Report of the Inter-Departmental Urban-Rural Definition Group: Statistical Classification and Delineation of Settlements; National Statistics Publication: Belfast, UK, 2005. [Google Scholar]
- Roy, J.; Pamučar, D.; Adhikary, K.; Kar, S. A rough strength relational DEMATEL model for analysing the key success factors of hospital service quality. Decis. Mak. Appl. Manag. Eng. 2018, 1, 121–142. [Google Scholar] [CrossRef]
- Badi, I.A.; Abdulshahed, A.M.; Shetwan, A.G. A case study of supplier selection for a steelmaking company in Libya by using the Combinative Distance-based ASsessment (CODAS) model. Decis. Mak. Appl. Manag. Eng. 2018, 1, 1–12. [Google Scholar] [CrossRef]
- Lukovac, V.; Popović, M. Fuzzy Delphi approach to defining a cycle for assessing the performance of military drivers. Decis. Mak. Appl. Manag. Eng. 2018, 1, 67–81. [Google Scholar] [CrossRef]
- Saaty, T.L.; Kearns, P.K. Analytical Planning, The Organization of Systems; The Analytic Hierarchy Process Series; RWS Publications: Pittsburgh, PN, USA, 1991; Volume IV. [Google Scholar]
- Chang, D.Y. Applications of the extent analysis method on fuzzy AHP. Eur. J. Oper. Res. 1996, 95, 649–655. [Google Scholar] [CrossRef]
- Srichetta, P.; Thurachon, W. Applying Fuzzy Analytic Hierarchy Process to Evaluate and Select Product of Notebook Computers. Int. J. Model. Optim. 2012, 2, 168–173. [Google Scholar] [CrossRef]
- Secretariat of Economy, Department of Statistics, City of NIŠ. Available online: http://privredanis.freeiz.com/Statistika.htm (accessed on 15 April 2018).
Figure 1.
Scheme of the methodology applied in the research.

Figure 2.
The appearance of the structure of the model to assess the impact of traffic accessibility.
Figure 2.
The appearance of the structure of the model to assess the impact of traffic accessibility.

Figure 3.
The functions of affiliation of fuzzy set A.

Figure 4.
The functions of affiliation of fuzzy set B.

Figure 5.
The functions of affiliation of fuzzy set C.

Figure 6.
The functions of affiliation of fuzzy set D.

Figure 7.
The functions of affiliation of fuzzy set E.

Figure 8.
The functions of affiliation of fuzzy set F.

Figure 9.
Scheme of urban and suburban traffic lines in Niš.

Figure 10.
Graphic representation of the assessment of traffic accessibility in suburban settlements.
Figure 10.
Graphic representation of the assessment of traffic accessibility in suburban settlements.

Figure 11.
The appearance of the output fuzzy variable in function of the input variables: (a) Network of access roads—network of PT lines; (b) Walking time—network of PT lines.
Figure 11.
The appearance of the output fuzzy variable in function of the input variables: (a) Network of access roads—network of PT lines; (b) Walking time—network of PT lines.

Figure 12.
The appearance of the output fuzzy variable in function of the input variables: (a) Walking time—network of access roads; (b) Network of PT lines—timetable.
Figure 12.
The appearance of the output fuzzy variable in function of the input variables: (a) Walking time—network of access roads; (b) Network of PT lines—timetable.

Figure 13.
The appearance of the output fuzzy variable in function of the input variables: (a) Walking time—timetable; (b) Driving time—timetable.
Figure 13.
The appearance of the output fuzzy variable in function of the input variables: (a) Walking time—timetable; (b) Driving time—timetable.

Figure 14.
The appearance of the output fuzzy variable in function of the input variables: (a) Driving time—network of access roads; (b) Driving time—network of PT lines.
Figure 14.
The appearance of the output fuzzy variable in function of the input variables: (a) Driving time—network of access roads; (b) Driving time—network of PT lines.

Table 1.
Impact criteria of traffic accessibility on suburb development.
| Criteria | Sub-Criteria |
|---|---|
| Transport | Network of PT lines |
| Remoteness of the railway | |
| Characteristics of the settlement | |
| Possession of a car in the household | |
| Space | Built infrastructure |
| Network of access roads | |
| Remoteness from the most significant contents | |
| Quality of service | Comfort in a vehicle |
| Travel time | |
| Transfer points | |
| System quality | Timetable |
| Transport costs | |
| Tariff system |
Table 2.
Linguistic scale of significance [40].
Table 2.
Linguistic scale of significance [40].
| Linguistic Scale | TFNs | Reciprocal TFNs |
|---|---|---|
| Equally important | (1, 1, 1) | (1, 1, 1) |
| Weakly more important | (1/2, 1, 3/2) | (2/3, 1, 2) |
| Strong more important | (3/2, 2, 5/2) | (2/5, 1/2, 2/3) |
| Very strong more important | (5/2, 3, 7/2) | (2/7, 1/3, 2/5) |
| Absolutely more important | (7/2, 4, 9/2) | (2/9, 1/4, 2/7) |
Table 3.
Assessment of the impact of the traffic accessibility of suburban settlements.
| Settlements | Network of PT Lines | Network Access Roads | Walking Time (min) | Driving Time (min) | Timetable (No. of Departures) | Assessment of the Impact of Traffic Accessibility | ||
|---|---|---|---|---|---|---|---|---|
| 5 min | 10 min | 15 min | ||||||
| Trupale | 2 | 4 | 5/10/15 | 29 | 24 | 8.57 | 6.39 | 5.75 |
| Vrtište | 1 | 3 | 5/10/15 | 33 | 18 | 5.93 | 5.75 | 3.07 |
| Mezgraja | 2 | 4 | 5/10/15 | 31 | 16 | 8.55 | 6.27 | 5.75 |
| Gornja Toponica | 4 | 2 | 5/10/15 | 32 | 28 | 6.03 | 5.75 | 3.27 |
| Donja Toponica | 1 | 2 | 5/10/15 | 33 | 9 | 3.46 | 2.88 | 2.64 |
| Hum | 2 | 3 | 5/10/15 | 20 | 20 | 8.64 | 8.58 | 5.75 |
| Rujnik | 1 | 2 | 5/10/15 | 30 | 10 | 4.42 | 3.41 | 2.67 |
| Kamenica | 2 | 3 | 5/10/15 | 21 | 17 | 8.61 | 8.1 | 5.75 |
| Brenica | 2 | 2 | 5/10/15 | 25 | 17 | 7.06 | 5.75 | 4.72 |
| Gornji Matejevac | 1 | 2 | 5/10/15 | 29 | 22 | 5.75 | 3.88 | 2.69 |
| Knez Selo | 1 | 2 | 5/10/15 | 34 | 22 | 5.75 | 2.87 | 2.67 |
| Gornja Vrežina | 1 | 2 | 5/10/15 | 28 | 21 | 5.75 | 4.09 | 2.69 |
| Malča | 2 | 2 | 5/10/15 | 36 | 14 | 5.75 | 5.52 | 2.68 |
| Ostrovica | 2 | 2 | 5/10/15 | 46 | 11 | 5.75 | 3.6 | 2.65 |
| Gornja Studena | 1 | 1 | 5/10/15 | 50 | 16 | 4.38 | 2.68 | 2.67 |
| Prva Kutina | 1 | 2 | 5/10/15 | 31 | 10 | 4.25 | 3.29 | 2.67 |
| Gabrovac | 3 | 1 | 5/10/15 | 27 | 16 | 6.64 | 5.75 | 4.25 |
| Vukmanovo | 1 | 1 | 5/10/15 | 36 | 13 | 5.54 | 2.67 | 2.61 |
| Berbatovo | 1 | 1 | 5/10/15 | 36 | 13 | 5.54 | 2.67 | 2.61 |
| Gornje Međurovo | 1 | 2 | 5/10/15 | 24 | 10 | 4.98 | 3.97 | 2.67 |
| Mramorski potok | 1 | 1 | 5/10/15 | 38 | 11 | 4.85 | 2.69 | 2.65 |
| Krušce | 1 | 2 | 5/10/15 | 25 | 13 | 5.75 | 4.72 | 2.69 |
| Lalinac | 1 | 3 | 5/10/15 | 25 | 17 | 7.06 | 5.75 | 4.72 |
© 2018 by the authors. Licensee MDPI, Basel, Switzerland. This article is an open access article distributed under the terms and conditions of the Creative Commons Attribution (CC BY) license (http://creativecommons.org/licenses/by/4.0/).
Share and Cite
MDPI and ACS Style
Stanković, M.; Gladović, P.; Popović, V.; Lukovac, V. Selection Criteria and Assessment of the Impact of Traffic Accessibility on the Development of Suburbs. Sustainability 2018, 10, 1977. https://doi.org/10.3390/su10061977
AMA Style
Stanković M, Gladović P, Popović V, Lukovac V. Selection Criteria and Assessment of the Impact of Traffic Accessibility on the Development of Suburbs. Sustainability. 2018; 10(6):1977. https://doi.org/10.3390/su10061977
Chicago/Turabian StyleStanković, Milan, Pavle Gladović, Vladimir Popović, and Vesko Lukovac. 2018. "Selection Criteria and Assessment of the Impact of Traffic Accessibility on the Development of Suburbs" Sustainability 10, no. 6: 1977. https://doi.org/10.3390/su10061977
Note that from the first issue of 2016, this journal uses article numbers instead of page numbers. See further details here.