Article

Estimation of State of Charge for Two Types of Lithium-Ion Batteries by Nonlinear Predictive Filter for Electric Vehicles

1
National Engineering Laboratory for the Automotive Electronic Control Technology, Shanghai Jiao Tong University, 800 Dongchuan Rd., Shanghai 200240, China
2
University of Michigan-Shanghai Jiao Tong University Joint Institute, Shanghai Jiao Tong University, 800 Dongchuan Rd., Shanghai 200240, China
*
Author to whom correspondence should be addressed.
Energies 2015, 8(5), 3556-3577; https://doi.org/10.3390/en8053556
Submission received: 13 January 2015 / Revised: 3 April 2015 / Accepted: 20 April 2015 / Published: 28 April 2015
(This article belongs to the Special Issue Electrical Power and Energy Systems for Transportation Applications)

Abstract

:
Estimation of state of charge (SOC) is of great importance for lithium-ion (Li-ion) batteries used in electric vehicles. This paper presents a state of charge estimation method using nonlinear predictive filter (NPF) and evaluates the proposed method on the lithium-ion batteries with different chemistries. Contrary to most conventional filters which usually assume a zero mean white Gaussian process noise, the advantage of NPF is that the process noise in NPF is treated as an unknown model error and determined as a part of the solution without any prior assumption, and it can take any statistical distribution form, which improves the estimation accuracy. In consideration of the model accuracy and computational complexity, a first-order equivalent circuit model is applied to characterize the battery behavior. The experimental test is conducted on the LiCoO2 and LiFePO4 battery cells to validate the proposed method. The results show that the NPF method is able to accurately estimate the battery SOC and has good robust performance to the different initial states for both cells. Furthermore, the comparison study between NPF and well-established extended Kalman filter for battery SOC estimation indicates that the proposed NPF method has better estimation accuracy and converges faster.

1. Introduction

Global warming, the petroleum crisis, and legislation pushing for higher fuel economy and lower emissions, are leading to the development of electric vehicles (EVs) [1,2]. As the key component of any electric vehicle, the energy storage system attracts more and more attention. A variety of electrochemical energy storage devices are currently used in EV applications, such as lithium-ion (Li-ion) battery, nickel metal hydride (NiMH) battery, lead acid (LA) battery, and ultracapacitor (UC). Among them, Li-ion batteries are viewed as the most promising energy storage units for EVs, for its high energy density, high power density, low self-discharging rate, and long lifespan [3,4].
However, strict requirements should be satisfied when using Li-ion batteries, and a battery management system (BMS) is required to provide the functions of monitoring, estimation, and protection to ensure the safe operations of Li-ion batteries. The state of charge (SOC), acting the similar role as the fuel meter for the internal combustion engine system, is the most important factor for batteries which should be accurately estimated by the BMS. The battery SOC indicates the residual capacity of the battery system and has significant importance in predicting the remaining driving range of EVs. Besides, accurate SOC estimation can also prevent the batteries from over-charging and over-discharging conditions and thus can extend the battery cycle life [5]. However, since the battery SOC cannot be directly measured and it is affected by many factors, such as current, temperature and battery age, estimation of the battery SOC is still a challenging problem that needs to be solved.
A number of SOC estimation methods have been proposed. Each method has its own advantages and limitations. Generally, these methods can be mainly classified into two kinds: (1) direct measurement based estimation and (2) model based estimation. The first kind of method directly uses the measurements from battery system to calculate the SOC, such as current integration method [6], open circuit voltage (OCV) based method [7]. The current integration method is easy to implement with low computation, but it suffers from the low estimation accuracy due to the accumulative errors caused by current sensor noises. In addition, it is also difficult to obtain the initial SOC when using the current integration method. Therefore, the open circuit voltage method is usually used complementarily with the current integration method to recalibrate the SOC and to provide the initial SOC. However, a long rest time of the tested battery is required to reach the open circuit voltage, which is usually unrealistic for real world applications.
In the second kind of method, the battery model is utilized when estimating the battery SOC. One of the model based methods for SOC estimation is based on the black-box battery models, such as neural networks (NN) [8], fuzzy logic (FL) [9], and support vector machine (SVM) [10]. Eddahech et al. [8] developed a recurrent neural network as a SOC predictor that takes into account operational conditions, the results show that the predictor allows very precise SOC estimation. Salkind et al. [9] utilized the fuzzy logic to estimate the battery SOC by using the training datasets obtained by impedance spectroscopy and coulomb counting techniques. Anton et al. introduced a support vector machine based SOC estimator for a high-capacity lithium iron manganese phosphate (LiFeMnPO4) battery cell, using cell current, cell voltage, and cell temperature as independent variables. The results show that the SVM SOC estimator maintains a high level of accuracy. According to the literatures, the black-box model based methods can be quite accurate if sufficient experimental data is used to train the model. However, their performance highly depends on the quantity and quality of the training data set, a large amount of offline battery tests are necessary to obtain a good model which can be very time-consuming. Optimum state filtering method is another kind of model based method for battery SOC estimation. This method usually performs SOC estimation based on an equivalent circuit battery model [11,12]. Many different state filtering methods have been investigated, such as extended Kalman filter (EKF) [13,14,15], sigma point Kalman filter (SPKF) [16,17,18], adaptive extended Kalman filter (AEKF) [19], adaptive unscented Kalman filter (AUKF) [20], particle filter (PF) [21] and others [22,23,24,25,26]. Plett [13,14,15,16,17] established the EKF and UKF based SOC estimation methods using different orders of equivalent circuit battery models for simultaneous state and parameters estimation of LiPB packs. Both of them obtained very good results, and the methods were robust to different initial states. Han et al. adopt the AEKF method for SOC estimation by adaptively updating the process and measurement noise covariance which improved the estimation accuracy. Similarly, Hu et al. applied the AUKF for SOC estimation. All of the Kalman filter (KF) based methods achieve very good estimation performance because of online state error correction capability. However, there are some shortcomings for KF based methods. For instance, the statistic distribution of the process noise is assumed to be the zero mean white Gaussian process and prior knowledge of the noise covariance should be known before estimating the battery SOC. In fact, it is difficult to obtain the accurate information of the process noises for real world applications, and the filter performance will decrease or even diverge with inaccurate noise information. Besides, the assumption of the zero-mean Gaussian process noises usually cannot be met in practice which can decrease the estimation accuracy [27]. PF is another optimum state filtering methodology for SOC estimation [21]. It is able to represent any probability density function for the state by using Monte Carlo sampling methods which improves the estimation accuracy. However, the computational effort is high for PF due to the large amount of particles which makes it difficult to apply for real-world applications.
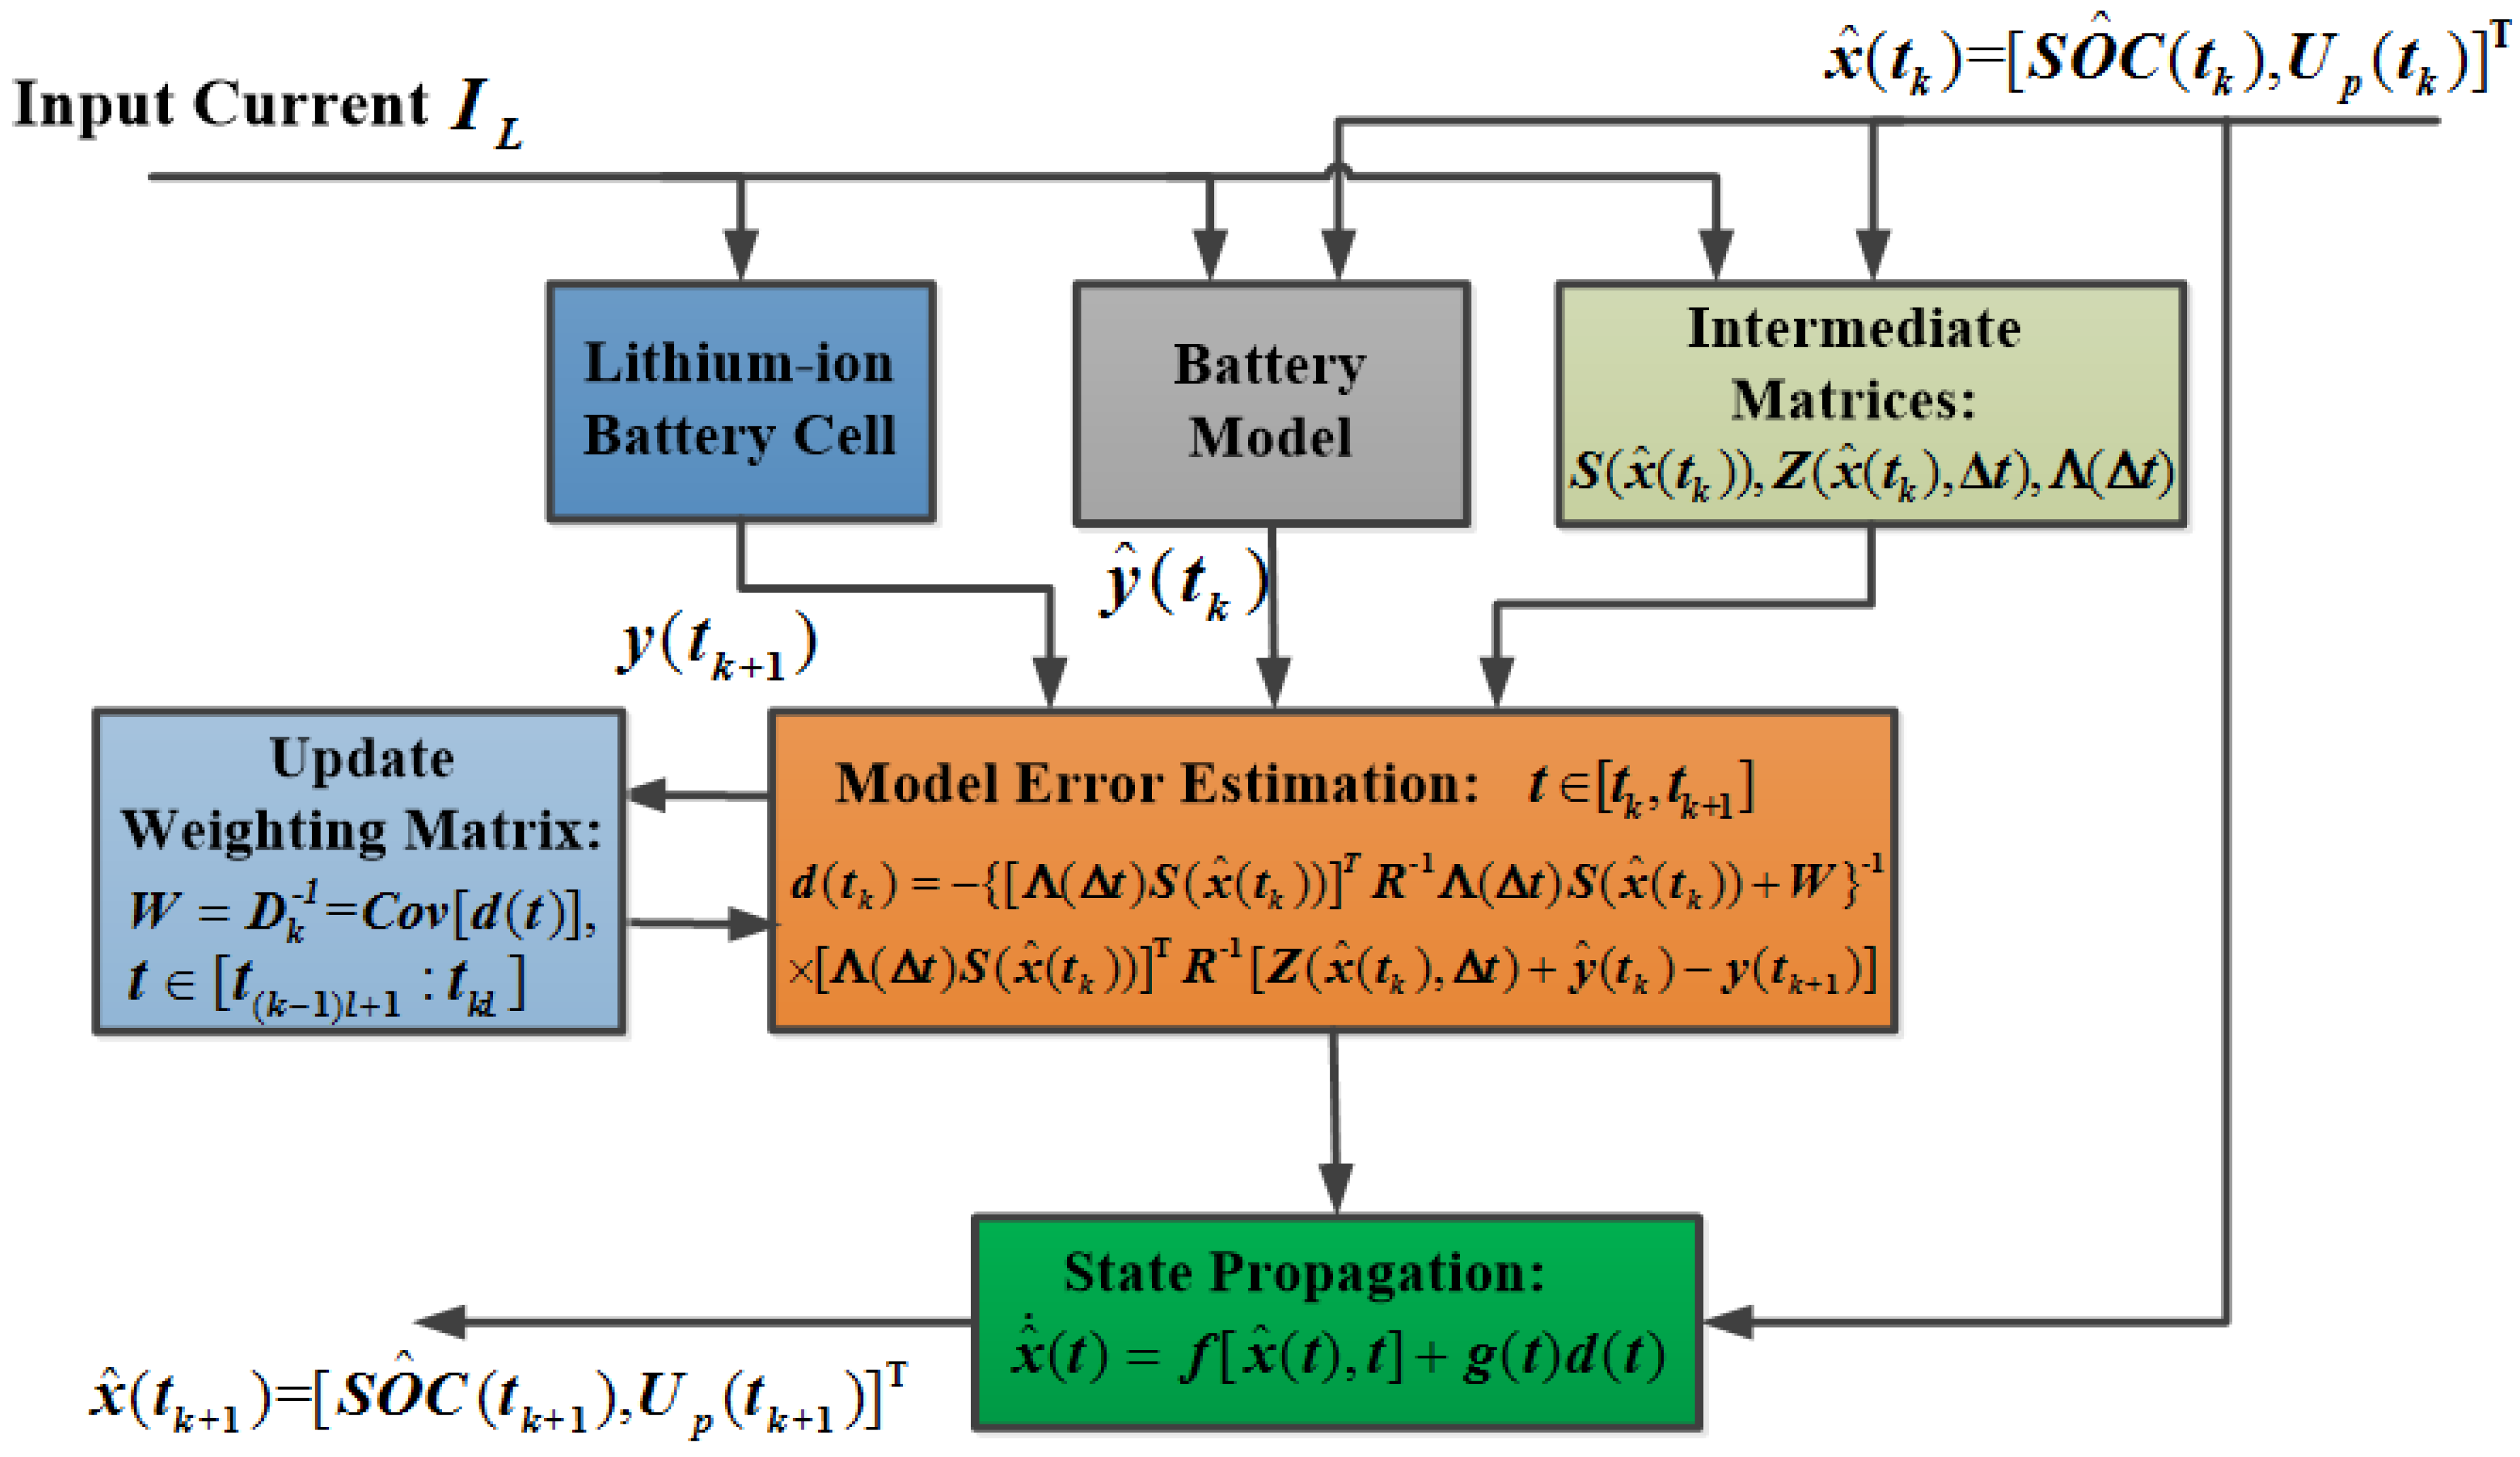
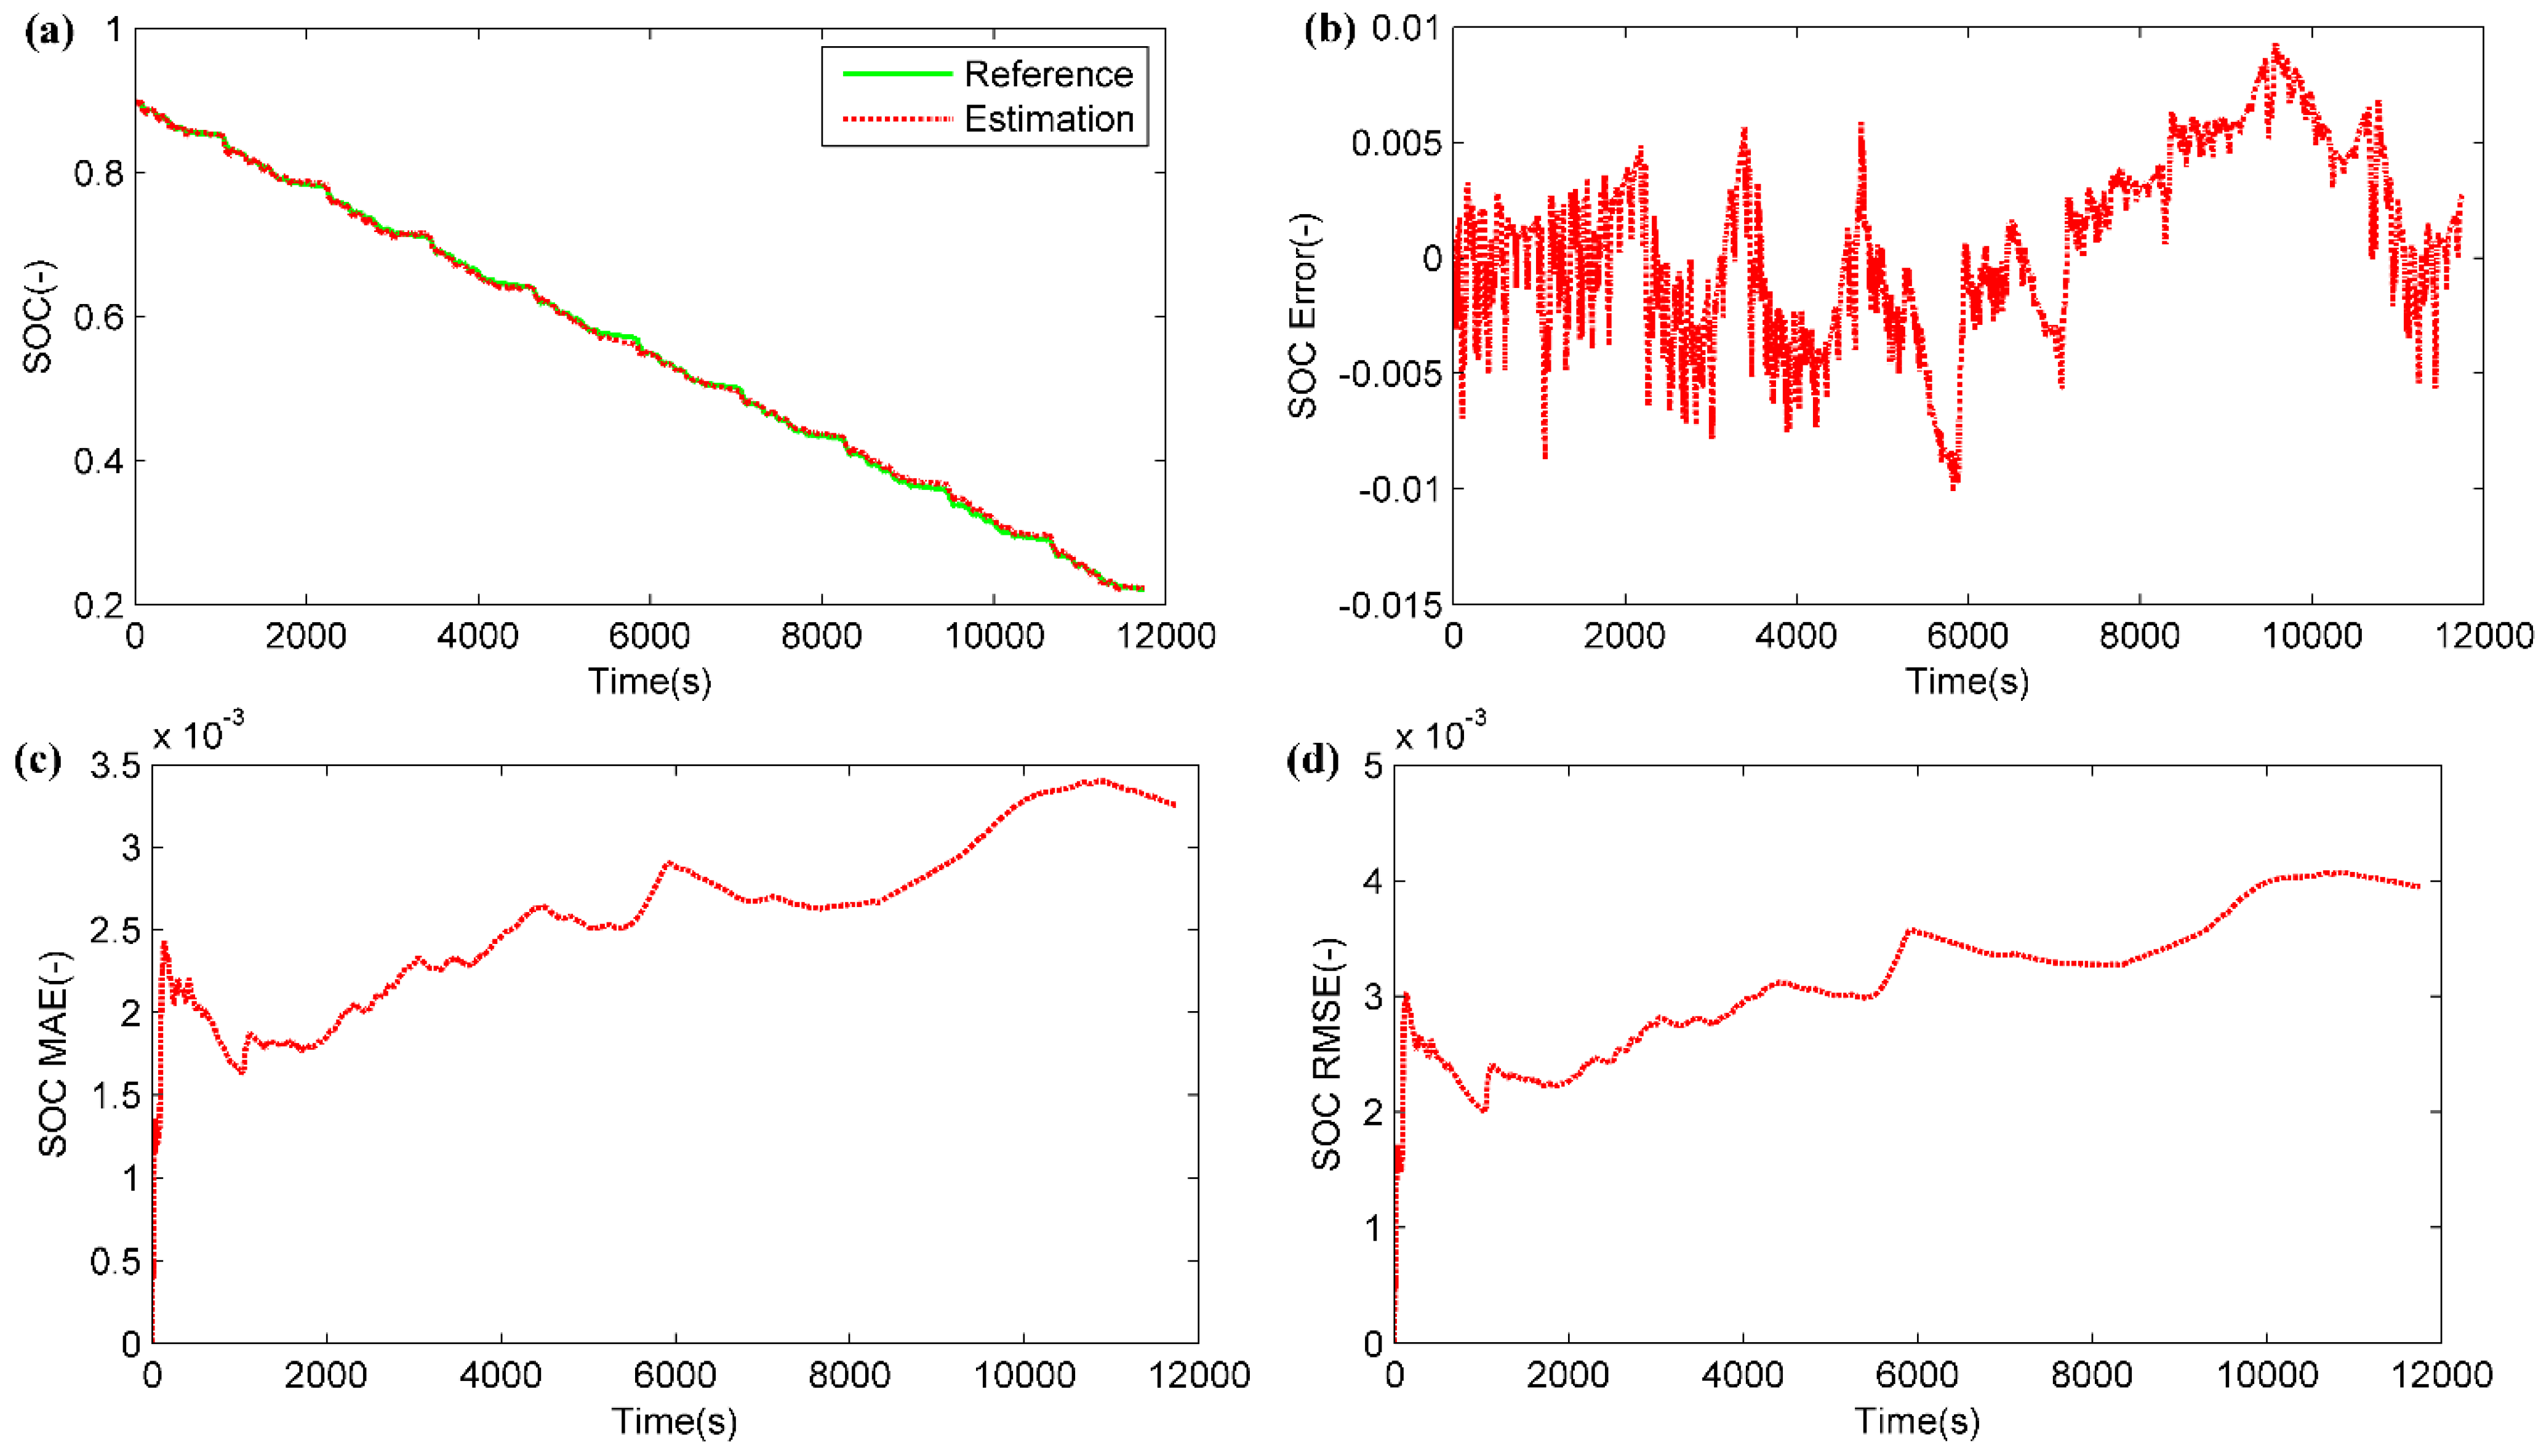
In this paper, the nonlinear predictive filter (NPF) is proposed to estimate the SOC of Li-ion batteries and the proposed method is evaluated on the battery cells with different chemistries. The NPF method was firstly proposed by Crassidis et al., for spacecraft attitude estimation and obtained satisfactory results [28]. It is a nonlinear optimum state estimation method implemented on continuous-discrete time systems, which is particularly suitable for battery systems [29]. In the NPF method, the nonlinear dynamic system is treated as a preliminary model with a to-be-determined model error part, where the preliminary model describes the system dynamic and the model error mainly represents the system process noise. The significant advantage of NPF method is that the process noise is treated as an unknown model error determined as a part of the solution, and it is able to represent any distribution form. Compared to the aforementioned direct measurement based estimation method, the NPF method can provide more accurate results with better robust performance of initial values due to its capability of correcting the state error online. In comparison with black-box model based method, the large amount of training data sets is not required for NPF method which saves the computational effort. The KF based method usually assumes a zero mean white Gaussian process noise and requires the prior knowledge. In contrary, the process noise in NPF can be any type without any restricting pre-assumptions. Therefore, the NPF based SOC estimation method has better estimation performance and is more practical for real-world applications. Compared to the PF method, the NPF method has lower computation, since a large number of particles needs to be used and numerous matrix operations are required for PF method which greatly increase the requirements for hardware system. Additionally, the aforementioned literatures mainly perform their methods on one type of batteries; the robustness performance of different battery types is not discussed. In this study, the NPF method is performed on LiCoO2 (LCO) and LiFePO
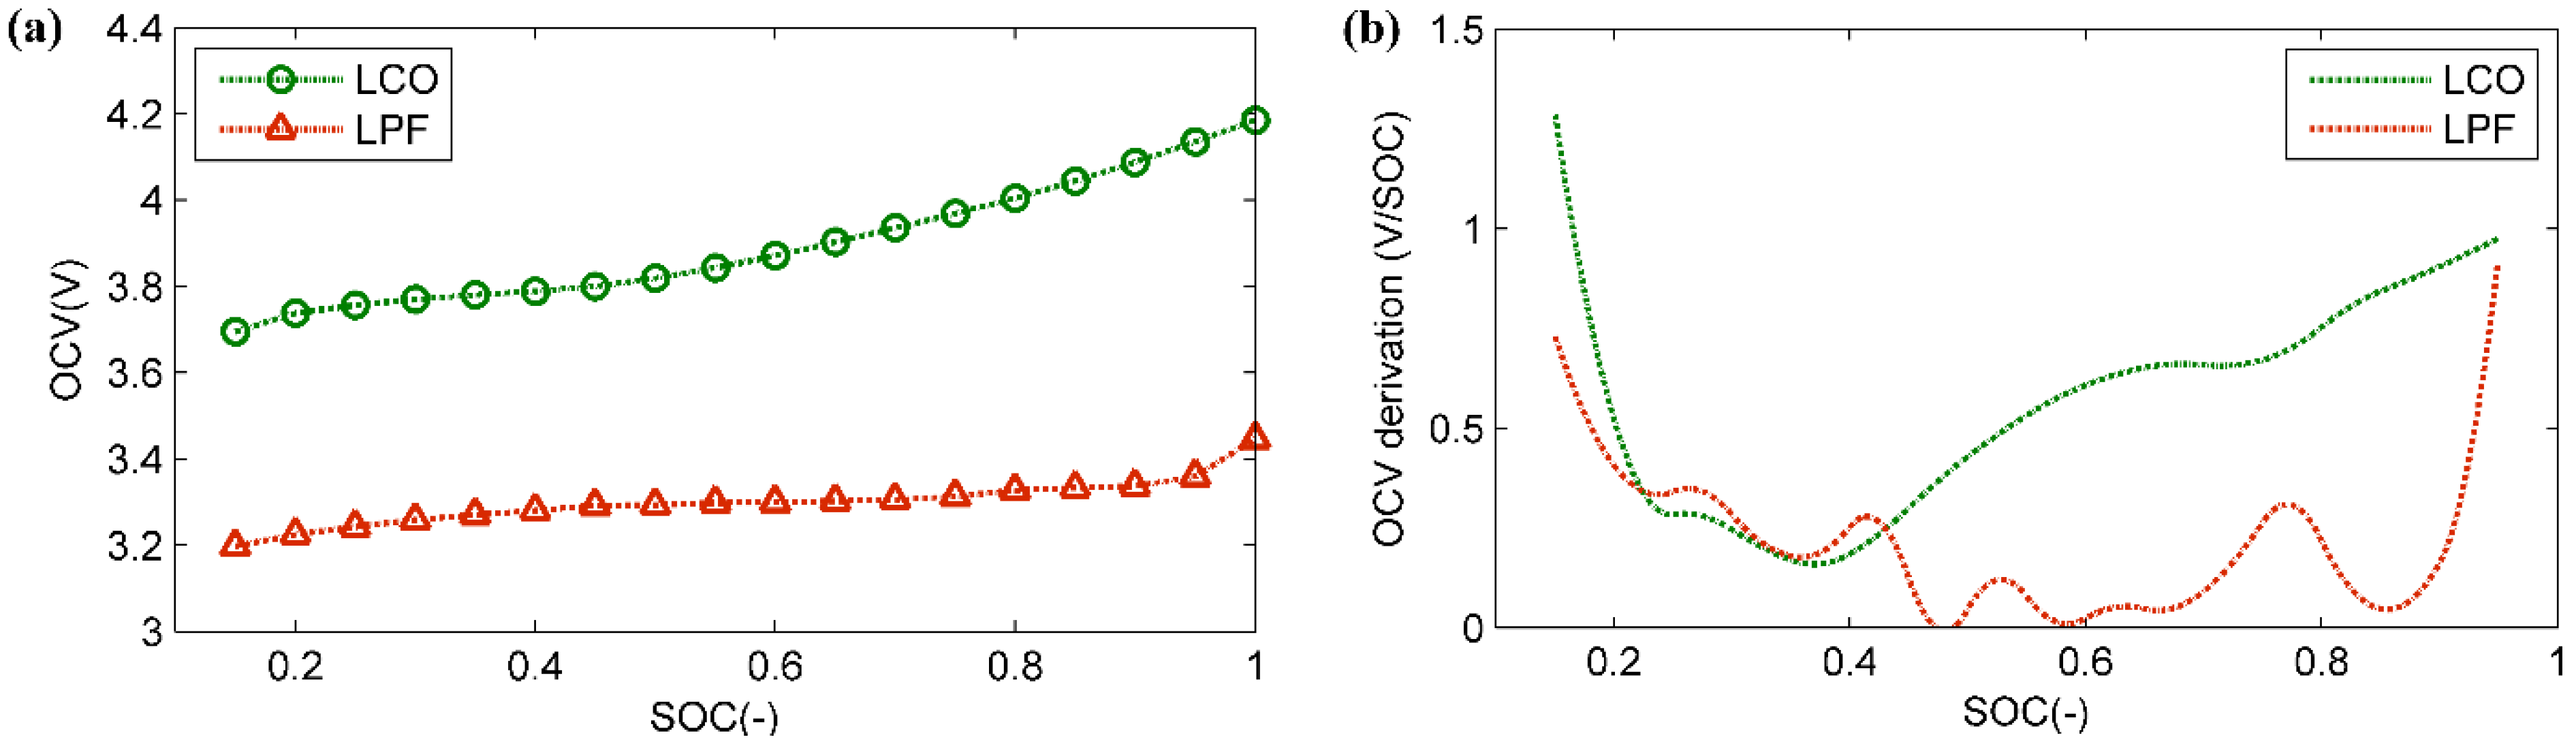
4 (LFP) battery cells, the experimental results show that the NPF based method can accurately estimate the battery SOC with good robustness to different initial values. Meanwhile, the estimation result of LFP battery suffers from a lower accuracy than that of LCO battery due to the characteristics of the flat open circuit voltage. Furthermore, the comparison study between NPF and EKF with the same experimental conditions indicates that the proposed NPF method has better estimation accuracy and faster convergence rate.
The rest of the paper is organized as follows. In Section 2, a first-order equivalent circuit battery model is introduced. The description for SOC estimation of the Li-ion battery cell using NPF is presented in Section 3. In Section 4, the estimation results are analyzed and discussed to verify the proposed method. Finally, the conclusion is provided in Section 5.

2. Battery Model

2.1. Model Structure

In order to apply NPF for SOC estimation, a suitable battery model is required to characterize the electrochemical properties of Li-ion batteries, including: ohmic resistance, charge transfer and diffusion. Different types of battery models have been proposed in the literature. Among them, the equivalent circuit models (ECMs) are the most commonly used ones for battery state estimation. The ECMs capture the battery input-output dynamics through electrical circuit elements, such as resistor, capacitor and voltage source, and can be easily used for model based estimation. Hu et al. introduced a comprehensive study for different types of ECMs, and their results indicate that the first-order ECM achieves an excellent compromise between accuracy and complexity [30]. Therefore, as shown in Figure 1, a first-order ECM composed of an open circuit voltage (OCV) source, a resistor, and an RC network, is used in this study. The resistor represents the electrical resistance of battery components with the accumulation and dissipation of charge in the electrical double-layer. The RC network describes the charge transfer and diffusion effect, and the voltage source indicates the battery’s open circuit voltage which is a function of the battery SOC.
Figure 1. Schematic diagram of the first-order battery model.
Energies 08 03556 g001
The SOC definition for the Li-ion battery is formulated as:
S O C ( t ) = S O C ( 0 ) + 0 t η I L ( t ) d t C n
where S O C ( 0 ) is the initial SOC value, S O C ( t ) is the battery SOC at time t, η is the Coulombic efficiency (in this paper η is assumed as 1), I L is the input current (positive for charge, negative for discharge) and C n is the nominal capacity.
Equations (2) and (3) describe the electrical behavior of the Li-ion battery:
U ˙ p ( t ) = ( R p C p ) 1 U p ( t ) + C p 1 I L ( t )
U t ( t ) = U o c ( S O C ( t ) ) + U p + I L ( t ) R s
where U p is the polarization voltage, R p and C p are the polarization resistance and capacitance, respectively, U t is the battery terminal voltage, and R s is the ohmic resistance.
A spline function is employed to describe the relationship between the battery open circuit voltage U o c and battery SOC, given by Equation (4):
U o c ( t ) = S p l i n e ( S O C ( t ) )

2.2. Model Parameter Identification

2.2.1. Experimental Setup

In this work, two different types of battery cells, LiCoO2 (LCO) and LiFePO4 (LFP), are tested. The standard specifications of the tested cells are listed in Table 1 and Table 2. The schematic diagram of the battery test bench is shown in Figure 2. It consists of a Takasago ZX-800LA electric power, a Kikusui PLZ150U electric load, a NI cDAQ-9174 data acquisition system, a host PC, and a thermal chamber. The ZX-800LA electric power can charge the battery cell with the maximum current of 80A at the maximum voltage of 84V, while the PLZ150U electric load is able to provide the maximum discharge current of 30A with the maximum voltage of 150V. The electric power and load are remotely controlled by the host PC to determine the charge/discharge power load of the tested battery cell. The data acquisition system with a sampling rate of 10 Hz is used to capture the current, voltage, and temperature of the tested battery and to transfer the obtained data to the host PC.
Figure 2. Schematic of battery test bench.
Energies 08 03556 g002
Table 1. Battery cell (LCO) specification.
ItemSpecification
Cell Dimensions (mm)Ø 18 × 69
Cell Weight (g)48.2
Cell Capacity (nominal, Ah)2.6
Cell Voltage (nominal, V)3.7
Gravimetric Energy Density (nominal, Wh/kg)180
Volumetric Energy Density (nominal, Wh/L)464
Operating Temperature−20 °C to 60 °C
Table 2. Battery cell (LFP) specification.
ItemSpecification
Cell Dimensions (mm)Ø 32 × 113
Cell Weight (g)205
Cell Capacity (nominal, Ah)4.5
Cell Voltage (nominal, V)3.3
Gravimetric Energy Density (nominal, Wh/kg)71
Volumetric Energy Density (nominal, Wh/L)161
Operating Temperature−30 °C to 55 °C

2.2.2. Parameter Identification

For the first-order battery model, the values of the model parameters as well as the SOC-OCV relationship need to be identified. A series of battery tests, including: capacity test, pulse current test, and open circuit voltage test, are conducted to extract these parameters. The content of these tests are described as follows:
(1)
Capacity test: The capacity test discharges the battery cell from the fully charged state (upper-limit voltage) to the fully discharged state (lower-limit voltage) with 0.5 C rate, and the cell capacity is referred as the total Ampere-hours drained out of the battery during the test. The cut-off voltages used during the test for LCO battery are Vmax = 4.2 V, Vmin = 2.8 V, and the cut-off voltages for LFP battery are Vmax = 3.6 V, Vmin = 2 V. The experimental results of the capacities for the tested LCO and LFP cells are 2.62 Ah and 4.29 Ah, respectively.
(2)
Pulse current test: To identify the values of the electrical circuit elements in the first-order ECM, a pulse current test is conducted on the battery cells at 10% SOC intervals starting from 0.9 to 0.3. During the test, the environment temperature is controlled at 25 °C. The detailed test procedure can be found in [31]. In this study, the time period between two current pluses, when no current is applied, is used for parameters identification. The current and voltage profiles during this time period are shown in Figure 3. The ohmic resistance R s can be expressed as:
R s = U s I L
where U s is the instantaneous voltage response within one second, and I L is the current before the rest time period. The polarization voltage U t at time t can be expressed by:
U t = U p ( 1 e t R p C p ) , U p = R p I L
where U p is the maximum polarization voltage during the rest time period. The polarization resistance and capacitance can be identified by minimizing the difference between the model output and voltage measurement using the nonlinear least square method. The identification results of R s , R p , C p for LCO and LFP cells are shown in Figure 4. It can be seen that the parameters vary at different battery SOC points. However, to reduce the complexity of the battery model, R s , R p , C p at different SOC points are averaged to obtain the final model parameters and the results are shown in Table 3.
Figure 3. Voltage profile during the rest time period.
Energies 08 03556 g003
Figure 4. Parameters identification results: (a) Rs results of LiCoO2 (LCO) cell; (b) Rp results of LCO cell; (c) Cp results of LCO cells; (d) Rs results of LiFePO4 (LFP) cell; (e) Rp results of LFP cell; (f) Cp results of LFP cells.
Energies 08 03556 g004
(3)
Open circuit voltage test: To calibrate the nonlinear SOC-OCV relationship, an open circuit voltage test is conducted as follows. The battery cell is discharged using 0.5 C constant current at 5% SOC interval from 100% SOC to 15% SOC. After each discharge period, the battery cell is rested for 3 hours to reach the close-to-equilibrium open-circuit potential for each SOC point. A similar procedure is conducted to get the SOC-OCV curve under the battery charge condition. Since the possible hysteresis voltage is neglected in this paper, the SOC-OCV relationship for the battery model is defined as the average of the equilibrium potentials of charging and discharging. The experimental results of the SOC-OCV curves for LCO and LFP battery cells are shown in Figure 5.
Figure 5. SOC-OCV curves: (a) LCO battery cell; (b) LFP battery cell.
Energies 08 03556 g005
Table 3. Model parameters.
LCO Battery Cell
Model parameters R s ( Ω ) R p ( Ω ) C p ( F ) C n ( A h )
Values0.1870.04619692.62
LFP battery cell
Model parameters R s ( Ω ) R p ( Ω ) C p ( F ) C n ( A h )
Values0.00480.002911864.29

2.3. Model Validation

In order to validate the battery models with identified parameters for LCO and LFP battery cells, the experimental test using Urban Dynamometer Driving Schedule (UDDS) driving cycle is conducted. UDDS is usually used for light duty vehicle testing under the city driving condition [32]. Therefore, the UDDS driving cycle is adopted in this study to simulate the battery dynamics under a realistic EV scenario. The model validation results for LCO and LFP battery cells are shown in Figure 6 and Figure 7. Figure 6a,b shows the comparison profiles of the estimated terminal voltage and measured terminal voltage for LCO battery cell. Figure 6c shows the corresponding voltage error and it can be seen that the maximum model error is around 0.02 V. Figure 6d shows the root mean squared error (RMSE) of the terminal voltage, which is less than 0.007 V. Similar results for LFP battery cell are shown in Figure 7. The maximum model error is within 0.01 V for LFP battery cell, while the RMSE is less than 0.004 V. According to the results, it can be concluded that the first order battery model is able to accurately capture the dynamic behavior of both Li-ion battery cells.
Figure 6. Model validation results of LCO cell: (a) Comparison of model output voltage and measured voltage; (b) Zoom plot; (c) Voltage error; (d) RMSE of voltage error.
Energies 08 03556 g006
Figure 7. Model validation results of LFP cell: (a) Comparison of model output voltage and measured voltage; (b) Zoom plot; (c) Voltage error; (d) RMSE of voltage error.
Energies 08 03556 g007

3. Nonlinear Predictive Filter for SOC Estimation

In this section, the description of nonlinear predictive filter (NPF) is firstly introduced. Then, the NPF based SOC estimation using the first-order battery model is presented.

3.1. Nonlinear Predictive Filter

Nonlinear predictive filter (NPF) is a model based state estimation method implemented with nonlinear continuous-discrete time system. The state and measurement equations in NPF are given by Equations (7) and (8):
x ˙ ( t ) = f [ x ( t ) , t ] + g ( t ) d ( t )
y ( t k ) = h [ x ( t k ) , t k ] + v ( t k )
where x ( t ) is the state vector which needs to be estimated, f is system dynamic function, d ( t ) is the model error which mainly represents the process noise and g ( t ) is the model error distribution matrix. y ( t k ) is the system output sampled at time step tk, h is the system measurement function, v is the measurement noise which is assumed to be an independent zero mean Gaussian white noise with:
E [ v ( t k ) ] = 0 , E [ v ( t k ) v ( t k ' ) T ] = R δ k k '
where R is a positive-definite covariance matrix.
In order to estimate the system states, the model error d ( t ) needs be obtained at every time step. A cost function consisting of the weighted sum square of the measurement-minus-estimate residuals plus the weighted sum square of the model correction term is established in order to get the mathematical expression of d ( t ) , as defined in Equaton (10):
J [ d ( t ) ] = 0.5 [ y ( t + Δ t ) y ^ ( t + Δ t ) ] T R 1 [ y ( t + Δ t ) y ^ ( t + Δ t ) ] + 0.5 d ( t ) T W d ( t )
where y ( t ) = y ( t k ) , y ( t + Δ t ) = y ( t k + 1 ) , ∆t is the sampling interval, W is a positive semi-definite weighting matrix. A first-order Taylor expansion is used to approximate y ^ ( t + Δ t ) , given in Equation (11):
y ^ ( t + Δ t ) = y ^ ( t ) + Δ t y ^ ˙ ( t ) + 0.5 Δ t 2 y ^ ¨ ( t ) + y ^ ( t ) + Z ( x ^ ( t ) , Δ t ) + Λ ( Δ t ) S ( x ^ ( t ) ) d ( t )
The solution of d ( t ) is derived by minimizing the cost function J [ d ( t ) ] , given in Equation (12):
d ( t ) = { [ Λ ( Δ t ) S ( x ^ ( t ) ) ] T R 1 Λ ( Δ t ) S ( x ^ ( t ) ) + W } 1 × [ Λ ( Δ t ) S ( x ^ ( t ) ) ] T R 1 [ Z ( x ^ ( t ) , Δ t ) + y ^ ( t ) y ( t + Δ t ) ]
where S ( x ^ ( t k ) ) , Z ( x ^ ( t k ) , Δ t ) , Λ ( Δ t ) are intermediate matrices, given as follows:
S ( x ^ ( t ) ) = [ L g 1 L f r 1 1 h 1 ( x ^ ( t ) ) L g l L f r 1 1 h 1 ( x ^ ( t ) ) L g 1 L f r m 1 h m ( x ^ ( t ) ) L g l L f r m 1 h m ( x ^ ( t ) ) ]
Λ ( Δ t ) = [ λ 11 0 λ i i 0 λ m m ] , λ i i = Δ t r i r i ! , i = 1 , 2 , m
Z i ( x ^ ( t ) , Δ t ) = a = 1 r i Δ t a a ! L f a h i ( x ^ ( t ) ) , i = 1 , 2 , , m
Here, L g j L f r i 1 h i ( x ^ ( t ) ) is the Lie derivation, defined as:
L f 0 h i ( x ^ ( t ) ) = h i ( x ^ ( t ) )
L f n h i ( x ^ ( t ) ) = L f n 1 h i ( x ^ ( t ) ) x ^ f [ x ^ ( t ) , t ]
L g j L f n h i ( x ^ ( t ) ) = L f n h i ( x ^ ( t ) ) x ^ g j ( t )
The index ri is the relative degree, which satisfies the following two constrained equations:
L g j L f n i h i ( x ^ ( t ) ) = 0 ( i = 1 , 2 , m ; j = 1 , 2 , , l , n i < r i 1 )
L g j L f r i 1 h i ( x ^ ( t ) ) 0 ( i = 1 , 2 , m ; j = 1 , 2 , , l )
Therefore, based on the measurement processed at time t k + 1 , the new d ( t ) in [ t k : t k + 1 ] can be found. After that, the state estimates are propagated to time t k + 1 .
The weighting matrix W in Equation (10) is derived as the inverse of the model error’s covariance matrix D, given as follows:
W = D - 1 = C o v [ d ( t ) ] - 1 = E [ ( d ( t ) E [ d ( t ) ] ) ( d ( t ) E [ d ( t ) ] ) T ] - 1
Assume that d ( t ) is a stationary ergodic random process, then the covariance matrix D of the model error can be iteratively derived with a certain time interval; the steps of calculating W are listed as follows:
Step.1: 
Initialization: W = E [ ( d ( t 0 ) E [ d ( t 0 ) ] ) ( d ( t 0 ) E [ d ( t 0 ) ] ) T ] - 1 , for the total time length L, the time interval for updating W is defined as l = L/r, where r is the total iterations.
Step.2: 
For t [ t ( k 1 ) l + 1 : t k l ] : estimate the model error d ( t ) for [ t ( k 1 ) l + 1 : t k l ] , and obtain the sequence of model error [ d ( t ( k 1 ) l + 1 ) , , d ( t k l ) ] .
Step.3: 
For t = t k l , update weighting matrix: W = D k 1 , D k is the covariance for [ d ( t ( k 1 ) l + 1 ) , , d ( t k l ) ] .
Step.4: 
If k < L / l , return to step.2.
Based on the definitions and descriptions above, the workflow of NPF can be summarized as follows:
Step.1: 
Initialization: for k = 0 :
(a)
Set initial values: x ^ ( t 0 ) = E [ x ( t 0 ) ] , W = E [ ( d ( t 0 ) E [ d ( t 0 ) ] ) ( d ( t 0 ) E [ d ( t 0 ) ] ) T ] - 1 ;
(b)
Set weighting matrix update time interval: l = L/r.
Step.2: 
For every time step k = 1 , 2 , , doing the following:
(a)
Estimate system output: y ^ ( t k ) = h [ x ^ ( t k ) ] ;
(b)
Calculate the intermediate parameter matrices S ( x ^ ( t k ) ) , Z ( x ^ ( t k ) , Δ t ) , Λ ( Δ t ) ;
(c)
Estimate model error: d ( t k ) = { [ Λ ( Δ t ) S ( x ^ ( t k ) ) ] T R 1 Λ ( Δ t ) S ( x ^ ( t k ) ) + W } 1 × [ Λ ( Δ t ) S ( x ^ ( t k ) ) ] T R 1 [ Z ( x ^ ( t k ) , Δ t ) + y ^ ( t k ) y ( t k + 1 ) ] ;
(d)
Update state estimation from x ^ ( t k ) to x ^ ( t k + 1 ) using discretized state equation: x ^ ˙ ( t ) = f [ x ^ ( t ) , t ] + g ( t ) d ( t ) .
Step.3: 
For k = n l , 1 n r
(a)
Calculate covariance for [ d ( t ( k 1 ) l + 1 ) , , d ( t k l ) ] : D k = C o v [ d ( t ) ] t [ t ( k 1 ) l + 1 : t k l ]
(b)
Update weighting matrix: W = D k 1
It can be seen that the process noise is determined online as a part of the solution without any prior assumption. As a result, the NPF method is robust to the process noise with any statistic distribution.

3.2. NPF Based SOC Estimation

In order to apply the NPF method to estimate the battery SOC, a continuous-discrete time model for the battery system is needed. According to the description of the equivalent circuit battery model in Section 2.1, the battery model in the continuous-discrete time form is formulated as:
x ˙ ( t ) = ( S O ˙ C ( t ) U ˙ p ( t ) ) = ( 0 S O C ( t ) + I L ( t ) C n ( R p C p ) 1 U p ( t ) + C p 1 I L ( t ) ) + g ( d 1 ( t ) d 2 ( t ) )
U t ( t k ) = U o c [ S O C ( t k ) ] + U p ( t k ) + I L ( t k ) R s + v ( t k )
where the state vector x(t) consists the components of SOC(t) and Up(t), the model error vector d(t) consists the components of d1(t) and d2(t) representing the errors of SOC(t) and Up(t) respectively, and the battery’s terminal voltage Ut(tk) is the system output sampled at tk. An identity matrix I2×2 is assigned to the model error distribution matrix g. In addition, the input current IL(t) is treated as a known system parameter since we can sample the input current in every time step by the current sensor.
The expressions of the intermediate parameter matrices S ( x ^ ( t k ) ) , Z ( x ^ ( t k ) , Δ t ) , Λ ( Δ t ) for the nonlinear battery system are given in Equations (24)–(26), which are derived according to Equations (13)–(15). The relative order r is 1 which can be obtained following the definitions in Equations (19)–(20).
S ( x ^ ( t k ) ) = [ L g 1 h ( x ^ ( t k ) ) , L g 2 h ( x ^ ( t k ) ) ] = [ U o c [ S O C ( t k ) ] S O C ( t k ) , 1 ]
Z ( x ^ ( t k ) , Δ t ) = Δ t L f h ( x ( t k ) ) = Δ t ( I L ( t k ) C n U o c [ S O C ( t k ) ] S O C ( t k ) ( R p C p ) 1 U p ( t k ) + C p 1 I L ( t k ) )
Λ ( Δ t ) = Δ t
The schematic diagram of the NPF based SOC estimation is shown in Figure 8. The d 1 ( t ) and d 2 ( t ) will be estimated at every iterative loop to predict the model errors of S O C ( t ) and U p ( t ) in the next time step, then the battery state estimation of the next time step can be obtained based on the predicted model errors and battery dynamics.
Figure 8. Schematic diagram of NPF based SOC estimation.
Energies 08 03556 g008

4. Results and Discussion

4.1. Part A: Evaluate the SOC Estimation of LCO Battery Cell

In this part, the experimental data is used to validate the performance of the NPF based estimation method for LCO battery cell. The model parameters in Table 3 are used in the estimation. The JC08 (Japanese Cycle 2008) driving cycle is applied as the loading profile to evaluate the proposed method. Figure 9 shows the SOC estimation results with the accurate initial SOC value, and Figure 10 shows the SOC estimation results with inaccurate initial SOC values.
Figure 9a shows the comparison profiles of the reference SOC and estimated SOC with the accurate initial SOC. Since the initial SOC is accurate and the integration time is not long, the SOC result obtained from coulomb counting is treated as an accurate estimation and thus taken as a reference. Figure 9b shows the estimation error between the reference SOC and estimated SOC and it can be seen that the maximum error is around 1%. Figure 9c,d shows the mean absolute error (MAE) and root mean squared error (RMSE) of SOC estimation, respectively. The results indicate that both of the MAE and RMSE are less than 0.4% at the end of estimation. Based on the discussion above, it can be concluded that the NPF method is able to accurately estimate the SOC of LCO battery cell.
Figure 10a shows the estimation results with inaccurate initial SOC values, while Figure 10b shows the corresponding errors. Two different initial SOC values (0.5 and 0.3) are used. It can be seen that the SOC estimates can quickly converge to the true solutions within several sampling steps for both initial SOC values. Therefore, the proposed NPF based SOC estimation method is robust to inaccurate initial values for LCO battery cell.
Figure 9. SOC estimation results with accurate initial SOC for LCO battery cell: (a) Comparative profiles of reference and estimated SOC; (b) Error of SOC estimation; (c) MAE of SOC estimation; (d) RMAE of SOC estimation.
Energies 08 03556 g009
Figure 10. Estimation results with inaccurate initial SOCs for LCO cell: (a) Comparative profiles of reference and estimated SOC; (b) Error of SOC estimation.
Energies 08 03556 g010

4.2. Part B: Evaluate the SOC Estimation of LFP Battery Cell

In this section, the SOC estimation using NPF for LFP battery cell is conducted. Similarly, the JC08 driving cycle is applied as the loading profile. Figure 11 shows the SOC estimation results with the accurate initial SOC value. Figure 11a shows the comparison profiles of the estimated SOC and reference SOC, and Figure 11b shows the estimation error. It can be seen that the maximum estimation error is within 2%. Figure 11c,d shows the MAE and RMSE of SOC estimation, both of which are less than 0.9% at the end of estimation. Figure 12 shows the SOC estimation with inaccurate initial SOC values, where Figure 12a shows the comparison of the reference SOC and estimated SOC, and Figure 12b shows the estimation error. Similar to the LCO battery cell, two different initial SOC values are used. It can be seen from those results that the SOC estimation can also converge to the true solution within several sampling steps for both inaccurate initial values.
Figure 11. SOC estimation results with accurate initial SOC for LFP battery cell: (a) Comparative profiles of reference and estimated SOC; (b) Error of SOC estimation; (c) MAE of SOC estimation; (d) RMAE of SOC estimation.
Energies 08 03556 g011
Figure 12. Estimation results with inaccurate initial SOC for LFP cell: (a) Comparative profiles of reference and estimated SOC; (b) Error of SOC estimation.
Energies 08 03556 g012
Based on the estimation results of LCO and LFP battery cells, a comparison study of SOC estimation for LCO and LFP cells is conducted. The comparison results are listed in Table 4. Compared to LFP battery cell, the SOC estimation of the LCO battery cell is benefited by a 0.91% improvement in terms of the maximum error, and by 0.31% and 0.42% improvements in terms of MAE and RMSE. With respect to the convergence rate, the SOC estimation of the LCO battery cell converges much faster than that of the LFP battery cell with inaccurate initial SOC values. It seems that the estimation performance of the LCO battery cell is better than that of the LFP battery cell. The difference in the estimation performance can be mainly explained by the difference of the SOC-OCV relationships between these two cells, as shown in Figure 13. The comparison results of SOC-OCV curves are shown in Figure 13a,b. It is obvious that, compared to the LCO battery cell, the LFP battery cell has a much flatter SOC-OCV curve with smaller derivation. In other words, for the same OCV difference Δ OCV , the corresponding SOC difference Δ SOC LFP of LFP battery cell will be much larger than the corresponding SOC difference Δ SOC LCO of LCO battery cell. Therefore, the observability of the LFP battery cell is weaker than that of the LCO battery cell. As a result, for similar model error, the SOC error of the LFP battery cell will be larger than the SOC error of the LCO battery cell. Thus, the performance of NPF based SOC estimation method for LFP battery cells is worse than that for LCO battery cells due to weaker observability.
Figure 13. SOC-OCV curves for two cells: (a) Comparison of SOC-OCV; (b) Comparison of the derivation of SOC-OCV.
Energies 08 03556 g013
Table 4. Comparison of LCO and LFP battery cells.
Estimation accuracyMaximum errorMAERMSE
LCO battery cell1.01%0.33%0.39%
LFP battery cell1.92%0.64%0.81%
Difference0.91%0.31%0.42%
Convergence rateConvergence time (Initial SOC = 0.5)Convergence time (Initial SOC = 0.3)
LCO battery cell302 s427 s
LFP battery cell392 s556 s
Difference29.8%30.2%

4.3. Part C: Comparison with Extended Kalman Filter

In order to further evaluate the performance of proposed method, a comparison study is conducted between the NPF method and the well-established extended Kalman filter (EKF) method based on the same experimental conditions. The details of EKF for SOC estimation can be found in [15]. To facilitate the understanding of the SOC estimation using EKF, a summary of EKF is provided as follows:
Nonlinear   sate - space   model : { x k + 1 = f ( x k , u k ) + w k y k = h ( x k , u k ) + v k
Definitions   : A ^ k = f ( x k , u k ) x k | x k = x ^ k + , C ^ k = h ( x k , u k ) x k | x k = x ^ k
Step.1: 
Initialization: For k = 0, set: x ^ 0 + = E [ x 0 ] , p 0 + = E [ ( x 0 x ^ 0 + ) ( x 0 x ^ 0 + ) T ]
Step.2: 
For k = 1,2, . . . n, do the following:
(a)
State estimation time update: x ^ k = f ( x ^ k 1 + , u k 1 )
(b)
Error covariance time update: p k = A ^ k 1 p k 1 + A ^ k 1 T + R w
(c)
Calculate the Kalman gain: L k = p k C ^ k T [ C ^ k p k C ^ k T + Q v ] 1
(d)
State estimation measurement update: x ^ k + = x ^ k + L k [ y k h ( x ^ k , u k ) ]
(e)
Error covariance measurement update: p k + = ( I L k C ^ k ) p k
where w k and v k are independent, zero-mean, Gaussian noise processes with covariance matrices R w and Q v .
In comparison with the NPF based method which uses a continuous-discrete time model, the battery system in EKF is modeled in a discrete time form, given as follows:
State   equations :   { S O C k + 1 = S O C k + η Δ t C n I L , k + w 1 , k U p , k + 1 = ( 1 ( R p C p ) 1 Δ t ) U p , k + Δ t C p I L , k + w 2 , k
Measurement   equations :   U t , k = U o c ( S O C k ) + U p , k + I L , k R s + v k
In this paper, two main aspects, estimation accuracy and convergence rate, are studied to show the advantages of the NPF based method.
To compare the estimation accuracy of these two methods, the SOC estimation with the accurate initial SOC is evaluated. Figure 14 shows the comparison of SOC estimation for LCO battery cell. Figure 14a shows the comparison of the reference SOC and estimated SOCs by NPF and EKF, while Figure 14b shows the corresponding errors. It can be seen that the NPF based method has better estimation accuracy than the EKF based method. The MAE and RMSE of SOC estimation also indicate that the NPF based method has better accuracy (shown in Figure 14c,d). Similarly, an improvement of estimation accuracy by the NPF based method can also be found for LFP battery cells, as shown in Figure 15. A summary of the estimation accuracy for these two methods is listed in Table 5.
Figure 14. Comparison results of SOC estimation for LCO battery cell with accurate initial SOC: (a) SOC estimation; (b) Error of SOC estimation; (c) MAE of SOC estimation; (d) RMSE of SOC estimation.
Energies 08 03556 g014aEnergies 08 03556 g014b
Figure 15. Comparison results of SOC estimation for LFP battery cell with accurate initial SOC: (a) SOC estimation; (b) Error of SOC estimation; (c) MAE of SOC estimation; (d) RMSE of SOC estimation.
Energies 08 03556 g015
Table 5. Comparison results of estimation accuracy.
Estimation AccuracyMaximum ErrorMAERMSE
LCO battery cell
EKF1.64%0.43%0.54%
NPF1.01%0.33%0.39%
Improvement38.4%17.9%27.8%
LFP battery cell
EKF4.66%0.78%1.01%
NPF1.92%0.64%0.81%
Improvement58.8%17.9%20.8%
To compare the convergence rate of these two methods, the SOC estimation with the inaccurate initial SOC is conducted. For convenience, the initial SOC value used in this study is set as 0.5 for both NPF and EKF. The results are shown in Figure 16 where Figure 16a,b shows the comparison for the LCO battery cell, and Figure 16c,d shows the comparison for the LFP battery cell. It can be seen that the NPF based method converges faster than the EKF based method for both cells. A summary of the convergence rate for these two methods is given in Table 6.
Figure 16. Comparison results of SOC estimation with inaccurate initial SOC: (a) SOC estimation of LCO battery cell; (b) SOC estimation error of LCO battery cell; (c) SOC estimation of LFP battery cell; (d) SOC estimation error of LFP battery cell.
Energies 08 03556 g016
Table 6. Comparison results of convergence rate.
Convergence RateTime
LCO battery cell
EKF439 s
NPF302 s
Improvement31.2%
LFP battery cell
EKF586 s
NPF392 s
Improvement33.1%

5. Conclusions

In this paper, the nonlinear predictive filter is developed to estimate the SOC of Li-ion batteries with two different chemistries. First, in consideration of the model accuracy and computational complexity, the first-order equivalent circuit battery model is adopted to characterize the dynamic performance of Li-ion battery cells. Second, a series of battery tests are conducted using two cells with different chemistries (LCO and LFP) to identify the model parameters. The model validation results based on UDDS driving cycle indicate that the battery models with identified parameters are able to accurately represent the behavior of LCO and LFP battery cells. Third, the nonlinear predictive filter is introduced and developed to estimate the battery SOC using the first-order battery model. The JC08 driving cycle is applied for these two cells to evaluate the proposed method. According to the results, the NPF based method is able to estimate the battery SOC accurately. Besides, the proposed SOC estimation method has good robust performance to inaccurate initial values (quickly converging to the true solution within several sampling steps). Finally, the comparison of EKF and NPF based methods indicates that the proposed method has better estimation accuracy and faster convergence rate than the EKF based method for both cells.

Acknowledgments

The authors gratefully acknowledge the support from Nippon Chemi-Con Corporation.

Author Contributions

Yin Hua and Min Xu planned and drafted the main part of the paper. Mian Li revised the paper. Chengbin Ma and Chen Zhao participated in the experiment.

Conflicts of Interest

The authors declare no conflict of interest.

References

  1. Xi, J.; Li, M.; Xu, M. Optimal energy management strategy for battery powered electric vehicles. Appl. Energy 2014, 134, 332–341. [Google Scholar] [CrossRef]
  2. Wang, B.; Xu, M.; Yang, L. Study on the economic and environmental benefits of different EV powertrain topologies. Energy Conver. Manag. 2014, 86, 916–926. [Google Scholar] [CrossRef]
  3. Lukic, S.M.; Cao, J.; Bansal, R.C.; Rodriguez, F.; Emadi, A. Energy storage systems for automotive applications. IEEE Trans. Ind. Electron. 2008, 55, 2258–2267. [Google Scholar] [CrossRef]
  4. Hammond, G.P.; Hazeldine, T. Indicative energy technology assessment of advanced rechargeable batteries. Appl. Energy 2014, 138, 559–571. [Google Scholar] [CrossRef] [Green Version]
  5. Garche, J.; Jossen, A.; Döring, H. The influence of different operating conditions, especially over-discharge, on the lifetime and performance of lead/acid batteries for photovoltaic systems. J. Power Sour. 1997, 67, 201–212. [Google Scholar] [CrossRef]
  6. Alzieu, J.; Smimite, H.; Glaize, C. Improvement of intelligent battery controller: State-of-Charge indicator and associated functions. J. Power Sour. 1997, 67, 157–161. [Google Scholar] [CrossRef]
  7. Xing, Y.; He, W.; Pecht, M.; Tsui, K.L. State of charge estimation of lithium-ion batteries using the open-circuit voltage at various ambient temperatures. Appl. Energy 2014, 113, 106–115. [Google Scholar] [CrossRef]
  8. Eddahech, A.; Briat, O.; Vinassa, J.M. Adaptive voltage estimation for EV Li-ion cell based on artificial neural networks state-of-charge meter. In Proceedings of the 2012 IEEE International Symposium on Industrial Electronics (ISIE), Hangzhou, China, 28–31 May 2012; pp. 1318–1324.
  9. Salkind, A.J.; Fennie, C.; Singh, P.; Atwater, T.; Reisner, D.E. Determination of state-of-charge and state-of-health of batteries by fuzzy logic methodology. J. Power Sour. 1999, 80, 293–300. [Google Scholar] [CrossRef]
  10. Anton, J.C.A.; Nieto, P.J.G.; Viejo, C.B.; Vilan, J.A. Support vector machines used to estimate the battery state of charge. IEEE Trans. Power Electron. 2013, 28, 5919–5926. [Google Scholar] [CrossRef]
  11. Tsang, K.M.; Sun, L.; Chan, W.L. Identification and modelling of Lithium ion battery. Energy Convers. Manag. 2010, 51, 2857–2862. [Google Scholar] [CrossRef]
  12. He, H.; Xiong, R.; Guo, H.; Li, S. Comparison study on the battery models used for the energy management of batteries in electric vehicles. Energy Convers. Manag. 2012, 64, 113–121. [Google Scholar] [CrossRef]
  13. Plett, G.L. Extended Kalman filtering for battery management systems of LiPB-based HEV battery packs: Part 1. Background. J. Power Sour. 2004, 134, 252–261. [Google Scholar] [CrossRef]
  14. Plett, G.L. Extended Kalman filtering for battery management systems of LiPB-based HEV battery packs: Part 2. Modeling and identification. J. Power Sour. 2004, 134, 262–276. [Google Scholar] [CrossRef]
  15. Plett, G.L. Extended Kalman filtering for battery management systems of LiPB-based HEV battery packs: Part 3. State and parameter estimation. J. Power Sour. 2004, 134, 277–292. [Google Scholar] [CrossRef]
  16. Plett, G.L. Sigma-point Kalman filtering for battery management systems of LiPB-based HEV battery packs: Part 1: Introduction and state estimation. J. Power Sour. 2006, 161, 1356–1368. [Google Scholar] [CrossRef]
  17. Plett, G.L. Sigma-point Kalman filtering for battery management systems of LiPB-based HEV Battery packs: Part 2: Simultaneous state and parameter estimation. J. Power Sour. 2006, 161, 1369–1384. [Google Scholar] [CrossRef]
  18. He, Z.; Gao, M.; Wang, C.; Wang, L.; Liu, Y. Adaptive state of charge estimation for Li-ion batteries based on an unscented kalman filter with an enhanced battery model. Energies 2013, 6, 4134–4151. [Google Scholar] [CrossRef]
  19. Han, J.; Kim, D.; Sunwoo, M. State-of-charge estimation of lead-acid batteries using an adaptive extended Kalman filter. J. Power Sour. 2009, 188, 606–612. [Google Scholar] [CrossRef]
  20. Sun, F.; Hu, X.; Zou, Y.; Li, S. Adaptive unscented Kalman filtering for state of charge estimation of a lithium-ion battery for electric vehicles. Energy 2011, 36, 3531–3540. [Google Scholar] [CrossRef]
  21. Schwunk, S.; Armbruster, N.; Straub, S.; Kehl, J.; Vetter, M. Particle filter for state of charge and state of health estimation for lithium-iron phosphate batteries. J. Power Sour. 2013, 239, 705–710. [Google Scholar] [CrossRef]
  22. Charkhgard, M.; Farrokhi, M. State-of-charge estimation for lithium-ion batteries using neural networks and EKF. IEEE Trans. Ind. Electron. 2010, 57, 4178–4187. [Google Scholar] [CrossRef]
  23. Tian, Y.; Xia, B.; Wang, M.; Sun, W.; Xu, Z. Comparison Study on two model-based adaptive algorithms for SOC estimation of lithium-ion batteries in electric vehicles. Energies 2014, 7, 8446–8464. [Google Scholar] [CrossRef]
  24. He, H.; Qin, H.; Sun, X.; Shui, Y. Comparison study on the battery SoC estimation with EKF and UKF algorithms. Energies 2013, 6, 5088–5100. [Google Scholar] [CrossRef]
  25. Zou, Z.; Xu, J.; Mi, C.; Cao, B.; Chen, Z. Evaluation of model based state of charge estimation methods for lithium-ion batteries. Energies 2014, 7, 5065–5082. [Google Scholar] [CrossRef]
  26. Yuan, S.; Wu, H.; Yin, C. State of charge estimation using the extended kalman filter for battery management systems based on the arx battery model. Energies 2013, 6, 444–470. [Google Scholar] [CrossRef]
  27. Xia, B.; Chen, C.; Tian, Y.; Sun, W.; Xu, Z.; Zheng, W. A novel method for state of charge estimation of lithium-ion batteries using a nonlinear observer. J. Power Sour. 2014, 270, 359–366. [Google Scholar] [CrossRef]
  28. Crassidis, J.L.; Markley, F.L. Predictive filtering for attitude estimation without rate sensors. J. Guid. Control Dyn. 1997, 20, 522–527. [Google Scholar] [CrossRef]
  29. Hua, Y.; Cordoba-Arenas, A.; Warner, N.; Rizzoni, G. A multi time-scale state-of-charge and state-of-health estimation framework using nonlinear predictive filter for lithium-ion battery pack with passive balance control. J. Power Sour. 2015, 280, 293–312. [Google Scholar] [CrossRef]
  30. Hu, X.; Li, S.; Peng, H. A comparative study of equivalent circuit models for Li-ion batteries. J. Power Sour. 2012, 198, 359–367. [Google Scholar] [CrossRef]
  31. Abu-Sharkh, S.; Doerffel, D. Rapid test and non-linear model characterisation of solid-state lithium-ion batteries. J. Power Sour. 2004, 130, 266–274. [Google Scholar] [CrossRef]
  32. US Environmental Protection Agency. EPA urban dynamometer driving schedule (UDDS). Available online: http://www.epa.gov/oms/standards/light-duty/udds.htm (accessed on 3 April 2015).

