Article

Detecting Flood Variations in Shanghai over 1949–2009 with Mann-Kendall Tests and a Newspaper-Based Database

1
Department of Geography, Shanghai Normal University, Guilin Road 100, Shanghai 200234, China
2
Department of Management, Shanghai University of Engineering Science, Longteng Road 333, Shanghai 201620, China
3
Geography Research Group, Department of Earth and Environmental Sciences, Katholieke Universiteit Leuven, Celestijnenlaan 200E, Heverlee 3001, Belgium
*
Author to whom correspondence should be addressed.
These authors contributed equally to this work.
Water 2015, 7(5), 1808-1824; https://doi.org/10.3390/w7051808
Submission received: 10 March 2015 / Revised: 14 April 2015 / Accepted: 17 April 2015 / Published: 27 April 2015

Abstract

:
A valuable aid to assessing and managing flood risk lies in a reliable database of historical floods. In this study, a newspaper-based flood database for Shanghai (NFDS) for the period 1949–2009 was developed through a systematic scanning of newspapers. After calibration and validation of the database, Mann-Kendall tests and correlation analysis were applied to detect possible changes in flood frequencies. The analysis was carried out for three different flood types: overbank flood, agricultural waterlogging, and urban waterlogging. The compiled NFDS registered 146 floods and 92% of them occurred in the flood-prone season from June to September. The statistical analyses showed that both the annual flood and the floods in June–August increased significantly. Urban waterlogging showed a very strong increasing trend, probably because of insufficient capacity of urban drainage system and impacts of rapid urbanization. By contrast, the decrease in overbank flooding and the slight increase in agricultural waterlogging were likely because of the construction of river levees and seawalls and the upgrade of agricultural drainage systems, respectively. This study demonstrated the usefulness of local newspapers in building a historical flood database and in assessing flood characterization.

1. Introduction

Natural disasters are considered to be an increasing threat for sustainable development and the security of humankind [1]. Each year natural disasters take a huge toll in deaths, injuries, property damage, and economic loss [2]. In the decade 2005–2014, 3979 natural disasters were registered by the EM-DAT that in total caused more than 0.8 million deaths, affected 1.7 billion people, and brought about $1.4 trillion in economic damages [3]. Among the registered natural disasters, flood is the most frequent disaster (41% of all registered natural disasters) and responsible for 49% of the total affected population, for 7% of all deaths, and for 22% of the economic loss due to natural disasters [3]. It is therefore clear that disaster risk reduction, in particular flood risk reduction, will remain high on the agenda of both scientists and policy makers in the coming decades [4].
A fundamental element in analyzing and managing natural disasters is reliable databases on their causes, frequencies, and locations [5,6,7]. In databases of historical natural disasters lies the opportunity for uncovering the relationships amongst the occurrence of natural events (typhoons, rainstorms, etc.), the exposure of vulnerable elements (people, assets, etc.), and countermeasures implemented by authorities (upgrading drainage system, building river levees, etc.) [8,9,10]. They are also vital to insurance business, governmental decision-making and public awareness [11,12]. Databases have been established in an increasing number of regions [13,14,15,16,17,18].
In establishing disaster databases, reliable and continuous data is amongst the most difficult tasks [19,20]. The global-scale disaster databases of EM-DAT, Nat Cat Service, and Sigma mainly employ data from governments, UN agencies, NGOs, research institutions, insurance business, and press agencies [19]. The DesInventar uses pre-existing data, newspapers, and institutional reports to establish national and regional disaster databases in Latin America, the Caribbean, Asia, and Africa [19,21]. The UNDP’s GRIP (Global Risk Identification Program) also helps developing countries to develop their databases, mainly using media news and official reports [19]. The GRIP gives a profile of 51 disaster databases, among which 41 (80%) used newspapers or online media data and 33 (65%) used newspapers or online media data as a major data source [13].
Newspapers have substantial advantages over other disaster data sources [21,22]. Firstly, newspapers provide continuous and nearly complete disaster information for a wide time range [7,23] as they play an essential role in hazard warning before disaster, relief, and rescue communication during disaster, and damage inventory reporting after disaster [24,25,26,27,28,29,30]. Secondly, newspapers’ information is relatively reliable and convincing as they typically try to obtain disaster information from authoritative sources [29,30]. Thirdly, newspapers can give more detailed information of small- and medium-scale disasters that are often not represented in larger-scale disaster databases [5,19]. Finally, newspaper archives are usually more accessible than other data sources [21,22]. Newspaper archives are therefore considered as a critical data source for analyzing natural disasters, especially for local and regional scale studies.
Despite these advantages, relatively few studies used newspaper archives for long-term analysis of natural disasters mainly because of the time-consuming procedures to develop the databases and because of the difficulties in calibrating and validating them. Shi [31] built a newspaper-based Chinese disaster database and compiled the Natural Disaster System Atlas of China. Hilker, Badoux, and Hegg [11] characterized Swiss flood and landslide risks by exploring 3000 Swiss newspapers and magazines between 1972 and 2007. Miah et al. [32] investigated newspapers’ coverage of climate change issues in Bangladesh. Papagiannaki et al. [33] investigated the seasonal and spatial variations of high-impact weather events in Greece from 2001 to 2011 by employing meteorological observations and newspaper reports. Barnolas and Llasat [5] analyzed the spatial distribution of Catalonia’s floods spanning the 20th century based on documentary, instrumental information, and newspaper reports. Newspapers were also used to analyze the development of social risk perception in Catalonia from 1982 to 2007 [34,35]. The newspaper-based Portugal disaster database supported the assessment of temporal trends and the spatial distribution of recorded hydro-geomorphologic events for the period 1865–2010 [7,22].
In this study, new procedures for developing and calibrating a natural disaster database based on newspaper archives will be introduced and possible trends in disaster frequency will be investigated. The floods in Shanghai will be taken as an example application as this worldwide metropolis faces great flood risk because of (1) its geographic location; (2) economic status; and (3) the expected consequences of global climate change [36,37]. This contribution aims to develop a newspaper-based flood database of Shanghai (NFDS) and to quantify the flood characteristics. Following a description of the study area, Section 2 describes the data source, classification, and calibration methods in developing NFDS and presents the statistical methods in analyzing the database. Section 3 shows the statistical results of the NFDS including floods’ seasonal distribution and temporal variation. Section 4 discusses the knowledge earned in developing and analyzing NFDS. A brief conclusion follows those discussions.

2. Materials and Methods
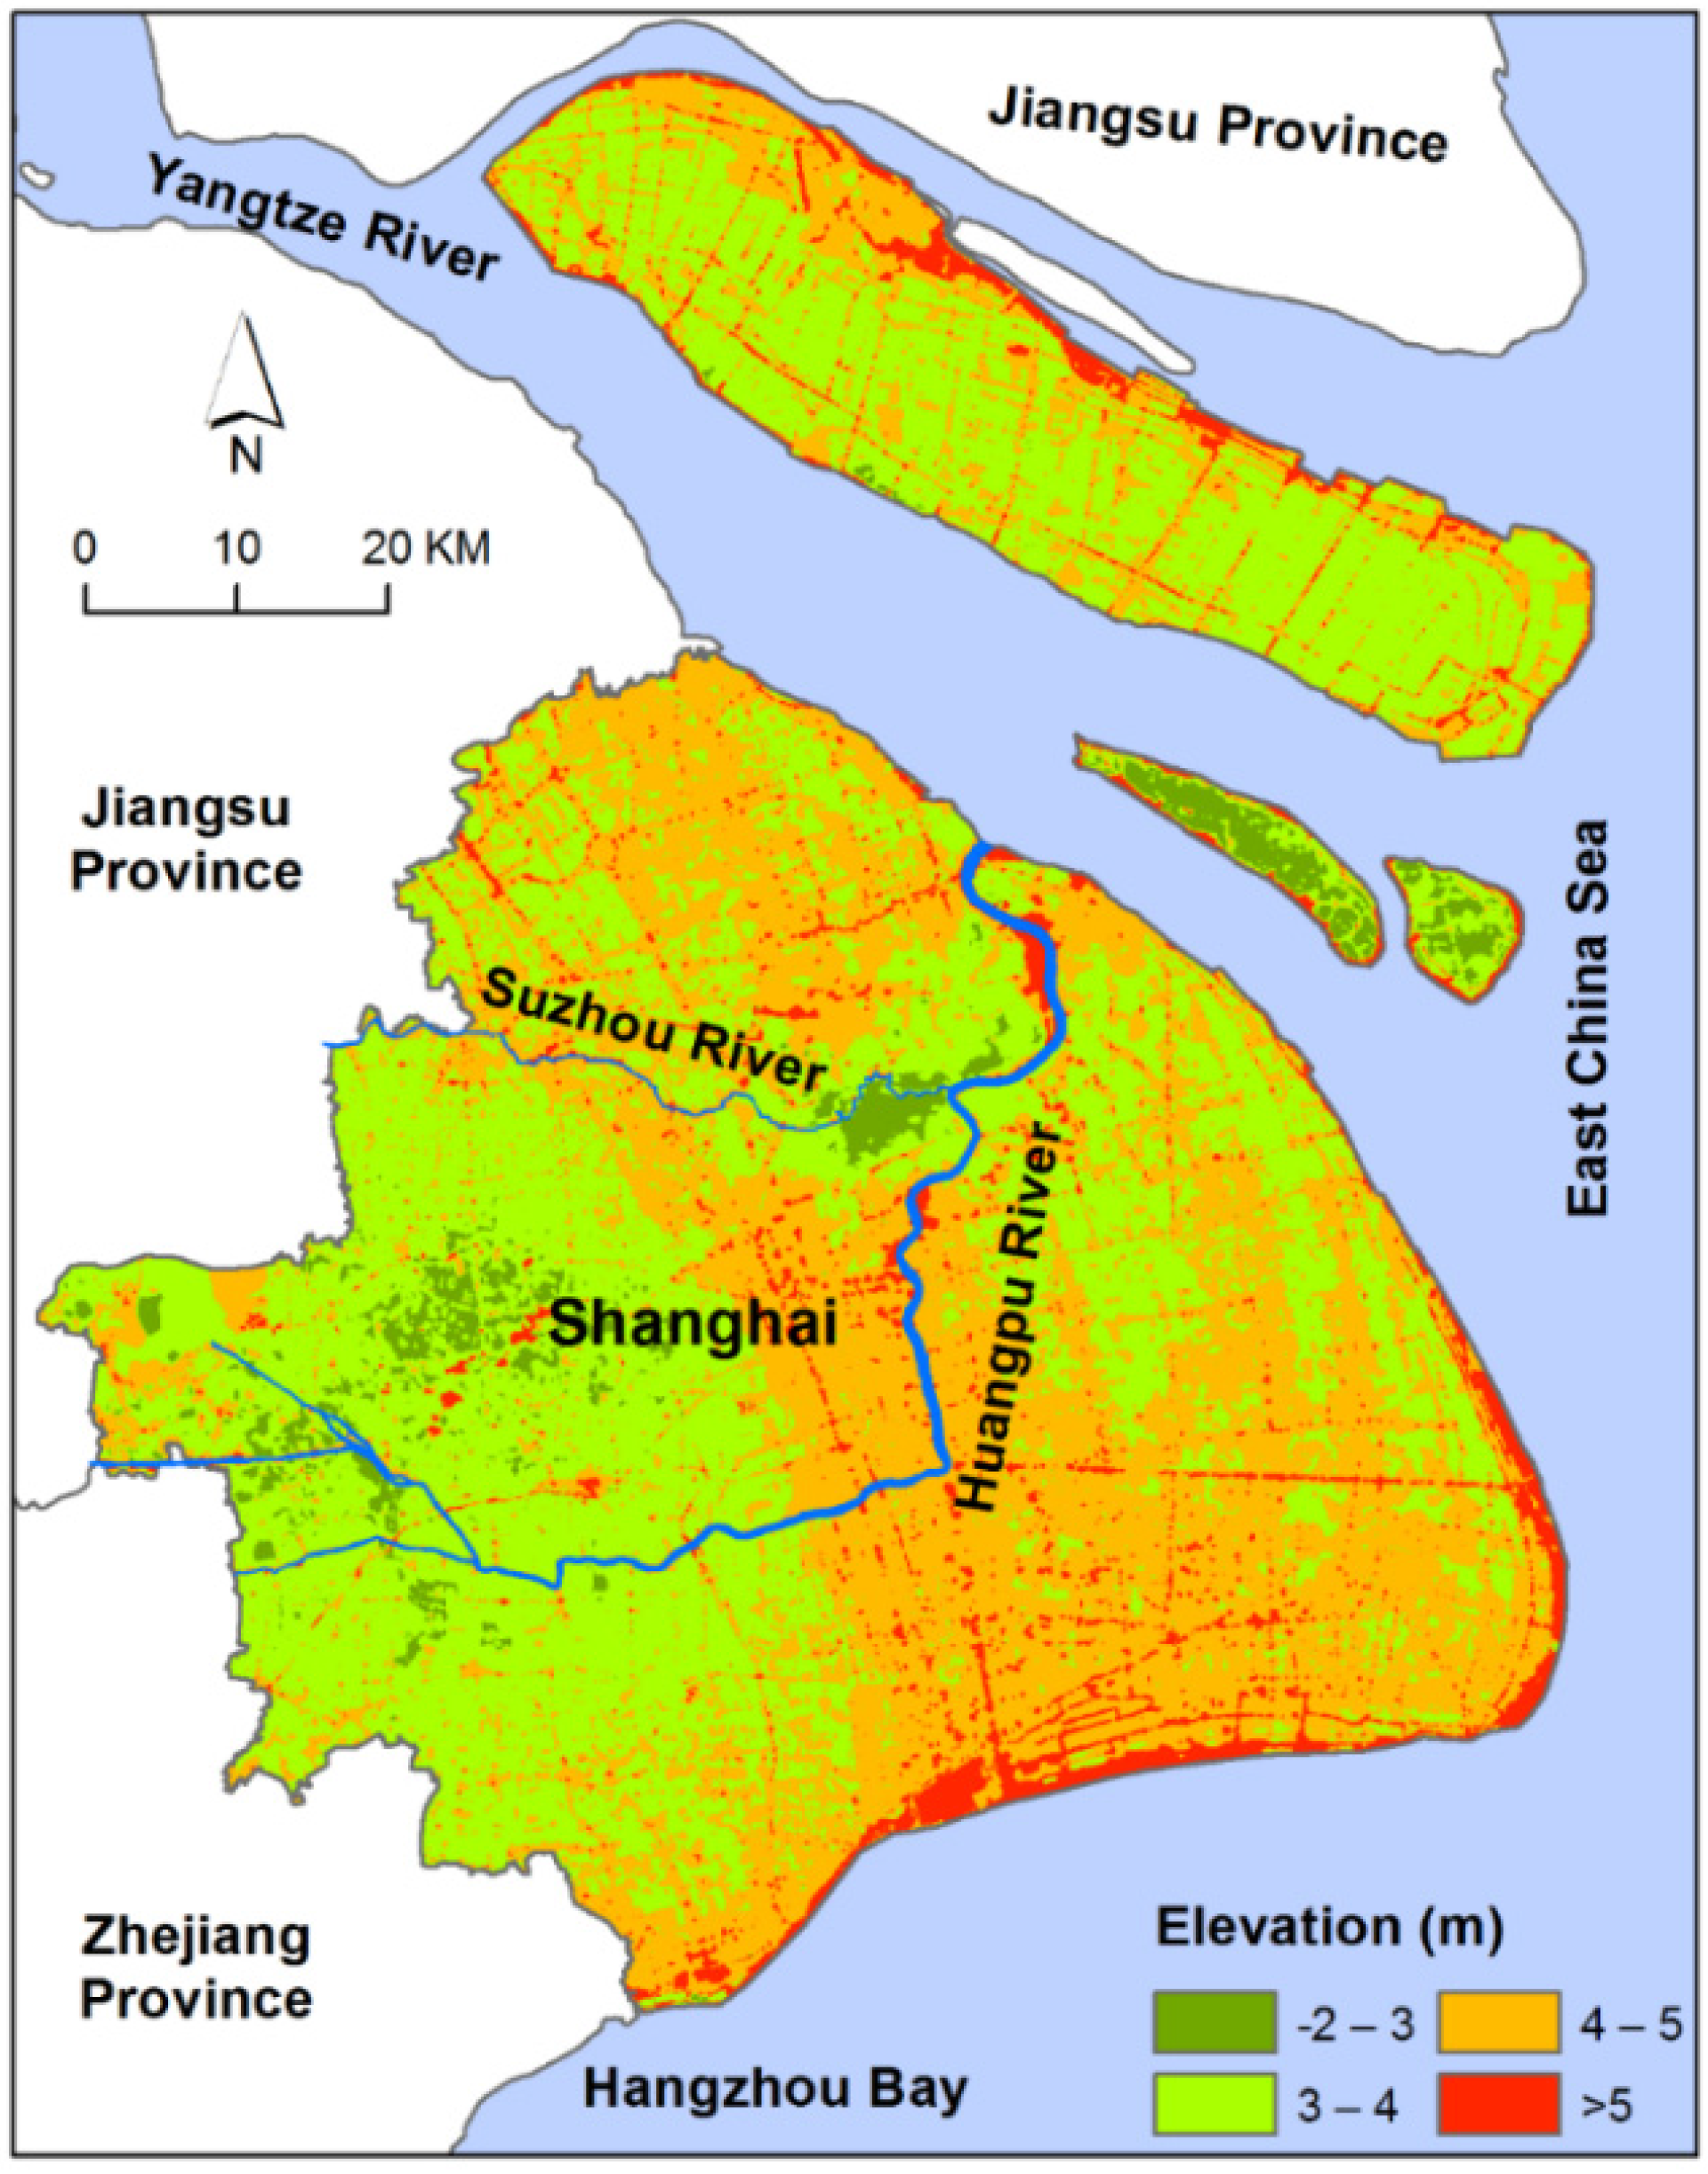
2.1. Study Area

Shanghai is amongst the largest seaports in the world and the largest cities in China. The city has a population of 24 million and a terrestrial area of 6340 km2. It borders the Jiangsu Province and the Zhejiang province in the west. On the other three sides, it is surrounded by water, namely the Yangtze River Estuary (North), the East China Sea (East), and the Hangzhou Bay (South) (Figure 1). The Huangpu River runs through the city. Shanghai has a subtropical monsoon climate. The rainfall averages 1123 mm per year, and is unevenly distributed over time. The wet season, from April to September, is expected to have 70% of the annual precipitation. Rainstorms are very common in this area due to the influence of typhoons, plum rains, strong convective weather systems, and urban heat island [38]. Occupying the coastal part of the Yangtze River alluvial plain, Shanghai is topographically flat, with exception of some hills to its west. Altitude is mainly about 3–5 m above the sea level. However, the average tidal amplitude of the estuary system ranges from 2.4 to 4.6 m [39] and typhoons can essentially enhance the tide level. On 18 August 1997, the highest tide record of 5.99 m occurred in Shanghai.
The combination of the flat alluvial plain, the subtropical monsoon climate, the tidal amplitude, typhoons, and upstream discharges causes serious flood risk to Shanghai and threats to its sustainable development [36,37]. The situation is exacerbated by land subsidence and sea level rising [39,40]. Shanghai has constructed massive seawalls and river levees since 1950 to reduce flood risk caused by over­flowing of rivers and seawaters. It has built pumping stations and dredged river-based agricultural drainage system to prevent agricultural waterlogging. Meanwhile, it has also upgraded the urban drainage system to prevent urban waterlogging by dredging river-based drainage systems, installing underground pipes, and building pumping stations [38,41,42,43].
Figure 1. Location, rivers, and elevation of Shanghai.
Water 07 01808 g001

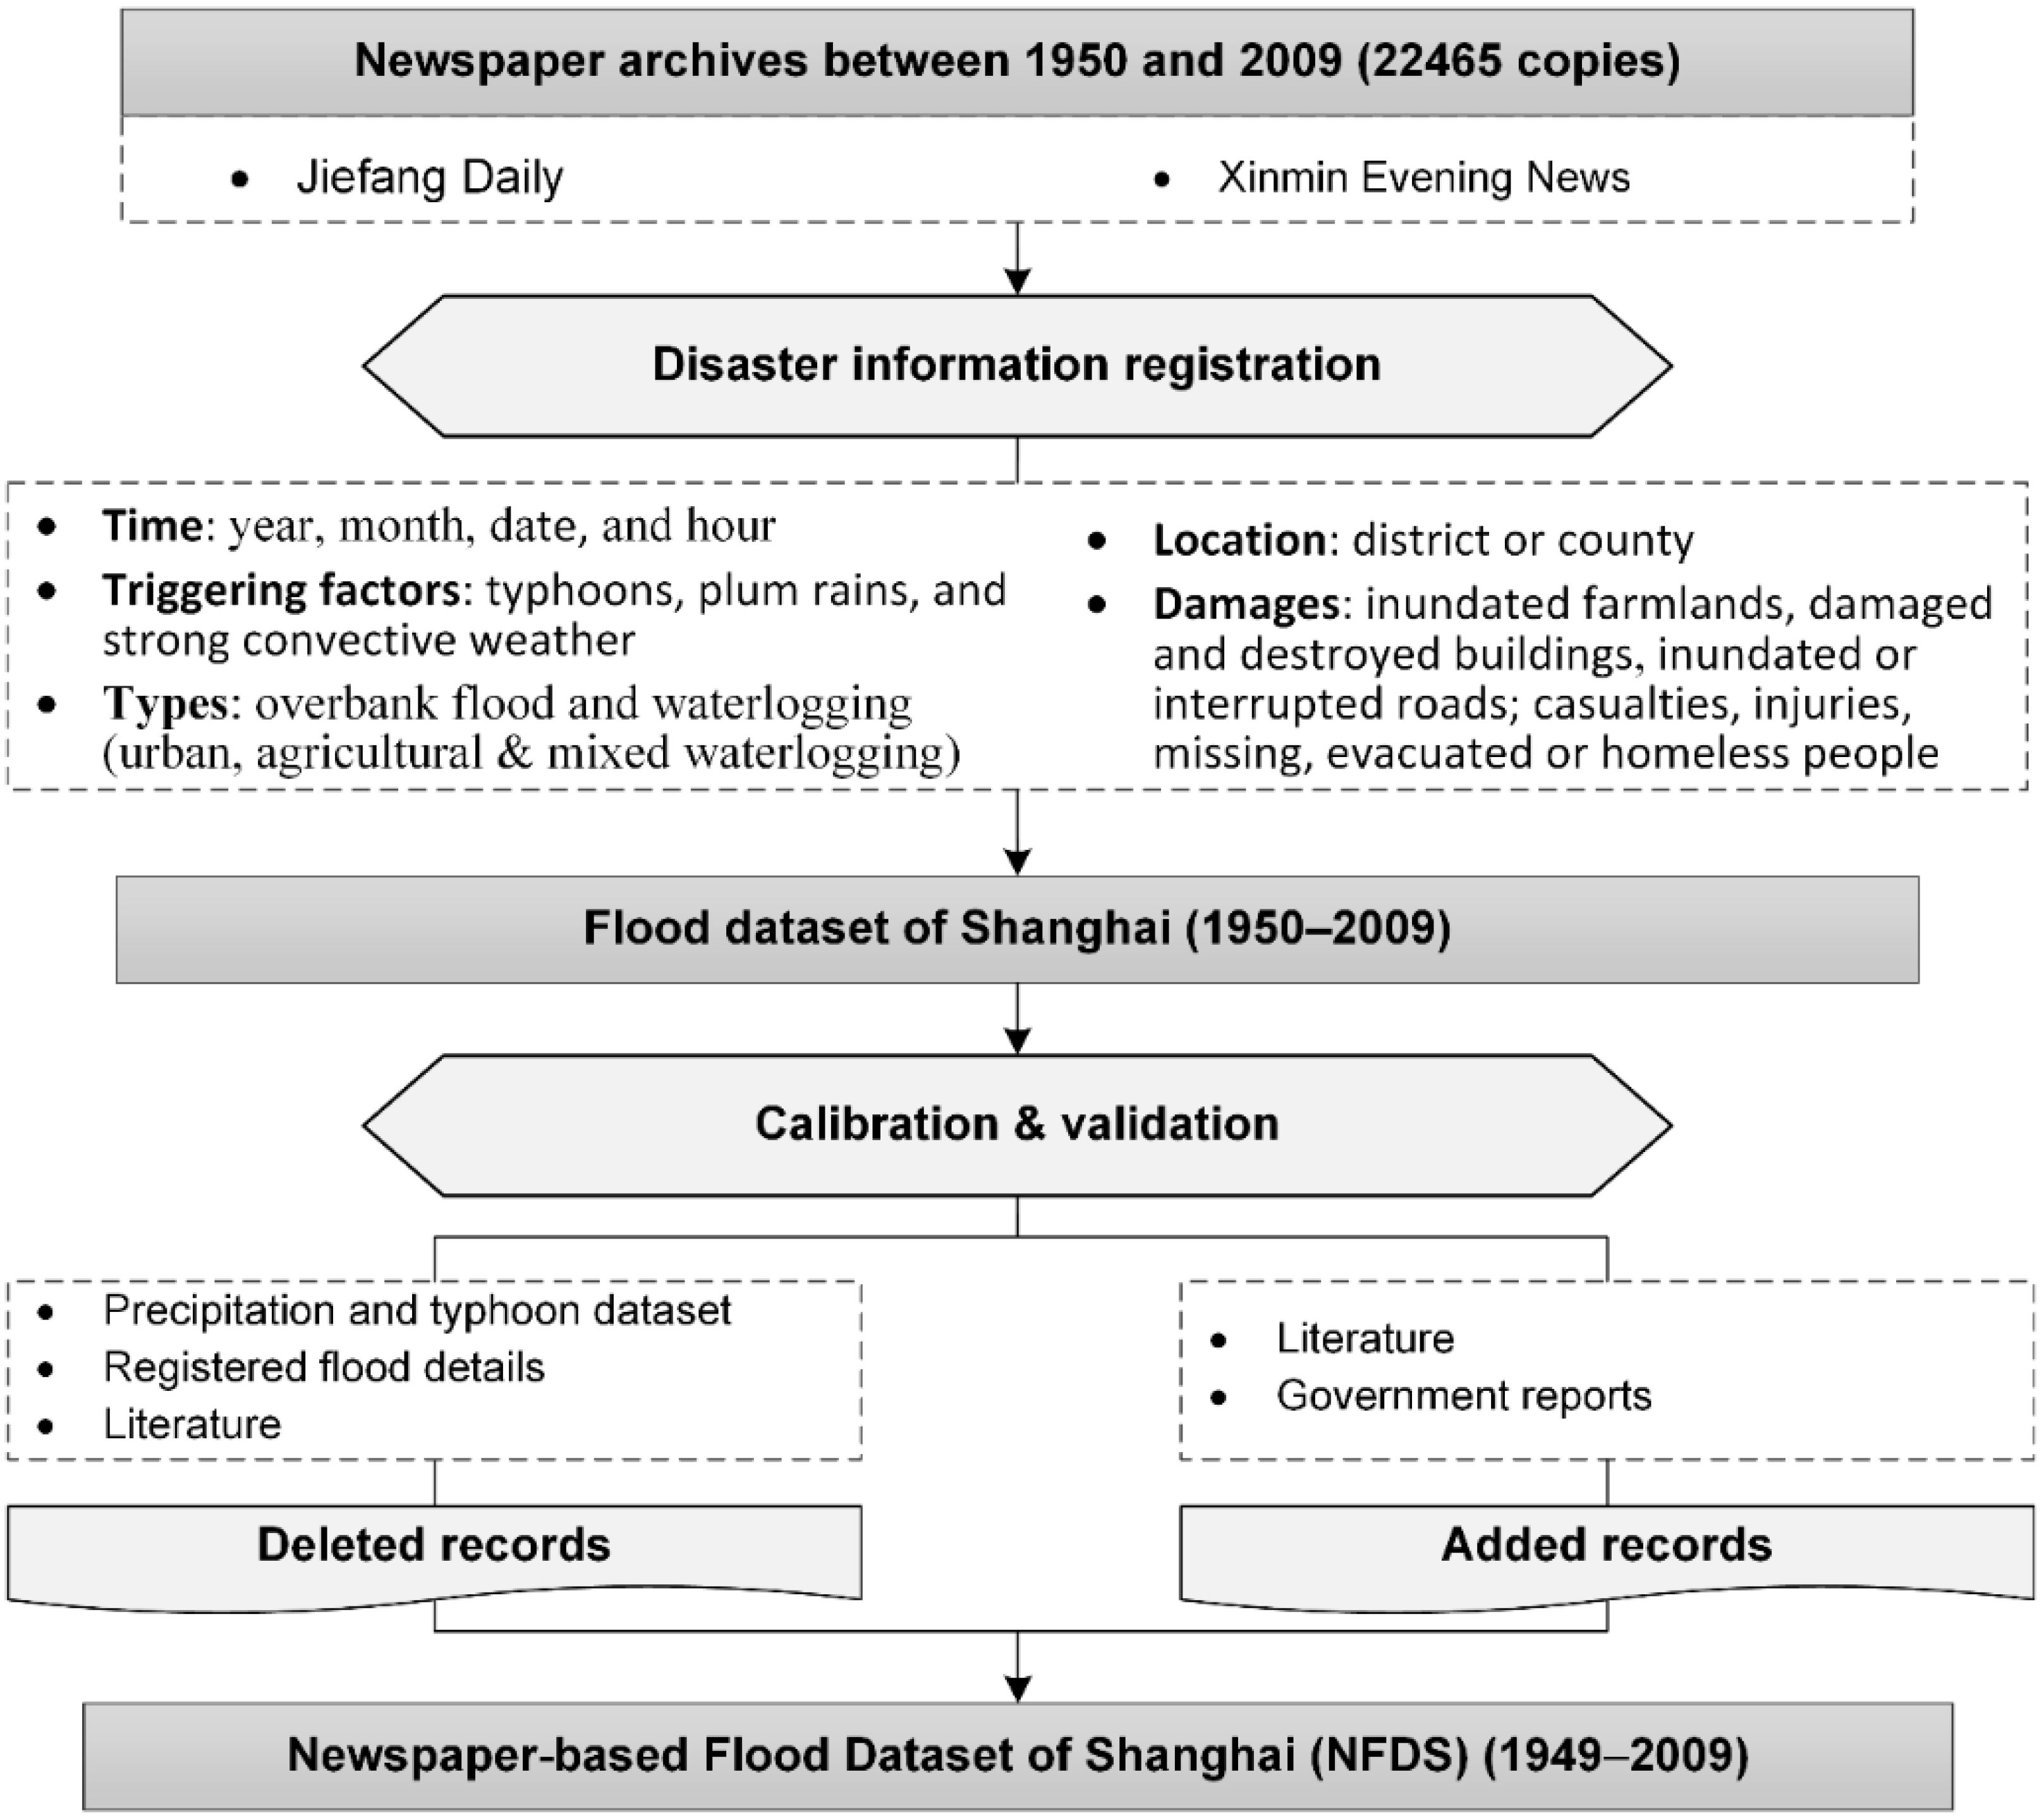
2.2. Data and Methods for Developing the Flood Database for Shanghai

The development of NFDS has two major steps as described in Figure 2, namely (1) disaster information registration and (2) calibration and validation. The major source of disaster information was 22,645 copies of newspapers from Jiefang Daily and Xinmin Evening News that are prominent newspapers in Shanghai. These newspapers were freely accessible in hard copy at Shanghai Library. The database’s calibration and validation employed the following documentary data: (1) government reports, which were acquired from Shanghai Water Authority; (2) literature [38,43,44,45]; (3) 12-hour precipitation (1949–2009) and typhoon series (1949–1999), which were downloaded from China Meteorological Data Sharing Service Network; and (4) astronomical tide information, which was provided by the Shanghai Water Authority.
The disaster information registration converted the newspapers’ unstructured disaster information into structured database of NFDS. It primarily registered 163 floods through manually analyzing the newspapers. For a report to be primarily entered into the flood database we must have both inundation and damage information [4]. Five major items for each event were registered, namely time, location, damages, triggering factors, and types. The time item registered when a flood event starts and ends (year, month, date, and hour). It would be used for analyzing flood frequency and relating flood events to precipitation and tide for calibrating the primary database. Location registered the districts or counties that were affected by a flood event. Damages comprised the area of inundated farmlands; the number of killed, injured, missing, evacuated, or homeless people; the number of damaged and destroyed buildings; and the number of inundated or interrupted roads. However, location and damage information was inconsistent and incomplete over time because many reports only gave vague descriptions of where the floods occurred and how much damage occurred. Triggering factors included names and types of triggering events, e.g., typhoons, plum rains, and strong convective weather.
Figure 2. Methodology of developing NFDS (1949–2009).
Water 07 01808 g002
Typically, flood types were not directly given in newspaper reports. They were inferred based on damage details and triggering factors. In Chinese, floods are typically classified into two subtypes, namely overbank flood (Hong-Zai) and waterlogging (Lao-Zai) (Table 1). Overbank flood results from the over­flowing of rivers, lakes, and seawaters. It includes both fluvial floods and coastal storm-surge induced floods because the two categories are difficult to distinguish in deltaic cities like Shanghai that border both river and sea. Waterlogging (pluvial flood) occurs when the accumulation of precipitation exceeds evapotranspiration, infiltration, and the capacity of rainstorm drainage system. Waterlogging happens both in farmlands and in urban areas. Waterlogging that affects crops’ growth and causes yield losses was registered as agricultural waterlogging. Waterlogging that causes inundation of roads and buildings’ ground floor in urban areas was registered as urban waterlogging. A waterlogging event that happens in countryside and cities simultaneously was registered as mixed waterlogging in addition to urban waterlogging and agricultural waterlogging. It is often impossible to classify a given event into a specific subtype because a combination of subtype floods may occur. For instance, a typhoon event can cause agricultural waterlogging, urban waterlogging, and overbank flood [46]. Such events were registered as all of the categories if they agreed with the definitions of perspective categories. The classification was mainly implemented by investigating the flood record details.
Table 1. The definition and classification standards for the five subtype floods.
Subtype FloodDefinition and Classification Standards
Overbank floodFlood that is caused by over­flowing of rivers, lakes, and seawaters.
WaterloggingFlood that is caused by the accumulation of precipitation in an area when it exceeds evapotranspiration, infiltration, and the capacity of rainstorm drainage system.
Agricultural waterloggingExcessive water causes low oxygen conditions of soil layer for a certain period that affects crops’ growth and results in substantial yield losses. Sometimes, it can inundate crops completely and causes 100% yield losses [47,48].
Urban waterloggingExcessive water inundates roads and buildings’ ground floor in urban areas when rainfall intensity exceeds the capacity of drainage and pump systems.
Mixed waterloggingWaterlogging that happens both in urban areas and in countryside.
The primarily registered floods were found to have two kinds of errors: (1) commission errors (false entries); and (2) omission errors (misses). The commission errors were mainly because of interpretation mistakes. Some reports of typhoons and astronomical tides were primarily mistaken as floods, although they actually did not result in floods and some disasters induced by strong wind during typhoon events were also mistaken as floods in the primary registration step. The calibration procedure for commission errors began with manually rechecking the reported details. If the records did not have both inundation and damage information, then they were marked as suspects. These suspects were then related to precipitation for checking if there were rainstorms (>50 mm in 24 h or >30 mm in 12 h) and to literature and governmental reports for checking if there were damage information. If there were neither rainstorms nor damages, then the suspects would be labeled as false entries and then be deleted. The calibration procedure for omission errors investigated literature, typhoon dataset, and governmental reports for floods omitted by the primary registration step. It finally added the omitted floods to the NFDS. The calibration process found that 23 records were false entries due to commission errors in the primarily registered flood database. These commission errors comprised wrong interpretation of reports on untargeted typhoons (eight times), astronomical tides (five times), and misclassification from strong-wind induced disasters to floods (10 times). On the other hand, the primary database missed six floods that were recorded by government reports and literature.
After calibration, the NFDS finally had 146 floods. It was further validated with another flood dataset for Shanghai. Yuan [38] compiled 47 floods based on governmental reports for the period 1949–1991, while NFDS registered 63 floods for the same period. Compared with governmental reports, newspapers provided 30% more information. The major reason for this difference was that governmental reports only provided annual summaries of floods in some years instead of giving a list of individual floods. A summary of annual flood loss only resulted in one flood record in Yuan [38], while NFDS registered each of those individual floods through newspaper reports.

2.3. Statistical Analyses of Historical Floods in Shanghai

The developed database was analyzed to detect possible changes in flood frequency over time both at yearly and monthly base. Mann–Kendall (MK) tests for monotonic trend and for abrupt change were employed. The MK test for monotonic trend is a nonparametric method that can reveal the changing trend in time series [49,50,51]. It does not require samples to follow a specific distribution and can perform well even when there are a few abnormal values. This method has been widely applied in hydro-meteorological time series. It uses the MK Z statistic to indicate if a time series has increasing or decreasing trend and the trend’s significance [51,52]. The MK Z statistic follows a standard normal distribution. Positive value indicates an increasing trend and negative value means a decreasing trend. The trend is significant at confidence levels of 95% and 99% when the absolute value of the MK Z statistic exceeds 1.96 and 2.58, respectively.
In addition to the monotonic trend analysis, possible abrupt changes in flood frequencies were identified using the MK abrupt change test. The MK abrupt change test assumes (null hypothesis) that the time series under investigation shows no beginning of a developing trend. It calculates two standardized statistic series, UF and UB, for a data series and plots them with confidence lines. The null hypothesis is rejected and significant abrupt change occurs if the UF curve and the UB curve intersect within the confidence zone. This study takes the confidence level of 95% (1.96 and −1.96) as the boundary lines of the confidence zone.
Given a flood frequency series F = (f1, f2, f3, …, fn), the calculation for UF has two steps. First, it calculates a normally distributed statistic dk; second, it standardizes the dk and gets UF(k). The equation for calculating dk is as follows [53]:
d k = i = 1 k j = 1 i logistic ( f i > f j ) , ( k = 2 , 3 , , n )
where logistic (fi > fj) is 1 when fi > fj and 0 otherwise. The equations for standardizing dk are as follows:
U F ( k ) = [ d k E ( d k ) ] var ( d k ) , ( k = 2 , 3 , , n ) w h e r e E ( d k ) = k ( k 1 ) / 4 a n d var ( d k ) = k ( k 1 ) ( 2 k + 5 ) / 72
The calculation for UB uses a reversed data series F′ = (f1, f2,.f3, …, fn) = (fn, fn-1, fn-2, …, f1). The equation for UB(k) is as follows:
U B ( k ) = [ d k E ( d k ) ] var ( d k ) , ( k = 2 , 3 , , n )
where dk, E(dk), and var(dk) are calculated using the same equations for UF(k) in Equations (1) and (2).
The possible abrupt change may alter the relationships between the annual flood and the subtype floods. A Pearson correlation analysis was employed to assess the potential changes in correlations between the annual flood frequency and the frequencies of the subtype floods. The analysis was performed for three periods: the periods before and after the possible abrupt change point of annual flood frequency and the entire period 1949–2009.

3. Results

3.1. Monthly Flood Frequencies and Their Trends

Figure 3 shows the monthly flood frequencies in Shanghai between 1949 and 2009. In total, the NFDS registered 146 floods. More than 20 floods occurred in each month between June and September, among which floods occurred most in August by 51 times (Figure 3b). A sum of 134 floods occurred in the four months, which comprised 92% of the total floods registered by NFDS. In contrast, floods only occurred seven times in May and less in other months; no floods occurred in December, January, February, and March.
Figure 3. Stacked monthly flood frequencies per year (a) and the overall histogram (b) in Shanghai between 1949 and 2009.
Water 07 01808 g003
The monthly floods had different monotonic trends (Table 2). The MK Z statistics were zero for all monthly floods in December, January, February, and March, which meant no identified trends. They were between −0.12 and −0.23 for monthly floods in April and May, which indicated insignificant decreasing trends. The Z statistics were 2.47, 4.09, and 4.83 for monthly floods in June, July, and August, respectively. All of these numbers indicated significant increasing trends at the confidence level of 99% in floods in the three most flood-prone months. The Z statistics were between 0.19 and 0.53 for monthly floods in September, October, and November, indicating insignificant increasing trends of floods in the three months.

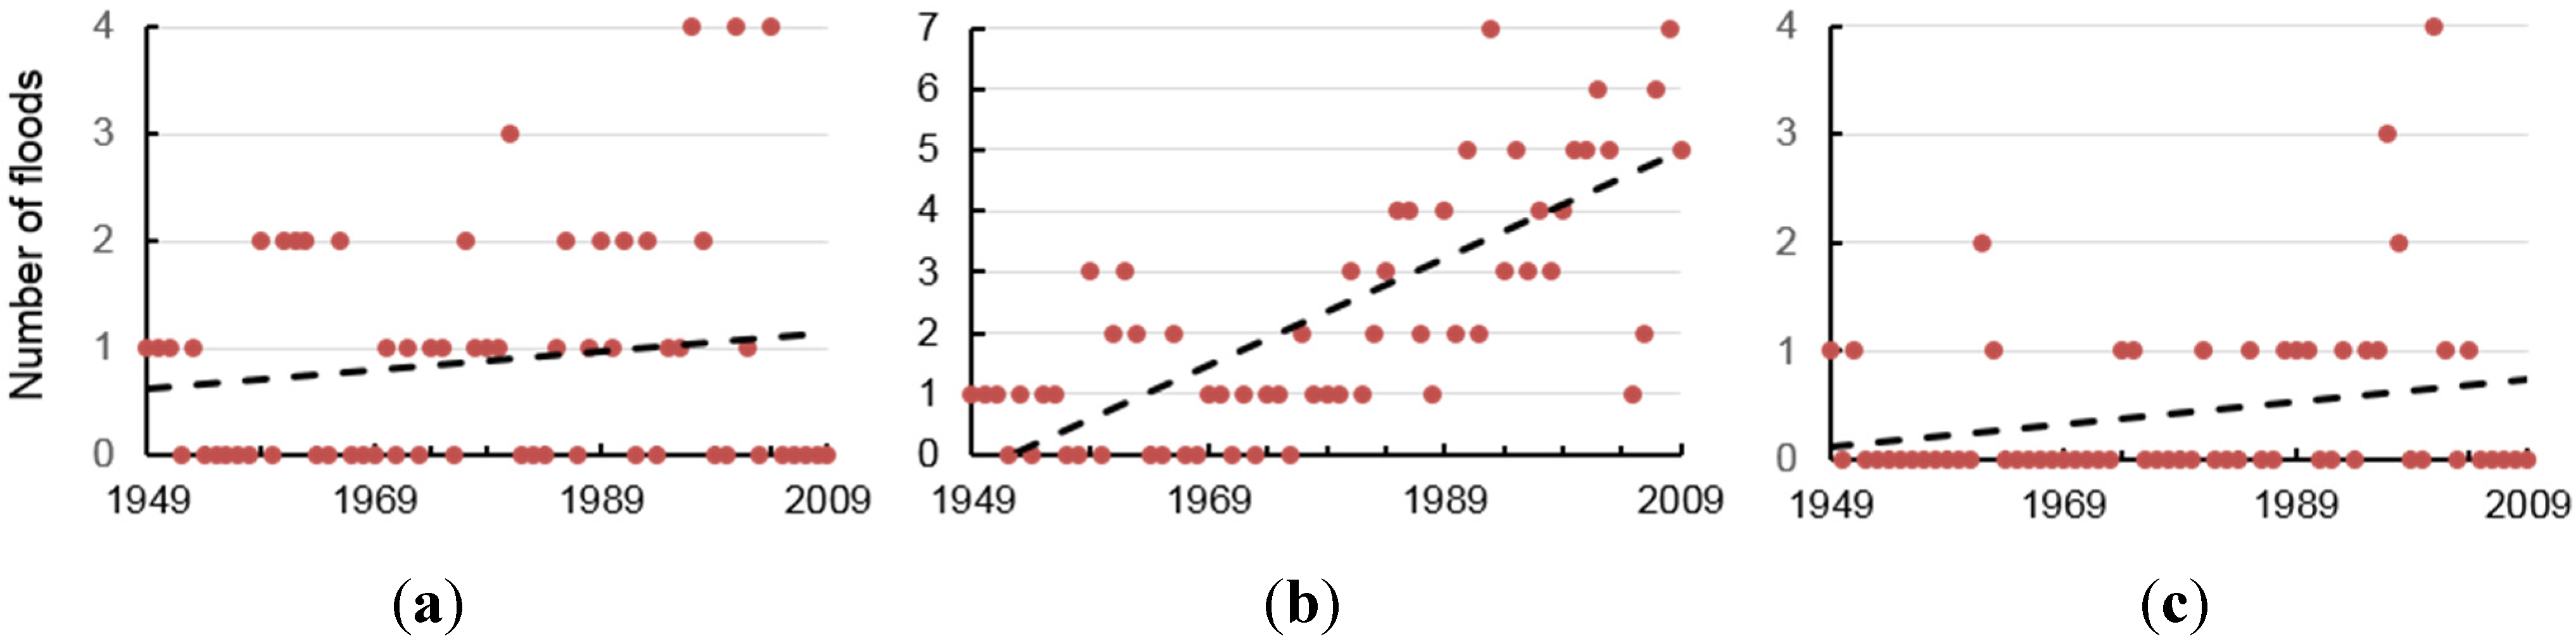
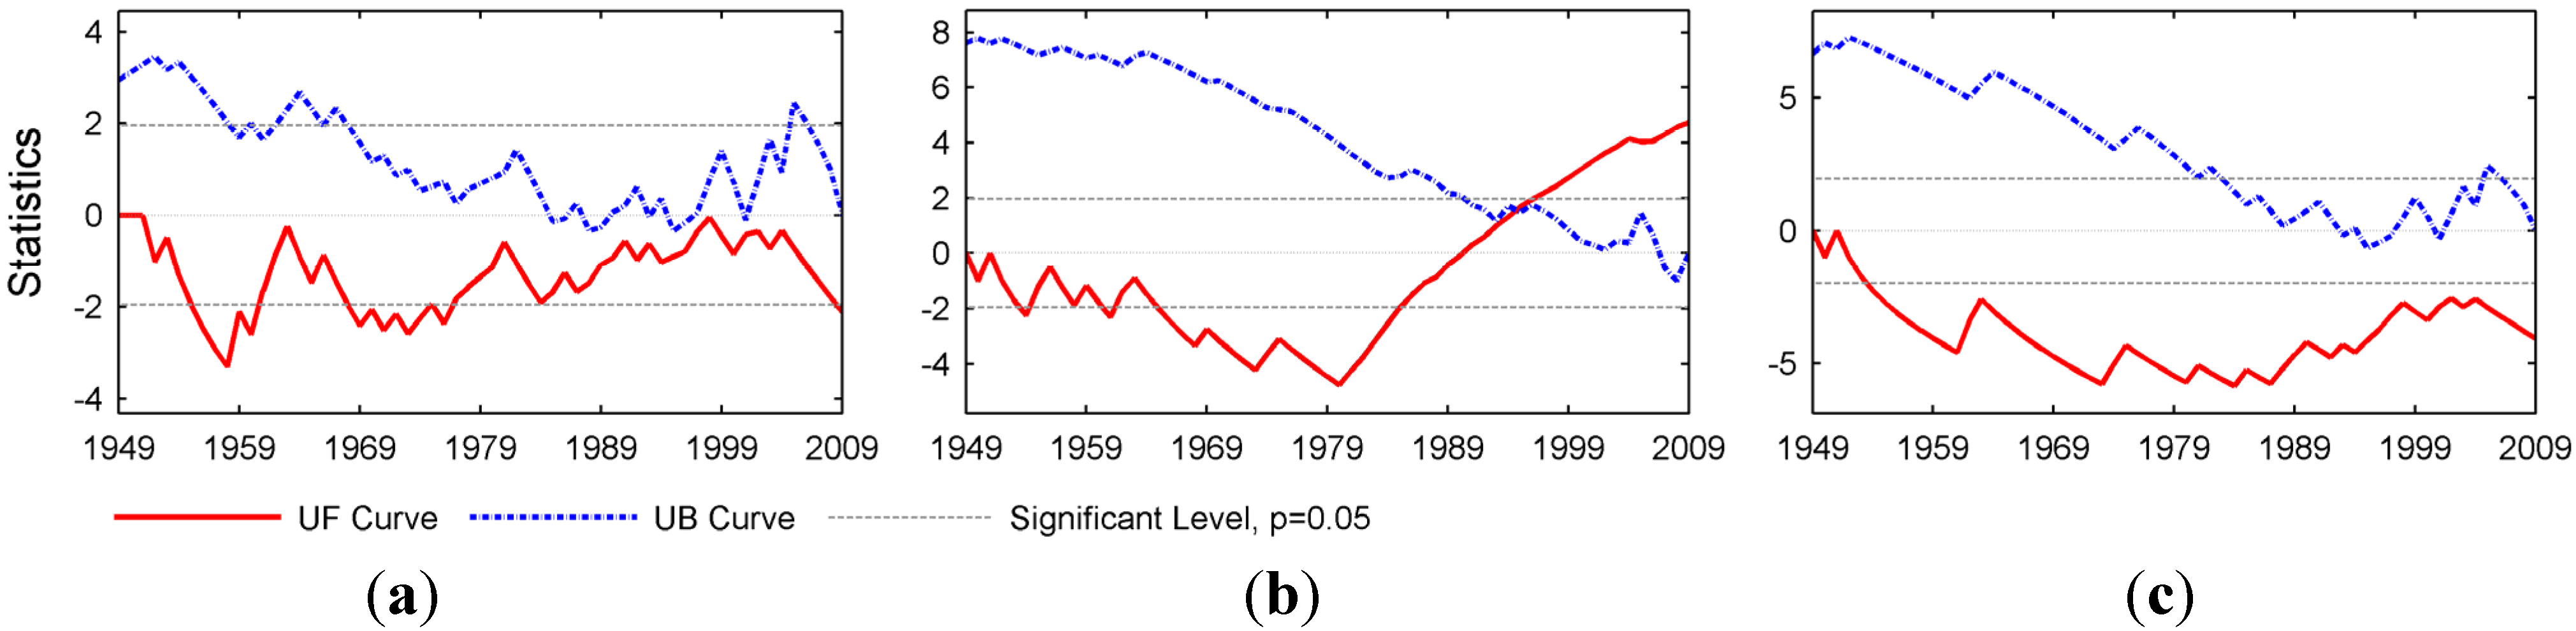
3.2. Trend of Annual Flood Frequency

NFDS registered only eight floods over the decade 1949–1958; however, this number rose by more than six times to 52 over the decade 2000–2009 (Figure 3). The MK Z statistic was 5.87 for annual flood (Table 2), which indicated an increasing trend in the annual flood frequency over the period 1949–2009. The trend was significant at the confidence level of 99%. Figure 4a shows the result of the MK abrupt change test for annual flood to detect potential abrupt changes over the period 1949–2009. An intersection point between UF and UB curves was detected in 1988 and it was in the confidence zone. The annual flood frequency thus experienced an abrupt change at 1988 and it was significant at the confidence level of 95%. Before the abrupt change point, the annual flood frequency did not increase significantly at the confidence level of 95% (UF statistic <1.96); it even decreased during 1966–1983 as the UF statistic was below zero over that period. After 1988, however, the UF statistic exceeded 1.96, which meant a significant increasing trend at the confidence level of 95%.
Table 2. MK Z statistics for monthly floods, annual flood, and subtype floods.
VariablesZ StatisticVariablesZ Statistic
Monthly floods (December–March)0Annual flood5.87 **
Monthly floods (April & May)−0.12–−0.23Overbank flood−1.38
Monthly flood (June)2.47 **Waterlogging5.99 **
Monthly flood (July)4.09 **Agricultural waterlogging0.42
Monthly flood (August)4.83 **Urban waterlogging6.17 **
Monthly floods (September–November)0.19–0.53Mixed waterlogging1.29
Notes: * p = 0.05 (two-tailed test); ** p = 0.01 (two-tailed test).
Figure 4. MK test for annual flood (a); overbank flood (b); and waterlogging (c).
Water 07 01808 g004

3.3. Trends of Subtype Floods

Overbank flood and waterlogging had different trends over the period 1949–2009 (Figure 5). Overbank flood occurred 12 times over this period. It occurred eight times between 1949 and 1963. After 1963, it only occurred four times in 1974, 1981, 1991, and 1997 and did not occur over the period 1998–2009. The MK Z statistic for overbank flood over 1949–2009 was −1.38, indicating a decreasing trend that was insignificant at the confidence level of 95%. Moreover, Figure 4b shows that overbank flood did not have a significant abrupt change point. By contrast, the MK Z statistic was 5.99 for waterlogging, showing a significant increasing trend at the confidence level of 99%. Six waterlogging events occurred over the decade 1949–1958 whilst the number rose by nearly nine times to 52 over the decade 2000–2009. Waterlogging had an abrupt change point at 1988 and it was significant at the confidence level of 95% (Figure 4c). Before the abrupt change point, waterlogging did not increase significantly at the confidence level of 95% (UF statistic < 1.96); it even decreased during 1959–1983 as the UF statistic was below zero. After 1988, however, the UF statistic exceeded 1.96, which is the 95% confidence level for a significant increasing trend.
Figure 5. Trends of overbank flood (a) and waterlogging (b) in Shanghai.
Water 07 01808 g005
The three subtypes of waterlogging had different trends over the period 1949–2009 (Figure 6). Agricultural waterlogging, mixed waterlogging, and urban waterlogging occurred 54, 26, and 114 times during 1949–2009, respectively. The MK Z statistics were 0.42, 1.29, and 6.17 for the three sub-types of waterlogging, respectively. Agricultural waterlogging and mixed waterlogging had insignificant increasing trends at the confidence level of 95%. In contrast, urban waterlogging had a significant increasing trend at the confidence level of 99%. Figure 7 shows that urban waterlogging had a significant abrupt change at 1995 at the confidence level of 95% while agricultural waterlogging and mixed waterlogging did not have an abrupt change point.
Figure 6. Trends of agricultural waterlogging (a); urban waterlogging (b); and mixed waterlogging (c).
Water 07 01808 g006
Figure 7. MK test for agricultural waterlogging (a); urban waterlogging (b); and mixed waterlogging (c).
Water 07 01808 g007

3.4. Correlations between Annual Flood and Subtype Floods

Annual flood frequency experienced an abrupt change at 1988 as shown by the MK test in Figure 4. Its relationships with the subtype floods were also different for the periods before and after the abrupt change year (Table 3). During 1949–1987, the annual flood frequency significantly correlated with all the flood subtypes. In this period, annual flooding had the highest correlation coefficient with waterlogging, which was 0.97 and significant at the confidence level of 99%. Urban waterlogging and agricultural waterlogging had the second and third highest correlation coefficients with annual flooding; both the correlations were significant at the confidence level of 99%. Overbank flooding also had a strong correlation coefficient with annual flooding that was significant at the confidence level of 99%. Mixed waterlogging had a relatively weaker correlation with annual flooding (R = 0.35), but this correlation was still significant at the confidence level of 95%.
Table 3. Correlation coefficients between annual flood and subtype floods among the three periods.
Variables1949–19871988–20091949–2009
Overbank flood0.42 **0.070.03
Waterlogging0.97 **1.00 **0.99 **
Agricultural waterlogging0.66 **0.370.46 **
Urban waterlogging0.73 **0.93 **0.93 **
Mixed waterlogging0.35 *0.060.33 **
Notes: * p = 0.05 (two-tailed test); ** p = 0.01 (two-tailed test).
The correlations changed after 1987. During 1988–2009, annual flooding correlated significantly with waterlogging and urban waterlogging at the confidence level of 99%. The correlation coefficients increased from 0.97 and 0.73 over 1949–1987 to 1.00 and 0.93 over 1988–2009, respectively. In contrast, annual flood’s correlation coefficients with overbank flood, agricultural waterlogging, and mixed waterlogging decreased from 0.42, 0.66, and 0.35 over 1949–1987 to 0.07, 0.37, and 0.06 over 1988–2009, respectively; all three relationships were not significant anymore in the later period at the confidence level of 95%. For the entire period 1949–2009, annual flood significantly correlated with waterlogging and all three subtypes of waterlogging at the confidence level of 99%. Meanwhile, it did not correlate significantly with overbank flood.

4. Discussion

The NFDS mainly aims to investigate Shanghai’s flood pattern over months and over years and to analyze the possible implications for flood management. This database covers five major items, namely time, location, damages, triggering factors, and types. However, information on location and damages is inconsistent and incomplete because many reports only gave vague descriptions of where the floods occurred and how much damage there was. This study thus focuses on flood frequencies and mainly investigates the flood information in terms of time, triggering factors, and types. The time item is used for analyzing flood frequency and for relating flood events to precipitation and tide for calibration. Although the items of location and damages are only employed in database calibration, they would be important in updating the database for a more comprehensive study. Moreover, this study did not set thresholds for the entry of events into the database and for the classification of floods into different magnitude, e.g., serious, moderate, and slight. With more accurate damage information, future studies could investigate the sensitivity of the developed database to thresholds and develop a more reliable flood database.
The development of NFDS shows that calibration is an indispensable procedure for a reliable flood database. The calibration procedure identified and rectified both commission errors and omission errors. Commission errors mainly resulted from wrong interpretation of reports on untargeted typhoons, astronomical tides, and misclassification from strong-wind induced disasters to floods. There are two major reasons for the commission errors. First, newspaper reports are unstructured information as they convert original messages into ones that can be easily digested, understood, and, where appropriate, acted upon by the public [25]. Developing a flood database from this unstructured newspaper information is thus a process of information conversion [5], and with this process likely follows commission errors. Second, the complexity of the disaster system challenges the efforts to identify floods from reports on occurrences and damages by hydro-meteorological events [19,20]. Regarding the hydro-meteorological conditions in Shanghai, unusual upstream flow, strong convective weather, typhoons, and astronomical tide are the four vital factors that can cause flooding [38,43]. However, reports on them are not equal to floods because (1) the factors may be not strong enough to cause flood damages and (2) strong convective weather and typhoons may cause damage only by means of strong wind rather than by flooding.
On the other hand, omission errors seem nearly unavoidable because developing a flood database from a newspaper archive involves time-consuming procedures. A complete archive of 60 years of daily newspapers contains more than 21,000 hard copies and manually interpreting them is thus exhausting work that challenges an accurate flood database. Overlooking a number of real floods, especially the small-scale ones, seems nearly unavoidable. Calibration of commission errors and omission errors is therefore indispensable for a reliable flood database. In spite of those errors, newspapers provided 30% more information than governmental reports. Newspapers are thus an important data source for studying flood risk in Shanghai. As large-scale databases like EM-DAT do not provide flood profiles for cities [3], other cities could also employ the methodology in this study to develop their flood databases.
The NFDS provides valuable information on historical floods in Shanghai over the period 1949–2009. It reveals floods’ monthly distribution pattern. Previous studies empirically proposed the five months May–September as the flood-prone season [38,44,54]. The NFDS gives the exact number of floods for each month and indicates that the four months June–September should be regarded as the flood-prone season. More than 20 floods occurred in each of the four flood-prone months while seven occurred in May and fewer in other months. Authorities for flood management should pay more attention to the four most flood-prone months. Moreover, the MK trend test revealed that flood frequencies have increased significantly over 1949–2009 in the three most flood-prone months—namely June, July, and August, which would challenge the flood management in Shanghai.
The MK trend test and abrupt change test revealed that annual flood frequency has increased significantly over 1949–2009 and had witnessed an abrupt change around 1988. Among the subtype floods, only waterlogging (urban waterlogging) has both a significant increasing trend and abrupt change. Overbank is the only flood subtype that has a relatively strong decreasing trend; agricultural waterlogging and mixed waterlogging show a very slight increasing trend by MK trend test. Additionally, Pearson correlation analysis uncovered the fact that the relationships of the three flood subtypes with annual flood changed from significant correlations during 1949–1987 to insignificant correlations during 1988–2009. In contrast, urban waterlogging’s correlation with annual flood was much enhanced from the period 1949–1987 to the period 1988–2009. Therefore, MK tests are important tools for revealing the monotonic trends and abrupt changes in annual flood frequency and flood subtype frequencies. Correlation analysis could help to detect changes in the relationships between flood frequencies before and after the abrupt change year.
Several factors can influence flood frequency, e.g., variation in precipitation and typhoon, sea level rise, land subsidence, urbanization, upstream floods, and flood management [38,39,40,55]. The different trends of monthly floods are likely due to inter-annual and inter-month variations of precipitation and typhoons. The reasons for the abrupt change in annual flood frequency may be more complex. Because of the complexity of the hydro-meteorological system [56], an exhaustive investigation of these reasons is beyond the scope of a single paper. Future studies could employ more hydro-meteorological data to investigate the factors driving the changes in annual and monthly floods. Regional flood frequency analysis may provide important tools for such studies [57]. Although the influencing factors vary from one flood subtype to another [39,40,54,58], an important reason for these different changes probably lies in flood management.
The decreasing trend of overbank flood is likely because of the building and improvement of seawalls and river levees [38,39]. The coastal seawalls and Huangpu River’s levees were in poor condition due to war damage and insufficient maintenance before 1949 [43]. From the early 1950s, the seawalls and river levees have been repaired, constructed, and improved several times. Currently, Shanghai has high-level seawalls and river levees, both of which are more than 500 km. All the seawalls can withstand a 1/100 per year storm surge plus a strong typhoon. More than half of levees along Huangpu River can withstand a 1/1000 per year storm surge [38,39]. Most of these constructions were finished in the early 1990s [38,39]. Additionally, a tide gate was constructed at Suzhou River estuary in 1991, which can withstand a 1/1000 per year storm surge [38]. Agricultural drainage capacity has also been improved massively by building pumping stations and by upgrading dredged river-based agricultural drainage system during the past decades [38,43,59]. By the 1990s, 51% of the farmlands had already been able to withstand a 1/10 per year waterlogging and 30% of farmlands had been able to withstand a 1/5 per year waterlogging [38]. Those massive constructions explain the decreasing trend of overbank flood and the slightly increasing trend of agricultural waterlogging over 1949–2009.
In contrast, Shanghai has not yet upgraded its urban drainage system sufficiently, which increases the risk of urban waterlogging. Shanghai’s urban drainage system has three components: rivers-based drainage system, pipe system, and pumping stations. Up to the present, however, Shanghai’s drainage system has only been able to withstand waterlogging by a one-year return period storm-rainfall in the city center and by a half-year return period storm-rainfall in the newly urbanized suburban areas [42,60]. The insufficient drainage system makes urban waterlogging a frequent disaster, which causes widespread damage and disruption to Shanghai [58]. Additionally, rapid urbanization and other factors also probably contributed to the increasing urban waterlogging. The urban area increased by 35 times from 86 km2 in 1949 to 2968 km2 in 2009 [38,61], which increases the impervious surface rate and runoff coefficient and in turn challenges the urban drainage system [38,42,61]. It seems that such challenges have not been considered sufficiently in urban planning and drainage system design.

5. Conclusion

This study developed a newspaper-based flood database for Shanghai (NFDS) for the period 1949–2009. A calibration procedure rectified both commission errors and omission errors. Because considerable newspapers did not report the exact location and damages of floods, this study mainly employed the registered flood frequencies for statistically analyzing the seasonal pattern and inter-annual changes in floods. More quantitative information on floods’ location and damages would enable a more comprehensive investigation of floods in Shanghai. However, this study still revealed convincing findings concerning flood frequencies through Mann-Kendall tests and Pearson correlation analysis. First, June–September witnessed 92% of the total floods registered by NFDS. Second, annual flooding and the monthly floods in the three most flood-prone months, June–August, increased significantly over 1949–2009. Third, urban waterlogging had a strong increasing trend, whereas overbank flood had a decreasing trend and agricultural waterlogging had a slightly increasing trend. These findings strongly suggested that Shanghai should pay attention to the changes in flood frequencies and particularly should shift its countermeasures for efficiently reducing the occurrence of urban waterlogging. Future studies could help to investigate the driving factors for the changes in Shanghai’s floods.

Acknowledgments

This research is supported by the National Natural Science Foundation of China (Grant No. 41401603 and No. 41201548).

Author Contributions

Jiahong Wen and Shiqiang Du designed this study. Ke Chen and Honghuan Gu were responsible for newspaper scanning and database development, which were supervised by Jiahong Wen. Shiqiang Du calibrated the database and carried out the statistical analyses. Shiqiang Du, Honghuan Gu and Anton Van Rompaey drafted the manuscript, which was revised by all authors.

Conflicts of Interest

The authors declare no conflict of interest.

References

  1. Stoermberg, D. Natural disasters, economic development, and humanitarian aid. J. Econ. Perspect. 2007, 21, 199–222. [Google Scholar] [CrossRef]
  2. Dunbar, P.K. Increasing public awareness of natural hazards via the Internet. Nat. Hazards 2007, 42, 529–536. [Google Scholar]
  3. Guha-Sapir, D.; Below, R.; Hoyois, P. EM-DAT: International Disaster Database; Université Catholique de Louvain: Brussels, Belgium, 2015. [Google Scholar]
  4. Shi, P.J.; Jaeger, C.; Ye, Q. Integrated Risk Governance—Science Plan and Case Studies of Large-Scale Disasters; Springer: Berlin, Germany; Beijing Normal University Press: Beijing, China, 2012. [Google Scholar]
  5. Barnolas, M.; Llasat, M.C. A flood geodatabase and its climatological applications: The case of Catalonia for the last century. Nat. Hazard Earth Sys. 2007, 7, 271–281. [Google Scholar]
  6. Shi, P.; Wang, J.A.; Yang, M.; Chen, J.; Pan, Y.; Wang, P.; Fang, W.; Zhou, W.; Wang, Y.; Yuan, Y.; et al. Understanding of natural disaster database design and compilation of digital atlas of natural disasters in China. Geogr. Inf. Sci. 2000, 6, 153–158. [Google Scholar]
  7. Zezere, J.L.; Pereira, S.; Tavares, A.O.; Bateira, C.; Trigo, R.M.; Quaresma, I.; Santos, P.P.; Santos, M.; Verde, J. DISASTER: A GIS database on hydro-geomorphologic disasters in Portugal. Nat. Hazards 2014, 72, 503–532. [Google Scholar] [CrossRef]
  8. Devoli, G.; Strauch, W.; Chavez, G.; Hoeg, K. A landslide database for Nicaragua: A tool for landslide-hazard management. Landslides 2007, 4, 163–176. [Google Scholar] [CrossRef]
  9. Du, S.; van Rompaey, A.; Shi, P.; Wang, J.A. A dual effect of urban expansion on flood risk in the Pearl River Delta (China) revealed by land-use scenarios and direct runoff simulation. Nat. Hazards 2015, 2015, 1–18. [Google Scholar]
  10. Van den Honert, R.C.; McAneney, J. The 2011 brisbane floods: Causes, impacts and implications. Water 2011, 3, 1149–1173. [Google Scholar]
  11. Hilker, N.; Badoux, A.; Hegg, C. The Swiss flood and landslide damage database 1972–2007. Nat. Hazard Earth Syst. 2009, 9, 913–925. [Google Scholar] [CrossRef]
  12. Kron, W.; Steuer, M.; Loew, P.; Wirtz, A. How to deal properly with a natural catastrophe database—Analysis of flood losses. Nat. Hazard Earth Syst. 2012, 12, 535–550. [Google Scholar] [CrossRef]
  13. Global Risk Information Platform. Disaster Databases. Available online: http://174.122.150.229/~gripwebo/gripweb/?q=disaster-database (accessed on 5 January 2015).
  14. Rashid, H. Interpreting flood disasters and flood hazard perceptions from newspaper discourse Tale of two floods in the Red River valley, Manitoba, Canada. Appl. Geogr. 2011, 31, 35–45. [Google Scholar] [CrossRef]
  15. Rasid, H.; Duffy, K.; Steuck, J. Floodplain Management in La Crosse, Wisconsin: Newspaper discourse vs. floodplain residents’ preferences. Focus Geogr. 2008, 51, 7–16. [Google Scholar] [CrossRef]
  16. Rowe, G.; Frewer, L.; Sjöberg, L. Newspaper reporting of hazards in the UK and Sweden. Public Underst. Sci. 2000, 9, 59–78. [Google Scholar] [CrossRef] [PubMed]
  17. Tropeano, D.; Turconi, L. Using historical documents for landslide, debris flow and stream flood prevention. Applications in Northern Italy. Nat. Hazards 2004, 31, 663–679. [Google Scholar] [CrossRef]
  18. Wang, J.A.; Wang, Y.; Huang, X.X.; Fang, W.H.; Zhou, J.H.; Wang, L. Chinese flood patterns in diffrent periods since the middle of the 18th century (in Chinese). J. Nat. Disasters 2001, 2001, 1–7. [Google Scholar]
  19. Tschoegl, L.; Below, R.; Guha-Sapir, D. An Analytical Review of Selected Data Sets on Natural Disasters and Impacts; Centre for Research on the Epidemiology of Disasters: Brussels, Belgium, 2006. [Google Scholar]
  20. Wirtz, A.; Kron, W.; Low, P.; Steuer, M. The need for data: natural disasters and the challenges of database management. Nat. Hazards 2014, 70, 135–157. [Google Scholar] [CrossRef]
  21. La-Red. The Challenge of Information Sources. Available online: http://www.desinventar.net/data_sources.html (accessed on 14 January 2015).
  22. Dos Santos, P.P.; Tavares, A.O.; Zezere, J.L. Risk analysis for local management from hydro-geomorphologic disaster databases. Environ. Sci. Policy 2014, 40, 85–100. [Google Scholar]
  23. Wang, W.; Wang, J. The distributive pattern of hail disasters based on three data sources in China. Geogr. Res. 2001, 20, 380–387. (in Chinese). [Google Scholar]
  24. Jimenez, J.A.; Sancho-Garcia, A.; Bosom, E.; Valdemoro, H.I.; Guillen, J. Storm-induced damages along the Catalan coast (NW Mediterranean) during the period 1958–2008. Geomorphology 2012, 143, 24–33. [Google Scholar] [CrossRef]
  25. McCarthy, M.; Brennan, M.; De Boer, M.; Ritson, C. Media risk communication—What was said by whom and how was it interpreted. J. Risk Res. 2008, 11, 375–394. [Google Scholar] [CrossRef]
  26. Needham, R.D.; Nelson, J.G. Newspaper response to flood and erosion hazards on the North Lake Erie shore. Environ. Manag. 1977, 1, 521–540. [Google Scholar] [CrossRef]
  27. Pasquare, F.; Pozzetti, M. Geological hazards, disasters and the media: The Italian case study. Quat. Int. 2007, 173, 166–171. [Google Scholar] [CrossRef]
  28. Wakefield, S.E.L.; Elliott, S.J. Constructing the news: The role of local newspapers in environmental risk communication. Prof. Geogr. 2003, 55, 216–226. [Google Scholar]
  29. Sood, B.R.; Stockdale, G.; Rogers, E.M. How the news media operate in natural disasters. J. Commun. 1987, 37, 27–41. [Google Scholar] [CrossRef]
  30. Wilkins, L.; Patterson, P. Risk analysis and the construction of news. J. Commun. 1987, 37, 80–92. [Google Scholar] [CrossRef]
  31. Shi, P. Atlas of Natural Disaster System of China; China Science Press: Beijing, China, 2003. [Google Scholar]
  32. Miah, M.D.; Kabir, M.H.; Koike, M.; Akther, S. Major climate-change issues covered by the daily newspapers of Bangladesh. Environmentalist 2011, 31, 67–73. [Google Scholar] [CrossRef]
  33. Papagiannaki, K.; Lagouvardos, K.; Kotroni, V. A database of high-impact weather events in Greece: A descriptive impact analysis for the period 2001–2011. Nat. Hazard Earth Syst. 2013, 13, 727–736. [Google Scholar] [CrossRef]
  34. Llasat, M.C.; Llasat-Botija, M.; Barnolas, M.; Lopez, L.; Altava-Ortiz, V. An analysis of the evolution of hydrometeorological extremes in newspapers: The case of Catalonia, 1982–2006. Nat. Hazard Earth Syst. 2009, 9, 1201–1212. [Google Scholar] [CrossRef]
  35. Llasat, M.C.; Llasat-Botija, M.; Lopez, L. A press database on natural risks and its application in the study of floods in Northeastern Spain. Nat. Hazard Earth Syst. 2009, 9, 2049–2061. [Google Scholar] [CrossRef]
  36. Balica, S.F.; Wright, N.G.; Meulen, F. A flood vulnerability index for coastal cities and its use in assessing climate change impacts. Nat. Hazards 2012, 64, 73–105. [Google Scholar] [CrossRef]
  37. Hallegatte, S.; Green, C.; Nicholls, R.J.; Corfee-Morlot, J. Future flood losses in major coastal cities. Nat. Clim. Change 2013, 3, 802–806. [Google Scholar] [CrossRef]
  38. Yuan, Z. Floods and Drought in Shanghai; Hohai University Press: Nanjing, China, 1999. (in Chinese) [Google Scholar]
  39. Wang, J.; Gao, W.; Xu, S.; Yu, L. Evaluation of the combined risk of sea level rise, land subsidence, and storm surges on the coastal areas of Shanghai, China. Clim. Change 2012, 115, 537–558. [Google Scholar] [CrossRef]
  40. Yin, J.; Yu, D.; Yin, Z.; Wang, J.; Xu, S. Modelling the combined impacts of sea-level rise and land subsidence on storm tides induced flooding of the Huangpu River in Shanghai, China. Clim. Change 2013, 119, 919–932. [Google Scholar] [CrossRef]
  41. Cheng, J.; Yang, K.; Zhao, J.; Yuan, W.; Wu, J.-P. Variation of river system in center district of Shanghai and its impact factors during the last one hundred years (in Chinese). Sci. Geogr. Sin. 2007, 27, 85–91. [Google Scholar]
  42. Wu, X.; Yu, D.; Chen, Z.; Wilby, R. An evaluation of the impacts of land surface modification, storm sewer development, and rainfall variation on waterlogging risk in Shanghai. Nat. Hazards 2012, 63, 305–323. [Google Scholar] [CrossRef]
  43. Xu, Q. History of Hydraulic Projects in Shanghai; Shanghai Academy of Social Sciences press: Shanghai, China, 1997. (in Chinese) [Google Scholar]
  44. Wen, K. Meteorological Disasters in China; China Meteorological Press: Beijing, China, 2006. (in Chinese) [Google Scholar]
  45. Xu, Y.M. Yearbook of Meterological Disasters in Shanghai; China Meteorological Press: Beijing, China, 2010. (in Chinese) [Google Scholar]
  46. Van Westen, C. Multi Hazard Risk Assessment: Distance Education Course Guide Book; International institute for Geo-Information Science and Earth Observation: Enschede, The Netherlands, 2009. [Google Scholar]
  47. Malik, A.I.; Colmer, T.D.; Lambers, H.; Setter, T.L.; Schortemeyer, M. Short-term waterlogging has long-term effects on the growth and physiology of wheat. New Phytol. 2002, 153, 225–236. [Google Scholar] [CrossRef]
  48. Dennis, E.S.; Dolferus, R.; Ellis, M.; Rahman, M.; Wu, Y.; Hoeren, F.U.; Grover, A.; Ismond, K.P.; Good, A.G.; Peacock, W.J. Molecular strategies for improving waterlogging tolerance in plants. J. Exp. Bot. 2000, 51, 89–97. [Google Scholar] [CrossRef] [PubMed]
  49. Kendall, M.G. Rank Correlation Methods; Griffin: Oxford, UK, 1948. [Google Scholar]
  50. Mann, H.B. Nonparametric tests against trend. J. Econ. Soc. 1945, 1945, 245–259. [Google Scholar]
  51. Ishak, E.H.; Rahman, A.; Westra, S.; Sharma, A.; Kuczera, G. Evaluating the non-stationarity of Australian annual maximum flood. J. Hydrol. 2013, 494, 134–145. [Google Scholar] [CrossRef]
  52. Hamed, K.H. Trend detection in hydrologic data: The Mann-Kendall trend test under the scaling hypothesis. J. Hydrol. 2008, 349, 350–363. [Google Scholar] [CrossRef]
  53. Zhang, Q.; Liu, C.L.; Xu, C.Y.; Xu, Y.P.; Jiang, T. Observed trends of annual maximum water level and streamflow during past 130 years in the Yangtze River basin, China. J. Hydrol. 2006, 324, 255–265. [Google Scholar] [CrossRef]
  54. Quan, R. Risk assessment of flood disaster in Shanghai based on spatial-temporal characteristics analysis from 251 to 2000. Environ. Earth Sci. 2014, 72, 4627–4638. [Google Scholar] [CrossRef]
  55. Zhang, Q.; Peng, J.T.; Xu, C.Y.; Singh, V.P. Spatiotemporal variations of precipitation regimes across Yangtze River Basin, China. Theor. Appl. Climatol. 2014, 115, 703–712. [Google Scholar] [CrossRef]
  56. Du, S.; Shi, P.; Van Rompaey, A.; Wen, J. Quantifying the impact of impervious surface location on flood peak discharge in urban areas. Nat. Hazards 2015, 2015, 1–15. [Google Scholar]
  57. Haddad, K.; Rahman, A.; Stedinger, J.R. Regional flood frequency analysis using Bayesian generalized least squares: A comparison between quantile and parameter regression techniques. Hydrol. Process. 2012, 26, 1008–1021. [Google Scholar] [CrossRef]
  58. Shi, Y.; Shi, C.; Xu, S.Y.; Sun, A.L.; Wang, J. Exposure assessment of rainstorm waterlogging on old-style residences in Shanghai based on scenario simulation. Nat. Hazards 2010, 53, 259–272. [Google Scholar] [CrossRef]
  59. Yu, X.G.; Zhang, W. Natural hazards and social development in Shanghai (in Chinese). Fudan J. Soc. Sci. 2002, 5, 59–67. [Google Scholar]
  60. Yin, Z.; Yin, J.; Xu, S.; Wen, J. Community-based scenario modelling and disaster risk assessment of urban rainstorm waterlogging. J. Geogr. Sci. 2011, 21, 274–284. [Google Scholar] [CrossRef]
  61. Yin, J.; Yin, Z.; Zhong, H.; Xu, S.; Hu, X.; Wang, J.; Wu, J. Monitoring urban expansion and land use/land cover changes of Shanghai metropolitan area during the transitional economy (1979–2009) in China. Environ. Monit. Assess. 2011, 177, 609–621. [Google Scholar] [CrossRef] [PubMed]

