Article

A Fuzzy Logic-Based Approach for Estimation of Dwelling Times of Panama Metro Stations

by
Aranzazu Berbey Alvarez
1,3,*,
Fernando Merchan
1,3,†,
Francisco Javier Calvo Poyo
2,3 and
Rony Javier Caballero George
1,3,†
1
Facultad de Ingeniería Eléctrica, Universidad Tecnológica de Panamá, Campus Dr. Víctor Levi Sasso, Edificio N 1, 0819-07289 Panamá, Panamá,
2
Universidad de Granada, Escuela de Ingenieros de Caminos, Canales y Puertos, Laboratorio de Infraestructura y Transporte, calle Severo Ochoa, 18071 Granada, Spain
3
Panama Railway Engineering Research Group (PRERG), Universidad Tecnológica de Panamá, 0819-07289 Panamá, Panamá
*
Author to whom correspondence should be addressed.
These authors contributed equally to this work.
Entropy 2015, 17(5), 2688-2705; https://doi.org/10.3390/e17052688
Submission received: 30 November 2014 / Revised: 10 April 2015 / Accepted: 21 April 2015 / Published: 27 April 2015
(This article belongs to the Special Issue Entropy in Bioinspired Intelligence)

Abstract

:
Passenger flow modeling and station dwelling time estimation are significant elements for railway mass transit planning, but system operators usually have limited information to model the passenger flow. In this paper, an artificial-intelligence technique known as fuzzy logic is applied for the estimation of the elements of the origin-destination matrix and the dwelling time of stations in a railway transport system. The fuzzy inference engine used in the algorithm is based in the principle of maximum entropy. The approach considers passengers’ preferences to assign a level of congestion in each car of the train in function of the properties of the station platforms. This approach is implemented to estimate the passenger flow and dwelling times of the recently opened Line 1 of the Panama Metro. The dwelling times obtained from the simulation are compared to real measurements to validate the approach.

Graphical Abstract

1. Introduction

The line capacity in mass transit systems and high-frequency use subways is a function of several parameters including dwelling time of the stations, line speed and train acceleration [1]. The estimation of dwelling time of stations is critical for an acceptable railway timetable planning [2]. For instance, the maximum dwelling time fixes the minimum required separation or headway between trains and defines the maximum frequency and capacity of a line.
Harris and Anderson [1,3] proposed and validated an expression to estimate the dwelling time. This expression depends on variables obtained from the origin-destination (OD) matrix. Usually, railway operators have only partial information of this matrix, namely the so-called boarding and alighting vectors. From this limited information, passenger flow modeling is carried out to infer the unknown elements of the matrix to be able to estimate the dwelling time.
Several passenger flow models have been proposed to estimate the dwelling time [112]. This is not a trivial task given that the passenger flow in the different boarding and alighting zones is not homogeneous [3,11]. Some approaches model the passenger boarding and alighting process [1,3,6]. In [9,12], the authors use space-state approaches to estimate the passenger flow for traffic control applications. Xu et al. [10] developed a probabilistic approach to describe the distribution of the lines in the platforms using queueing and Markov theory and taking into account the geometry of the platform.
It has been proved that passenger flow is not only a function of the geometry and position of the facilities on the platform, but also of the user behavior and the interactions of different type of users sharing a reduced space. Thus, some authors have considered pedestrian behavior modeling to estimate platform flow and congestion. Zhang et al. [6] presented a cellular automata model for the alighting and boarding of passenger in Beijing metro stations and addressed passengers interactions and interference. One promising alternative to model passenger behavior and flow is the use of fuzzy logic given that it allows one to take into account the expertise of the railway planner and behavioral aspects of passengers [4,7,13].
This work presents the analysis and validation of an artificial-intelligence approach based on fuzzy logic to estimate the OD matrix and the dwelling time using the Panama Metro as a case study. In [14], some of the authors presented the initial version of this approach for the estimation of the passenger flow. The algorithm aimed to infer the elements of the OD matrix provided the alighting and boarding vectors and some knowledge about the congestion or demand levels of the station. Five levels of demand are assigned to each station in function of the knowledge of the operator. A fuzzy interference engine iteratively estimates the elements of the OD matrix based on the levels assigned to each station using the principle of maximum entropy. In [15], the authors consider an extended version of the OD matrix, including information of each car of the train. In this version of the algorithm, three levels of demand are assigned to each car of the trains in function of the preference of passengers for a given configuration of the platform geometry, access and location of facilities at each station. This information was used in a modified version of the dwelling time expression presented in [1,3] to obtain the time required for each car. The algorithm was tested in a small hypothetical model with only two stations. In [16], the algorithm was tested in a real scenario, a six station section of Line 1 of the Panama Metro. In this paper, the proposed approach is used to estimate the passenger flow and dwelling time in 13 stations of Line 1 of the Panama Metro. Also new criteria to assign the demand levels are included. In this work the following analysis are presented:
  • Comparison between estimated dwelling time and real measurements.
  • Influence of line operation parameters such the number of trains and headways.
  • Sensitivity study of the alighting and boarding exponents.
  • Distribution of dwelling time components.
The results showed that the estimated dwelling times are close to the real measurements and provide a good approximation to operators, thus validating this fuzzy logic-based approach as an alternative to modelling passenger flow considering information about the line and the passengers’ behavior.
This paper is structured as follows: Section 2 presents the theoretical framework based on an extended OD matrix. This section presents the approach to estimate the elements of this matrix and the dwelling time. Section 3 presents aspects related to the fuzzy inference engine and the proposed algorithm. Sections 4 and 5 present the studied case and the results, respectively. Section 6 addresses the comparison between the results obtained for estimated dwelling times with the proposed algorithm and real measurements. Conclusions and perspectives are presented in Section 7.

2. Theoretical Background

2.1. Parameter and Variables of the Model

The origin-destination matrix (known as origin-destination matrix or OD-matrix for short; synonymously used terms are trip table or (origin-destination) trip matrix) is organized as follows:
O D = [ 0 T 12 T 13 T 14 T 1 n O T 1 T 21 0 T 23 T 24 T 2 n O T 2 T 31 T 32 0 T 34 T 3 n O T 3 T 41 T 42 T 43 0 T 4 n O T 4 T 51 T 52 T 53 T 54 0 T 5 n T n 1 T n 2 T n 3 T n 4 0 O T n D T 1 D T 2 D T 3 D T 4 D T n 0 ]
where, the matrix entry TIJ represents the travel demand from stations I to J and n is the total number of the stations of the line. The last element of each column corresponds to the sum of the previous elements of the column, for example, DT1 = 0 + T21 + T31 +⋯+Tn1. The last element of each row corresponds to the sum of the previous elements of the row, for example, OT1 = 0 +T12 + T13 +⋯+ T1n.
The set of n first elements of the last column and the last row of the OD matrix are known as the boarding and alighting vectors, respectively. Each element DTJ and OTI can be subdivided into m elements corresponding to the number of cars at stations I and J, respectively. Considering these changes, the elements of the OD matrix are also subdivided, resulting in a new matrix that allows the analysis of the movement of passengers considering the car number and the station number. This extended origin-destination (EOD) matrix can be organized as shown in Figure 1.
The matrix entry MIiJj represents the travel demand from the car i at station I to the car j at station J. Each element DTJ must satisfy:
D T J = k = 1 m D J k
where J is the number of the destination station and k is the car number, with k ∈ {1, …, m}. In other words, the alighting element DTJ is the sum of the alighting flows of the m cars at station J. Each element OTI must satisfy:
O T I = k = 1 m O I k
where I is the number of the origin station and k is the car number, with k ∈ {1, …, m}. The boarding element OTI is the sum of boarding flows of the m cars at station I. The relationship between the matrix elements in the original or classic OD matrix and extended OD matrix can be expressed as follows:
T I J = i = 1 m j = 1 m M I i J j
subject to:
D J j = I = 1 n i = 1 m M I i J j , J , j ( Destination constraint )
and:
O I i = J = 1 n j = 1 m M I i J j , I , i ( Origin constraint ) .

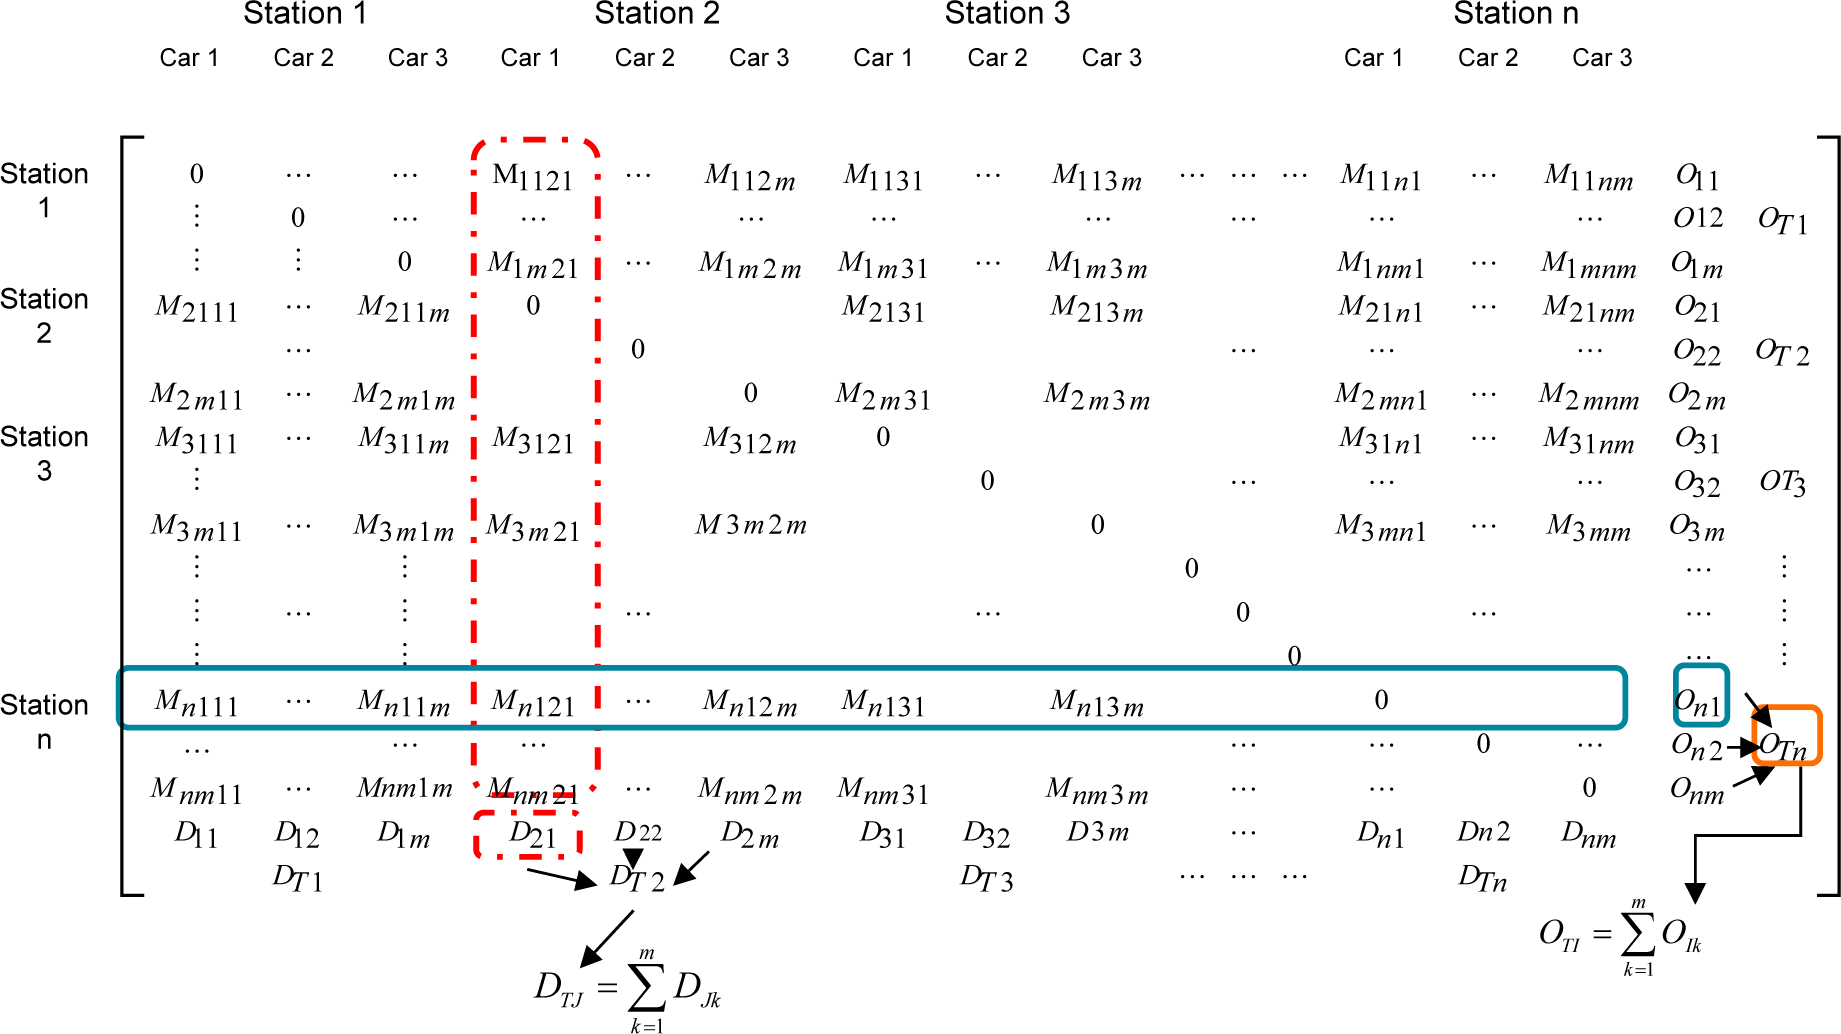
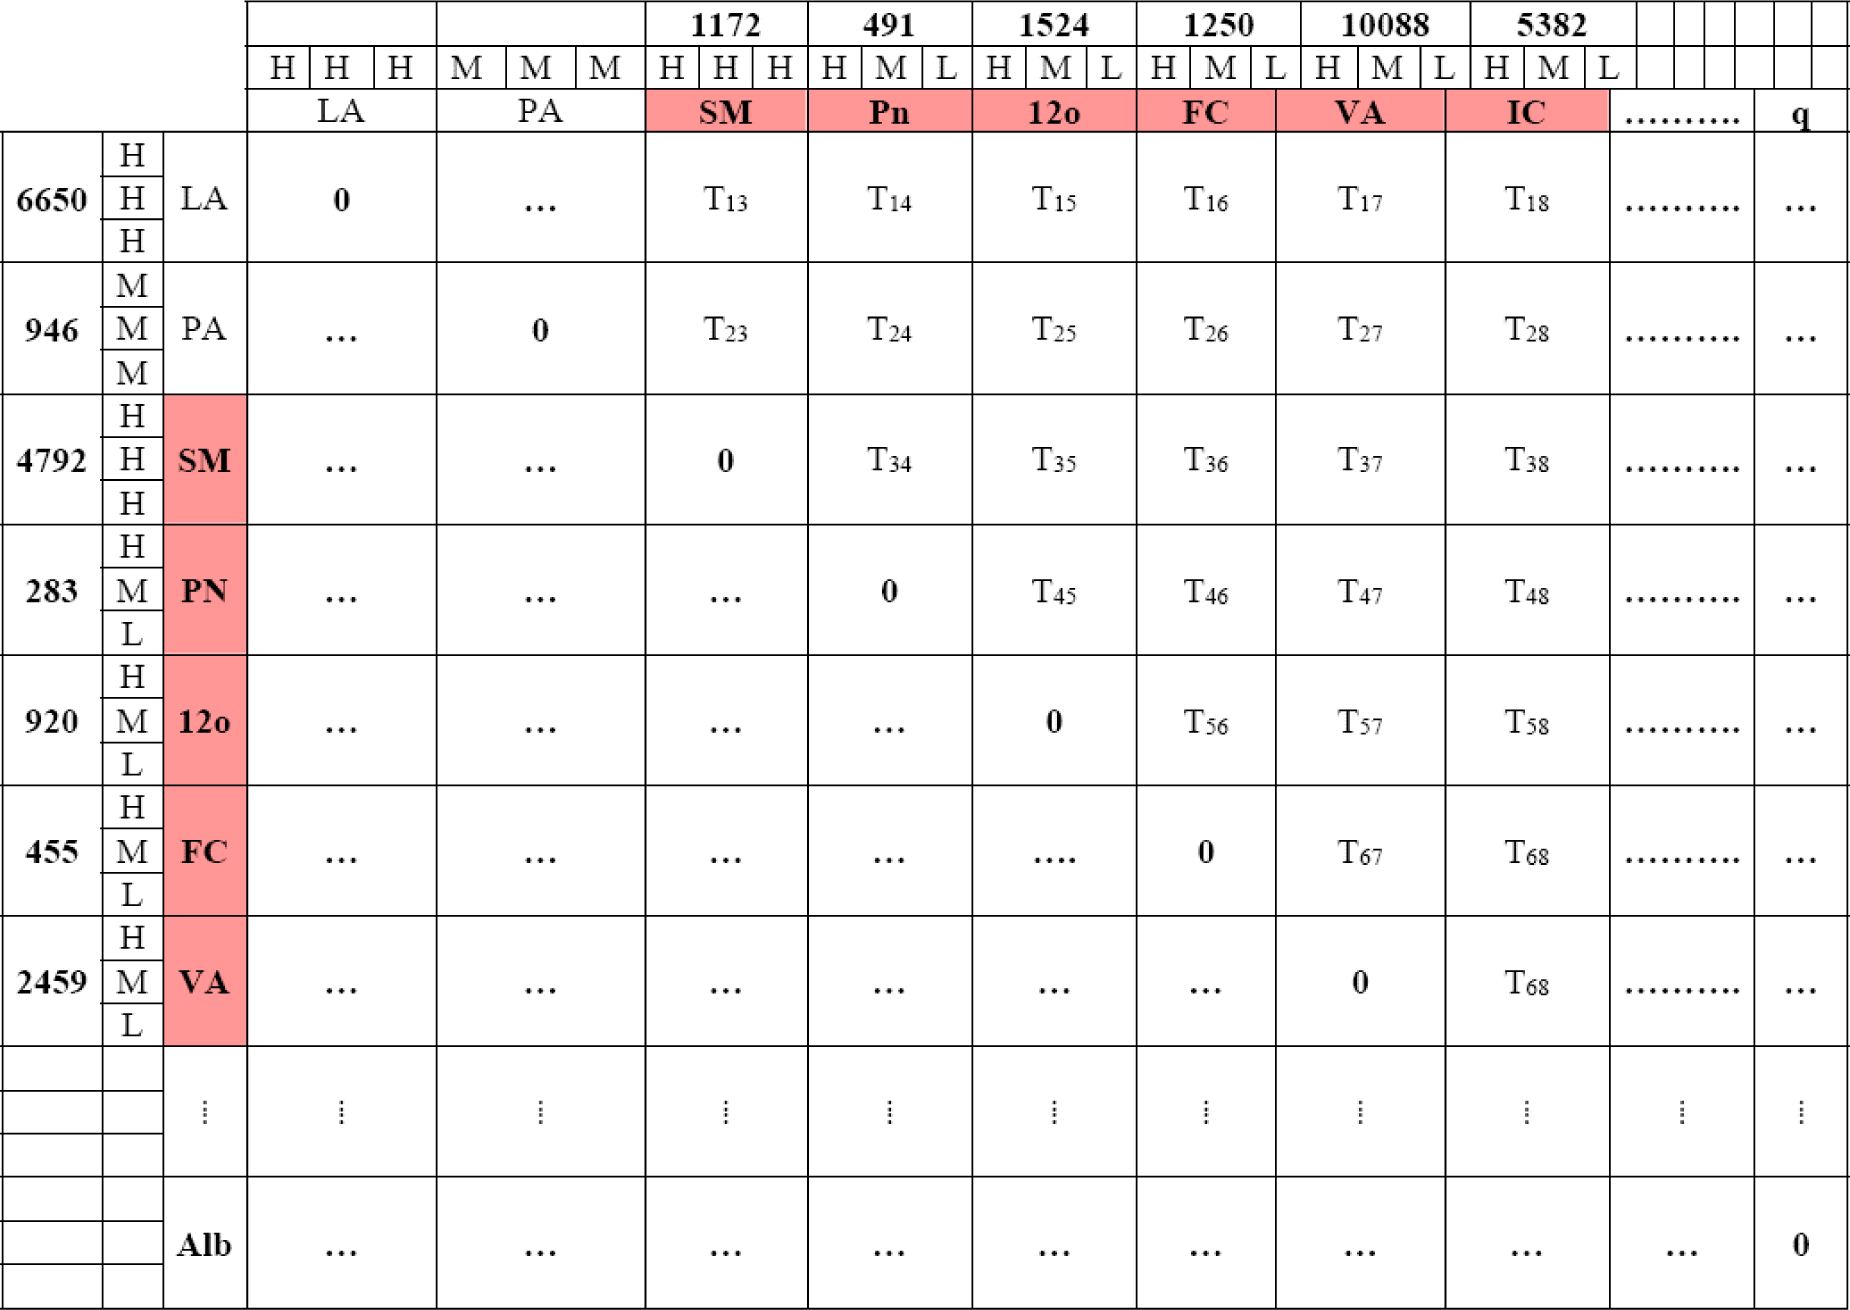
2.2. Estimation of the Elements of the EOD Matrix

An approach to estimate the elements of the OD matrix is to assume that the system is governed by the principle of maximum entropy. The principle of maximum entropy is based on the premise that when estimating the probability distribution, you should select that distribution which leaves you the largest remaining uncertainty (i.e., the maximum entropy) consistent with your constraints. Thus, none additional assumptions or biases are introduced into the estimations.
In the proposed algorithm, the interaction and behavior dynamics of passengers are considered by applying artificial intelligence-based techniques, more specifically, fuzzy logic. This distribution model is based in the following assumptions:
  • TIJ, OTI and DTJ have little uncertainty within a planning horizon because we consider a uniform demand behavior during the period of peak hours. Each element of vectors OIi or DJj can be represented as a function of the boarding vector OTI or alighting vector DTJ, respectively and a function with exponents CDIj or COJi. According to [13,14], the elements OIi or DJj can be computed as follows:
    D J j = 2 C D J j k = 1 m 2 C D J k D T J
    O I i = 2 C O I i k = 1 m 2 C O I k O T I
    Equations (7) and (8) approximate human reasoning or preferred human behavior for boarding/alighting to/from each car in function of the station’s facilities. These notions are developed in Section 5.
  • Each element MIiJj of the EOD matrix can be expressed as a function of TIJ and {CMIiJj} as follows:
    M I i J j = 2 C M I i J j r = 1 m s = 1 m 2 C M I r J s T I J
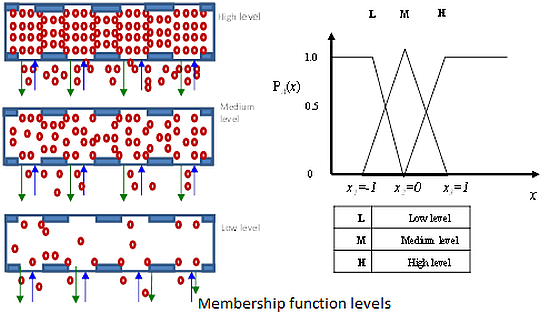
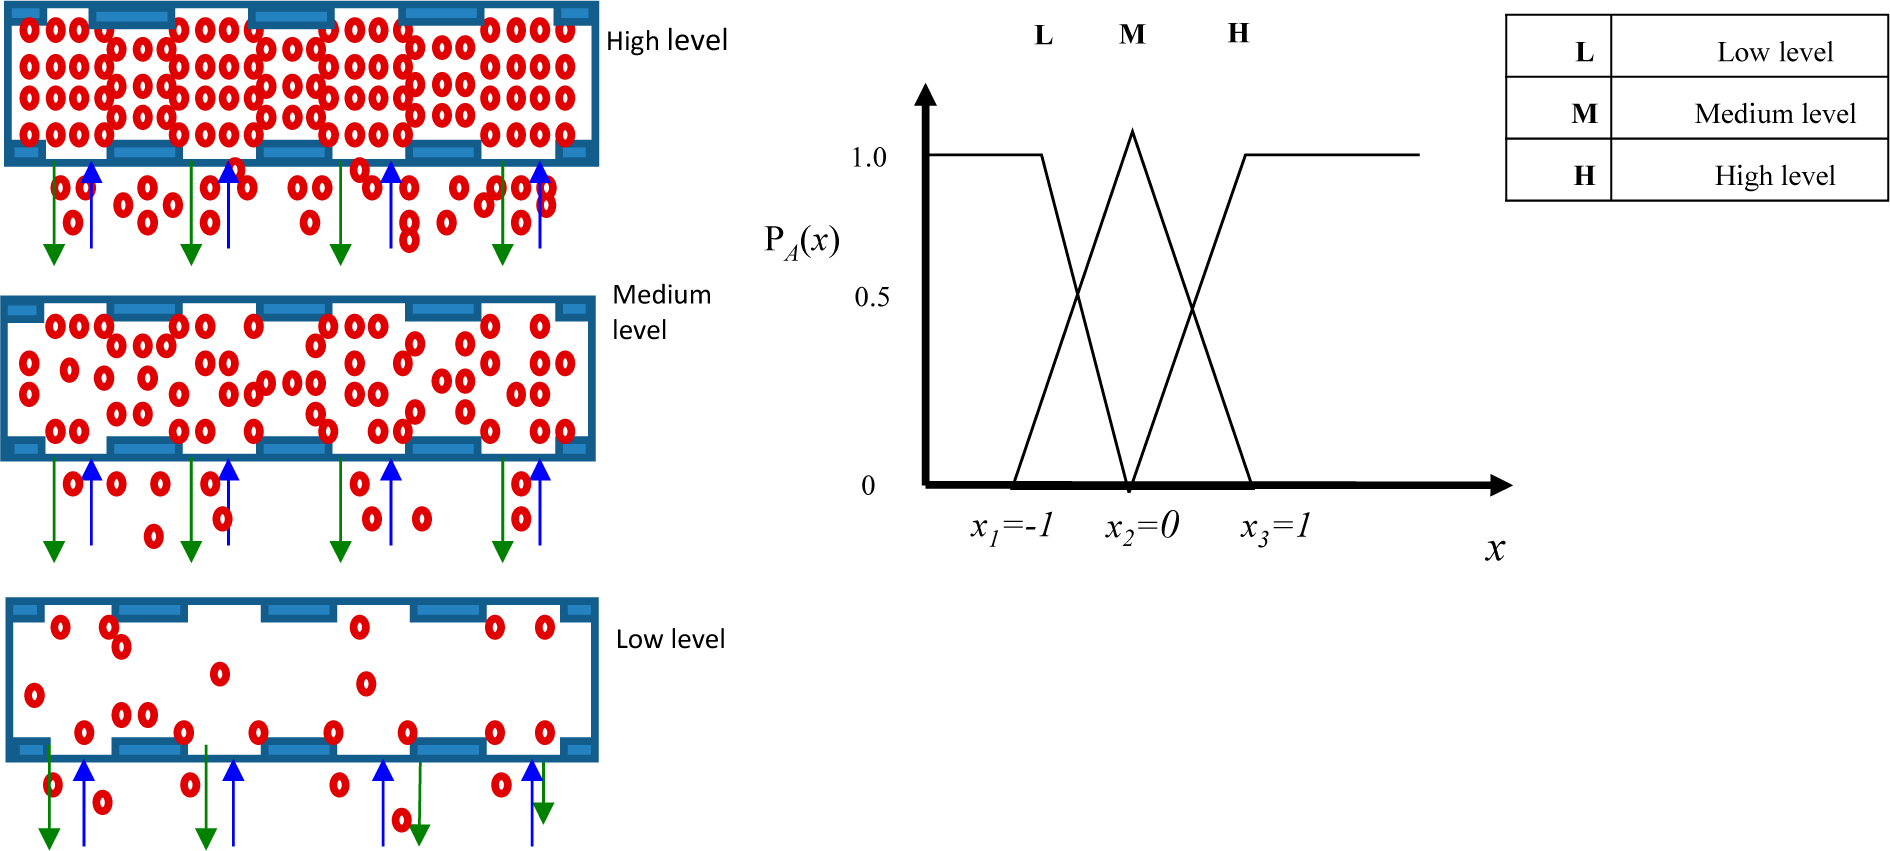
  • CDIj, COJi and CMIiJj are chosen based on the experience of an expert or railway planner. The exponents CDIj and COJi are related to the passengers’ preferencea for boarding (alighting) to (from) a specific car in a given station, respectively. The exponent CMIiJj sets the relative level of importance of the flow of passengers between the car i at I station to the car j at J station. If the chosen exponent is zero, the estimation becomes the maximum entropy estimation (i.e., medium demand), while if the exponent is +1 or −1, it corresponds to a car with high or low demand, respectively.

2.3. Dwelling Time Estimation

It has been shown that this dwelling time is a function of rolling stock, through passengers and passengers’ flow on the station platform. The through passengers in car k at station l is defined by:
M T l k = J = l + 1 n I = 1 l 1 i = 1 m M I i J j
where i is the origin train’s car, j is the destination car, I is the origin station and J is the destination station. In other words, Equation (10) means the passengers do not descend at the station l or the passengers remain inside the train and travel to the following stations.
Harris and Anderson [3] proposed and demonstrated an expression to estimate the dwelling time. Even though, such expression demands good statistical data in order to obtain an appropriate model, it is possible to approximate the time for opening and closing doors in car k at station l as follows:
t o c l k = t o c m + ( 1.5 [ 1 + 0.9 M T l k V c ] D l k a n d ) + ( 1.3 [ 1 + 0.8 M T l k V c ] O l k b n d ) + 0.027 D l k O l k n d 2
where a is the alighting power; b is the boarding power. In this study we use the values proposed in [1,3], a = b = 0.7; tocm is the minimum stopping time. In this study tocm is fixed at 15 s; Vc is the capacity of the hall (assuming 200 passengers per car) [18]; tdl is the time to stop at the station l; nd is the number of doors. It corresponds to the effective number of doors, in other words, the number of opened doors of the car in the exchange passenger’s platform; Dlk is the number of passengers alighting from car k at station l; Olk is the number of passengers boarding car k at station l.
According to Equation (11) the dwelling time have four components: minimum stopping time (i.e., 15 s), alighting time, boarding time and interaction time (interaction time corresponds to time of interaction between boarding and alighting).
The dwelling time can be expressed as follows:
t d l = max ( t o c l 1 , t o c l 2 , ........ , t o c l m )
That is, the last closing door of the train fixes the passenger service time.

3. Proposed Approach

In this section we present aspects related with the fuzzy inference engine and the distribution model. Also, we present the proposed algorithm for passenger flow and dwelling time estimation.

3.1. Fuzzy Inference Engine

The exponents CDIj, COJi and CMIiJj are chosen based on the knowledge of the passengers’ preference for a given car of the train. These exponents define the distribution functions considered for the passenger flow model. In this approach, triangular membership function levels are used. There are three basic levels of passenger flow: low, medium and high [15]. Figures 2 and 3 illustrate how the membership function levels describe the passenger’s distribution in each car of the train according to the level of occupancy or preference. Delgado et al. [19] indicated that it is not necessary to use sophisticated shapes for membership function, given that the assessments provided by experts are just approximations. Thus, triangular or trapezoidal shapes describe well enough these approximations. Also, Kikuchi et al. [20] proved that the size of the range does not have a significant effect on the final values. However, it has to be large enough to find a feasible set of solutions.
Let the universe of discourse X be the subset of real numbers R, X = {x1, x2, x3, , xn}. A fuzzy set A = {(x, PA(x)), x ∈ X} in X is a set of ordered pairs, where PA(x) is the membership function and X → [0, 1] and the greater PA(x), the greater the truth of the statement that the element x belongs to set A. Now, we parameterize a triangular fuzzy number A by a set {x1, x2, x3} and the membership function is defined by:
P A ( x ) = { x x 1 x 2 x 1 x 1 x x 2 x 3 x x 3 x 2 x 2 x x 3 0 in other case
An important aspect of this approach is the selection of the values of the exponents CDIj, COJi and CMIiJj. The railway expert must consider the following aspects to assign a proper value to the exponents:
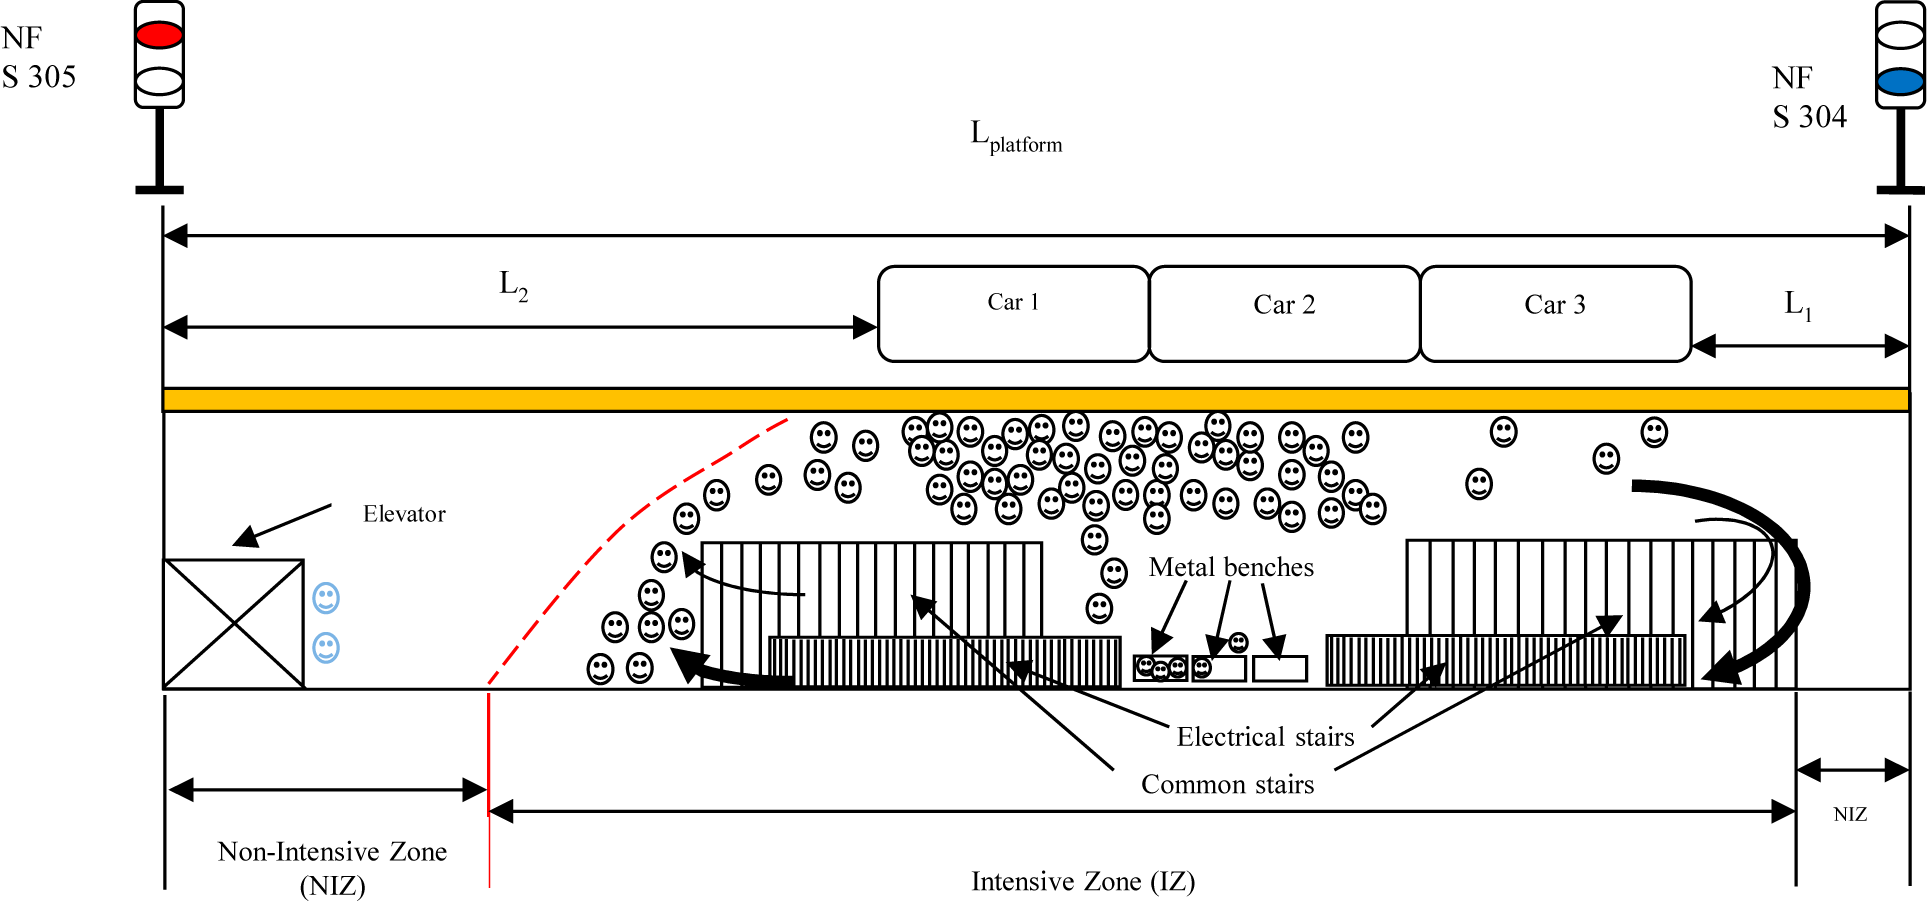
  • As a result of the platform design, facilities such stairs and elevators are closer to some cars during the boarding process. In consequence, these cars have a greater flow of passengers. On the other hand, groups of more experienced passengers usually wait at more distant places on the platform knowing the exact location of the doors of the arriving train during peak hours [11,21,22]. They consider that the emerging passenger flows decisively depend on the geometry of pedestrian facilities. Considering this, cars that are closer to the access points and facilities are assigned with exponents with value +1 (i.e., high level of demand). Other doors can be assigned with coefficients 0 or −1 in function to the proximity to these facilities (i.e., medium and low level of demand, respectively). In Figure 3, we illustrate this with the schematics of Fernandez de Cordoba station. For instance, the car 1, which is the closest to the stairs, is assigned a coefficient with a value of +1, while cars 2 and 3 are assigned values of 0 and −1, respectively.
  • Many passengers know the location of stairs, elevators and other facilities on the platform of the destination station. As a result, the cars that are closer to these facilities have a greater flow of passengers. People will naturally select the shortest route available to the exits. This is to be expected mainly during the rush hour period. This aspect is similar to the one in the previous point but considering the selected car for arrival.
  • Another important aspect is the stopping position of the trains with respect to the platform. They can be stopped by the head, the middle or the tail in function of the signaling system. In the case of the Panama Metro, the trains are stopped by the head. In the Figure 3, it is to possible appreciate the effect of the stopping position when, L2 ≫ L1, with Lplatform ≈ L2 + Ltrain + L1. As a consequence we can consider that the area in from of stopped train becomes an intense traffic zone for passengers. The size of this area may be non-static. It may grow if a given train uses an additional car.
  • In the case of the Panama Metro, the use of facilities such elevators is reserved to pregnant women, elderly people, the handicapped and reduced mobility persons [23]. As a consequence, the area near the elevators is a low traffic zone given that this facility is reserved for a small number of passengers.
For our case study, we found a similar configuration of facilities and train stopping position for all the stations. They are all similar to the schematics shown in Figure 3. Thus, we propose to assign a high level to car 1, a medium level to car 2 and a low level to car 3, in almost every station (see Figure 4). Two exceptions correspond to Los Andes (LA) and San Miguelito (SM) stations where we assigned high level to all cars. For instance, Los Andes is a terminus station and is very crowded during peak hours. San Miguelito station is also a very crowded station given that it is close to several bus stops, a hospital and commercial centers. The third exception corresponds to Pan de Azucar (PA) that presents a medium level of congestion during peak hours for all cars.

3.2. Proposed Algorithm

The propose algorithm can be summarized in the following steps:
  • Choose the exponents CDIj, COJi and CMIiJj based on the information available and using three membership function levels for each car of the trains.
  • Estimate attraction and generation vectors of the EOD matrix, DJj and OIi, using the following expressions:
    D J j = 2 C D J j k = 1 m 2 C D J k D T J
    O I i = 2 C O I i k = 1 m 2 C O I k O T I
  • Estimate the elements of the EOD matrix, MIiJj, using the following expression:
    M I i J j = 2 C M I i J j r = 1 m s = 1 m 2 C M I r J s T I J
  • Verify if O I i = J = 1 n j = 1 m M I i J j I , i. If | J = 1 n j = 1 m M I i J j O I i | < ε is satisfied, the estimated EOD matrix elements are accepted (the error ε is a value defined by the designer or railway planners; for this study, we fixed ε = 0.02). If the previous condition is not satisfied, the values of the matrix elements are adjusted with the following expression:
    M I i J j O I i M I i J j P = 1 n s = 1 m M I i P s
  • Verify if D J j = I = 1 n i = 1 m M I i J j J , j. If | I = 1 n i = 1 m M I i J j D J j | < ε is satisfied, the estimated EOD matrix elements are accepted. If the previous condition is not satisfied, the values of the matrix elements are adjusted as follows:
    M I i J j D J j M I i J j Q = 1 n r = 1 m M Q r J j
  • Verify if T I J = i = 1 m j = 1 m M I i J j J , I. If | i = 1 m j = 1 m M I i J j T I J | < ε is satisfied, {TIJ} are accepted. If the previous condition is not satisfied, the values of the matrix elements are adjusted as follows:
    M I i J j T I J M I i J j r = 1 m s = 1 m M I r J s
  • Return to step (d), if the inequalities of points (d), (e) and (f) are not satisfied.
  • Finally, we can compute MTlk, tock and tdl with the following expressions:
    M T l k = j = l + 1 n I = 1 l 1 i = 1 m M I i j k
    t o c l k = t o c m + ( 1.5 [ 1 + 0.9 M T l k V c ] D l k a n d ) + ( 1.3 [ 1 + 0.8 M T l k V c ] O l k b n d ) + 0.027 D l k O l k n d 2
    t d l = max ( t o c l 1 , t o c l 2 , ........ , t o c l m )
Remark: Solving Equations (15)(18) for all the elements of the EOD matrix requires time O(n2m2), where n and m are the number of stations and cars by train, respectively.

4. Case Study: Panama Metro Line 1

The Panama Mass Transit Railway is a metropolitan underground with subterranean and elevated track sections [16]. The route of the line 1 of the Panama Metro connects the north macrozone called “San Miguelito”, that is the macrozone that generates more trips with the mid-south macrozone that is the one that attracts more trips [18]. This zone harbors the main business activity, hospitals, universities and the National Bus Terminal Station.
An optimized passenger-orientated connection management requires information about the modal split, the demand matrix, and the time or date of a travel [24]. Several approaches can provide these values (e.g., statistical evaluation of tickets, interview and counting of passengers, positioning and handy ticketing, etc). In that sense, the Secretariat of the Metro of Panama (SMP) carried out a set of studies about passengers’ demand on line 1 using interviews/surveys and counting passengers [18]. These surveys are based on a questionnaire. The questionnaire asked passengers about their origin, destination and trip purpose [18]. Based on this information, they obtained the alighting and boarding vectors and estimated the OD matrix for the morning peak hours.
The proposed approach is implemented to estimate the elements of the OD matrix and the dwelling time of the stations during the morning peak period (i.e., from 6:00 a.m. to 8:00 a.m.) using the collected data of the alighting and boarding vectors provided by the SMP. Figure 4 presents part of this data. It also presents the passenger flow level (high-H, medium-M, or low-L) that we assigned to each car in each station based on an expert analysis.

5. Results

In this section we present the results of the proposed algorithm for the studied case. We address the following aspects:
  • Estimated dwelling times of the Panama Metro Line 1 for each station and both tracks.
  • Sensitivity analysis considering different values for alighting and boarding exponents a and b.
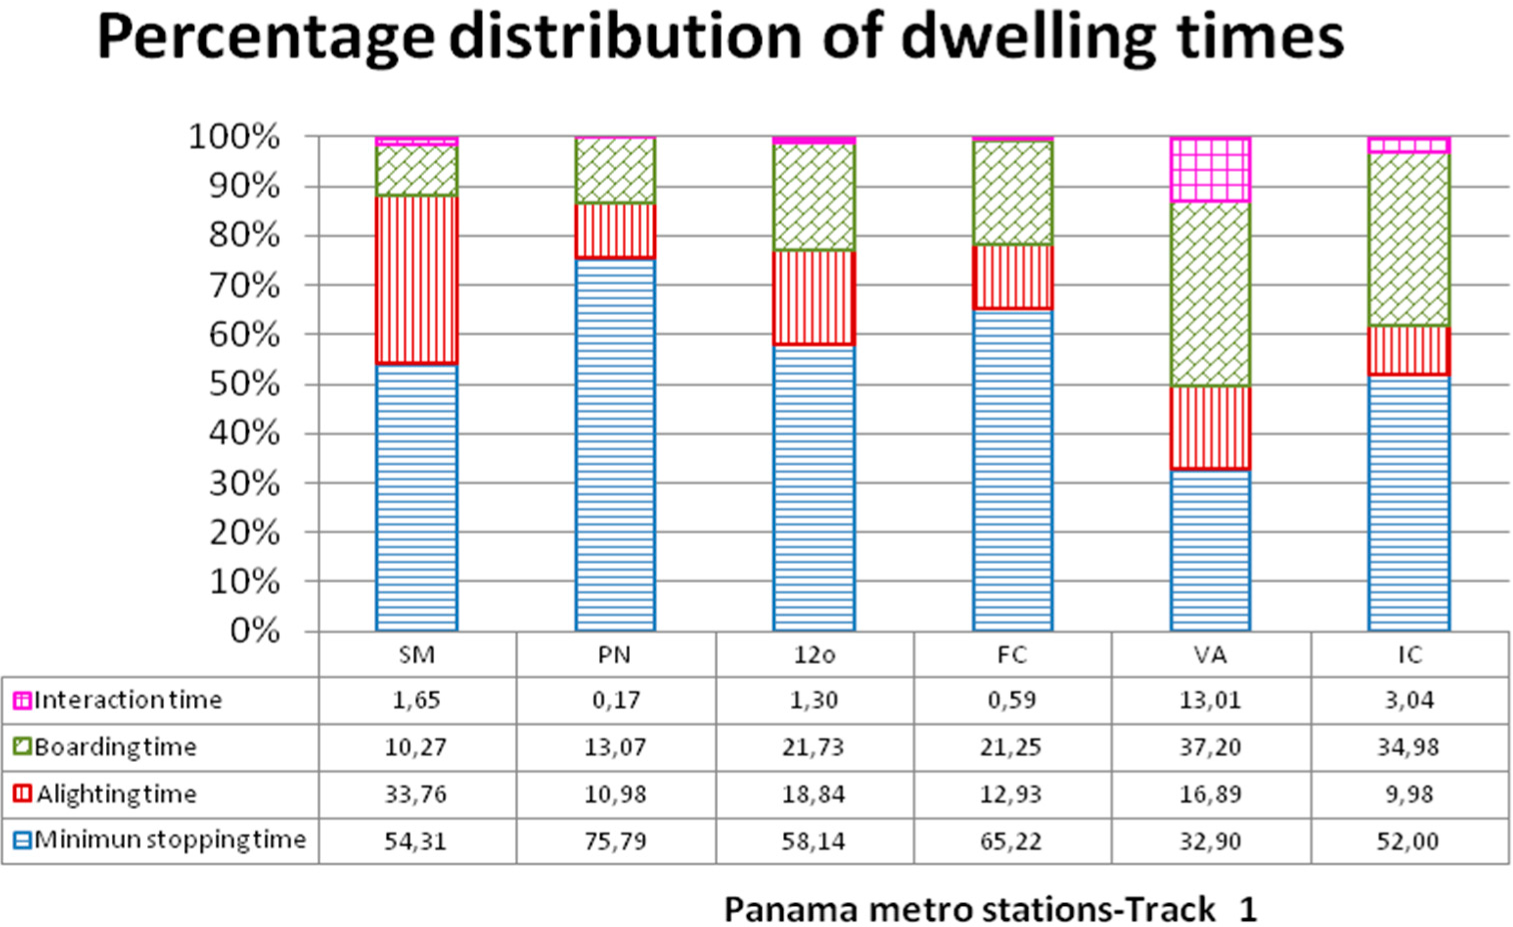
  • Distribution of dwelling time components for track 1.

5.1. Estimated Dwelling Times

Table 1 presents the estimated dwelling time for several scenarios. These scenarios consider different numbers of trains per hour. For a greater number of trains, the dwelling time drops given that the number of passenger waiting on the platforms decreases. For this analysis, the values of coefficients a and b were fixed in 0.7 as in [1,3]. However, it is possible to modify these two parameters in Equation (11).
In Table 2, we present the analysis for the case of 17 trains in the line for several combinations of values for the coefficients a and b. Case 3 is the current configuration of the line for morning peak hours. The estimated dwelling times are in the range presented in the railway literature for metro transportation systems [3,26]. According to these studies, the dwelling times for intermediate stations are in the range from 15 to 30 seconds. For terminal stations they are in the range from 30 to 60 seconds. In addition, the results are similar to the results obtained by Fernandez et al., [27] and by Van Breusegem et al. [28]. They present 20 s as stopping time and 15 s as minimum staying time in their simulation results, respectively.
Figure 5 presents the results of the case 1 of the Table 2. Case 1 corresponds to a fleet of 24 trains with an approximate headway of 150 s (i.e., a train every 2.5 min). The blue line represents the dwelling times in each station in the direction Los Andes–Albrook or track 1 and the red line shows the values of stopping time that correspond to the direction Albrook–Los Andes or track 2. We observe that the dwelling times in the track 1 are greater than the times of track 2 during the morning peak hours. The track 1 corresponds to the direction that has a higher traffic during morning hours given that most business activities and education centers are located in the south of Panama City. The dwelling time of 46 s in the Via Argentina Station is probably due to the fact that it is the nearest station to the main state university of Panama with 80,000 students. The 5 de Mayo station is located near the entrance of the Central Avenue. This is a pedestrian street with several boutiques, restaurants and shopping centers.

5.2. SensitivityAnalysis

In the following we present the results of the sensitivity study concerning the alighting and boarding exponents of Equation (11). The results in Table 2 show that an increment of the value of the exponents increases the dwelling time for a given station. For example, for the Iglesia del Carmen station in the track 1, the value of dwelling time increases from 24 seconds to 33 seconds (an increment of 37.5%.) when the exponents change from a = 0.5, b = 0.5 (sub-case 3–1) to a = 0.7, b = 0.7 (sub-case 3–9).
We present a set of the previous results in Table 3. This set includes the results of San Miguelito (SM), Pan de Azucar (PA) and Iglesia del Carmen (IC) stations for the subcases 3-1, 3-4 and 3-7. In these subcases, exponent a is fixed to 0.5 and the exponent b is 0.5, 0.6 and 0.7 for each subcase. For SM station, that has a demand level of type H-H-H, there is a very small change in the dwelling time for track 1 and track 2. For the PA station, that has a demand level of type M-M-M, there is a very small change in the dwelling time for the track 1 and track 2 for the three subcases. However, for the IC station, that has a demand level of type H-M-L, we observe a greater change in the dwelling time for track 1 and for track 2.
It is noteworthy that the platform of the SM station presents a high level of saturation [2932]. Indeed, all its cars are crowed and in consequence not all waiting passengers can aboard the train. For this reason, the congestion level H is assigned to its cars. It is necessary to increase the number of cars per train from 3 to 4. This would increase by 200 the passenger capacity. This is a highly recommended measure considering that in the near future, this station will be also served by line 2 of the Panama Metro.

5.3. Components of the Dwelling Time

Figure 6 presents the components of the dwelling time for the track 1. The components are defined in Equation (11) and include: mininum stopping time, alighting time, boarding time and interaction time. According to the results, the component with the greatest percentage is the “minimum stopping time” in almost every station except the Via Argentia (VA) station. In this station the boarding time is 37.20% and is greater by 4.30% to the minimum stopping time. The second largest component in most stations is the boarding time, except in San Miguelito Station (SM), where the alighting time represents 33.76% of the total time and exceeds the boarding time (10.27%). Thus, San Miguelito is mainly a passenger descending station. In this station the passenger flow levels are H-H-H. We observe that the interaction time is very small in most stations except in Via Argentina (VA). In this station, the interaction time represents 13.01% of the total time.

6. Comparison between Real Measurements and Estimated Results

Table 4 presents a statistic analysis of real measurements of the dwelling times of San Miguelito, 12 de Octubre and Fernandez de Córdoba stations. The last column of this table presents the estimated dwelling time for the case 3 of Table 4. This case, with 17 trains, is the current configuration of the line for morning peak hours. The real measurements were obtained from video footage of the stations platforms. The arrival and departing time of each train at each station was registered during the period of analysis. From this data, we obtained the mean values, variance, standard deviations and minimum and maximum values of the dwelling times. The data corresponds to the period between 5:00 a.m. and 8:00 a.m. The number of samples for this analysis is 52 (i.e., the dwelling time of 52 trains during the period of analysis).
We observe that the estimated dwelling times are good approximations with respect to the real measurements. For the case of Fernandez de Cordoba stations the estimated time of 25 s is close to the mean value of the samples (26.35 s). We observe that for San Miguelito and 12 de Octubre stations there is a difference between the estimated real time and the mean time of the real measurements. This suggest that some parameters of the model might need adjustment for the flow estimation (e.g., demand levels) or for the dwelling time estimation (e.g., alighting and boarding powers).

7. Conclusions

In this paper, we evaluated the relevance of a fuzzy-logic based approach for passenger flow and dwelling time estimation using a case study: Line 1 of the Panama Metro. The proposed approach uses an extended OD matrix considering different passenger flow levels for each car according to the inferred preference of the users. The estimated dwelling time was compared with real measurements. The obtained results provide a good approximation and validate the potential and effectiveness of proposed approach in a real case. This simulation framework was used to carry out analysis of specific stations and a sensibility analysis of some parameters. As a perspective for future research, we consider to improve the fuzzy inference engine and evaluate other artificial intelligence techniques. Also, this approach can be combined with techniques of image processing, video analysis and applications of Pattern Recognition to provide more information to the analysis system.

Acknowledgments

The authors of this paper want to express their gratitude to the National Secretary of Science and Technology (SENACYT) of the Government of the Republic of Panama for funding this study through the R & D project (MDEPRB09-001). Additionally, they want to thank the support received from Technological University of Panama (UTP), the University of Granada, the Fundación Carolina and the Secretaría del Metro de Panamá (SMP).

Author Contributions

The approach and its algorithm were designed by Aranzazu Berbey Alvarez and Rony Caballero George. The algorithm and the results were analized by Aranzazu Berbey Alvarez and Fernando Merchan. Key elements of the research were reviewed by Francisco Javier Calvo Poyo. The writing work of corresponding parts and the major revisions of this paper were completed by Aranzazu Berbey Alvarez and Fernando Merchan. All authors have read and approved the final manuscript.

Conflicts of Interest

The authors declare no conflict of interest.

References

  1. Harris, N. Train boarding and alighting rates at high passenger loads. J. Adv. Transp 2006, 40, 249–263. [Google Scholar]
  2. Kikuchi, S.; Miljkovic, D. Method to preprocess observed traffic data for consistency application of fuzzy optimization concept. Trans. Res. Rec 1999, 172, 73–80. [Google Scholar]
  3. Harris, N.; Anderson, R. An international comparison of urban rail boarding and alighting rates. J. Rail Rapid Transit 2007, 221, 521–526. [Google Scholar]
  4. Aldian, A.; Taylor, M. Fuzzy multicriteria analysis for inter-city travel demand modelling. J. East. Asia Soc. Transp. Stud 2003, 5, 1294–1307. [Google Scholar]
  5. Canca, D.; Zarzo, A.; Algaba, E.; Barrena, E. Confrontation of different objectives in the determination of train scheduling. Procedia Soc. Behav. Sci 2011, 20, 302–312. [Google Scholar]
  6. Zhang, Q.; Han, B.; Li, D. Modeling and simulation of passenger alighting and boarding movement in Beijing metro stations. Transp. Res. C 2008, 16, 635–649. [Google Scholar]
  7. Watson, J.R.; Prevedouros, P.D. Derivation of origin-destination distributions from traffic counts implications for freeway simulation. Transp. Res. Rec 2006, 1, 260–269. [Google Scholar]
  8. Cheng, Y.H.; Yang, L.A. A fuzzy petri nets approach for railway traffic control in case of abnormality: Evidence from Taiwan railway system. Expert Syst. Appl 2009, 36, 8040–8048. [Google Scholar]
  9. Campion, G.; van Breusegem, V.; Pinson, P.; Bastin, G. Traffic regulation of an underground railway transportation system by state feedback. Optim. Control Appl. Methods 1985, 6, 385–402. [Google Scholar]
  10. Xu, X.Y.; Liu, J.; Li, H.Y.; Zhou, Y.F. Probabilistic model for remain passenger queues at subway station platform. J. Cent. South Univ 2013, 20, 837–844. [Google Scholar]
  11. Wiggenraad, P.B.L. Alighting and Boarding Times of Passengers at Dutch Railway Stations; TRAIL Research School: Delft, The Netherlands, December 2001. [Google Scholar]
  12. Sasama, H.; Ohkawa, Y. Floating traffic control for public transportation system. Proceedings of the 4th IFAC/IFIP/IFORS Conference on Control in Transportation Systems, Baden-Baden, Federal Republic of Germany, 20–22 April 1983.
  13. Magnolo, E.; Manenti, L.; Manzoni, S.; Sartori, F. Towards a MAS model for crowd simulation at Pop-Rock concerts exploiting ontologies and fuzzy logic. Proceedings of the 10th Workshop from Objects to Agents, WOA’09, Parma, Italy, 8–10 July 2009; pp. 9–10.
  14. Berbey, A.; Caballero, R.; Galán, R.; Sanz-Bobi, J.D. A Fuzzy Logic inference approach for the estimation of the passengers flow demand. Proceedings of the International Conference on Fuzzy Computation and 2nd International Conference on Neural Computation, Valencia, Spain, 24–26 October 2010; pp. 125–129.
  15. Berbey, A.; Galan, R.; Sanz-Bobi, J.D.; Caballero, R. A fuzzy logic approach to modelling the passenger’s flow and dwelling time. In Urban Transport XVIII; Longhurst, J.W.S., Brebbia, C.A., Eds.; WIT Press: Ashurst, UK, 2012. [Google Scholar]
  16. Berbey, A.; Caballero, R.; Sánchez, V.; Calvo, F. Passenger’s flow for a train’s coach and dwelling time using fuzzy logic. Proceedings of 2014 International Work Conference on Bio-inspired Intelligence (IWOBI), Liberia, Costa Rica, 16–18 July 2014; pp. 30–60.
  17. Buchmueller, S.; Weidmann, U.; Nash, A. Development of a dwell time calculation model for timetable planning. In Computers in Railways XI; Allan, J., Arias, E., Brebbia, C.A., Goodman, C., Rumsey, A.F., Sciutto, G., Tomii, N., Eds.; WIT Press: Ashurst, UK, 2008; pp. 105–114. [Google Scholar]
  18. Secretaria del Metro de Panamá. Estudio de la demanda para la línea 1 del sistema de transporte masivo de la ciudad de Panamá 2010. in Spanish.
  19. Delgado, M.; Verdeday, J.L.; Vila, M.A. Linguistic Decision-Making Models. Int. J. Intell. Syst 1992, 7, 479–492. [Google Scholar]
  20. Kikuchi, S.; Milijkovi, D. Method to preprocess observed traffic data for consistency: Application of fuzzy optimization concept. Trans. Res. Rec 1999, 1679, 73–80. [Google Scholar]
  21. Helbing, D.; Molnár, P. Self-organization phenomena in pedestrian crowds 1998. arXiv: cond-mat/9806152v1.
  22. Schmöcker, J.D. Dynamic Capacity Constrained Transit Assignment. In Ph.D. Thesis; Imperial College London: London, UK, September 2006. [Google Scholar]
  23. Secretaría del Metro de Panamá, Instrucción y Normas para usar el metro de Panamá; Metrocultura, 2014; in Spanish.
  24. Klemez, M.; Radtke, A. Method and software tool for an optimize passenger orientated connection management. In Computers in Railways XI; Allan, J., Arias, E., Brebbia, C.A., Goodman, C., Rumsey, A.F., Sciutto, G., Tomii, N., Eds.; WIT Press: Ashurst, UK, 2010; pp. 59–71. [Google Scholar]
  25. Berbey, A.; Caballero, R. Informe de avance técnico financiero del proyecto de I+D “Metodologías e índices de desempeño para sistemas de transporte ferroviario”; Universidad Tecnológica de Panamá: Panama City, Panama, 2011. [Google Scholar]
  26. Melis, M.; González, F. Ferrocarriles metropolitanos: Tranvías, metros ligeros y metros convencionales; Colegio de Ingenieros de Caminos, Canales y Puertos: Madrid, Spain, 2008; in Spanish. [Google Scholar]
  27. Fernández, A.; Cucala, A.P.; Vitoriano, B.; De Cuadra, F. Predictive traffic regulation for metro loop lines based on quadratic programming. J. Rail Rapid Transit 2006, 220, 79–89. [Google Scholar]
  28. Van Breusegem, V.; Campion, B.G. Traffic modelling and state feedback control for metro lines. IEEE Trans. Autom. Control 1991, 36, 770–784. [Google Scholar]
  29. Berbey, A. Planificación en Tiempo Real de Tráfico Ferroviario. In Ph.D. Thesis; Universidad Politécnica de Madrid: Madrid, Spain, 2008; in Spanish. [Google Scholar]
  30. Berbey, A.; Galán, R.; San Segundo, P.; Sanz-Bobi, J.D. Lyapunov based stability analysis for metro lines, urban transport 2008. Proceedings of Fourteenth International Conference on Urban Transport and the Environment in the 21st Century, Malta, Malta, 3–8 September 2008.
  31. Berbey, A.; Galán, R.; San Segundo, P.; Sanz-Bobi, J.D.; Caballero, R. Un algoritmo de replanificación en tiempo real basado en un índice de estabilidad de Lyapunov para líneas de metro. Revista Iberoamericana de Automática e Informática Industrial 2014, 11, 167–178, in Spanish. [Google Scholar] [Green Version]
  32. Berbey, A.; Caballero, R.; Galán, R.; San Segundo, P.; Sanz-Bobi, J.D. A new stability Index for metro lines. Proceedings of the International Conference on Electrical, Communications, and Computers (CONIELECOMP 2009), Puebla, Mexico, 26–28 February 2009; pp. 41–45.
Figure 1. The extended origin-destination (EOD) matrix.
Entropy 17 02688f1
Figure 2. Membership function three basic levels for a train’s car.
Entropy 17 02688f2
Figure 3. Schematics of train stopping position with respect railway signaling and control system. Case: “Fernández de Córdoba” Station. Source: Aranzazu Berbey-Alvarez, Project—Characterization of Panama metro rail system.
Entropy 17 02688f3
Figure 4. Partial OD matrix of the line 1 of the Panama Metro with passenger flow level assigned to each car.
Entropy 17 02688f4
Figure 5. Estimated dwelling times for the stations of the Line 1 of the Panama Metro.
Entropy 17 02688f5
Figure 6. Components of the dwelling time for the track 1.
Entropy 17 02688f6
Table 1. Estimated dwelling times of the Line 1 of the Panama Metro.
Dwelling times of the Panama Metro line 1 (a = b = 0.7)
CaseTrainsHeadway (s)TrackSI *LAPASMPn12OFCVAICSTLO5MCuAlb
124(24,150)12325192820262346292223411720
22322172117201936262122381720
220(20,180)12427202920272452312224481721
22423172217212041282223431721
317(17,212)12629203121292558332325551822
22624182418222046302324501722
416(16,225)12629213221302661342425581822
22625182418222048312325531722
Table 2. Extended results for the case of 17 trains on the line.
Dwelling times of the Panama Metro line 1 (trains = 17)
Sub-case(a,b)TrackSI *LAPASMPn12OFCVAICSTLO5MCuAlb
3-1(0.5,0.5)12122192419232139242021401718
22120172017191834231920391618
3-2(0.6,0.5)12224192620242241252021441718
22221172117201836232021411618
3-3(0.7,0.5)12528203020262244262022501718
22525241823201937242022461618
3-4(0.5,0.6)12122192420242244272122421719
22120172017201938252014401719
3-5(0.6,0.6)12324192720262347282122461719
22321172117201939262122431719
3-6(0.7,0.6)12528203120272450292223521719
22524182318211941262123481719
3-7(0.5,0.7)12122192520262453322323451822
22120172017202043292223421722
3-8(0.6,0.7)12325202821282555322324491822
22322172218212044292223451722
3-9(0.7,0.7)12629203121292458332325551822
22624182418222046302324501722
Table 3. Comparison of cases between the stations of San Miguelito (SM) and Pan de Azucar. (PA).
Sub-case(a,b)TrackSMPAIC
3-1(0.5,0.5)1241924
2201723
3-4(0.5,0.6)1241927
2201725
3-7(0.5,0.7)1251932
2201729
Table 4. Real measurements and estimated dwelling times.
StationsReal measurementsEstimated dwelling time (s)
Mean Value (s)VarianceStandard DeviationMinimum ValueMaximum value
San Miguelito23.8419.624.42144531
12 de Octubre22.9014.083.75183729
F. de Cordoba26.3532.465.69175225

