Article

Life-Cycle Energy and GHG Emissions of Forest Biomass Harvest and Transport for Biofuel Production in Michigan

1
College of Mechanical and Transportation Engineering, China University of Petroleum, Beijing 102249, China
2
Department of Mechanical Engineering-Engineering Mechanics, Michigan Technological University, Houghton, MI 49931, USA
3
School of Business and Economics, Michigan Technological University, Houghton, MI 49931, USA
*
Author to whom correspondence should be addressed.
Energies 2015, 8(4), 3258-3271; https://doi.org/10.3390/en8043258
Submission received: 1 December 2014 / Revised: 16 March 2015 / Accepted: 15 April 2015 / Published: 22 April 2015
(This article belongs to the Special Issue Bioenergy and Biorefining)

Abstract

:
High dependence on imported oil has increased U.S. strategic vulnerability and prompted more research in the area of renewable energy production. Ethanol production from renewable woody biomass, which could be a substitute for gasoline, has seen increased interest. This study analysed energy use and greenhouse gas emission impacts on the forest biomass supply chain activities within the State of Michigan. A life-cycle assessment of harvesting and transportation stages was completed utilizing peer-reviewed literature. Results for forest-delivered ethanol were compared with those for petroleum gasoline using data specific to the U.S. The analysis from a woody biomass feedstock supply perspective uncovered that ethanol production is more environmentally friendly (about 62% less greenhouse gas emissions) compared with petroleum based fossil fuel production. Sensitivity analysis was conducted with key inputs associated with harvesting and transportation operations. The results showed that research focused on improving biomass recovery efficiency and truck fuel economy further reduced GHG emissions and energy consumption.

1. Introduction

In recent years the U.S. has imported slightly more than one-half of its oil needs from foreign sources [1]. Such a high dependence increases U.S. strategic vulnerability and prompts more research on renewable energy production. Production of ethanol from renewable biomass, which could be a substitute for gasoline, has experienced increased interest. The carbon neutrality assumption generally applied to biofuels would underestimate greenhouse gas (GHG) impact of the products. This is because GHG emissions are not considered across the production stages. External fossil fuel inputs are required to produce and harvest the feedstock, processing and handling the biomass, bioenergy plant operation, and transportation of feedstock and biofuels [2]. This is a typical example of an unintended consequence of renewable energy [3].
To evaluate the environmental impacts associated with biofuels production and identify any opportunity for environmental improvement, Life Cycle Assessment (LCA) is a standardized methodology frequently applied [3,4,5,6,7]. Slade et al. [8] evaluated the GHG emissions performance of the cellulosic ethanol supply chains in Europe. Blottnitz and Curran [
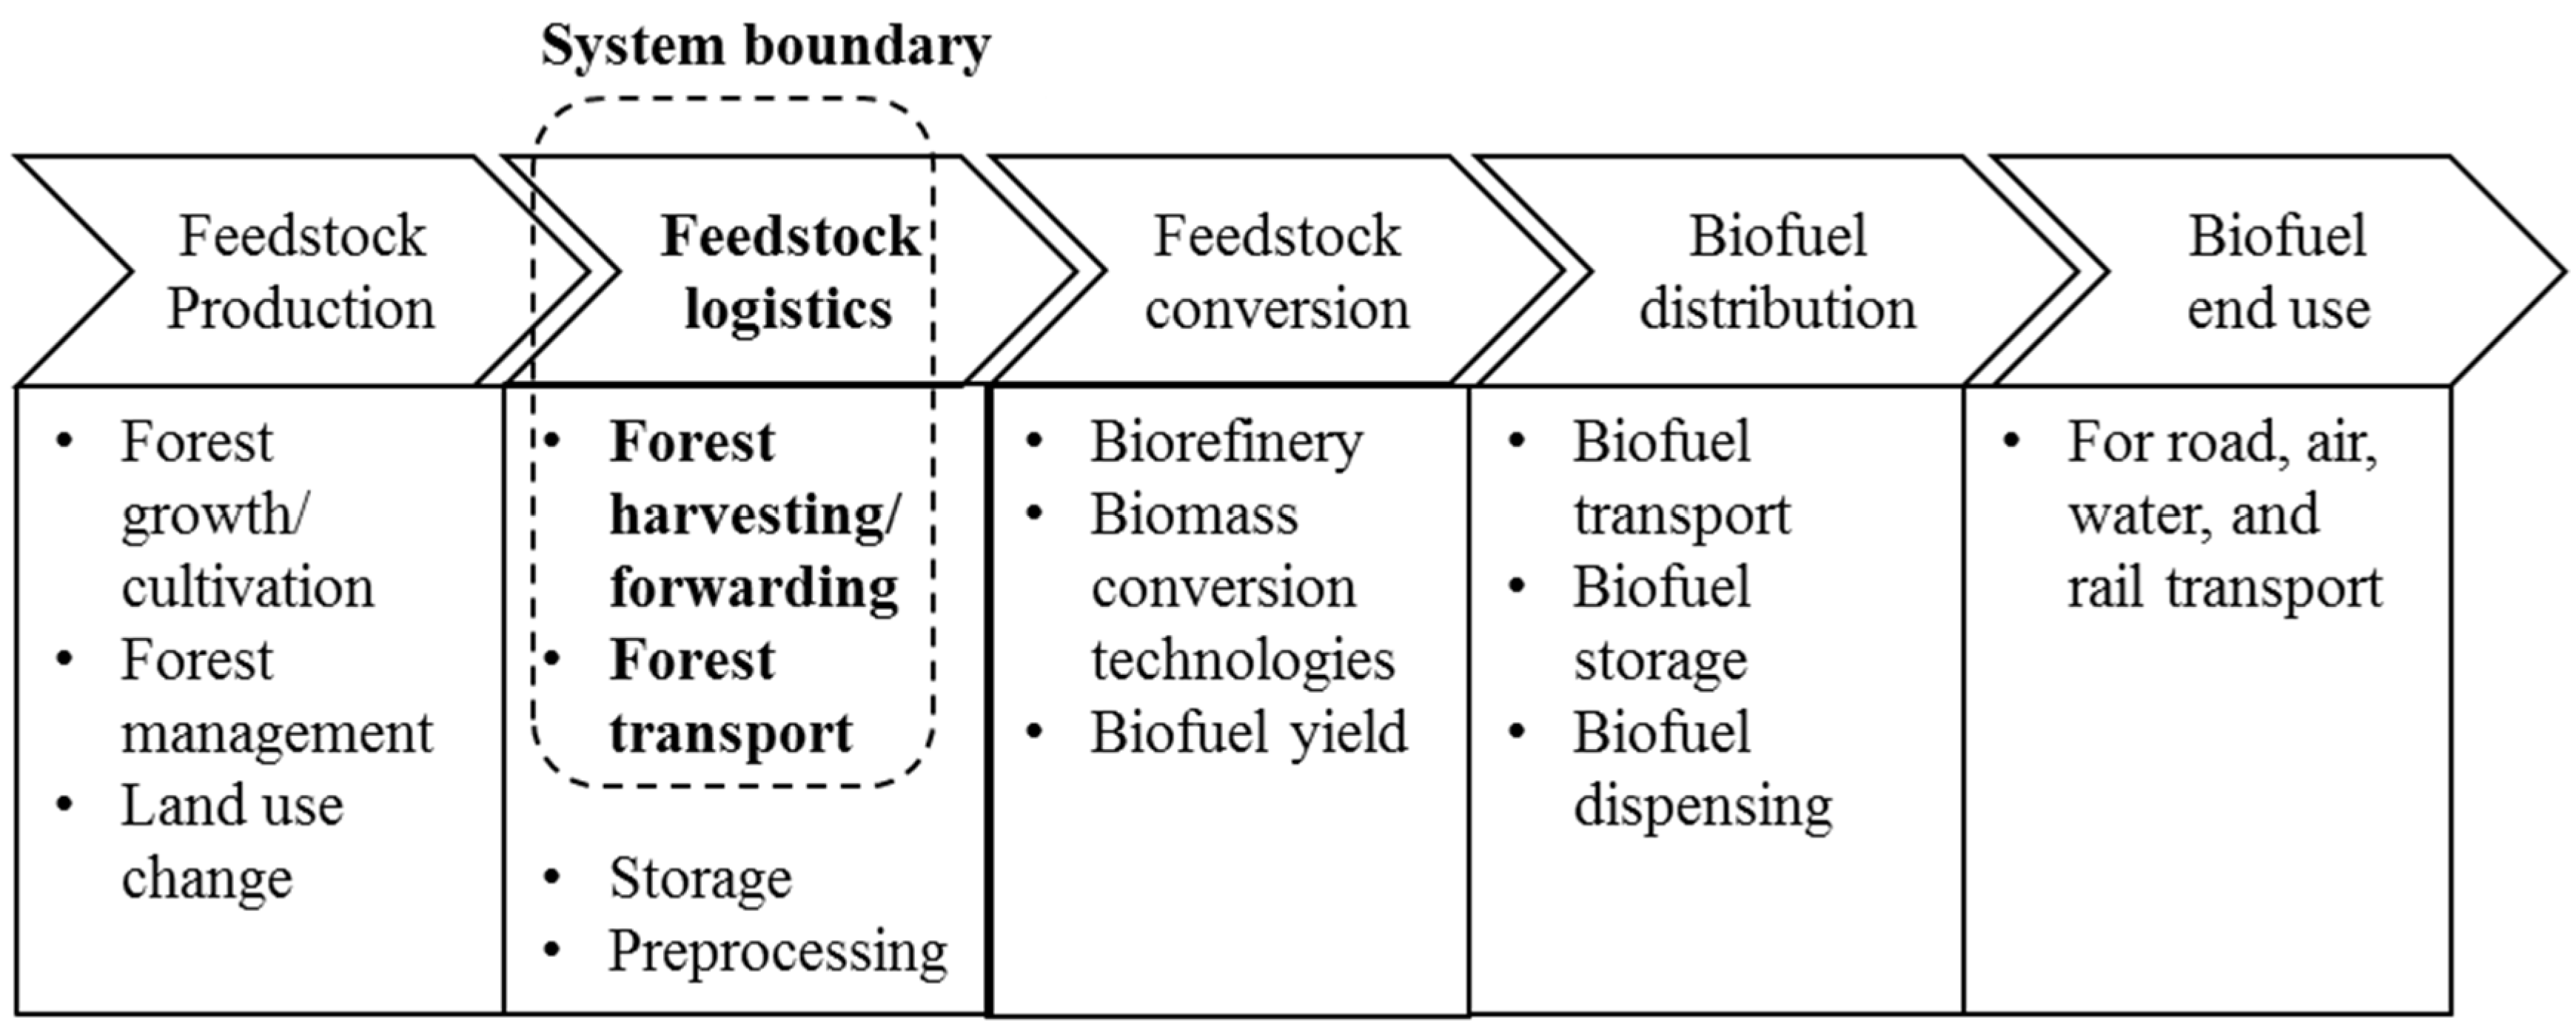
9] reviewed the assessments conducted on bio-ethanol as a transportation fuel from a net energy, GHG, and environmental life cycle perspective. A more comprehensive study would not only consider the upstream bioethanol supply chain, to include feedstock growth/cultivation, feedstock harvesting and processing, and feedstock transport [10], but also the downstream supply chain that could then segue into what Neupane et al. proposed to analyse [10]. McKechnie et al. [11] integrated LCA and forest carbon analysis to assess total GHG emissions of forest bioenergy over time. Case studies of wood pellet and ethanol production from forest biomass reveals a substantial reduction in forest carbon due to bioenergy production [11].
Integrated methods of LCA with optimization, simulation, and other modeling methods are also extensively used in the literature. Liu et al. [12] integrated life cycle analysis with biofuel supply chain optimization modeling and applied the integrated research method to three different biofuel pathways in China. The method incorporated three evaluation indicators: total annual profits for economy performance, energy input, and GHG emission per unit of energy produced for environmental performance. LCA was also combined with simulation method to access the processes with the highest contribution to the environmental impacts in a biofuel process chain [13]. Møller et al. combined LCA with welfare economic Cost Benefit Analysis (CBA) to evaluate the feasibility of introducing biofuels in Denmark. Not only were the resource and environmental consequences considered, the welfare consequences were also evaluated [14].
However, many uncertainties exist and include the type of biomass, regional and geographic differences, transportation modes, and system boundaries involved in the application of LCA method [2]. This has resulted in wide variation in the outcomes [2]. Nguyen et al. [15] examined the uncertainty in life cycle GHG emissions of corn stover logistics within a bio-ethanol supply chain in the State of Kansas. The uncertainties considered were the different number of biomass preprocessing depots and their locations. Spatari and MacLean [16] constructed life cycle models for the bioconversion of corn stover and switchgrass and explicitly examined uncertainty using Monte Carlo simulation.
Since the presented study is for forest biomass harvesting and transport, additional citations were selected based on the forest feedstock type and research scope that includes these two stages with the goal of validating the feasibility of the presented research method. Citations from different countries or areas, including U.S., Sweden, Spain and Norway, were selected to identify if comparable results were achieved. Sonne [17] evaluated both direct and indirect GHG emissions from forestry operations using LCA method. It was found that direct emissions accounted for 84% of the total GHG emissions. Out of the direct emissions, harvesting contributed the most. Gonzalez-Garcia et al. [18] conducted a LCA to identify environmental impacts of pulpwood production and supply to pulp mills in Sweden and Spain. A LCA was also conducted to evaluate GHG emissions and costs of forest management, harvest and transport operations in the mountain areas of Hedmark and Oppland countries in Norway [19].
Our research builds upon the life cycle analysis conducted by Zhang et al. [20]. At present, new data are available for roundwood harvest and transport activities in Michigan from Handler et al. [21], with whom we worked closely. It was necessary to conduct a new assessment to improve the accuracy of the estimates. Estimates of life cycle energy use are included in this study which is not in the previous research due to data unavailability. Different harvesting scenarios with three harvesting types and three equipment configurations were considered. Three main harvesting/forwarding equipment configurations were used to characterize the logging industry in Michigan include [21]: (a) cut-to-length full processor/forwarder; (b) feller-buncher/skidder/slasher; and (c) chainsaws/skidder. Three harvesting types considered included: (1) clearcutting all merchantable timber; (2) a 70% (shelterwood) removal treatment; and (3) a 30% (selective cut) removal treatment [21]. In our previous study the estimates of harvesting and forwarding activity were assumed to be completed using 100% cut-to-length (CTL) processor/forwarder and only the clear-cutting harvest type was discussed. Our current research broadens the scope of our previous work and extends the contribution to the body of knowledge.

2. Research Methods

2.1. Goal and Scope

The goal of the LCA is to determine fossil energy use and GHG emissions associated with harvesting and transportation of forest-based biomass within the State of Michigan, U.S. The scope is limited to harvesting and transportation stages that occur prior to biomass conversion in a biofuel facility (Figure 1). For the purposes of this study, harvesting includes cutting trees from the stump, processing into typical log length of 2.54 m (100 inches), and moving the logs to a forest lading. Transportation refers to movement of wood from the forest landing to a biofuel facility by truck or rail. Inputs from any activities that would occur “upstream” of the biomass feedstock production, such as forest cultivation, forest management and carbon stock changes on the landscape resulting from direct or indirect land-use change (Figure 1), are excluded from this study. According to Neopane et al. [10], the transportation of woodchips to production mill has the highest impact contributions to the environment, followed by forest harvesting and processing. The feedstock production stage has minimal environmental impact [10,17]. We also do not include inputs from any activities that would occur “downstream” of biofuel production, distribution and end use (Figure 1). Compared with the previous LCA analysis by Zhang et al. [20], new analysis regarding energy usage during biomass supply was added. GHG emissions analysis was updated with current and more accurate data available from Handler et al. [21].
Figure 1. Diagram of system boundary for life-cycle assessment of the forest biomass supply chain.
Energies 08 03258 g001

2.2. Functional Unit

The functional unit is defined as 4 PJ (3,791,268 Million BTU) of energy that 189 ML (50 million gallons) of ethanol can provide. For the reference system of petroleum-based fuel production, 126 ML (33 million gallons) of gasoline are needed to provide the same amount of energy. This is due to the low energy content of ethanol; 5.678 L (1.5 gallons) of ethanol has the energy equivalent 120 MJ (113,738 BTU) of 3.785 L (1 gallon) of gasoline [22]. Note, it is assumed that all environmental loads are assigned to the main product (ethanol); no allocation is conducted.

2.3. Life Cycle Input Data

The data and assumptions required for this study were collected from SimaPro database and peer-reviewed literature sources. Only direct material and energy inputs used during wood harvesting and transportation were considered. Of these inputs, fuel is the most important. Other inputs include major equipment used to harvest and transport wood (harvesters, forwarders, log trucks, etc.). Estimates of lubricants and inputs associated with machine construction, maintenance and replacing capital equipment were considered.

2.3.1. Harvesting/Forwarding

In the previous life cycle study, estimates of harvesting and forwarding activity assumed the use of 100% cut-to-length (CTL) processor/forwarder and clear-cutting harvest methods [20]. While in practice, this is not always the case. According to Handler et al. [21], three main harvesting/forwarding equipment configurations may be used to characterize the logging industry in Michigan: (a) cut-to-length full processor/forwarder; (b) feller-buncher/skidder/slasher; and (c) chainsaws/skidder. There also exist three harvesting types including (a) clearcutting all merchantable timber; (b) a 70% (shelterwood) removal treatment; and (c) a 30% (selective cut) removal treatment [21]. For the purpose of this study, all three harvesting configurations and all three harvesting types were considered.
Based on the productivity estimates for different species within Michigan [21] (p. 67, Table 2), average productivities for different logging equipment configurations were calculated, as shown in columns A–C in Table 1. Note that values for softwood plantations were left out because they are uncommon in Michigan [21]. Based on the assumed proportion of harvesting performed in each scenario by each equipment configuration [21] (p. 68, Table 3), weighted average productivities for combining all three harvesting configurations were calculated and shown in the right hand (D) column in Table 1. Further data aggregation was conducted by consolidating all three harvesting scenarios and a single weighted average productivity of 8.85 tonnes/h was achieved.
Table 1. Average productivities for different logging equipment configurations.
Harvesting ScenarioAverage Productivity per Harvester (tonnes/h)Weighted Average Productivity (tonnes/h)
A: Full ProcessorB: Feller-BuncherC: ChainsawsD: Combined
30% Selective Cut7.907.644.137.41
70% Shelterwood9.4210.234.289.57
Clearcut12.2614.093.7912.44
Using the same data aggregation method, estimates were conducted for diesel fuel use (L/h), lubricants (L/d), grease (kg/d), and the number of major pieces of equipment. The results are summarized in Table 2. To make valid comparisons with different studies in the literature, it is essential to make several assumptions regarding harvesting activity. These assumptions included:
  • Loggers had an average productive work day of 8 h [21].
  • The lifetime productivity of a major piece of harvesting equipment (harvester, forwarder, skidder, etc.) was assumed to be 145,120 tonnes (160,000 tons). The lifetime tonnes were calculated based on assumed working time of 10 years, 40 weeks/year, 8 loads/day, and 45 tonnes/load (50 tons/load) [20].
  • Emissions factors of harvesting/forwarding machine production were calculated based on data available for Swedish forwarder, about 41,873 kg GHGs per machine [20,23]. An assumption of 50% addition for lifetime repairs and maintenance was made. The emissions data was then normalized to 145,120 lifetime green tonnes (160,000 lifetime green tons) [20]. In this study, it is assumed that a green tonne is based on a wet weight basis of which 50% of the load weight is water.
Table 2. Estimated diesel fuel use (L/h), lubricants (L/d), Grease (kg/d), and the number of major pieces of equipment.
Harvesting ScenarioFuel Use (L/h)Lubricants (L/d)Grease (kg/d)Equipment
30% Selective Cut41.4715.770.612.35
70% Shelterwood42.8816.160.632.45
Clearcut33.1723.710.862.10
Combing all scenarios40.0917.430.662.32
Based on data aggregation and assumptions, emission and energy factors and inputs for forest biomass harvesting were summarized in Table 3.
Table 3. Data and assumptions for forest biomass harvesting/forwarding.
ItemData in SI unitsSource
Diesel fuel use40.09 L/h Calculated based on data from Handler et al., 2014 [21]
Diesel emissions factor3.60 kg CO2eq/LGREET upstream production [24], US LCI combustion [25]
Diesel energy factor40.6 MJ/LKlvac et al., 2003 [23], Handler et al., 2014 [21]
Emissions for machine production, maintenance0.433 kg CO2eq/tonneAthanadiassis et al., 2002 [26], (based on forwarder). Assumed repair, lifetime production
Energy for machine production, maintenance7.55 MJ/tonneHandler et al., 2014 [21], assumed average for now
Oil/lubricant use0.2554 L/tonneAthanassiadis et al., 2002 [26], Handler et al., 2014 [21]
Oil, lubricant emissions factor0.261 kg CO2eq/LAthanadiassis, 2000 [27]
Oil, lubricant energy factor57.9 MJ/LKlvac et al., 2003 [23], Handler et al., 2014 [21]
Grease use0.71 kg/dCalculated based on data from Handler et al., [21]
Grease emissions factor0Handler et al., 2014 [21]
Grease energy factor76.7 MJ/LFrischknecht et al., 2005 [28], Handler et al., 2014 [21]
Total emissions factor17.38 kg CO2eq/tonne
6.15% of emissions due to non-operational factors
Total energy factor216.49 MJ/tonne
15.01% of energy due to non-operational factors

2.3.2. Truck/Rail Transportation

Two biomass transportation modes were considered in this study and included truck and rail. Truck capacity is assumed to be 41 tonnes (45 tons) with 50% loaded miles. This is because no backhaul was considered. According to interviews with forest products industry workers, trucks are assumed to have a lifetime of 10 years with a transportation distance of 120,675 km (75,000 miles) each year [20]. Railcars are assumed to have 32,180,000 lifetime in kilometers (20,000,000 lifetime miles) with 1,814 tonnes (2,000 tons) per load on average [20]. Table 4 is a summary of data and assumptions for truck transportation; Table 5 is for rail transportation. The total GHG emissions per tonne-km for log trucks are calculated as 0.117 kg. Of these emissions, 1.92% is due to non-operational factors. The total energy factor per tonne-km for log trucks is calculated as 1.35 MJ. Out of this, 3.94% of the energy consumption is due to log truck production and maintenance. For rail transportation, the total GHG emissions factor is calculated as 0.0236 kg/tonne-km. Of these emissions, 0.18% is contributed by rail equipment production and maintenance. The total energy factor is calculated as 0.00266 MJ/tonne-km. Out of this, 34.94% of the energy is consumed during rail equipment production and maintenance period. Compared to truck transportation, rail is more environmental friendly by saving about 80% GHG emissions per ton-mile and small amount of energy consumption. But to choose one transportation mode over another, additional factors, such as equipment construction cost and operational cost, should also be considered.
Table 4. Data and assumptions for truck transportation.
ItemData in SI UnitsSource
Log truck fuel use 0.0319 L/tonne-kmLogger interviews [20]
Emissions for log truck production, maintenance55,400 kg CO2eqEcoinvent database for 40-t lorry production, maintenance [28]
Energy use for log truck production, maintenance1,308,350 MJEcoinvent database for 40-t lorry production, maintenance [28]
Total emissions factor0.117 kg CO2eq/tonne-km
1.92% due to non-operational factors
Total energy factor 1.35 MJ/tonne-km
3.94% due to non-operational factors
Table 5. Data and assumptions for rail transportation.
ItemData in SI unitsSource
Rail emissions factor 0.0236 kg CO2eq/tonne-kmCN Railroad [29]
Rail energy factor0.00656 L/tonne-kmCN Railroad [29]
Emissions for rail equipment production, maintenance2,537,000 kg CO2eqEcoinvent database for long-distance train production, maintenance, no rail lines included [28]
Energy for rail equipment production, maintenance54,368,890 MJEcoinvent database for long-distance train production, maintenance, no rail lines included [28]
Total rail emissions factor0.0236 kg CO2eq/tonne-km
0.18% non-operational factors
Total rail energy factor0.00266 MJ/tonne-km
34.94% non-operational factors

3. Case Study: Gaylord Biofuel Facility

The State of Michigan, especially the northern portion of the Lower Peninsula, has a large biomass resource base which could be used as feedstock for biofuel facilities. More than half (54%) of Michigan’s land area was in 2009 covered by forests [30]. The City of Gaylord in the Lower Peninsula, Michigan (the L.P.) has been selected as the most preferable candidate location, based on Arena simulation modeling and optimization methods [31]. The assessment of life cycle energy and GHG emissions was firstly applied to forest biomass harvesting and transport for a Gaylord facility in the L.P., which fills a gap in this research stream. Eight suppliers with available quantities of biomass and rectilinear distance to the Gaylord were noted in the study by Zhang et al. [
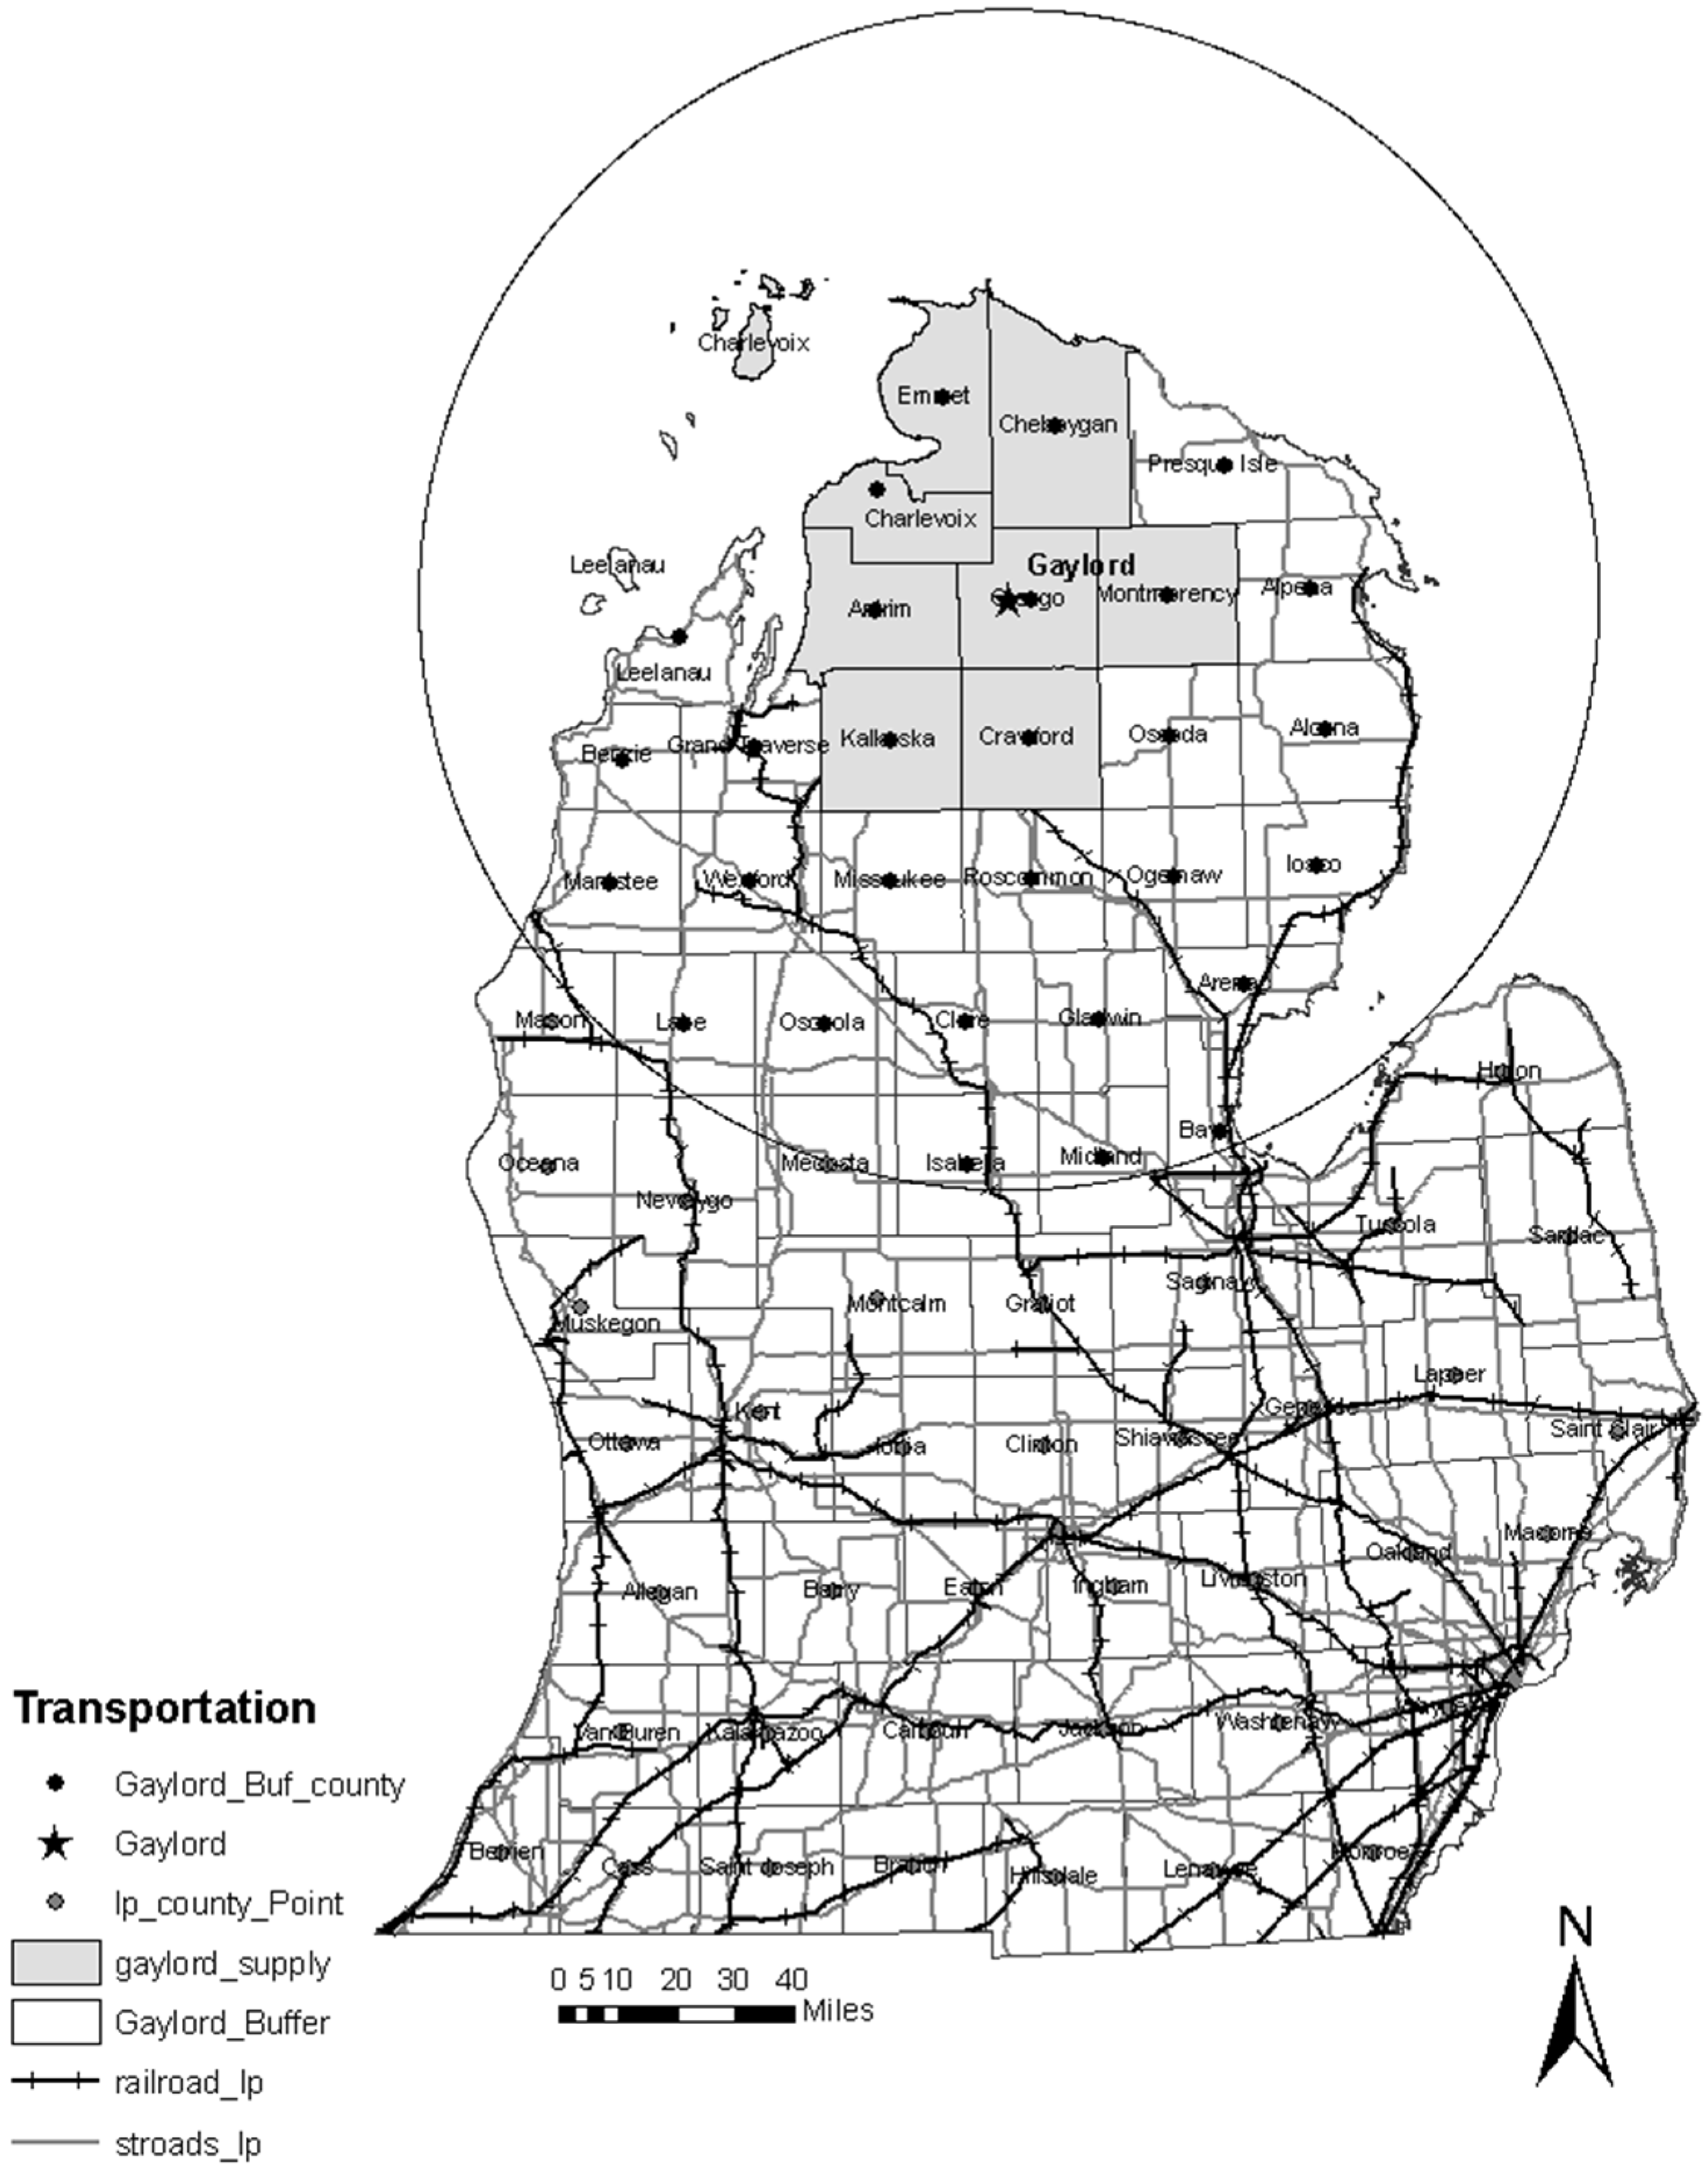
31]. The rectilinear distance is calculated based on latitude and longitude values and is used as the transportation distance for a supplier to the Gaylord biofuel facility. The map of the Gaylord is shown in Figure 2. The circle in Figure 2 is a 161-km (100-mile) radius, which was used to identify potential biofuel facility locations [31].
In Figure 2, the Upper Peninsula of Michigan (the U.P.) is excluded because it is assumed that all forest feedstock in the U.P. is not available for transport over the Mackinaw Bridge and will be consumed by others in the U.P. The assumption was made based on the knowledge of a biofuel facility to be constructed in the Township of Kinross in Michigan’s eastern Upper Peninsula. The biofuel facility will use woody biomass as feedstock to produce up to 151 ML (40 million gallons) of ethanol per year.
To support a 189 ML (50 MGY) biofuel facility, the amount of biomass required is 1,133,750 tonnes (1,250,000 tons), based on an assumed conversion rate of 167 L/green tonne (40 gallons/green ton) [32,33]. Since all the transportation distances are within 80-km (50-mile) radius of the Gaylord city [31] (p. 389, Table 3), no rail transportation is considered. In addition, no backhaul is considered in this study. The calculation for energy use and GHG emissions is based on roundtrip truck transportation.
Figure 2. The map of the Gaylord city and the eight suppliers in Michigan.
Energies 08 03258 g002

4. Sensitivity Analysis and Discussion

Based on the life cycle analysis for the supply chain system, the results are shown in Table 6 and Table 7. The proposed 189 ML (50 MGY) biofuel facility results in emissions of 6.404 g CO2 equivalent per mega joule (MJ) of ethanol produced, when no co-product credits are considered. Compared to petroleum gasoline, which emits 16.773 g CO2 equivalent per MJ (2005 baseline) [20], this would result in a 62% reduction in greenhouse gas emissions. The value of 16.773 g CO2 equivalent per MJ for gasoline includes two stages [20]:
(1)
Crude oil mix extraction/processing within U.S. or exporting countries;
(2)
Crude oil mix transport within exporting countries via pipeline, crude oil mix ocean transport to domestic ports via tanker, and crude oil mix domestic transport via pipeline.
Table 6. Emissions for harvesting and truck transportation stages.
StageGHG Emission (CO2eq)
million kgg/MJ Ethanol Produced%
Harvesting/forwarding19.7504.93877.11%
Truck transportation5.8641.46622.89%
Total25.6146.404100%
Table 7. Energy for harvesting and truck transportation stages.
StageEnergy Use
TJKJ/MJ Ethanol ProducedEPR%
Harvesting/forwarding246.7561.6916.2178.59%
Truck transportation67.2416.8159.4921.41%
Total313.9978.5012.74100%
For the forest biomass supply chain system via truck (Table 6 and Table 7), the life cycle stages of harvesting/forwarding generates the most carbon footprint (77.11%) and consumes the most fossil fuel (78.59%). This conclusion is different from Handler’s study [21], where transport is the larger source of environmental impacts. This may be due to the long transportation distances (100 km baseline) assumed in Handler’s study.
Energy payback ratio (EPR) was also calculated (Table 7), which is defined as energy output over energy input. The EPR is 16.21 for biomass harvesting/forwarding and 59.49 for truck transportation. The calculation results indicate that the transportation stage is more energy efficient than the harvesting/forwarding stage. This conclusion is consistent with GHG emissions calculation results.
The results were compared to other published literature shown in Table 8. Although extensive LCA studies have been conducted on biofuel logistics, the sources [8,17,18,19,21] were chosen based on the forest feedstock type, which makes the comparison more persuasive. As shown in Table 8, the per unit values of energy demand and GHG emissions during the harvest operation is within a reasonable range as compared to prior research [8,17,18,19,21]. The values for transport stage show an obvious decrease. This may be because the case study is conducted in different countries (Sweden and Spain) [18], the locations of forest feedstock in mountain areas increase hauling inputs [19], and the assumption of long transport distances [21].
Table 8. Comparison of forest biomass supply life cycle environmental impacts.
SourcesGHG Emissions kg CO2eq/tonneFossil Energy Demand MJ/tonne
HarvestingTransportTotalHarvestingTransportTotal
Sonne, 2006 [17]17.438.255.6n/a
Gonzalez-Garcia et al., 2009 [18]n/a283–340226–100509–440
Slade et al., 2009 [8]23.89.233n/a
Valente et al., 2011 [19]15.210.225.4204155359
Handler et al., 2014 [21]17.822.540.4233263496
This study17.45.222.621859277
Sensitivity analysis for key inputs to harvesting and transportation operations was conducted. Key inputs to harvesting operation include environmental impact factors (e.g., GHG intensity of fuel use, lubes/oils, machine production and repair), proportion of different harvesting systems and their productivity, use of different harvesting type.
Additional factors considered for truck transportation operations include fuel economy and truck capacity. These input variables were increased or decreased by 10% to observe resulting changes in overall GHG emissions and energy use for harvesting or transport operations. Percentage changes were also calculated in below Table 9 and Table 10.
Table 9. Resulting changes in GHG emissions for harvesting or transport operations by increasing or decreasing input variables by 10%.
Input VariablesGHG Emission (million kg CO2eq)Percentage Changes of Emission
Increase 10%Decrease 10%Increase 10%Decrease 10%
Harvesting data
GHG intensity of fuel use21.54717.8509.39%−9.38%
GHG intensity of lubes/oils19.70619.6910.04%−0.04%
GHG intensity of machine fab./rep19.81219.5840.58%−0.58%
Productivity of system A19.69419.703−0.02%0.03%
Productivity of system B19.69619.701−0.01%0.02%
Productivity of system C19.69819.6990.00%0.01%
Use of system A19.69519.692−0.02%−0.03%
Use of system B19.76319.6290.33%−0.35%
Use of system C19.62219.750−0.39%0.26%
Use of selective cuts19.70319.6940.03%−0.02%
Use of shelter wood cuts19.70819.6890.05%−0.05%
Use of clear-cuts19.68419.713−0.07%0.08%
Transportation data
GHG intensity of fuel use6.4335.2849.76%−9.84%
GHG intensity of machine fab./rep5.8705.8470.15%−0.24%
Fuel economy of trucks5.3416.503−8.87%10.95%
Capacity of trucks 5.8545.877−0.12%0.27%
From Table 9 we observed that GHG intensity of fuel use impacts GHG emissions the most. As the intensity factor increase 10%, the GHG emissions due to harvesting operations increased about 9.39%, and vice versa. The GHG emissions attributed to truck transportation increased about 9.76%, and vice versa.
For transportation operations, the factor of fuel economy also played a very important role. As fuel economy increases 10%, the emissions decrease about 8.87%. All other factors have minor impacts on calculation results. Similar conclusions can be drawn by observing the changes in energy use for harvesting or transport operations in Table 10. Therefore, to reduce GHG emissions and energy use for woody biomass harvesting and transportation stages, efforts should be focused on upper stream fossil fuel production and improve fuel economy.
Table 10. Resulting changes in energy use for harvesting or transport operations by increasing or decreasing input variables by 10%.
Input VariablesEnergy Use (TJ)Percentage Changes of Energy
Increase 10%Decrease 10%Increase 10%Decrease 10%
Harvesting data
Energy intensity of fuel use266.111224.4278.50%−8.50%
Energy intensity of lubes/oils246.886243.6510.66%−0.66%
Energy intensity of machine fab./rep247.255243.2820.81%−0.81%
Energy intensity of grease245.350245.1880.03%−0.03%
Productivity of system A244.328246.327−0.38%0.43%
Productivity of system B244.646245.941−0.25%0.27%
Productivity of system C245.231245.325−0.02%0.02%
Use of system A246.676243.7470.57%−0.62%
Use of system B245.499244.9370.09%−0.14%
Use of system C243.389246.752−0.77%0.60%
Use of selective cuts245.633244.9280.15%−0.14%
Use of shelter wood cuts245.185245.351−0.03%0.03%
Use of clear-cuts245.001245.538−0.11%0.11%
Transportation data
Energy intensity of fuel use73.98761.0189.57%−9.63%
Energy intensity of machine fab./rep67.76967.2370.37%−0.42%
Fuel economy of trucks61.34274.442−9.15%10.25%
Capacity of trucks 67.02067.503−0.74%−0.03%

5. Summary and Conclusions

Using information sources from open literature reviews and database sources, a life-cycle assessment of the forest biomass supply for biofuel production in Michigan was conducted. GHG emissions and fossil energy use for harvesting and transportation stages were calculated. Compared with our previous life cycle analysis [20], more accurate data were collected and new analysis for energy demand and EPR was added. The research method was applied to a Gaylord biofuel facility in Michigan. By choosing petroleum-based fuel production as the reference system, our results support that biofuel production from forest biomass is more environmentally friendly.
Sensitivity analysis was conducted for key inputs to harvesting and transportation operations. Key inputs to harvesting operation include environmental impact factors (e.g., GHG intensity of fuel use, lubes/oils, machine production and repair), proportion of different harvesting systems and their productivity, use of different harvesting type. Additional factors considered for truck transportation operations include fuel economy and truck capacity. These input variables were increased or decreased by 10% to observe resulting changes in overall GHG emissions and energy use for harvesting or transport operations. The results indicate that research focused on improving biomass recovery efficiency and truck fuel economy will help to reduce GHG emissions and energy use further.
For forest biomass supply, the rail supply system may produce fewer amounts of GHG emissions or consume less fossil energy compared with the truck supply system. However, to choose one supply chain system over another, additional criteria, such as system cost and the availability of rail system, should be examined. To make a reasonable decision, further investigation is required.

Acknowledgments

This research was mainly supported through an agreement with the Michigan Economic Development Corporation with funding from the U.S. Department of Energy award DE-EE-0000280. This research was also supported by Science Foundation of China University of Petroleum, Beijing (No. 2462014YJRC039 and No. 2462014YJRC040).

Author Contributions

Fengli Zhang developed the research method, conducted the LCA analysis and wrote the paper. Dana M. Johnson contributed to the earlier research study and to several research studies cited in this paper. Dana M. Johnson and Jinjiang Wang helped collect the data and improve the wording of the paper.

Conflicts of Interest

The authors declare no conflict of interest.

References

  1. Goerold, T.R. Sources of United States Oil Supply. 2008. Available online: http://www.lookoutmtn.com/Documents/Sources_of_United_States_Oil_Supply.pdf (accessed on 25 June 2014).
  2. Cherubini, F.; Bird, N.D.; Cowie, A.; Jungmeier, G.; Schlamadinger, B.; Woess-Gallasch, S. Energy- and greenhouse gas-based LCA of biofuel and bioenergy systems: Key issues, ranges and recommendations. Resour. Conserv. Recycl. 2009, 53, 434–447. [Google Scholar] [CrossRef]
  3. Andersen, O. Consequential life cycle environmental impact assessment. In Unintended Consequences of Renewable Energy. Problems to be Solved; Springer: London, UK, 2013; pp. 35–45. [Google Scholar]
  4. Consoli, F.; SETAC (Society); LCA “Code of Practice” Workshop (1993: Sesimbra, Portugal). Guidelines for Life-Cycle Assessment: A Code of Practice, 1st ed.; Society of Environmental Toxicology and Chemistry: Pensacola, FL, USA, 1993. [Google Scholar]
  5. Lindfors, L.G.; Christiansen, K.; Hoffmann, L.; Virtanen, Y.; Juntilla, V.; Hanssen, O.J.; Rønning, A.; Ekvall, T.; Finnveden, G. Nordic Guidelines on Life-Cycle Assessment. Nord 1995:20; Nordic Council of Ministers: Copenhagen, Denmark, 1995. [Google Scholar]
  6. ISO 14040—Environmental Management—Life Cycle Assessment—Principles and Framework; The International Organization for Standardization (ISO): Geneva, Switzerland, 2006.
  7. ISO 14044—Environmental Management—Life Cycle Assessment—Requirements and Guideline; The International Organization for Standardization (ISO): Geneva, Switzerland, 2006.
  8. Slade, R.; Bauen, A.; Shah, N. The greenhouse gas emissions performance of cellulosic ethanol supply chains in Europe. Biotechnol. Biofuels 2009, 2. [Google Scholar] [CrossRef]
  9. Von Blottnitz, H.; Curran, M.A. A review of assessments conducted on bio-ethanol as a transportation fuel from a net energy, greenhouse gas, and environmental life cycle perspective. J. Clean. Prod. 2007, 15, 607–619. [Google Scholar] [CrossRef]
  10. Neupane, B.; Halog, A.; Dhungel, S. Attributional life cycle assessment of woodchips for bioethanol production. J. Clean. Prod. 2011, 19, 733–741. [Google Scholar] [CrossRef]
  11. McKechnie, J.; Colombo, S.; Chen, J.; Mabee, W.; MacLean, H.L. Forest bioenergy or forest carbon? Assessing trade-offs in greenhouse gas mitigation with wood-based fuels. Environ. Sci. Technol. 2011, 45, 789–795. [Google Scholar] [CrossRef] [PubMed]
  12. Liu, Z.; Qiu, T.; Chen, B. A study of the LCA based biofuel supply chain multi-objective optimization model with multi-conversion paths in China. Appl. Energy 2014, 126, 221–234. [Google Scholar] [CrossRef]
  13. Peters, J.F.; Iribarren, D.; Dufour, J. Simulation and life cycle assessment of biofuel production via fast pyrolysis and hydroupgrading. Fuel 2014, 139, 441–456. [Google Scholar] [CrossRef]
  14. Møller, F.; Slentø, E.; Frederiksen, P. Integrated well-to-wheel assessment of biofuels combining energy and emission LCA and welfare economic Cost Benefit Analysis. Biomass Bioenergy 2014, 60, 41–49. [Google Scholar] [CrossRef]
  15. Nguyen, L.; Cafferty, K.; Searcy, E.; Spatari, S. Uncertainties in life cycle greenhouse gas emissions from advanced biomass feedstock logistics supply chains in Kansas. Energies 2014, 7, 7125–7146. [Google Scholar] [CrossRef]
  16. Spatari, S.; MacLean, H.L. Characterizing model uncertainties in the life cycle of lignocellulose-based ethanol fuels. Environ. Sci. Technol. 2010, 44, 8773–8780. [Google Scholar] [CrossRef]
  17. Sonne, E. Greenhouse gas emissions from forestry operations: A life cycle assessment. J. Environ. Qual. 2006, 35, 1439–1450. [Google Scholar] [CrossRef] [PubMed]
  18. Gonzalez-Garcia, S.; Berg, S.; Feijoo, G.; Moreira, M.T. Environmental impacts of forest production and supply of pulpwood: Spanish and Swedish case studies. Int. J. Life Cycle Assess. 2009, 14, 340–353. [Google Scholar] [CrossRef]
  19. Valente, C.; Hillring, B.G.; Solberg, B. Bioenergy from mountain forest: A life cycle assessment of the Norwegian woody biomass supply chain. Scand. J. For. Res. 2011, 26, 429–436. [Google Scholar] [CrossRef] [Green Version]
  20. Zhang, F.; Handler, R.; Johnson, D.M.; Shonnard, D.R. Comparative analysis of life cycle greenhouse gas emissions of supply chains for biofuel and fossil fuel production. In Proceedings of the Production and Operations Management Society (POMS) 22nd Annual Conference, Reno, NV, USA, 29 April–2 May 2011.
  21. Handler, R.M.; Shonnard, D.R.; Lautala, P.; Abbas, D.; Srivastava, A. Environmental impacts of roundwood supply chain options in Michigan: Life-cycle assessment of harvest and transport stages. J. Clean. Prod. 2014, 76, 64–73. [Google Scholar] [CrossRef]
  22. Pimentel, D. Ethanol fuels: Energy balance, economics, and environmental impacts are negative. Nat. Resour. Res. 2003, 12, 127–134. [Google Scholar] [CrossRef]
  23. Klvac, R.; Ward, S.; Owende, P.M.O.; Lyons, J. Energy audit of wood harvesting systems. Scand. J. For. Res. 2003, 18, 176–183. [Google Scholar] [CrossRef]
  24. Wang, M. GREET 1, Version 1.8c.0—Fuel-Cycle Model; Argonne National Laboratory: Argonne, WI, USA, 2009. [Google Scholar]
  25. U.S. Life-Cycle Inventory Database. 2009. Available online: http://www.nrel.gov/lci (accessed on 13 July 2014).
  26. Athanassiadis, D.; Lidestav, G.; Nordfjell, T. Energy use and emissions due to the manufacture of a forwarder. Resour. Conserv. Recycl. 2002, 34, 149–160. [Google Scholar] [CrossRef]
  27. Athanassiadis, D. Energy consumption and exhaust emissions in mechanized timber harvesting operations in Sweden. Sci. Total Environ. 2000, 255, 135–143. [Google Scholar] [CrossRef] [PubMed]
  28. Frischknecht, R.; Rebitzer, G. The ecoinvent database system: A comprehensive web-based LCA database. J. Clean. Prod. 2005, 13, 1337–1343. [Google Scholar] [CrossRef]
  29. Canadian National Railroad Greenhouse Gas Calculator Emission Factors. 2009. Available online: http://www.cn.ca/repository/popups/ghg/ghgcalculatoremissionfactors (accessed on 18 September 2014).
  30. Forest Inventory and Analysis. FIA Standard Reports. 2009. Available online: http://fiatools.fs.fed.us/fido/standardrpt.html (accessed on 24 September 2014).
  31. Zhang, F.; Johnson, D.M.; Johnson, M.A. Development of a simulation model of biomass supply chain for biofuel production. Renew. Energy 2012, 44, 380–391. [Google Scholar] [CrossRef]
  32. Zhang, F; Johnson, D.M.; Sutherland, J.W. A GIS-based method for identifying the optimal location for a facility to convert forest biomass to biofuel. Biomass Bioenergy 2011, 35, 3951–3961. [Google Scholar]
  33. Department of Energy. Theoretical Ethanol Yield Calculator. Available online: http://www1.eere.energy.gov/biomass/ethanol_yield_calculator.html (accessed on 5 October 2014).

