Simulation and Analysis of the Initiation of a Squall Line within a Meiyu Frontal System in East China

1
College of Meteorology and Oceanography, National University of Defense Technology, Nanjing 211101, China
2
Collaborative Innovation Center on Forecast and Evaluation of Meteorological Disasters, Nanjing University of Information Science & Technology, Nanjing 210044, China
3
Center for Analysis and Prediction of Storms, University of Oklahoma, Norman, OK 73072, USA
*
Author to whom correspondence should be addressed.
Atmosphere 2018, 9(5), 183; https://doi.org/10.3390/atmos9050183
Submission received: 9 April 2018
/
Revised: 28 April 2018
/
Accepted: 8 May 2018
/
Published: 11 May 2018
(This article belongs to the Section Meteorology)
Abstract
:Based on the ARPS (Advanced Regional Prediction System) at 2 km grid spacing, the convective initiation (CI) of cells that evolved into a squall line on the southern flank of a Meiyu front in East China is investigated. The initiations of four convective cells, denoted CI-A through CI-D, are reasonably captured in the simulation. For CI-A and CI-B, locally enhanced convergence bands associated with boundary layer horizontal convective rolls (HCRs) play a crucial role in determining the exact locations of CIs, whereas a cold outflow boundary from earlier frontal precipitation contributes to additional convergence forcing. For CI-C, initiation occurs directly over the gust front, with the frontal convergence providing the main forcing. CI-D occurs south of and sufficiently far from the gust front, and is mainly forced by the HCR circulations. With surface heat flux turned off in the model, CI is much delayed. Therefore, surface heating increases the convective instability of air south of the front and causes the development of HCRs; it also enhances the gust front convergence by mixing higher southwesterly momentum toward the surface. When the condensation process is turned off, HCRs and/or gust frontal forcing are still able to lift the low-level air to super-saturation where CI is expected.
1. Introduction
The Meiyu front, characterized by strong moisture instead of the temperature gradient, typically establishes itself as a quasi-stationary front in the Yangtze-Huai River basin between mid-June and mid-July in China [1,2]. During the period known as the Meiyu season, the Yangtze River valley region is vulnerable to flooding due to persistent heavy rainfalls. A high fraction of the Meiyu rainfall is due to mesoscale convective systems (MCSs) embedded in the Meiyu frontal system [3]. A deep understanding of the formation and evolution of these MCSs can help us better predict heavy rainfall and severe flooding in the Meiyu season. There have been many studies on the Meiyu frontal system and associated MCSs and heavy precipitation, including studies on the effects of the East Asian summer monsoon [3], large-scale moisture transport by the low-level jet (LLJ) typically found south of the Meiyu front [4,5,6], the eastward propagation of MCSs or mesoscale vortices along the Meiyu front [7,8], and diurnal cycle of precipitation [9,10,11,12]. The initiation of convective cells within the Meiyu frontal system that organizes into MCSs has been little studied, however.
The initiation of deep moist convection is often linked to boundary layer (BL) convergence zones [13,14,15], which are identified by a distinct change in wind direction or speed [16]; the initiation is also very sensitive to BL thermal and moisture conditions [17,18,19]. Generally, convergence zones can deepen the vertical mixing of the local moist BL and create a favorable environment for CIs [20]; such favorable conditions are often observed several hours preceding cloud and storm development [21,22,23,24]. The mesoscale convergence boundaries reviewed in Weckwerth and Parsons [25] as preferable conditions for CI events during the International H2O Project (IHOP_2002 or IHOP) include drylines, frontal zones, gust fronts, horizontal convective rolls (HCRs), bores, and topographically induced convergence lines. Gust fronts exist at the leading edge of cold outflow from precipitation systems and are most frequently associated with the initiations of moist convection in one of two ways. First, air parcels at the gust fronts can be directly forced to form free convection using the propagating cold pool in the form of density currents [26,27,28]. Second, the approach of gust fronts toward other convergence boundaries is able to enhance the localized surface convergence, thereby priming a more favorable region for CIs [29,30].
Most of the afore-referenced studies were based on cases that occurred over the United States Central Great Plains, where the boundary layer is often relatively dry and the thunderstorm outflow and cold pools are strong. In the Meiyu front over the East Asia, the boundary layer is usually very moist, and the role of cold pools in triggering or supporting convection is less clear. Although Wang et al. [4] documented a case where deep convection was found to be triggered by the cold outflow of previous precipitation over the Taiwan Strait in the Meiyu season, the role of southern Strait was emphasized instead of the cold outflow in the BL. Considering the causes of convection leading to the Meiyu precipitation, few studies could be found in a detailed description of the BL process. Meanwhile, previous studies mostly focused on meso-α and meso-β scales, while CI occurs in meso-γ scale. Therefore, in the Mei-yu system, more case studies are needed to better understand the initiations of deep moist convection and the association with the BL process.
HCRs, shown in clear air as counter-rotating vortex rolls with axes approximately parallel to the BL mean wind direction [31], also play an important role in modulating vertical variations in heat, moisture, and momentum within convergent zones [18,32,33,34]. Given proper conditions, upward branches of roll circulations are able to bring BL air to its Level of Free Convection (LFC) to form an active, deep, moist convective cloud in the absence of additional vertical lifting provided by the intersection with other convergent boundaries [35]. However, clouds and precipitation are prevalent during Meiyu season, and little attention has been paid to the potential role of BL HCRs to CIs within Meiyu frontal systems so far.
This paper focuses on the initiation of convective cells within a Meiyu frontal system that occurred in the Intensive Observing Period (IOP) Number 8 in the field campaign of the OPACC (Observation, Prediction and Analysis of Severe Convection of China) Project [36] on 12 July 2014 over the Yangtze River region. On this day, the initial convective cells were triggered in the late morning (around 11 a.m. Beijing standard time (BST), BST = UTC + 8 h) on the south side of a Meiyu frontal system, close to the leading edge of a cold dome formed by prior precipitation associated with the front. HCRs are found to be present in the numerical simulations. The convective cells eventually formed an east-west-oriented long squall line.
This paper employs numerical simulations and takes advantages of data assimilation to study the initiation of initial cells during IOP-8. The main purpose of this study is as follows: the first is to obtain as realistic as possible simulation of CIs of the IOP-8 case by assimilating surface observational data and documented large-scale and mesoscale conditions favorable to the storm development. The second is to explore the detailed mechanisms leading to the storm initiations, including processes providing the lifting forcing at the exact locations.
The rest of the paper is organized as follows. Section 2 describes the data, numerical model configurations, and data assimilation method used. Section 3 presents an overview of the synoptic environment and the observed CIs and evolution processes. Section 4 introduces the simulated storms with and without data assimilation, with verifications against radar observations. Section 5 carries out detailed analyses on the BL structures, specific CI processes, and their interactions. Section 6 presents additional sensitivity experiments to examine the contributions of dynamic forcing and thermal-dynamic feedback to CIs. Summary and conclusions are given in the final section.
2. Data, Numerical Model, and Experimental Design
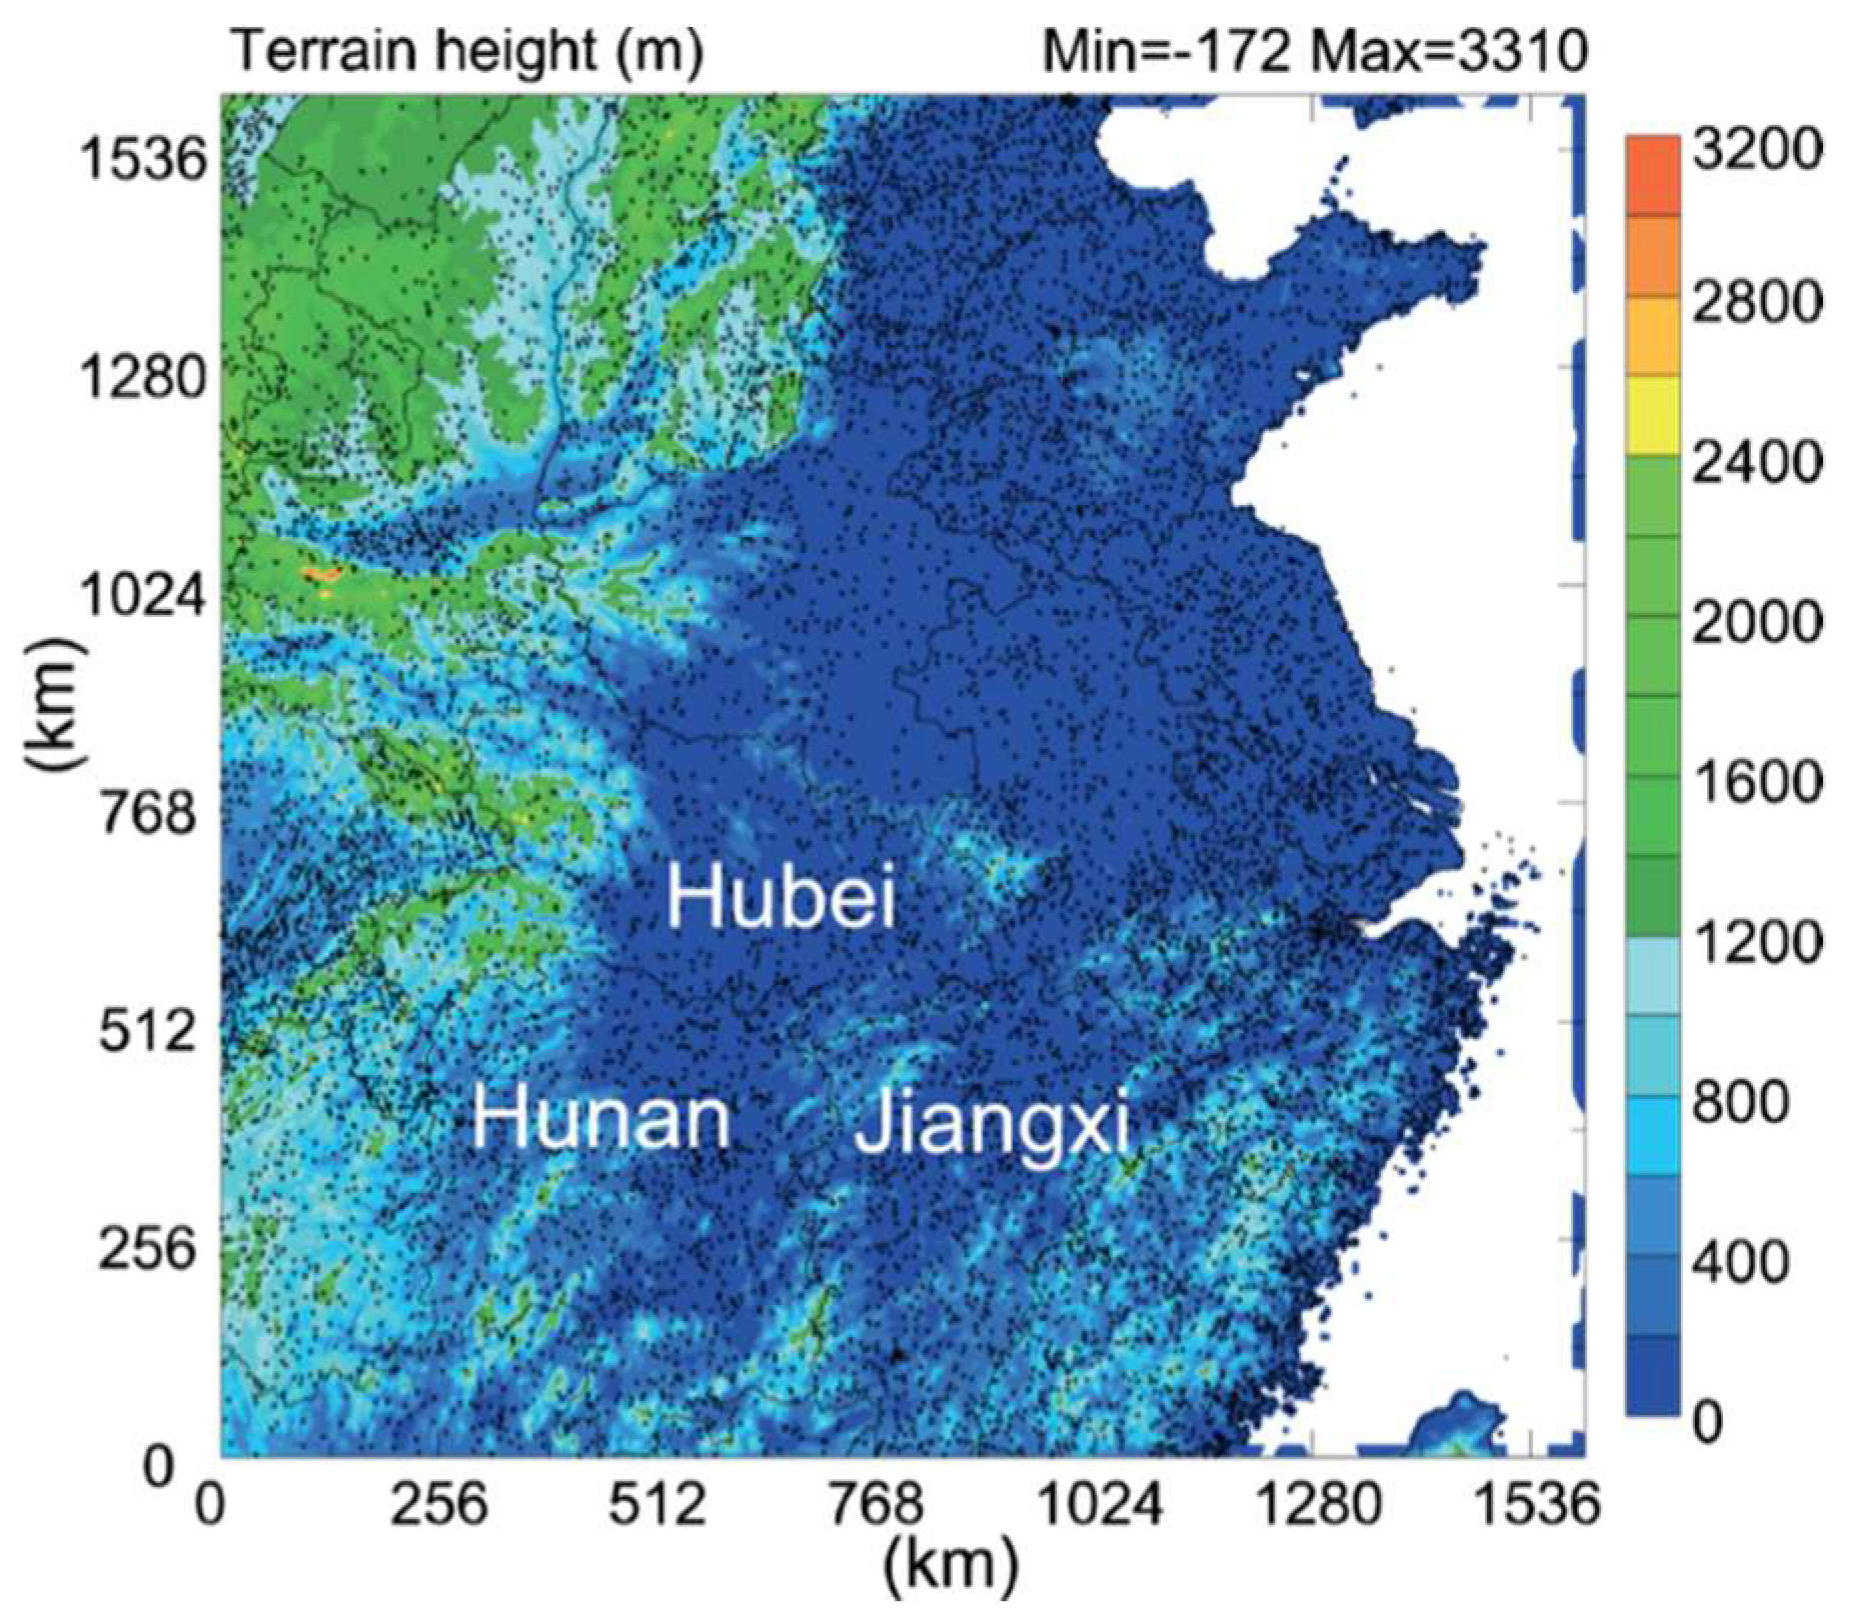
The numerical model used in this study is the Advanced Regional Prediction System (ARPS) [37], which is a non-hydrostatic atmospheric model capable of simulating and predicting mesoscale and convective scale systems. A model domain of 803 × 803 horizontal grid points (Figure 1) with fifty-three vertical layers at 2-km grid spacing is applied. NCEP operational GFS (Global Forecast System) 0.5° global analysis data at 6-h intervals are chosen as the lateral boundary conditions. The major parameterizations of the atmospheric processes include the Lin et al. [38] three-ice scheme for microphysics and the 1.5 order TKE (Turbulence Kinetic Energy)-based subgrid-scale turbulence parameterization, and the TKE-based non-local PBL mixing parameterization.
The initial condition of our control simulation (denoted CNTL) is produced by the ARPS three-dimensional variational (3DVAR) data analysis system [39]. The 3DVAR analysis is performed at 0000 UTC 12 July 2014, using the GFS global analysis as the background. Surface observations, including those of humidity, temperature, and wind from automated weather stations, are assimilated into the model initial condition. Automated weather stations distributed within the model domain are marked with unfilled triangles in Figure 1. Starting from the initiation condition at 0000 UTC, the ARPS model is run for 16 h until 1600 UTC 12 July 2014. Another experiment is also performed that starts from the GFS analysis without ARPS 3DVAR data assimilation (denoted as no-DA) for comparison purpose. The data of these experiments can be accessed at Baidu Cloud Storage [40]. In addition, two sensitivity experiments are performed which are the same as CNTL except that the surface heat flux or the latent heating process is turned off.
3. Overview of the IOP-8 Case
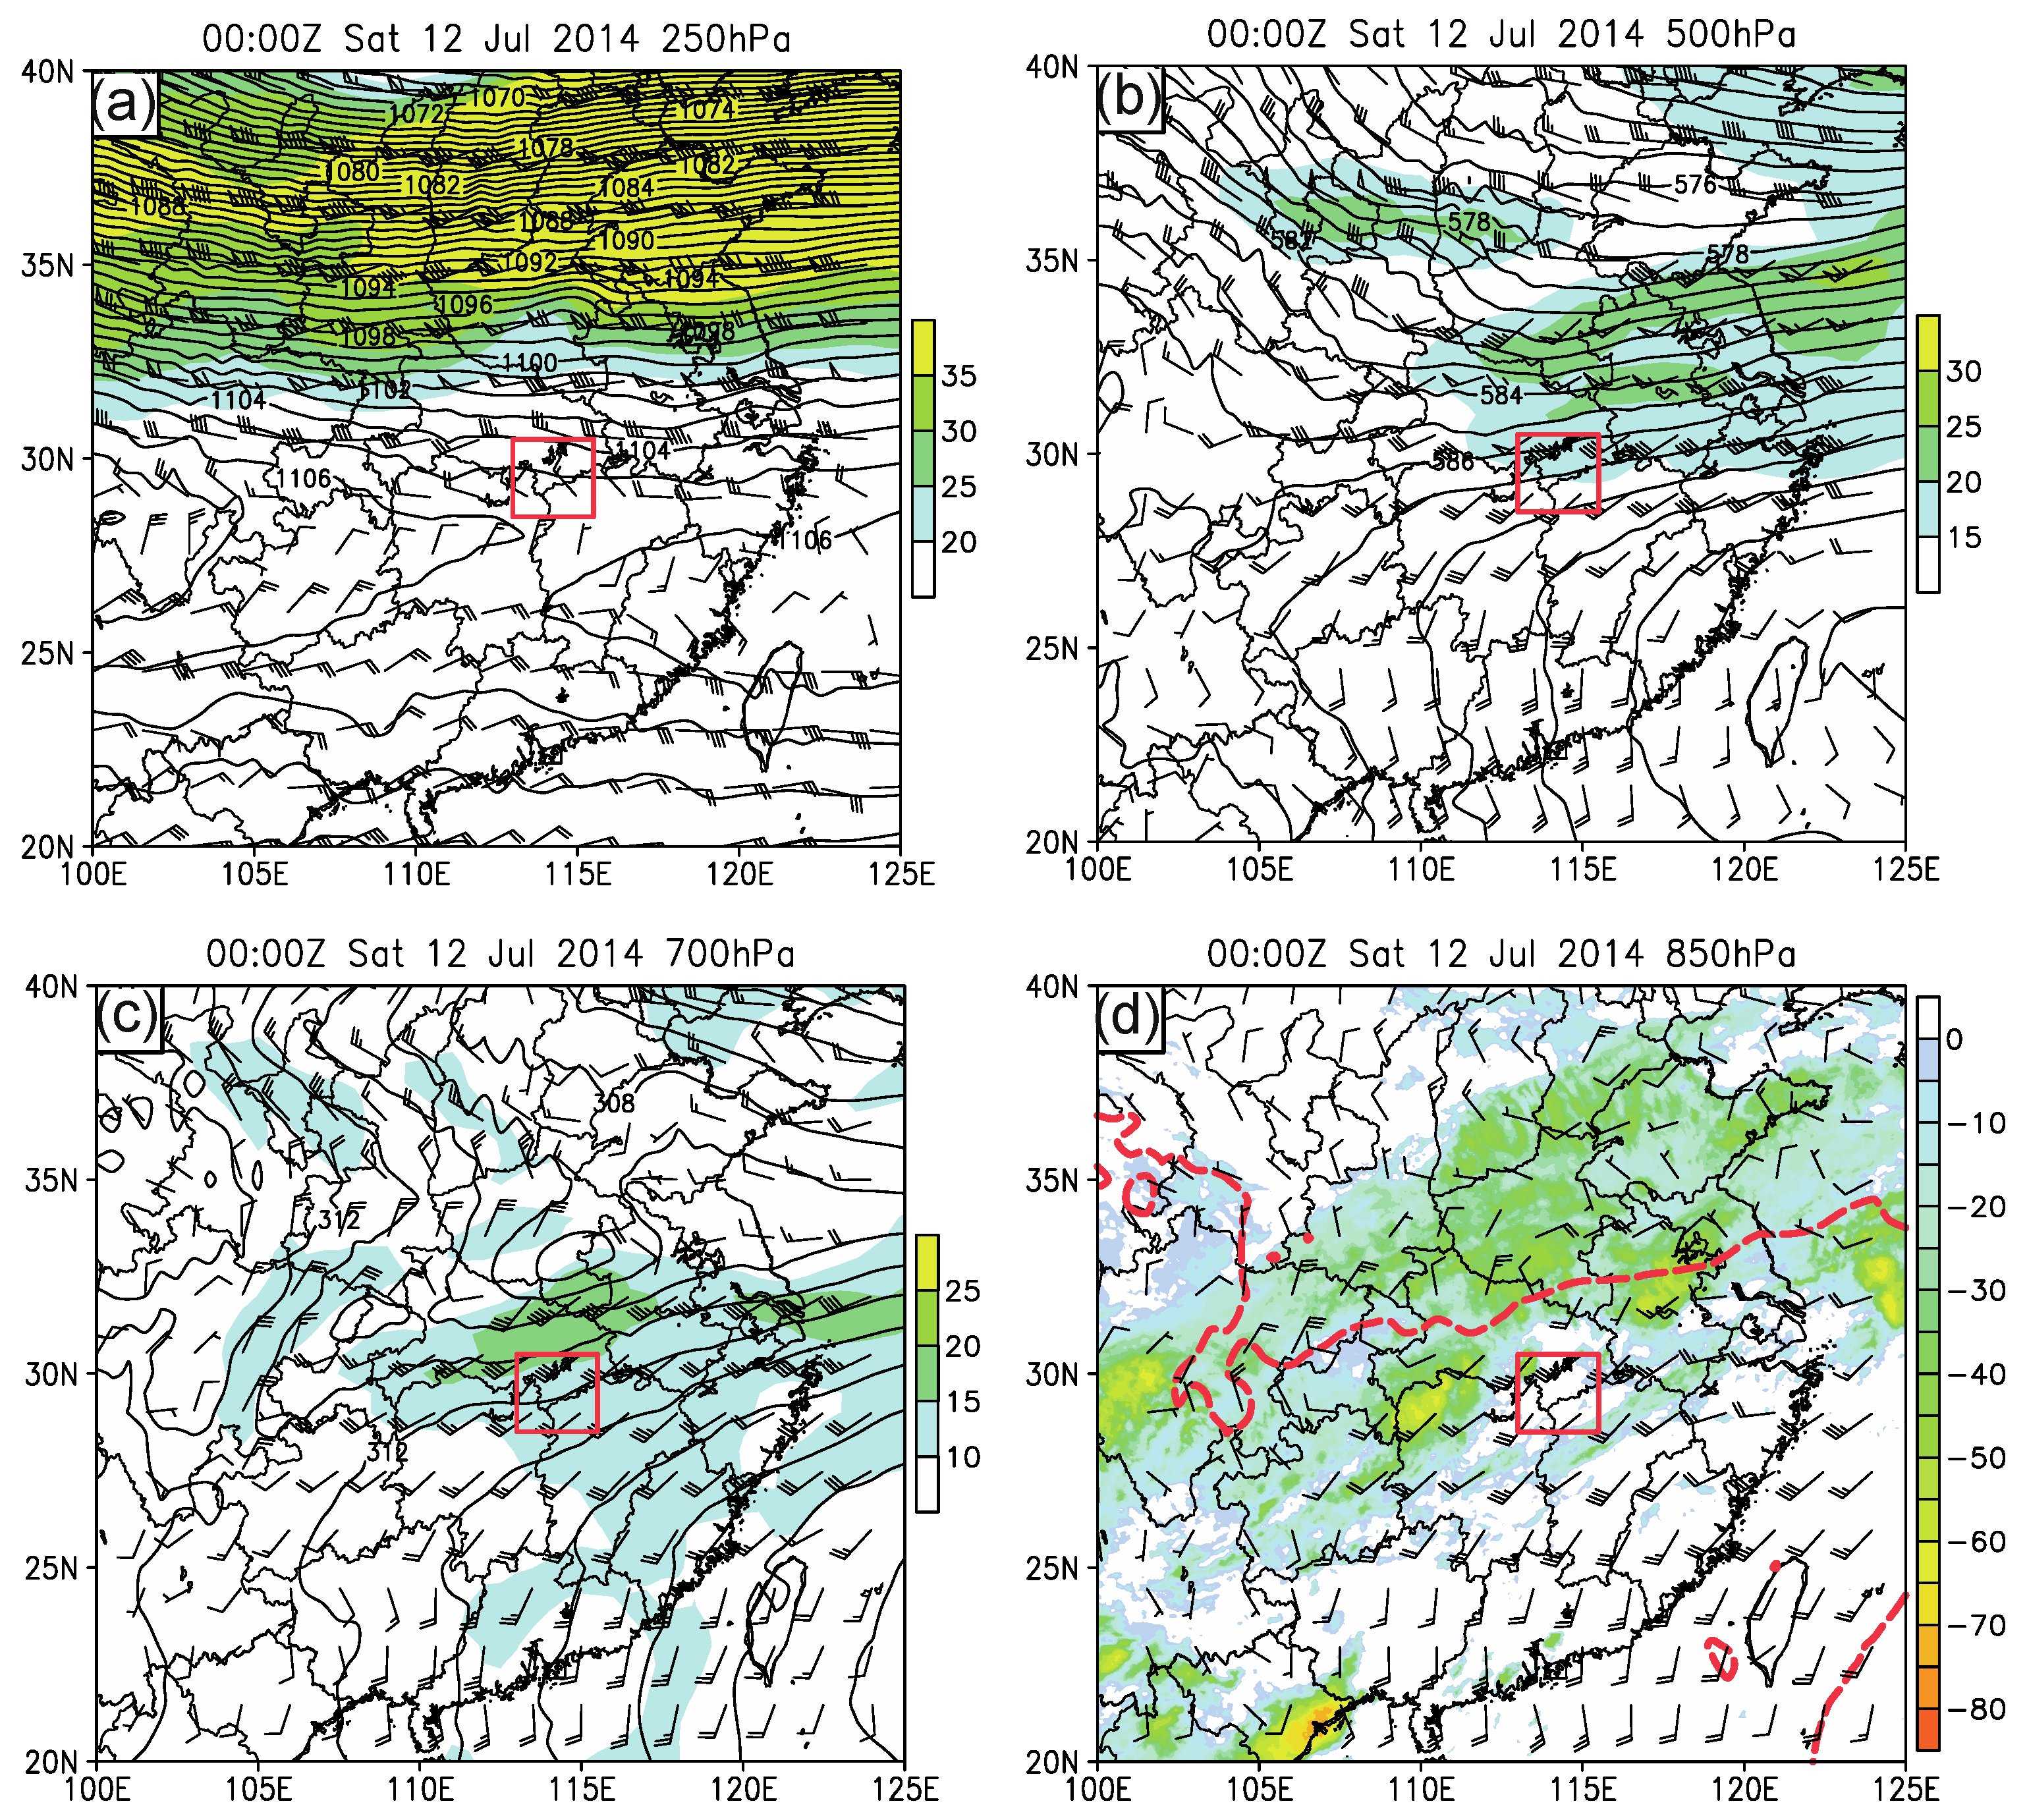
At 0000 UTC (0800 BST, three hours preceding CIs) 12 July 2014, a wide westerly to northwesterly wind zone was situated to the north of the CI region (marked as the red box) at 250 hPa (Figure 2a), providing a favorable upper-level wind divergence field. At 500 hPa, the strong southwesterly flow from the summer monsoon and the westerly flow from the north of the subtropical high merged near the Huanghai Sea, producing a maximum wind belt larger than 20 m s−1 extending to the CI region (Figure 2b), which also corresponded to a southwesterly jet at 700 hPa (Figure 2c). The northwesterly flow and southwesterly jet were separated by a shallow trough at 500 hPa, which showed up as a low vortex at 700 hPa but was invisible at 250 hPa. Associated with this shallow trough at 850 hPa (Figure 2d) was a clear wind shift line from the southwest to northeast, which was almost collocated with the surface Meiyu front position, which can be roughly represented as 345 K equivalent potential temperature () [5] (red dashed line).
The existing frontal precipitation featured by the black body temperature (TBB) was located on both sides of the Meiyu front. Generally, these clouds and precipitation associated with the Meiyu front can last over 20 days and are associated with the Meiyu front, whose position always undergoes a meridional migration with the shift of surrounding synoptic systems. As a result of the advanced cold northwesterly flow, the Meiyu front and associated mid-level trough in this case retreated a little to the south. Under these circumstances, both the upper-level divergence and low-level convergence near the CI region make the environmental conditions more favorable for deep convection.
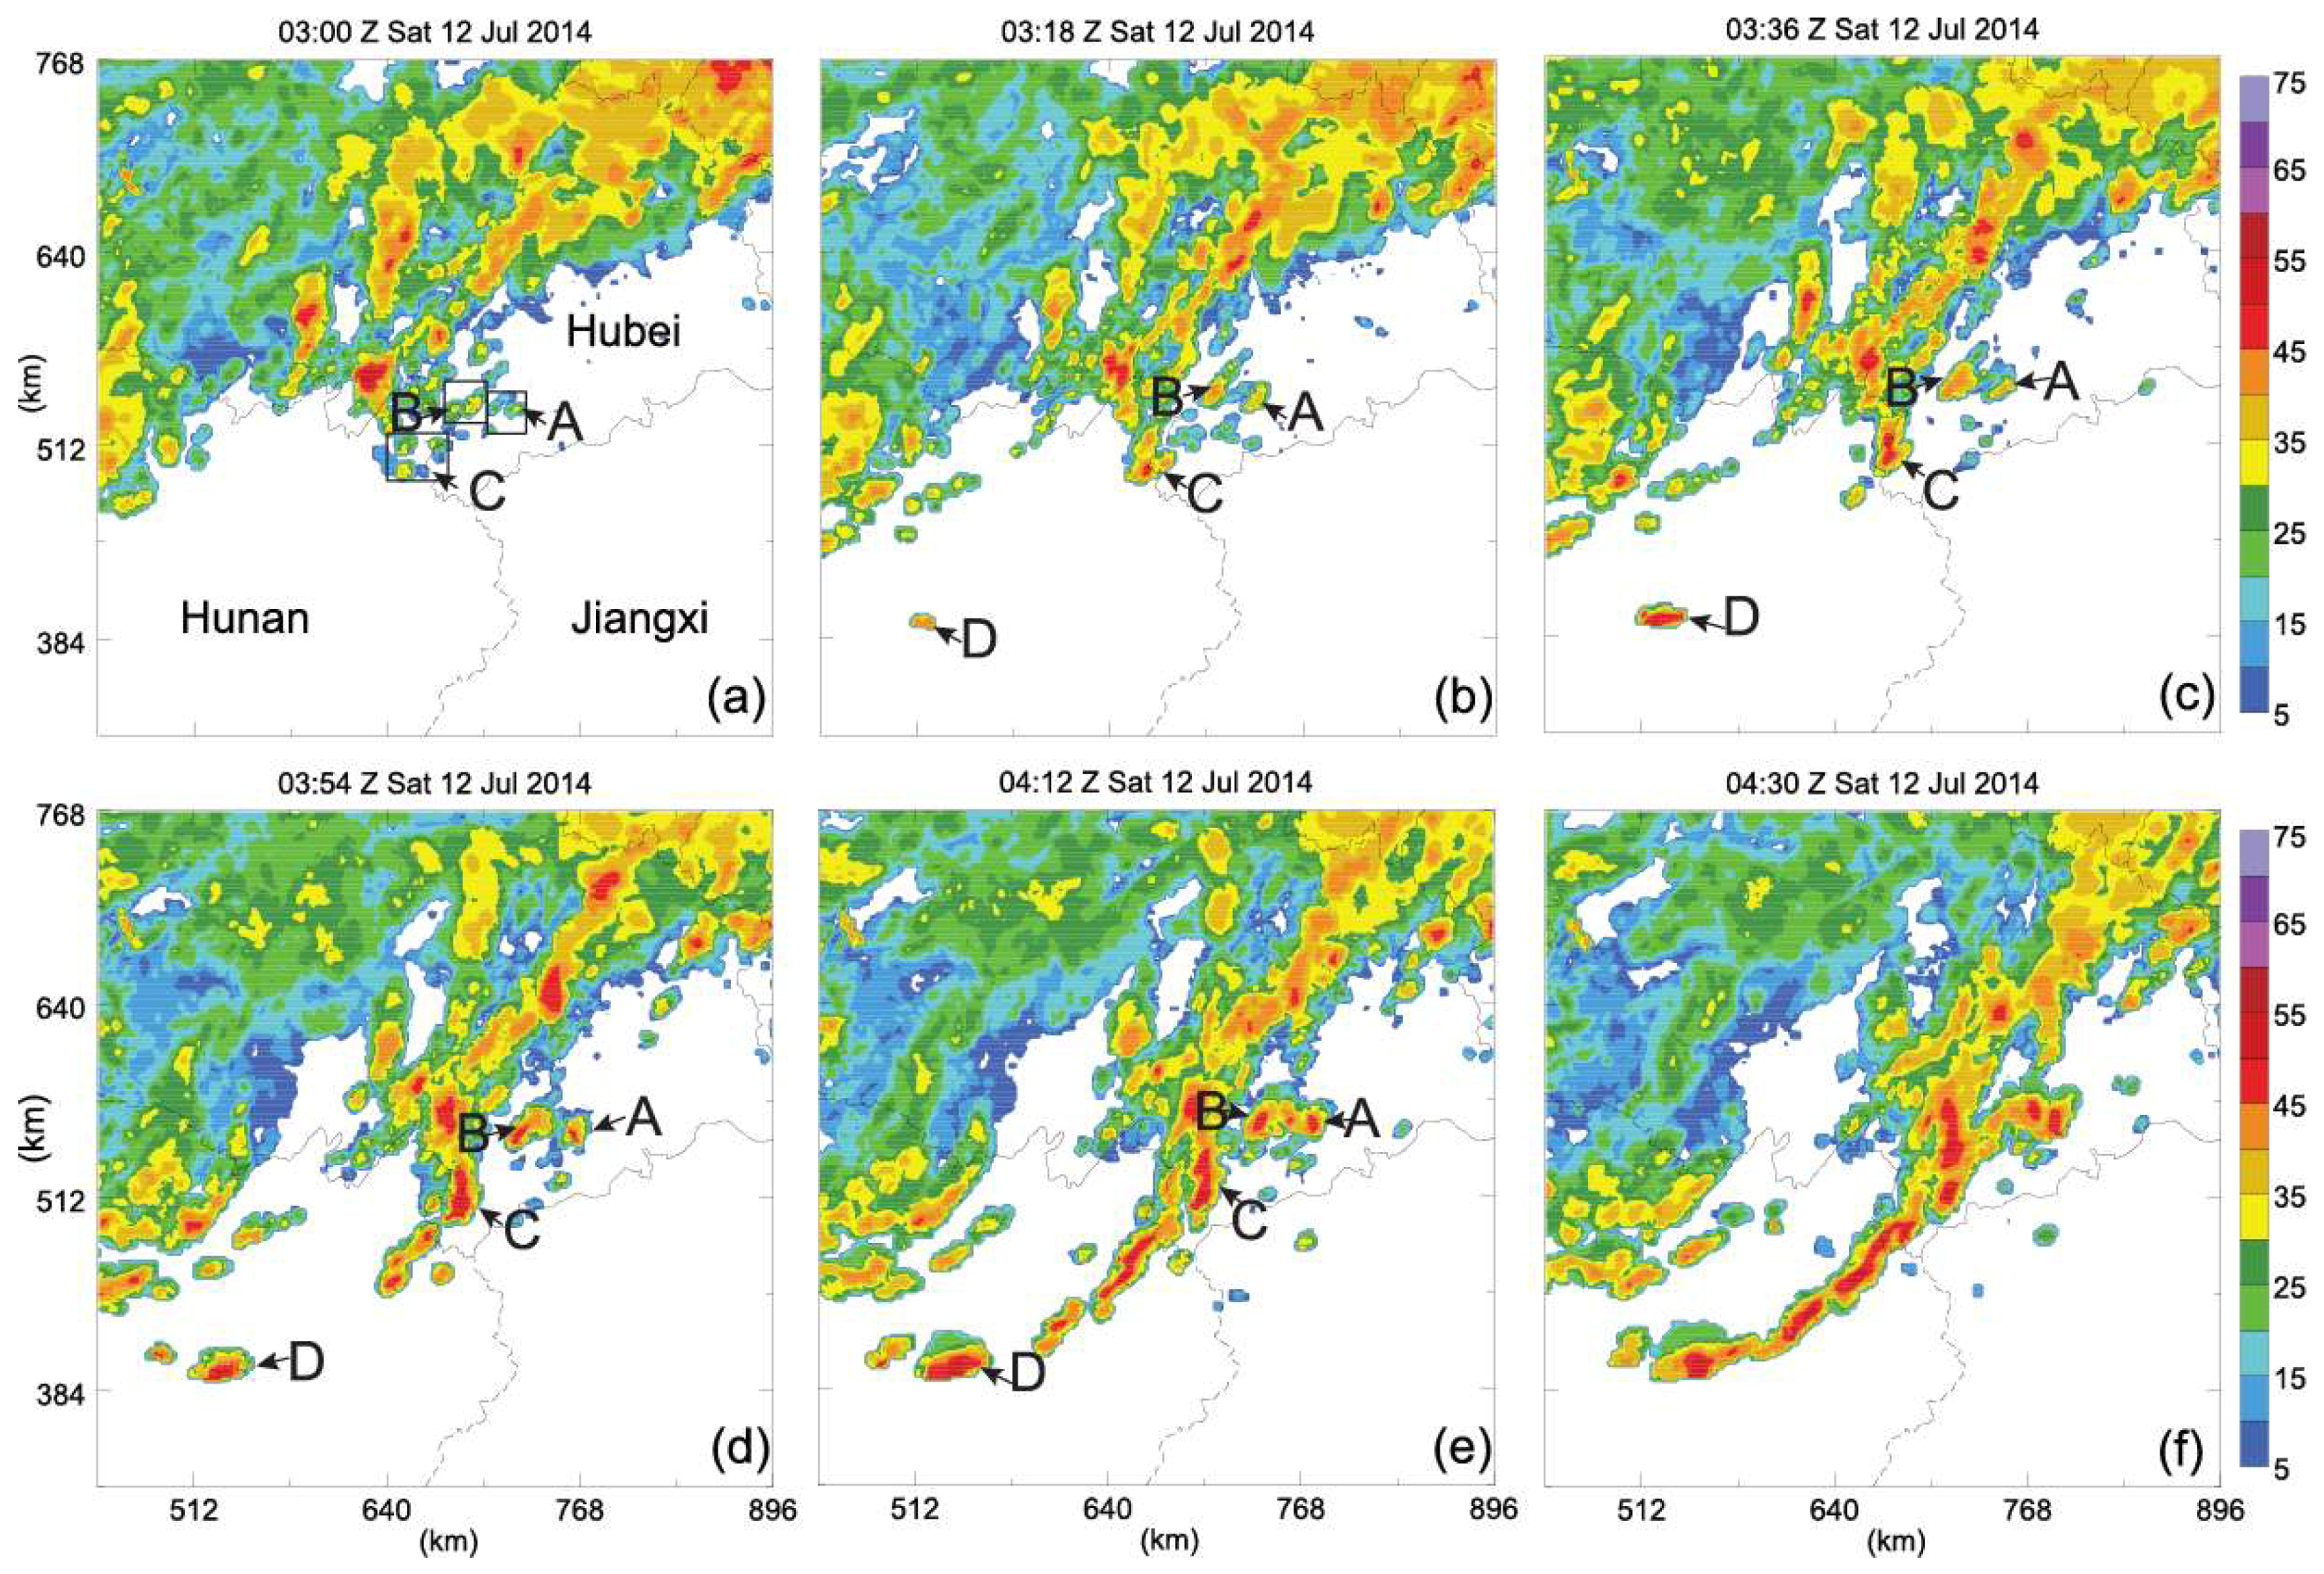
Figure 3a–f shows the radar observations from 0300 to 0430 UTC 12 July 2014 at 18-min intervals, including the CI times and the organization periods of most storms. The observed version is derived from the operational Doppler weather radars at 6-min intervals. At about 0300 UTC, the strong radar reflectivity area covering the southern part of Hubei was associated with the earlier Meiyu frontal precipitation (Figure 3a), while weak radar echoes (marked as three small boxes) were also found near the junction of the three provinces Hubei, Hunan, and Jiangxi. According to their later evolutions, these echoes can be represented by three convective cells A, B, and C (the initiation of individual cells can be simplified as CI-A, CI-B, and CI-C). These three cells became much more identifiable about 18 min later (Figure 2b), and cell C gradually grew into the dominant one with larger size and stronger echo core. Meanwhile, cell D was initiated (denoted as CI-D) to the southwest of cell C at about 180 km away, indicating that these cells might create a convective line elongated from northeast to southwest.
As expected, when the initial four cells gradually moved toward the northeast growing in size, new convective cells consecutively formed along the convective line between cells C and D (Figure 3c). These cells began to connect and exhibited an organizational mode with a parallel stratiform cloud region (Figure 3). At about 0430 UTC, the convective line was tilted much more to the east and integrated with cells A and B, and the structure of a squall line was gradually clear (Figure 3f). This squall line propagated to the northeast and finally merged with its north earlier MCSs. Apparently, the initial four storms (A, B, C, and D) are involved in this squall line formation. Therefore, our goal is to make clear what processes contribute to triggering these four convective cells.
4. Forecasts of Convective Storms
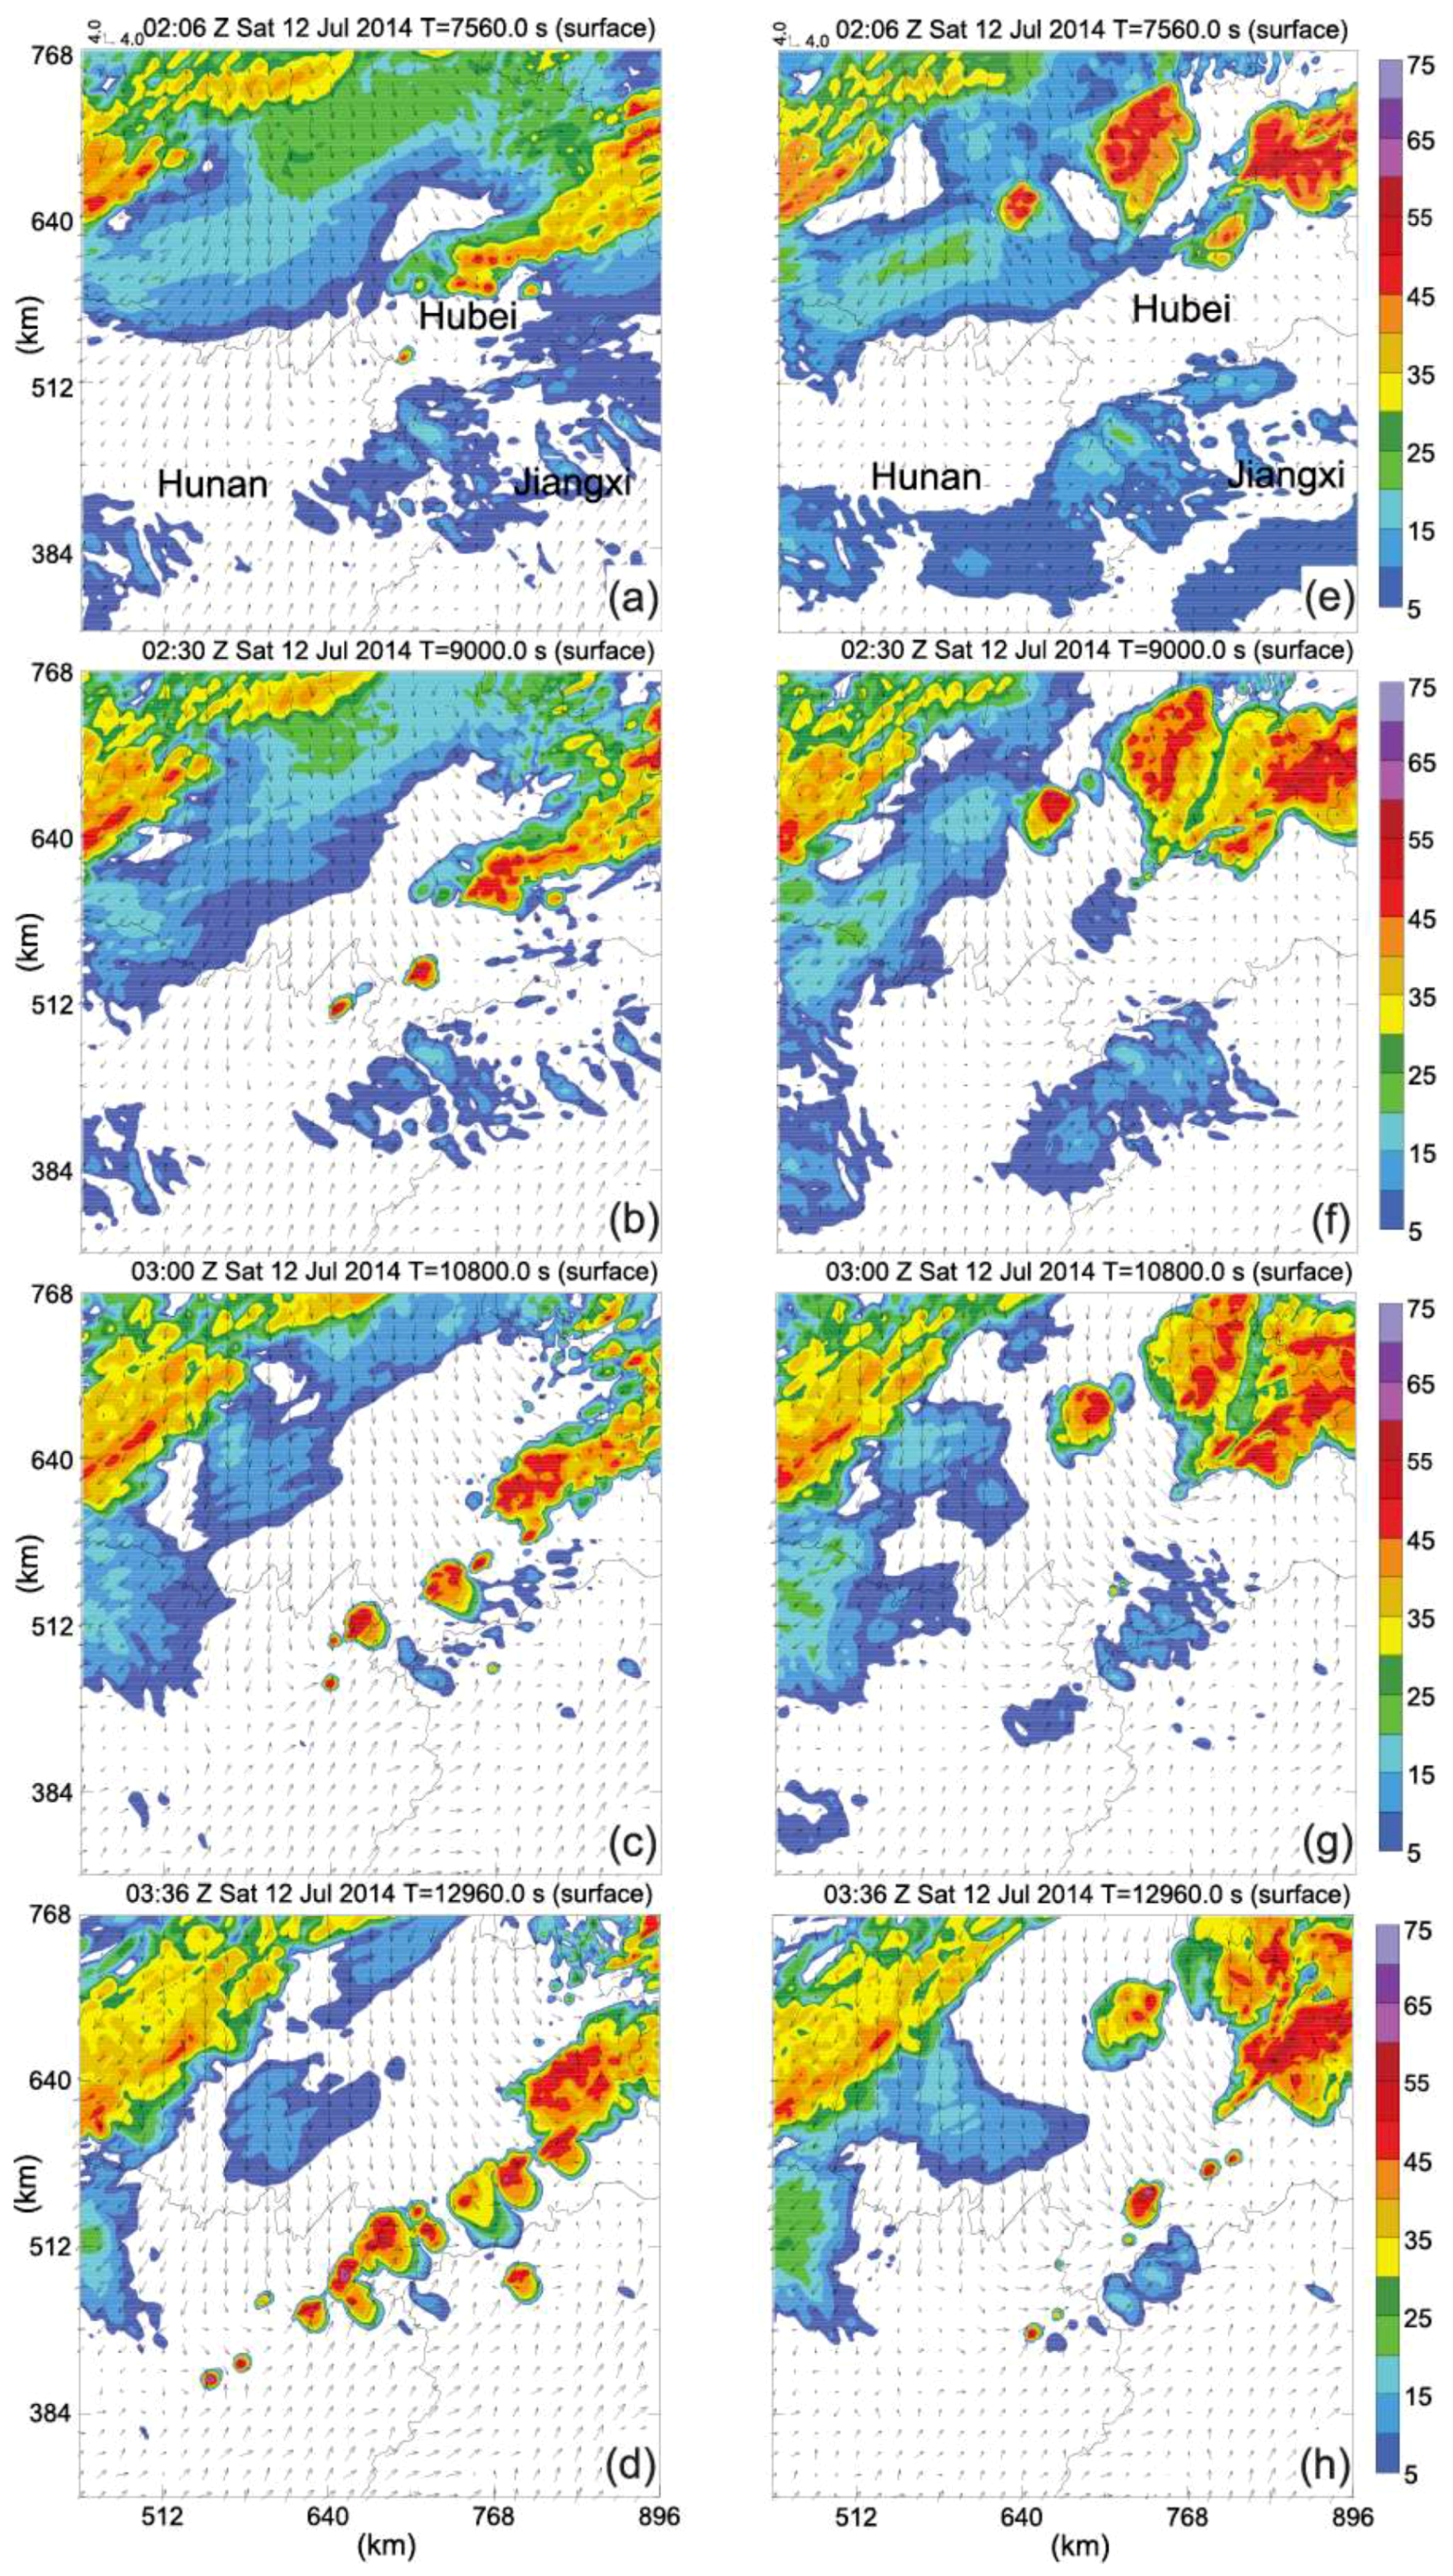
The composite reflectivity and surface wind vectors in no-DA (Figure 4a–d) and in CTRL (Figure 4e–h) are compared at 0206, 0230, 0300, and 0336 UTC 12 July 2014. With respect to no-DA, a radar echo with a core larger than 35 dBz is already found by 0206 UTC (Figure 4a) near the Hubei, Hunan, and Jiangxi provinces junction, but actually no convective cells are observed for that time. The subsequent radar fields in no-DA can be summarized as convective storms, with much intensity occurring much earlier than observed cells regardless of location deviations. For example, compared with the observation in Figure 3a, at 0300 UTC, the intensity of storm cells in no-DA has exceeded 55 dBz, also exhibiting larger size, and their convective line is already recognizable at this time (Figure 4c). These cells move very fast toward the northeast and can be identified as a well-organized MCS by 0336 (Figure 4d). However, the organizational model in observations appears half an hour later. Without regard to the location deviations, the first convective cell in CTRL occurs concurrently with the initial observed cells (Figures 3a and 4g). Furthermore, at 0336 UTC, four storm cells with radar echoes larger than 45 dBz are all presented in CTRL (Figure 4h), and their behavior is very similar to that of the initial four cells in the observation (Figure 3c). The detailed comparisons between the CTRL and the observation will be presented later.
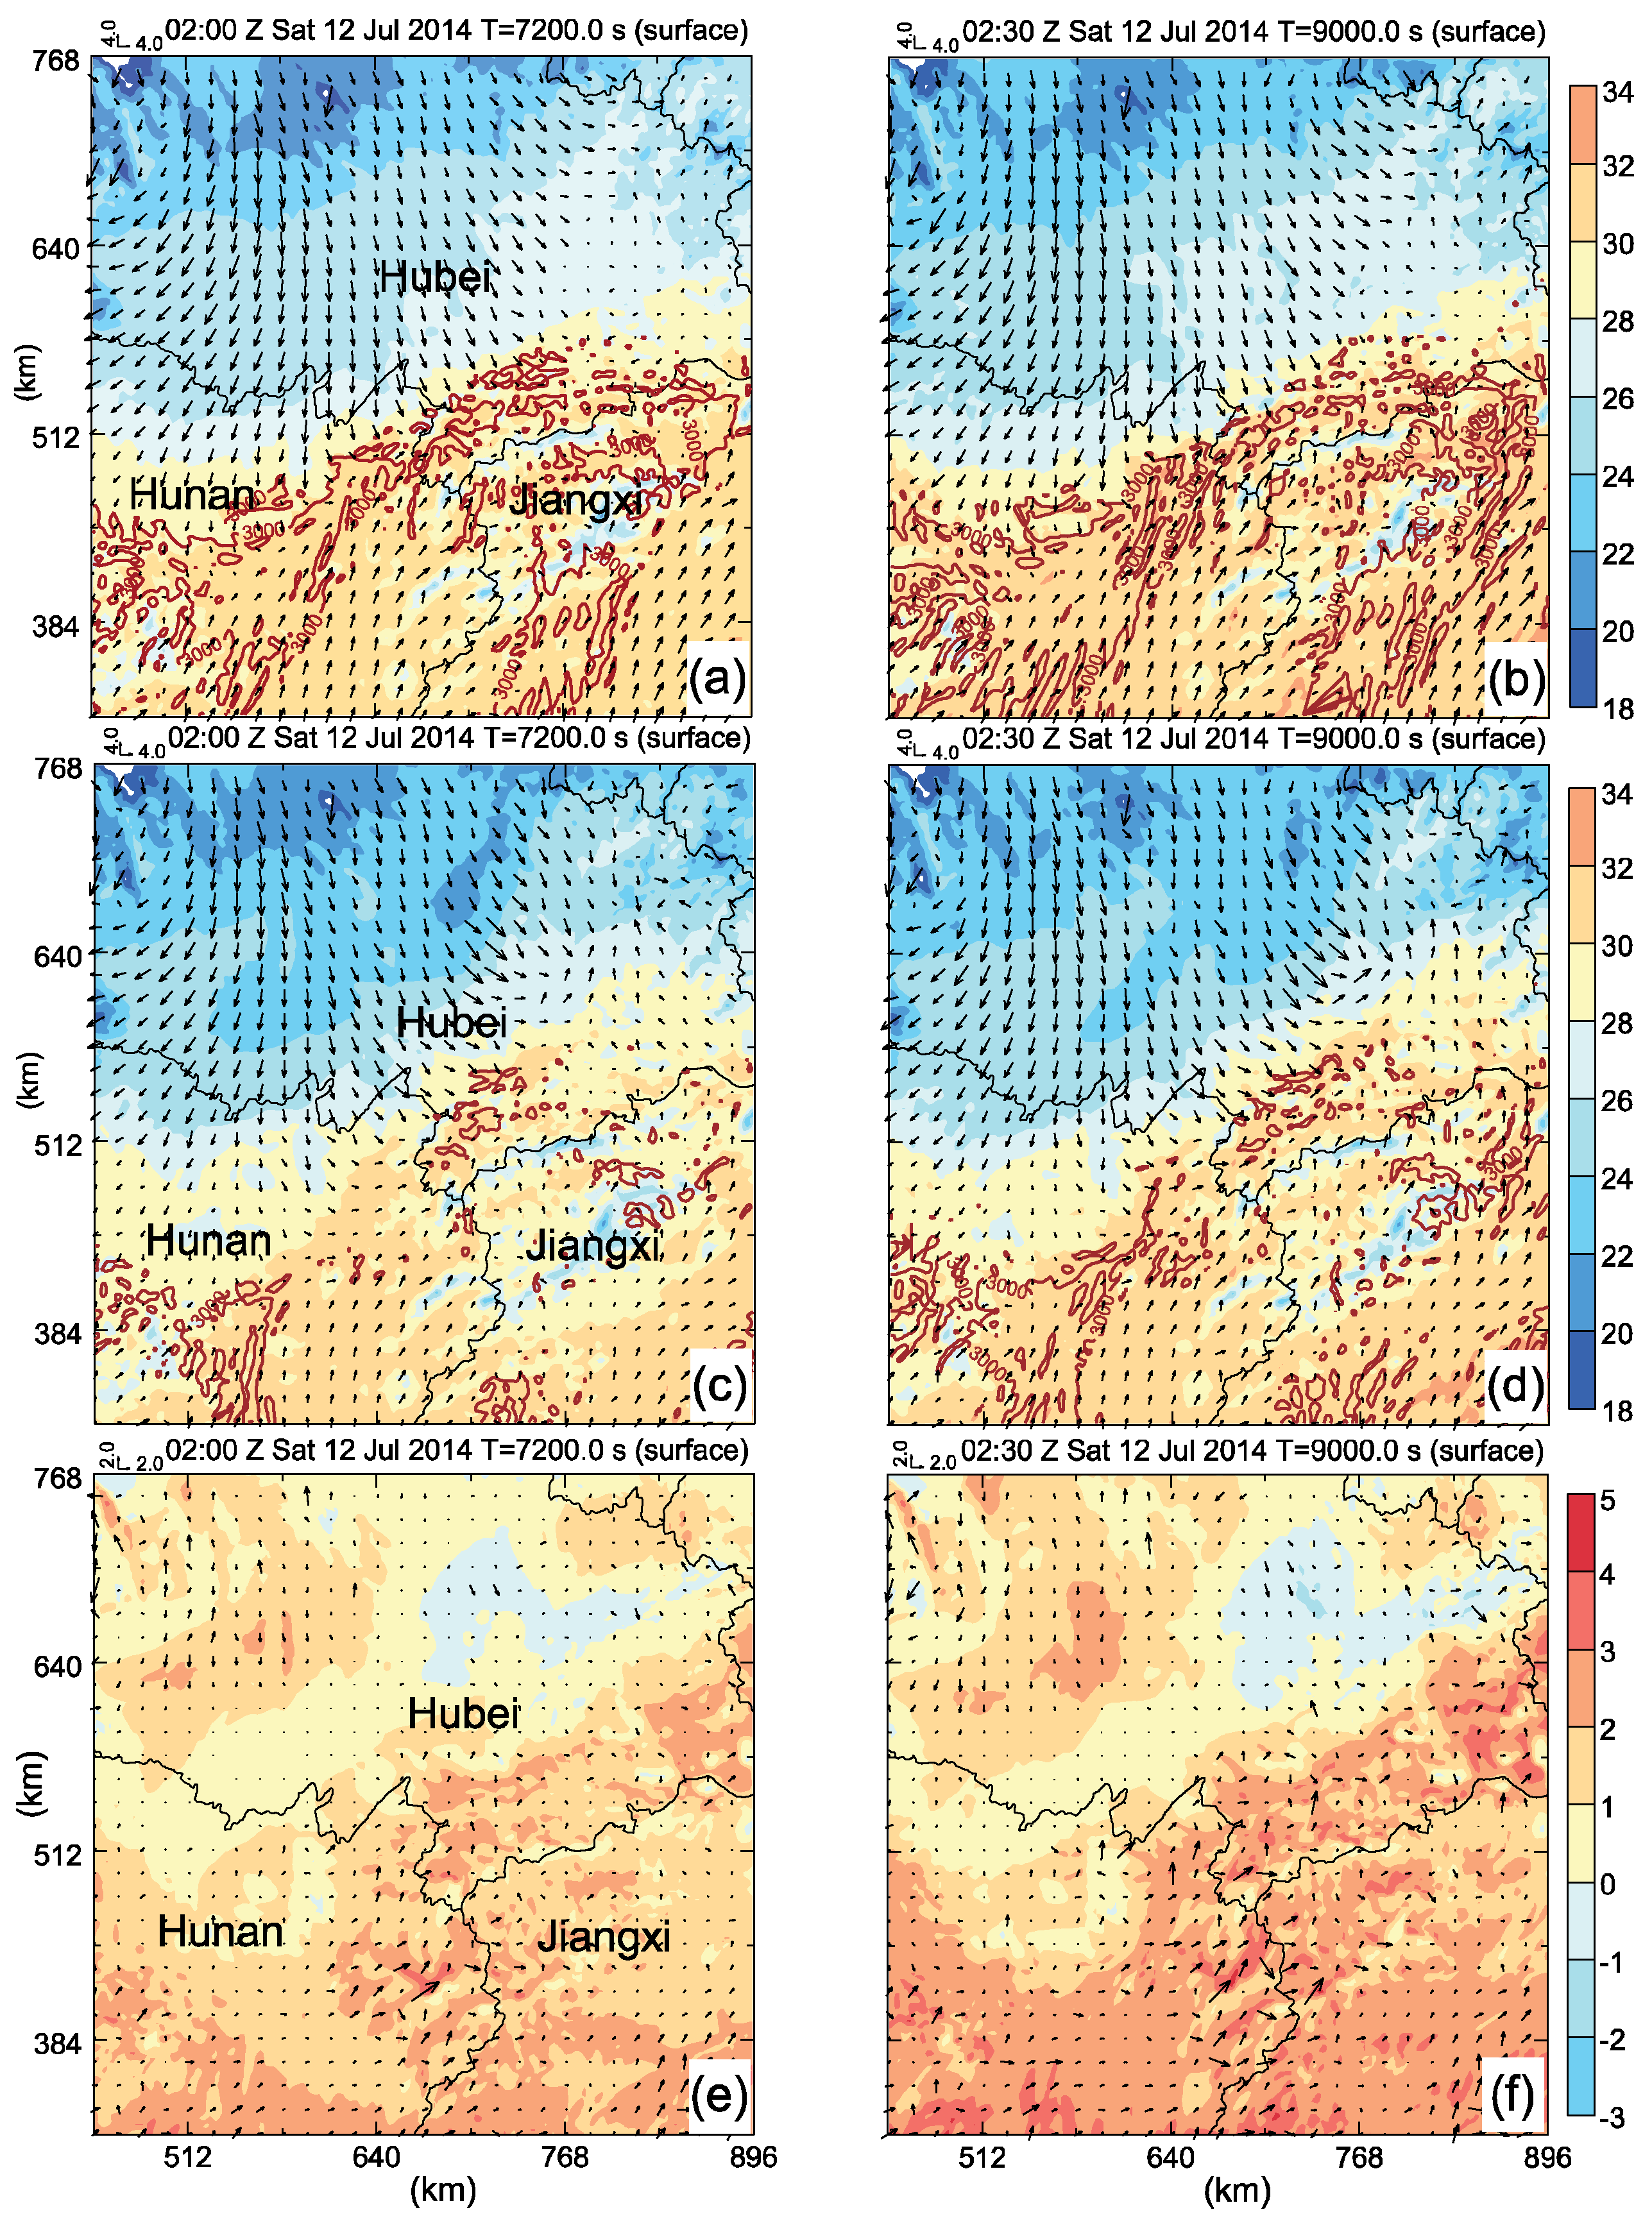
The performances of the foregoing model indicate that environmental fields in no-DA should be more conducive to deep convection. To reveal their background distinctions, the surface winds, temperature, and cape contours specific at 3000 J kg−1 predicted, respectively, in no-DA and CTRL at 0200 and 0230 UTC are plotted in Figure 5a–d. The differences in the surface potential temperature and wind fields are also illustrated in Figure 5e,f to help understand the data assimilation effect. The surface backgrounds of these two simulations have three characteristics: a northern cold dome produced by the earlier frontal precipitation, a southern warm area with gradually increased convective available potential energy (CAPE), and a wind convergence zone created by the northwesterly flow from the cold dome and the southwesterly from the monsoonal flow (Figure 5a–d). Nevertheless, the simulation in no-DA presents much stronger southwesterly momentum transport over the warm area, accompanied by more CAPE clusters spreading over the convergent zone (Figure 5e,f). Thus, the enhanced wind convergence and increased convective instability are believed to directly lead to the earlier occurrence of storm cells in no-DA. For this case, more realistic synoptic and mesoscale conditions are achieved by assimilating surface observations into the GFS global analysis background.
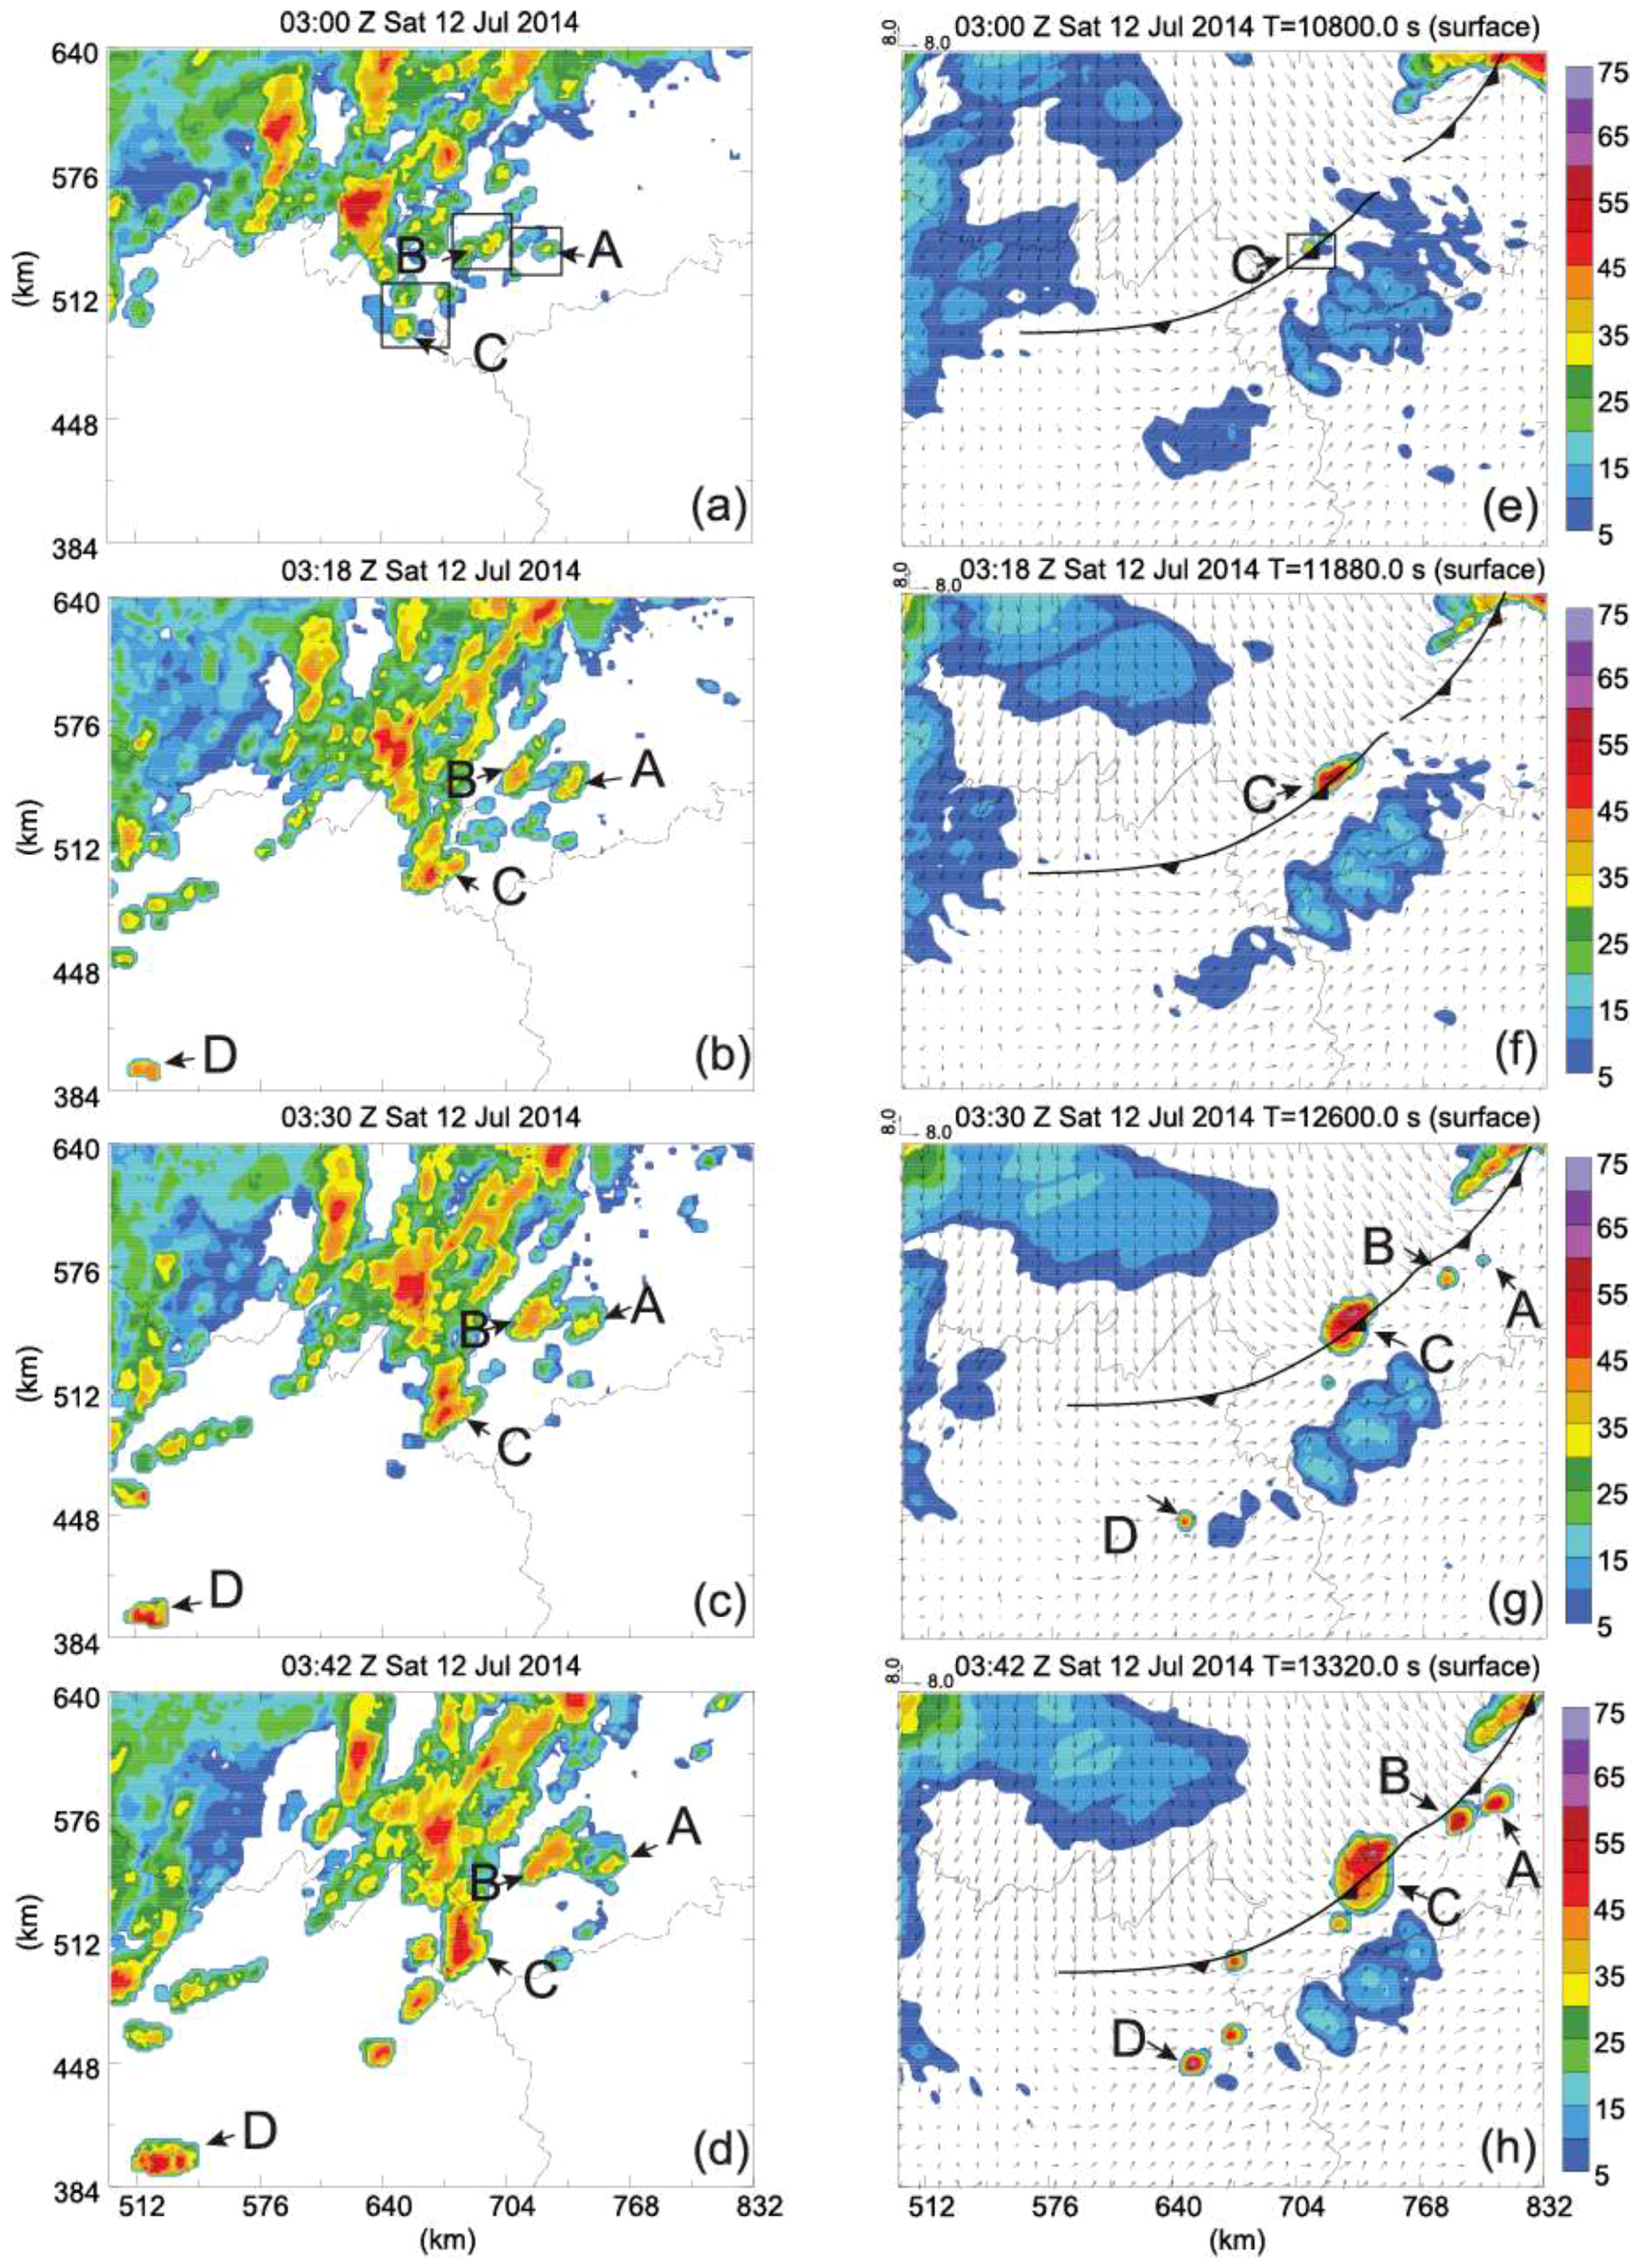
The observed composite radar reflectivity fields, the predicted composite radar reflectivity, and surface winds in CTRL in an enlarged domain are, respectively, illustrated in Figure 6a–h. In the radar observation, the initial three cells A, B, and C show up concurrently at 0300 UTC (Figure 6a) and then they slowly move toward the northeast with growing size. Cell C gradually develops into the largest and strongest cell. All three isolated cells could be clearly recognized at 0318 UTC, along with the features of another new cell D, which is initiated a few km away to their southwest (Figure 6b). In CTRL, at the CI time, some weaker cells are predicted close to the observed cells, and these weaker cells merge into one large radar echo quite soon (Figure 6e). This large storm cell could be analogous to the observed cell C in terms of its later behavior. Compared to the observation, the location discrepancy of the predicted cell C is approximately 80 km with a deviation to the northeast, but its CI timing has a surprising coincidence. Other predicted cells do not show up until 30 min later; at 0330 UTC, cells A, B, and D appear at the same time (Figure 6g), respectively, located to the northeast and southeast of cell C, just like the observed ones. However, all initiation locations stray to the northeast with biases of 70 km for cell A, 75 km for cell B, and 120 km for cell D. Afterwards, other principal cells progressively form along the connective line between cells C and D (Figure 6h). Although the initiations of cell A (B) and cell D are delayed, respectively, by about 30 min and 12 min, and also accompanied with the location inconformity, their general development processes, including the growth in size and intensity and their later movement, agree fairly well with the observations. It is also noteworthy that only cell C lies at the main gust front (defined as the leading edge of cold northwesterly flow), and the other three cells are situated to the southeast of this gust front.
In terms of CI prediction, Kain et al. [41] stated that predicting the exact initiation of individual convective cells is much tougher than that of MCSs. As the matter of fact, it is really difficult to determine the specific reasons for the CI timing and location errors for a certain case. The model resolution, initial condition, and initial forecast time can lead to such errors, but the propagation of the cold outflow associated with the earlier rainfall systems is believed to be the direct cause for this case. Moreover, such forecast errors can also be found in Wang and Xue [19] and Wang et al. [42]. As the aim of this study is to examine the mesoscale structures and associated physical processes responsible for the CIs, further analyses based on the simulated results in CTRL have relatively higher reliability.
5. Boundary Layer Evolution and CIs in CTRL
5.1. The Forecast of HCRs, Gust Fronts, and Their Evolutions
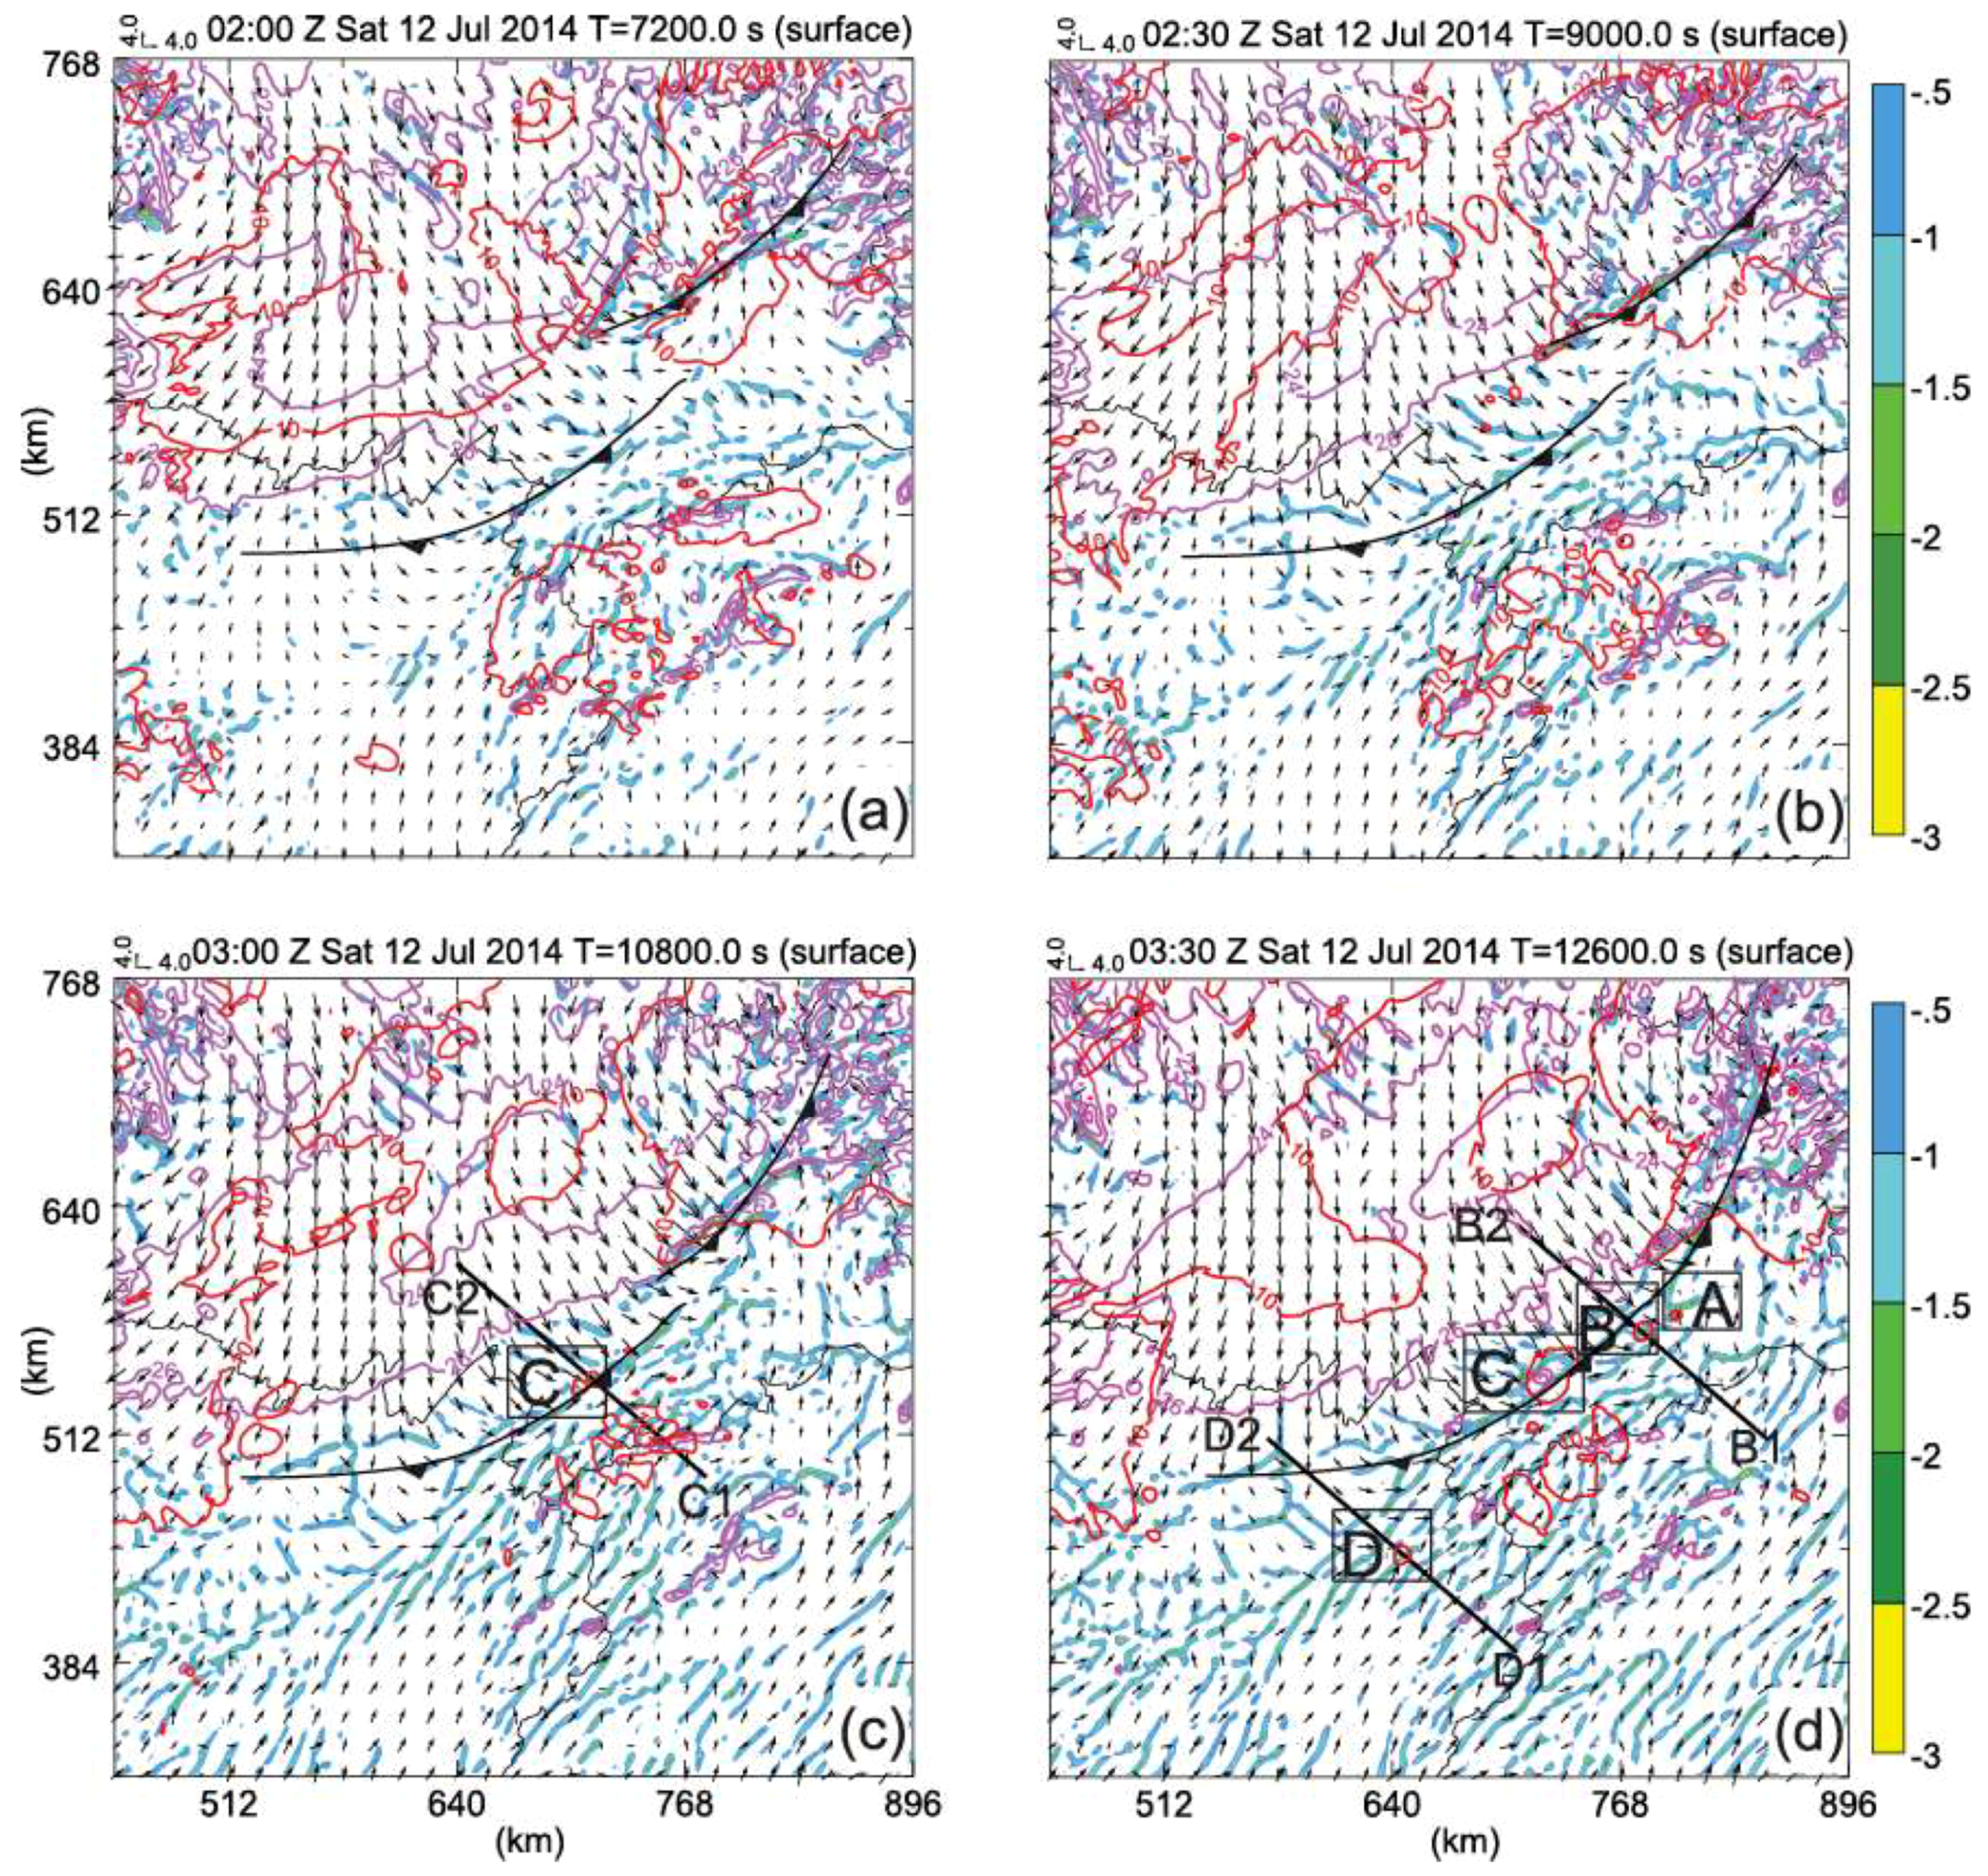
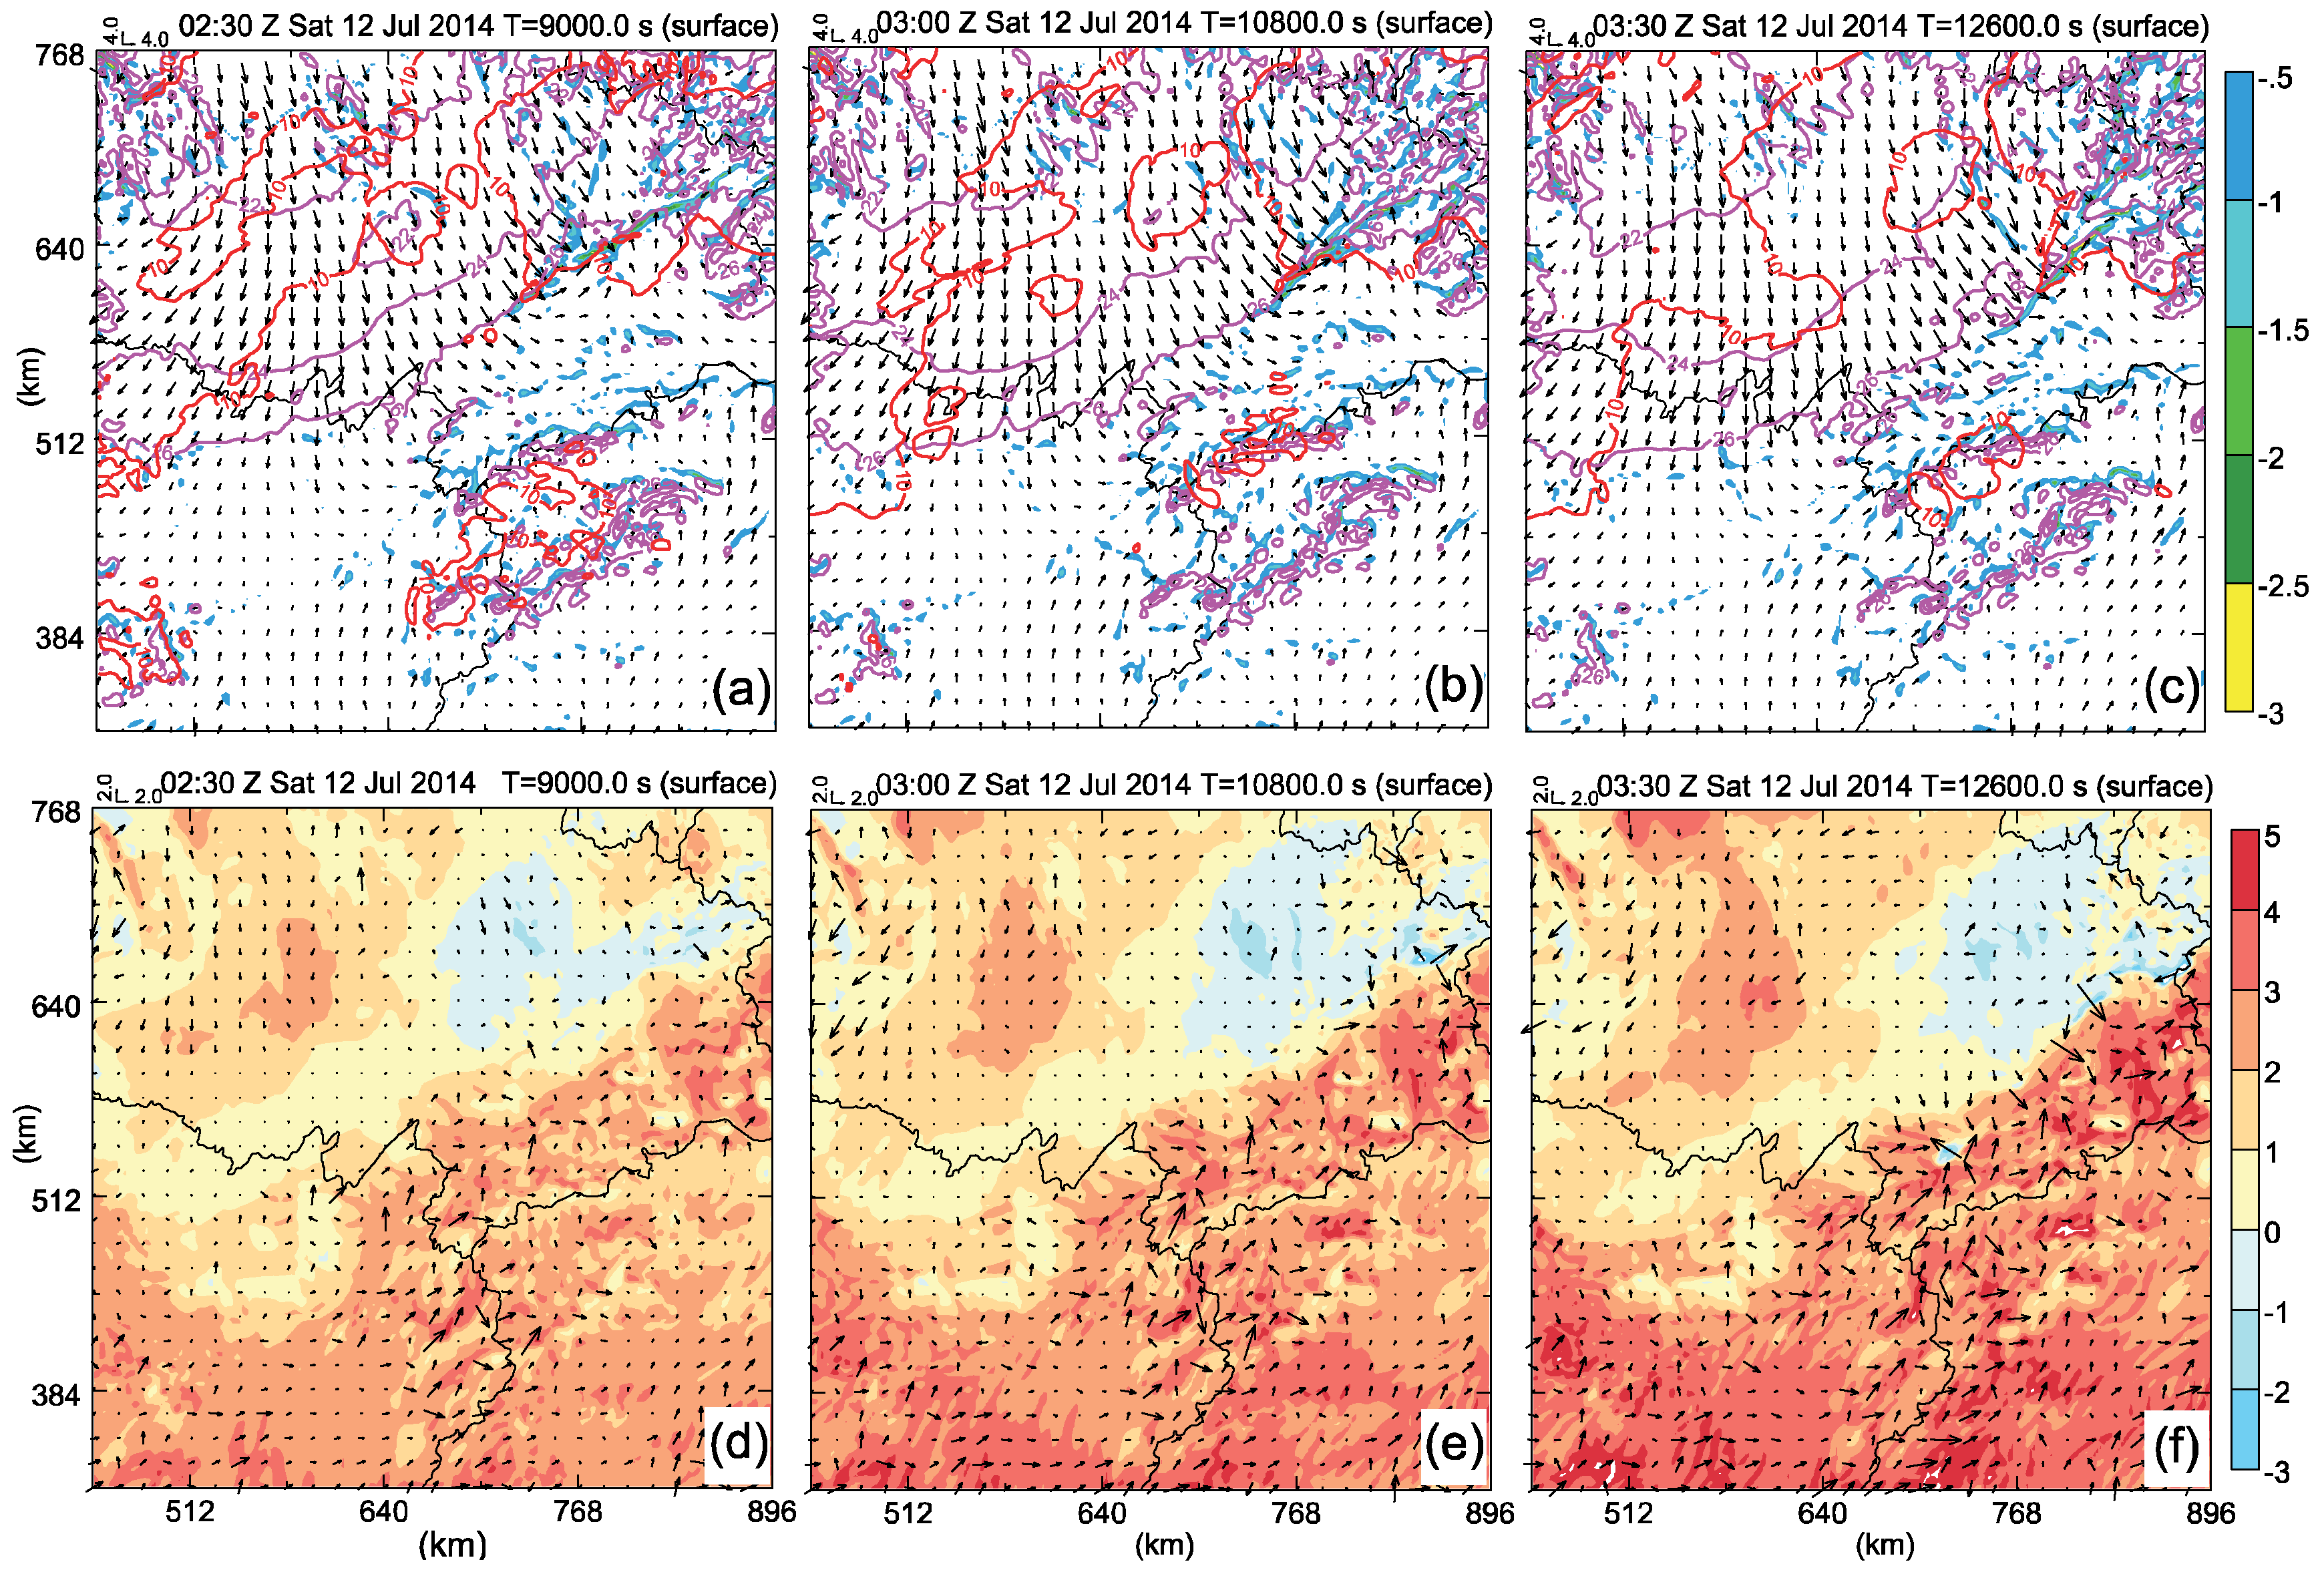
The most common convective activities within the BL caused by the surface heating include the BL HCRs and open convective cells (OCCs) that created the shaded convergence zones for the hours preceding CIs in Figure 7. The predicted surface winds, temperature, and composite radar reflectivity 10 dBz contours are plotted in Figure 7 at 0200, 0230, 0300 (CI-C), and 0330 (CI-A, CI-B and CI-D) to further describe the BL structures and the evolution of the cold dome and associated gust fronts (marked as standard symbols). A few hours ahead of CI-C, the existing frontal precipitation has already spanned across Hubei Province and consequently produce a large cold dome (roughly represented by the area with the surface temperature lower than 26 °C) (Figure 7). There are two obvious gust fronts that could be used to show the propagation speed of this cold dome. The main gust front extends from the south of Hubei to the north of Hunan, which also corresponds to the frontal convergence zone in which cell C is triggered (Figure 7c), and the secondary gust front is located to the northeast of cell C. In fact, the genesis of weak BL convective eddies is soon found over some clear air regions after the model starts. However, because of the rather weak transport of the southwesterly momentum, the surface convergence zones associated with the main gust front or HCRs are still invisible (Figure 7a) at 0200 UTC.
Over the next 30 min, they gradually become identifiable (Figure 7b). Some clear thin-line convergence areas associated with the BL HCRs are distributed to the northwest and southeast of the main gust front. The presence of convective rolls and eddies is believed to indicate the deepening vertical mixing and enhanced convective instability within the BL. The gust front convergence zone is also intensified by the combined effect of the further propagation of the cold dome and the strengthened southwesterly flow. Since the gust front zone dominated the maximum surface convergence, cell C is first triggered close to its northeastern end at 0300 UTC (Figure 7c). Consistent with the theory of HCRs, most of the HCR bands with relatively strong convergence appear over the southern warm area where less vertical wind shear, cloud-shading, and small terrain discontinuities exist. These southern HCRs are almost aligned with the northern part of the main gust front due to the southwest-northeast low-level wind shear. This behavior appears to extend the main surface convergence band more to the southwest and so helps to form the elongated convective line. As the southern HCRs continue to grow and produce more upward forcing, cell D appears along one of the developing HCR convergence bands with the strongest vertical lifting at 0330 UTC (Figure 7d). Right at this time, two gust fronts happen to merge, and cells A and B occur simultaneously along the same convergence band located a bit ahead of the merged gust front (Figure 7d). Hence, the initiations of storms A and B are believed to be caused by the same process.
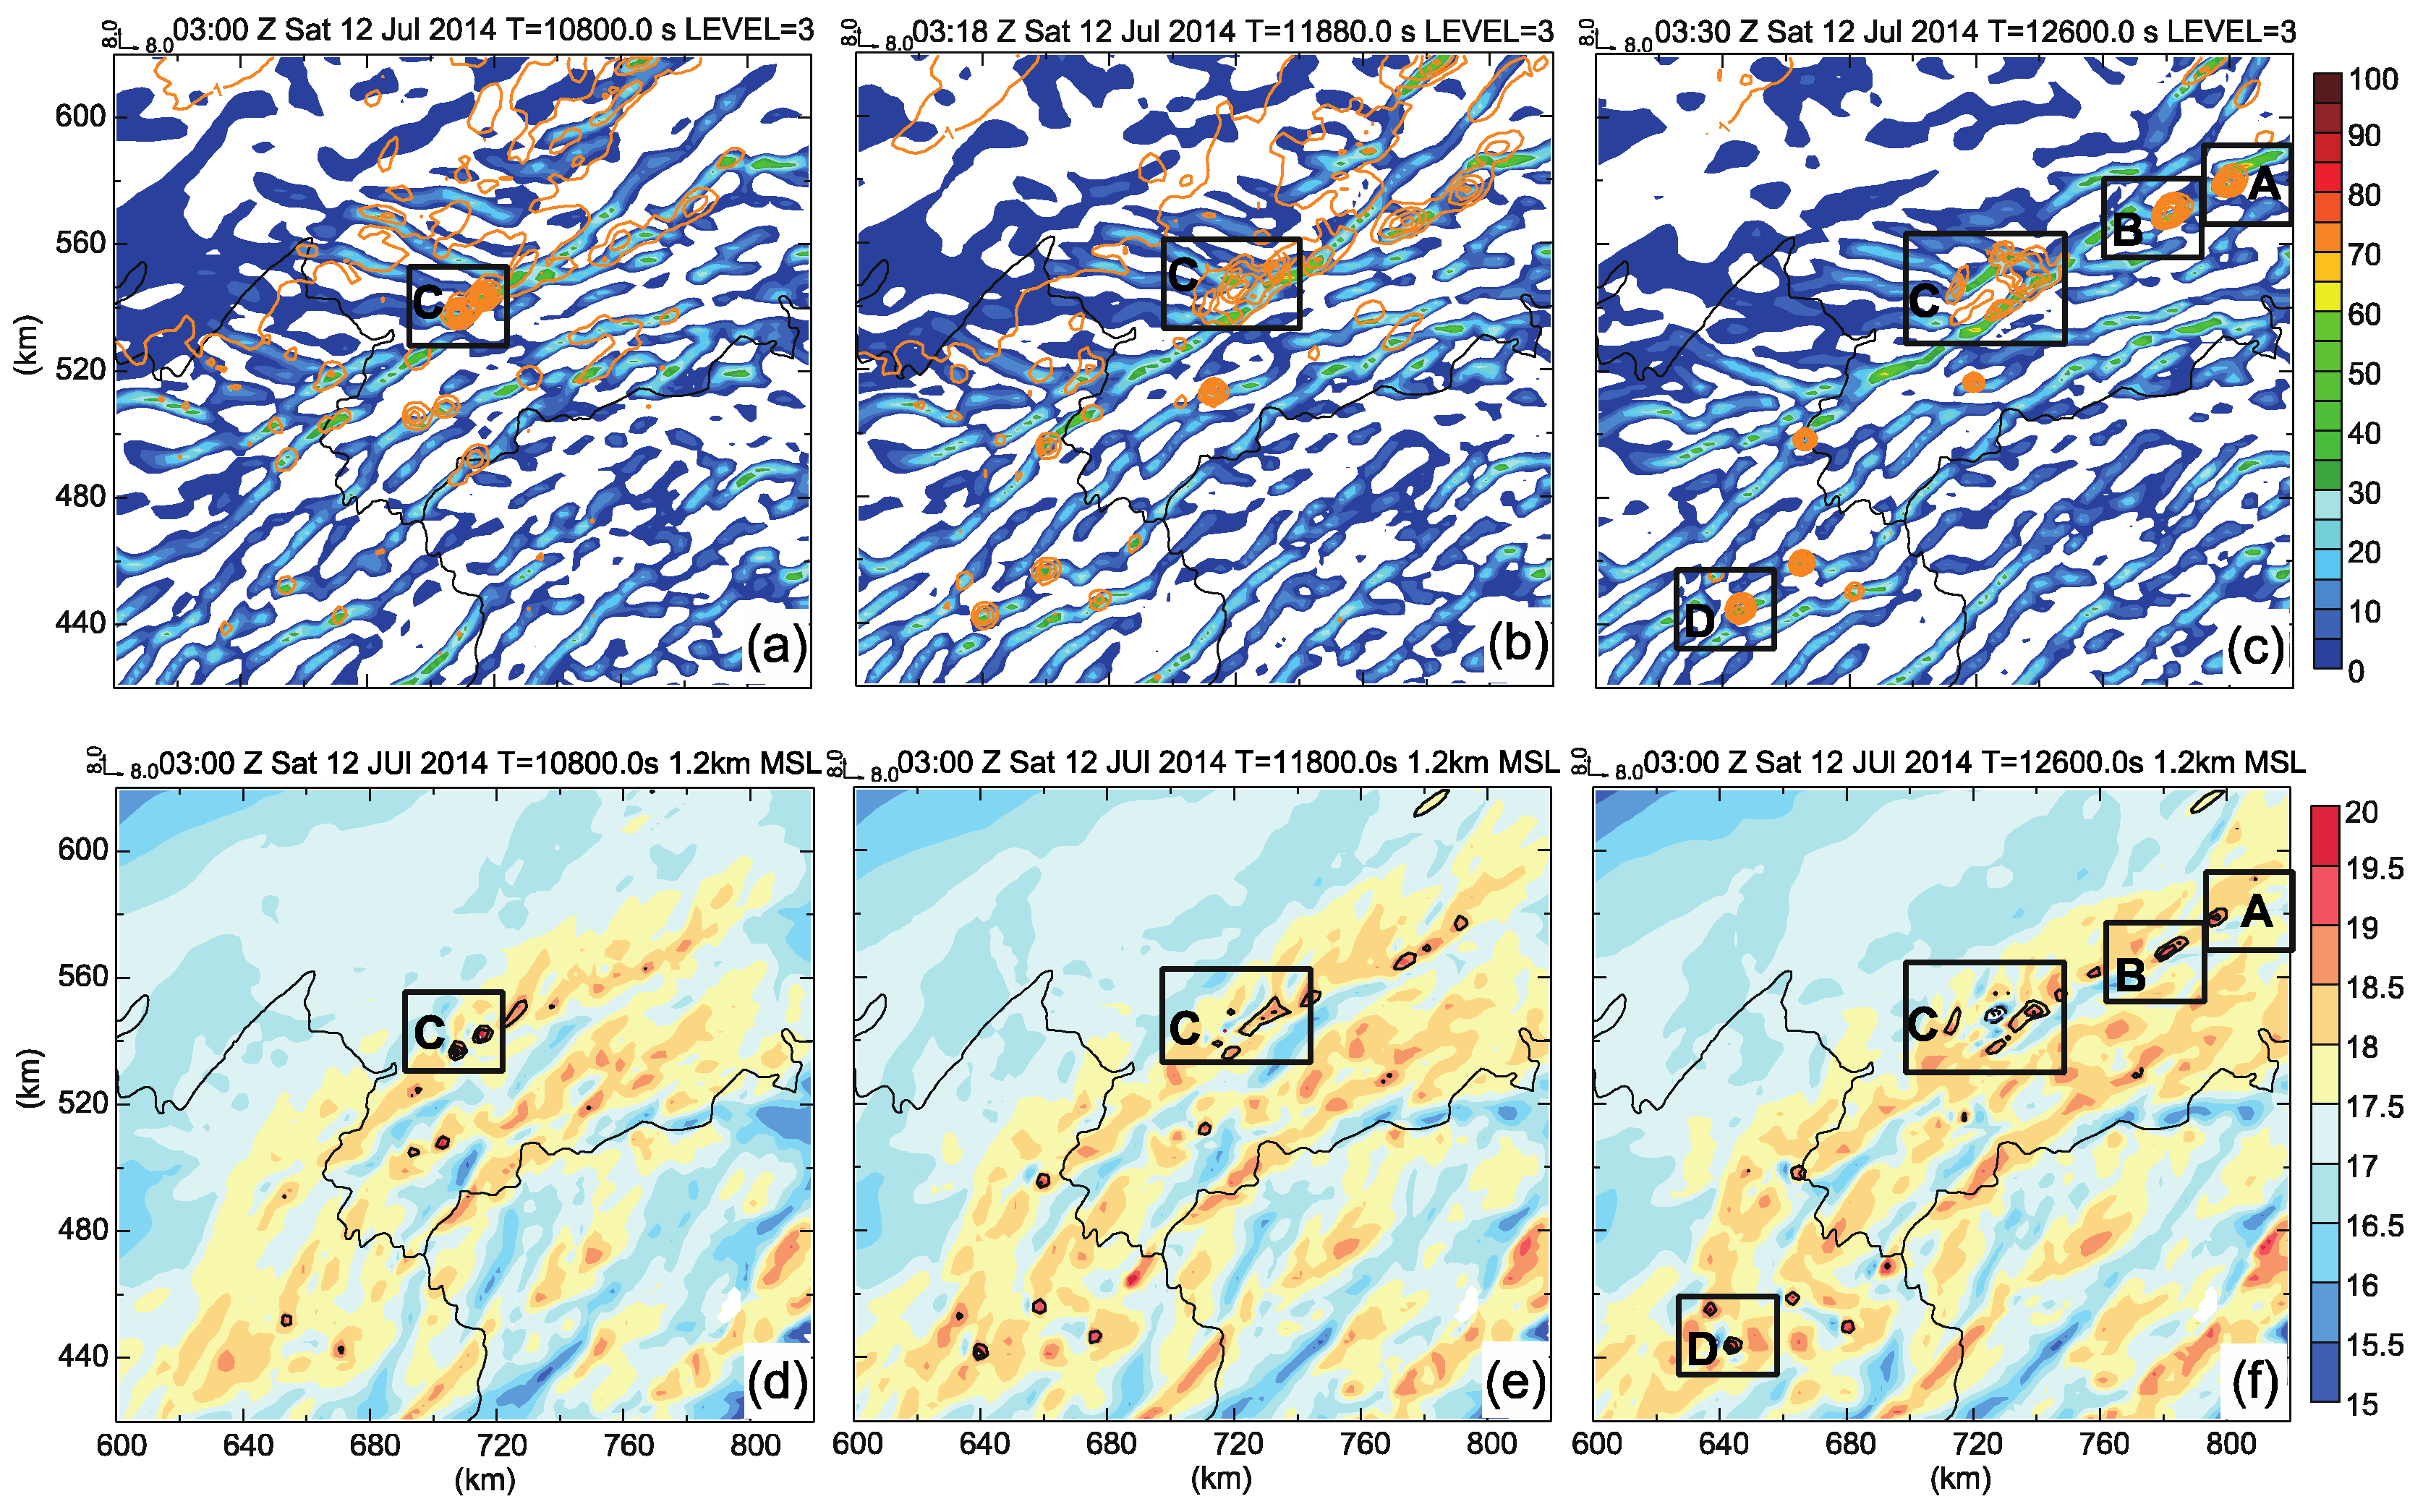
While moisture convergence is useful for revealing low-level convergence forcing, Banacos and Schultz [43] pointed out that the horizontal mass convergence (, is the specific humidity, and represents the horizontal wind vector in pressure coordinates) in moisture flux convergence is more appropriate to show the relationship between upward forcing and CI, because the advection term () can purely come from the gradient of specific humidity. To be more accurate, the velocity convergence part of moisture convergence () is calculated and used in this study to show the effect of moisture convergence on CI. Also shown in Figure 8a–c are the wind fields, the maximum cloud mixing ratio (denoted as qc) in a vertical column, and the radar reflectivity at the same level. Although qc here shows the formation of clouds that may not develop into convective cells, it is a good indication of the initial development of convection.
At 0300, storm C is directly located over the strong moisture convergence band associated with the main gust front (Figure 8a). Cloud segments are evident over some southwestern HCRs, as the segments become stronger and grow faster than the northwestern rolls (Figure 8b). Within a few minutes, storm D ensues and then collocates with the densest qc isoline region along the corresponding HCR band (Figure 8c). This situation is similar for storms A and B, except that these storms are located quite close to the main gust front, and the corresponding HCR band seems to be poorly organized. Furthermore, in Figure 8d–f, the water mixing ratio (qv, color shading), vertical velocity (w, black contours), and radar reflectivity (red contours) fields at 1.2 km MSL are plotted for the above three times. The 1.2 km level approximates the mixed boundary layer top (Figure 9). Clearly, the qv field is distorted to many strips and has a strong correspondence with the surface convergence bands (Figure 8d), as well as a good concurrency with the main gust front convergence zone. However, not all qv bulges at this level go along with the HCR bands, because the developmental degree of the individual HCR is different, so that some upward branches of roll circulations are unable to extend over this level. After all, the low-level maximum qv bands and surface convergence bands where the storm cells form are closely related. Figure 8 also shows that the maximum vertical velocity fields are substantially over the clear qv bulges and the low-level convergence maximum each time one of the cells is initiated.
5.2. CI Processes
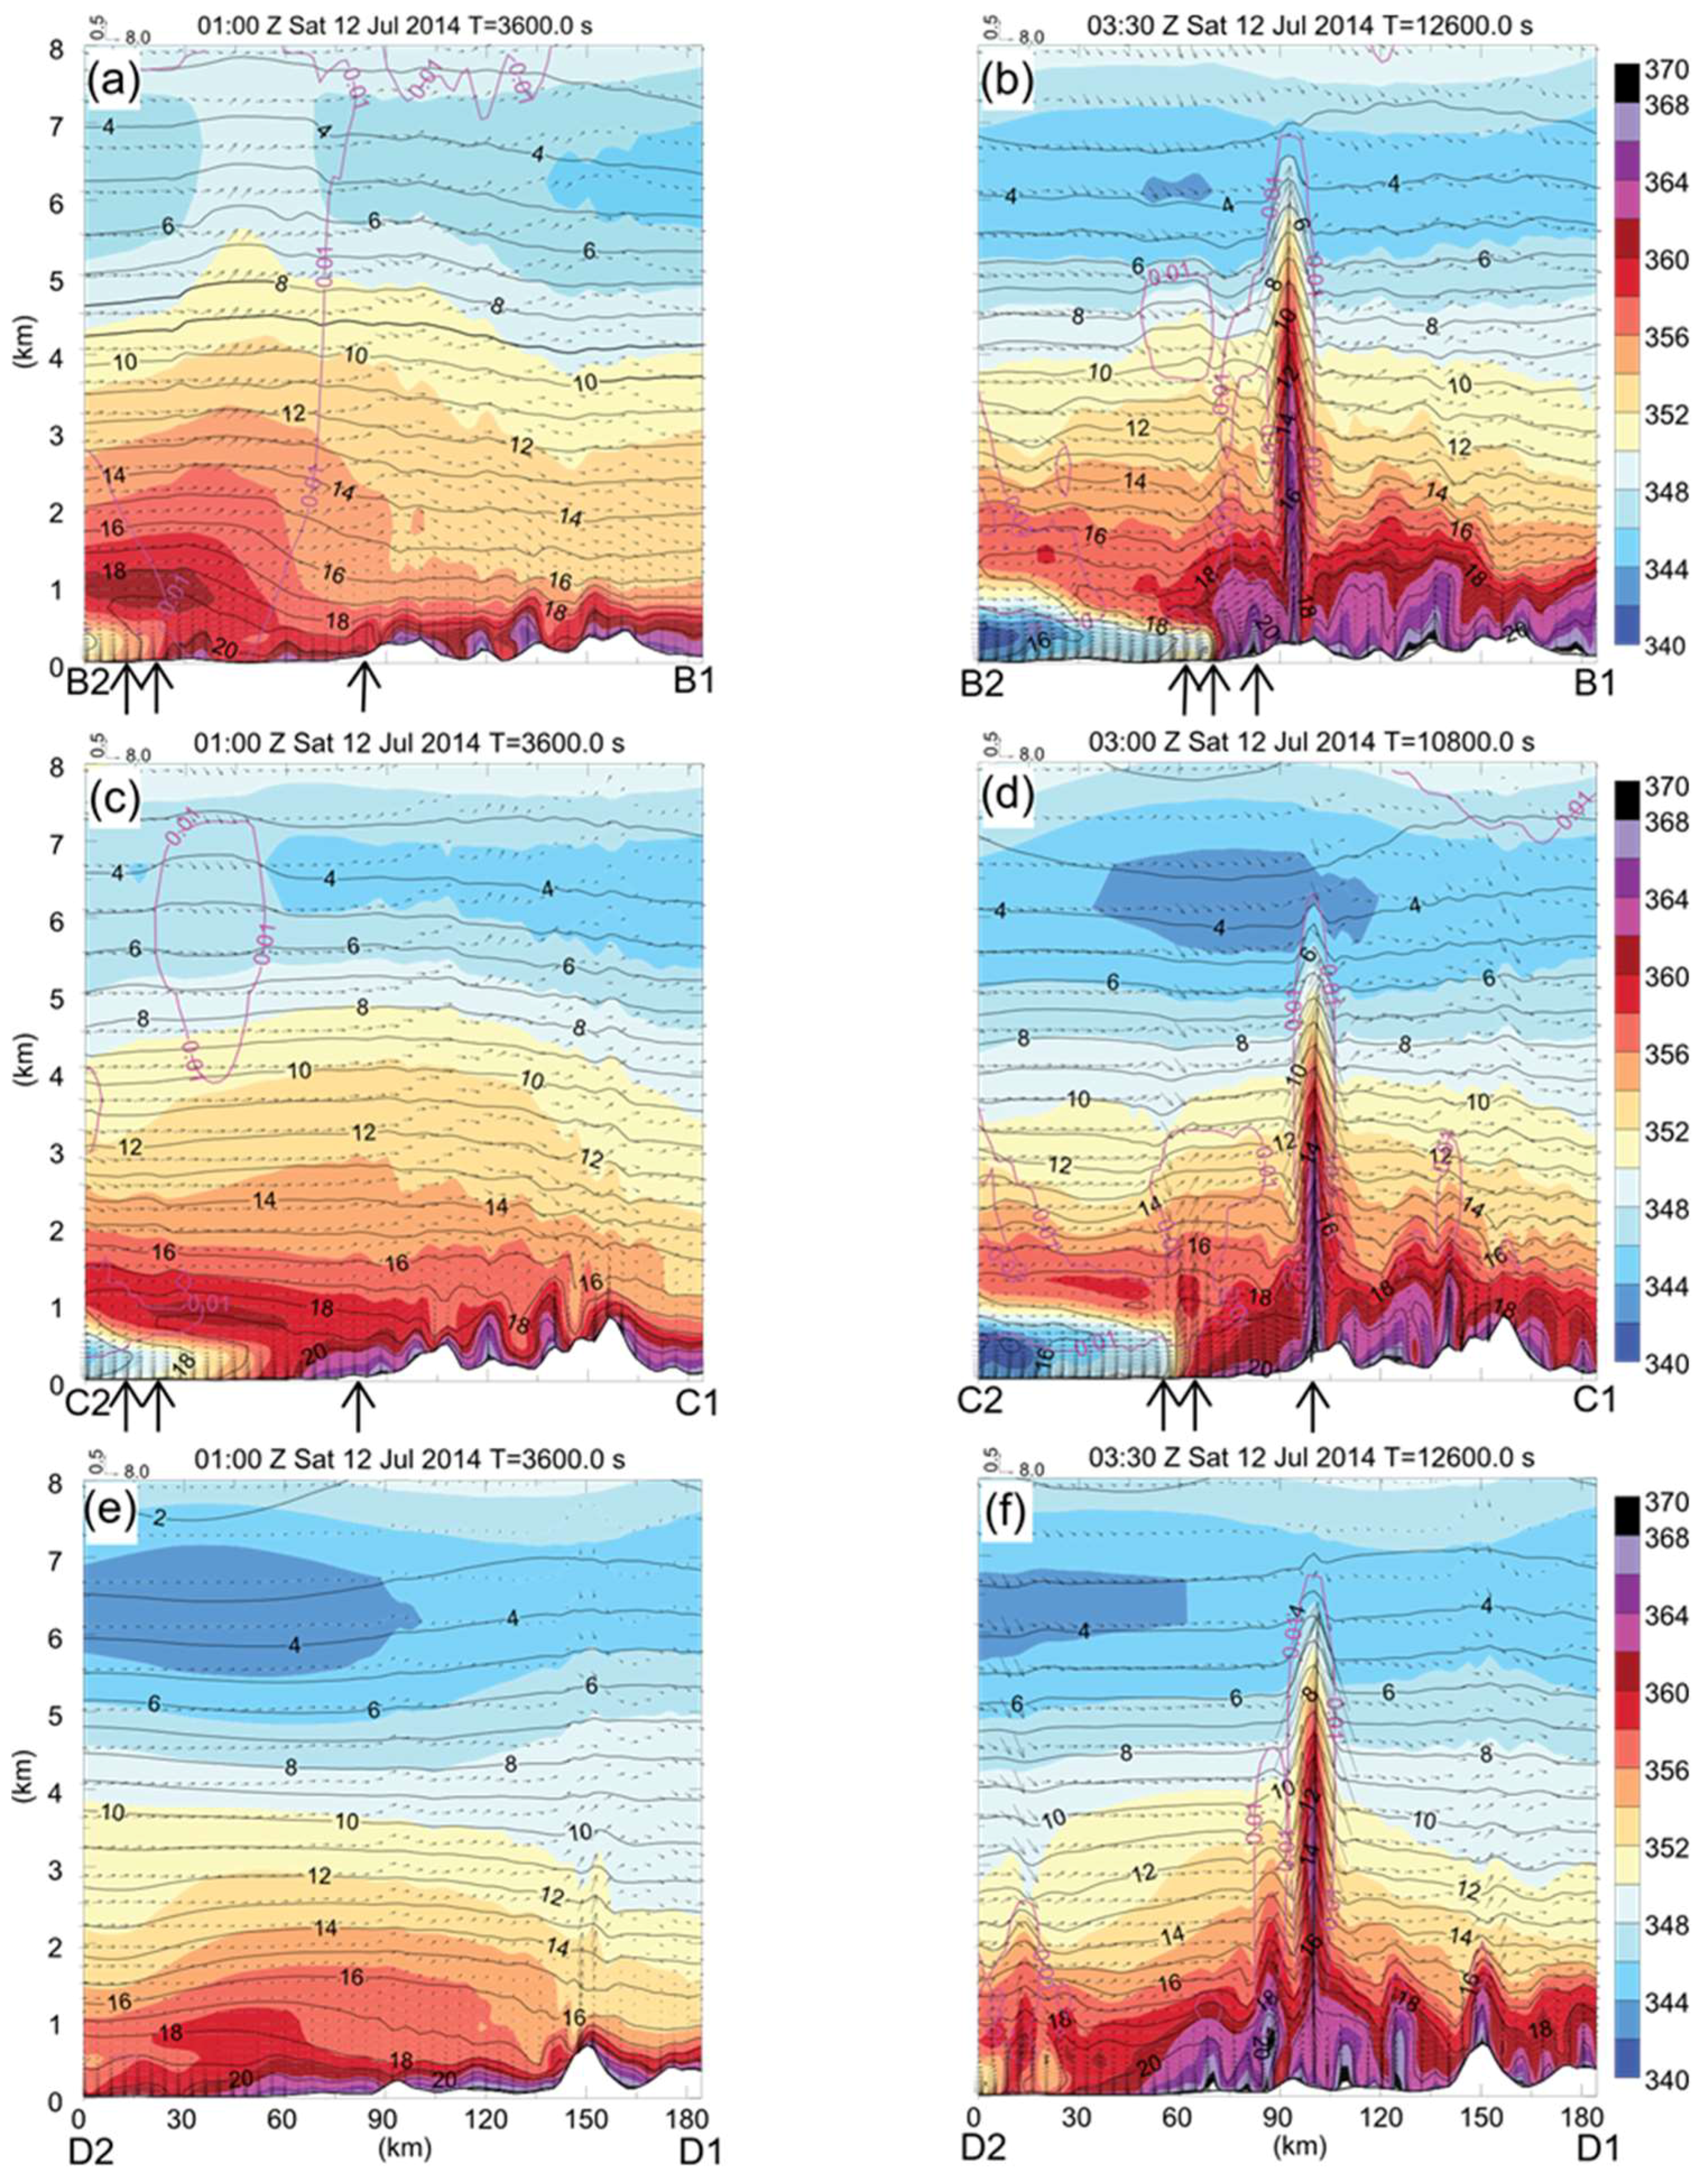
With a better understanding of gust fronts, HCRs, and associated flows, vertical cross sections through initiation locations (CI-B, CI-C, and CI-D) roughly perpendicular to the gust front and corresponding HCR bands are examined in detail. Equivalent potential temperature (), wind fields, water mixing ratio (qv), and 0.01 g kg−1 total condensed water projected on these cross sections are shown in Figure 9. The double and single upward arrows denote the respective positions of the temperature front in which the maximum temperature gradient exists, and the wind front. Here the wind front refers to the wind shift zone between the northwesterly flow and the southwesterly or southwest-south flow, which is also coincident with the leading edge of the gust front convergence zone. In this case, these two fronts are obviously separated at the beginning, whereas, in the later evolutions, the temperature front exerts an evident effect on the wind front.
5.2.1. CI-B
As CI-A and CI-B are caused by the same process, only CI-B obtains detailed analysis in this paper. At 0100, cloud sectors associated with the southeastern rainfall systems have already extended into the cross sections along B1–B2 in Figure 7d, which helps to create a very moist and deep convective instability layer and also brings in a relatively cold region below 1 km (farthest left in Figure 9a). The leading edge of this cold dome is defined as the temperature front that is located at about 30 km along B1–B2. A weak ascending motion and associated shallow upward bulge have already appeared over the leading edge at this time. Since these cross sections are cut in a northwest-southeast direction and the southwesterly flow component is actually rather weak in comparison with the northwesterly flow, the override of these two different air masses is not shown. However, the weak wind convergent zone still could be identified at 75~80 km. Additionally, at this time, the BL convective eddies with relatively high were discernible to the south of this cold wedge, although they were still underdeveloped.
Accompanied by the southeastward propagation of the main cold dome, the cold wedge continuously extends to the southeast in these cross sections and also carries more enhanced northwesterly flow component. As a result, the leading edge of the cold wedge gradually approaches the wind shift zone and finally merges with the wind front at 0330 UTC (Figure 9b), which contributes to the enhancement of the frontal convergence, thereby promoting updrafts over their lifted condensation level (LCL). Nonetheless, the wind frontal convergence fails to provide sufficient upward forcing to lift parcels over their LFC, because storm B is initiated with a notable upward bulge along the HCR band situated a bit to the southeast rather than along the gust front convergence zone. In other words, the gust front convergence zone is not always the most preferable location for CI, while locally enhanced convergence is supposed to play a critical role in determining the exact CI location.
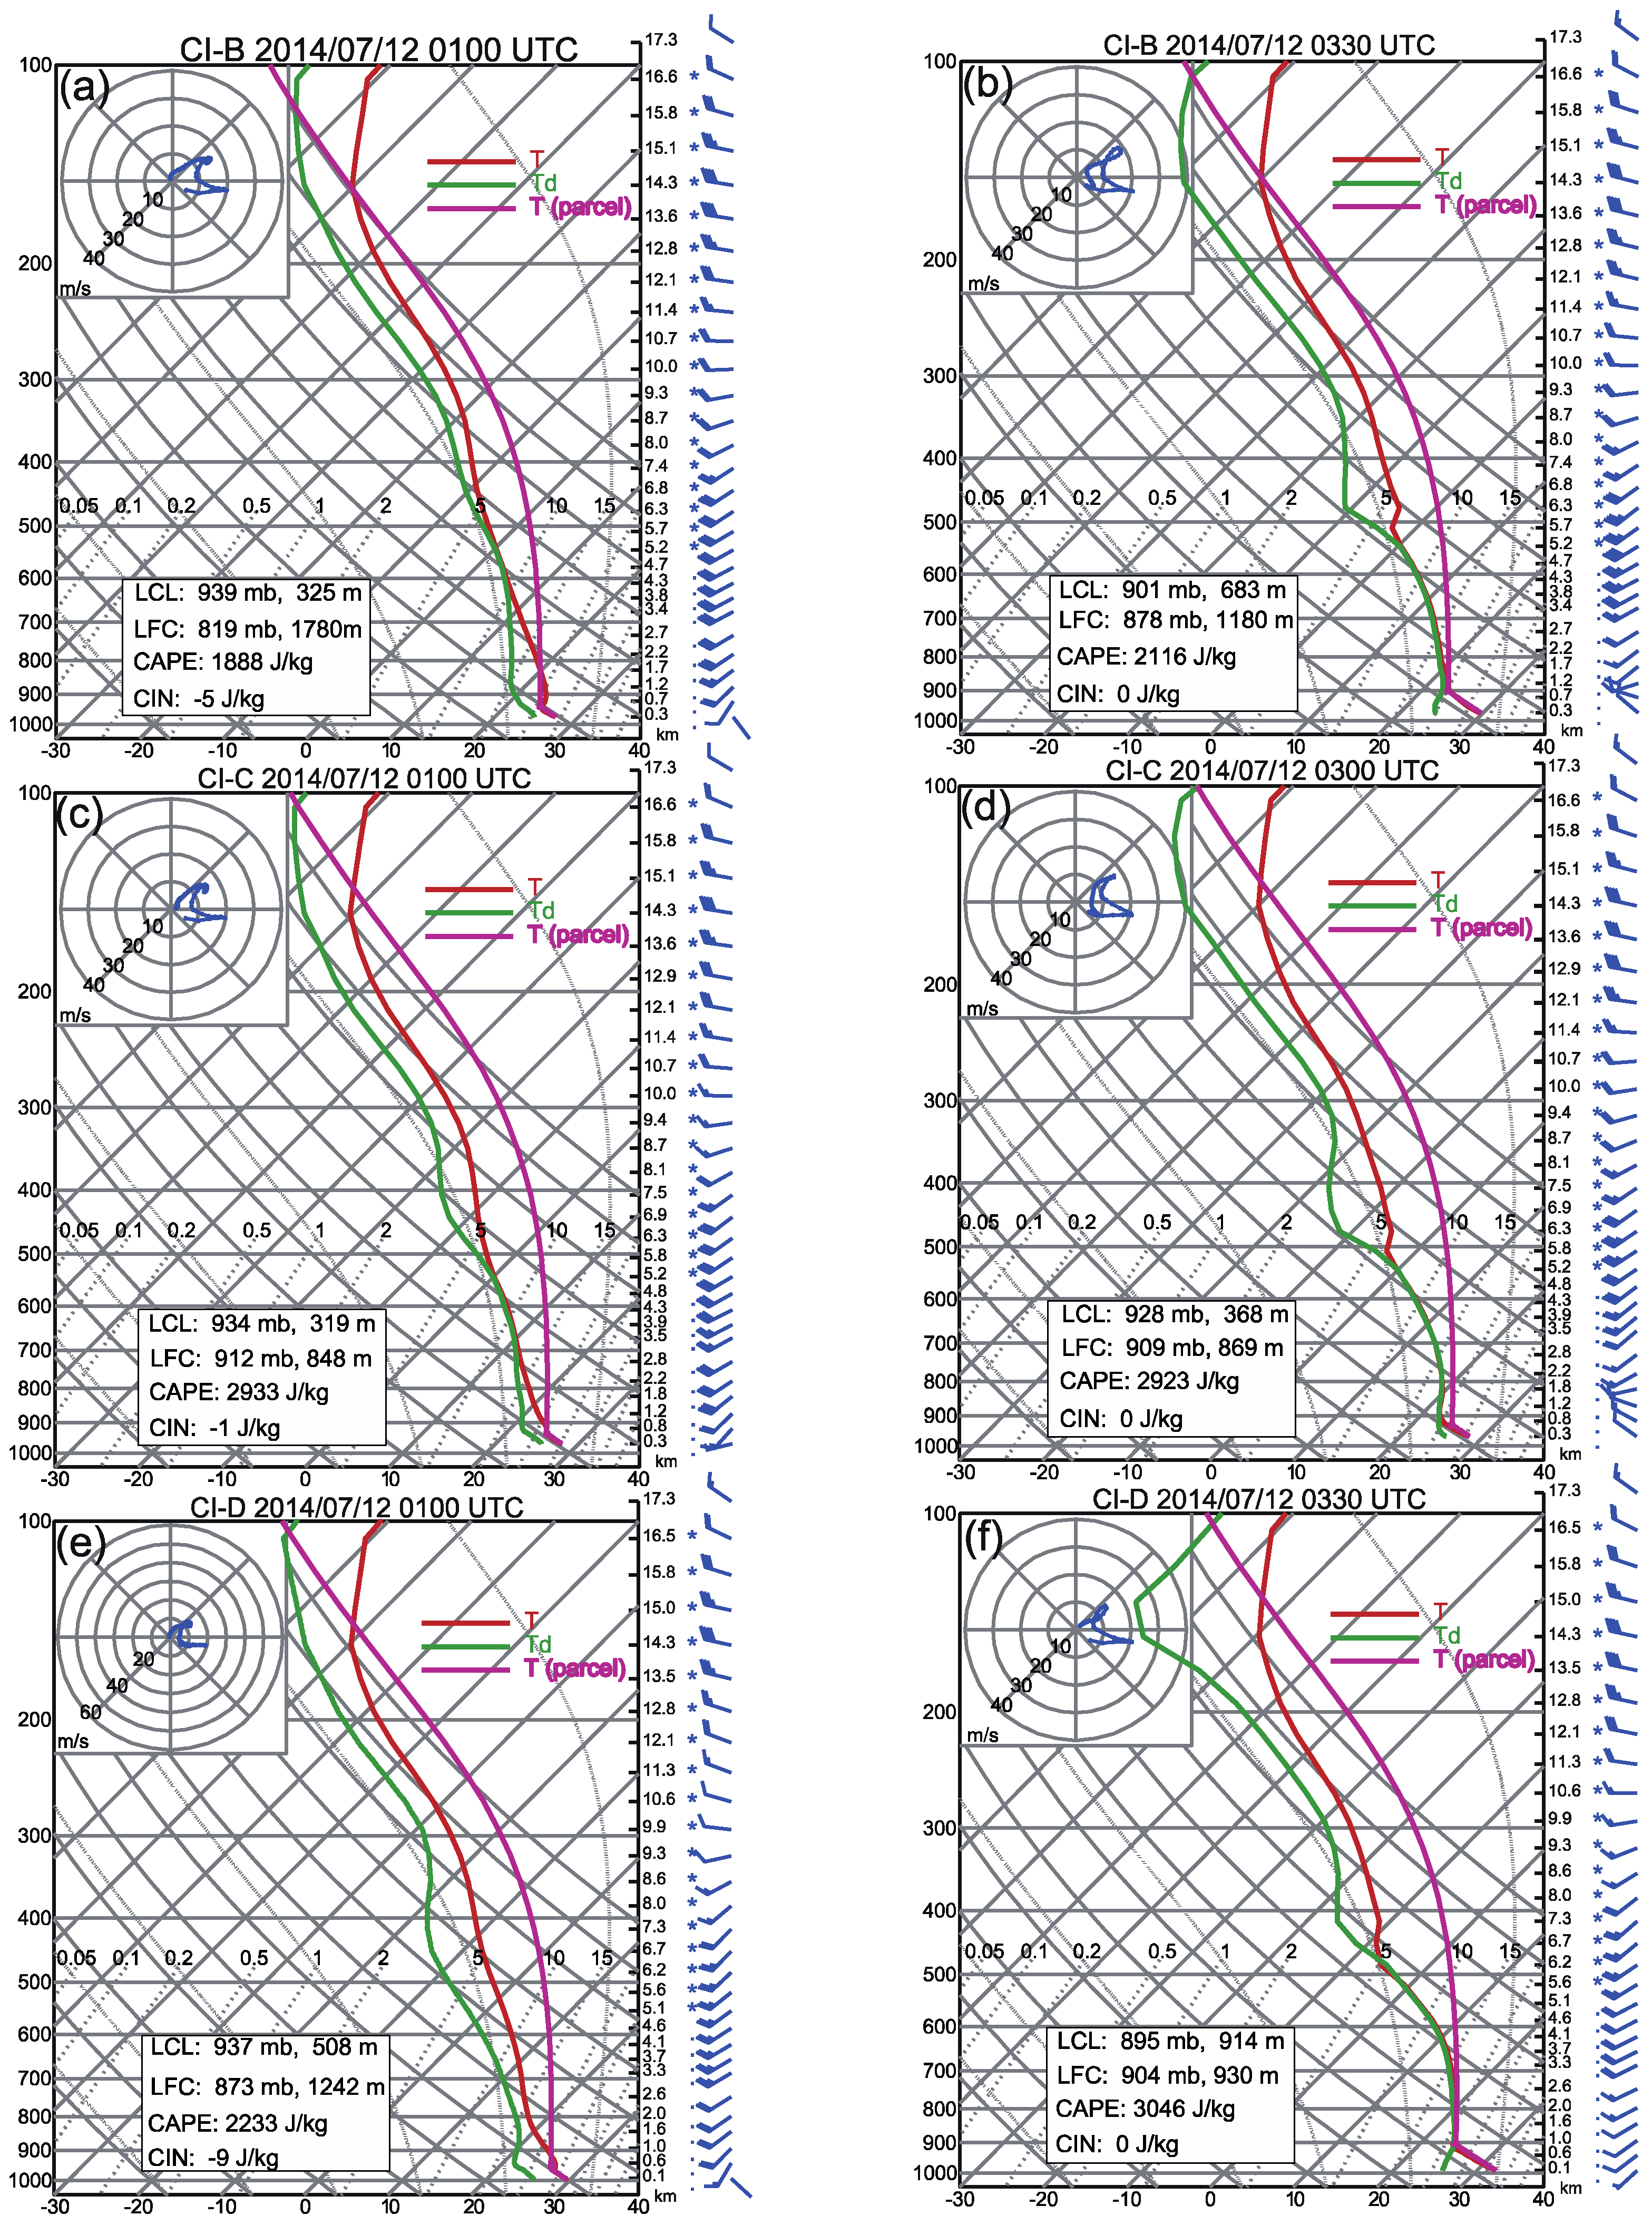
Extracted soundings of time evolutions can also be of great help to analyze the BL structures. Figure 10a,b show soundings extracted from the CI-B location, respectively, at 0100 and CI-B time. As the persistent rainfall and evaporation process ensure a relatively high humidity environment in the Meiyu season, an almost saturated layer already exists between 600 and 500 hPa at 0100 UTC and then goes down to 900 hPa at 0330. The mixing of the BL is still weak but deepens during the subsequent hours. For example, with the rising temperature in the low layer, the top of the mixed layer increases in 50 hPa and reaches 900 hPa level at 0330. Since the secondary gust front convergence zone lies rather far away from the CI-B location at 0100, the wind field at the low level constitutes a uniformly southwesterly flow. The northwesterly flow component appears below 900 hPa at 0330, in accordance with the propagation of the cold dome and resulting in enhanced localized convergence.
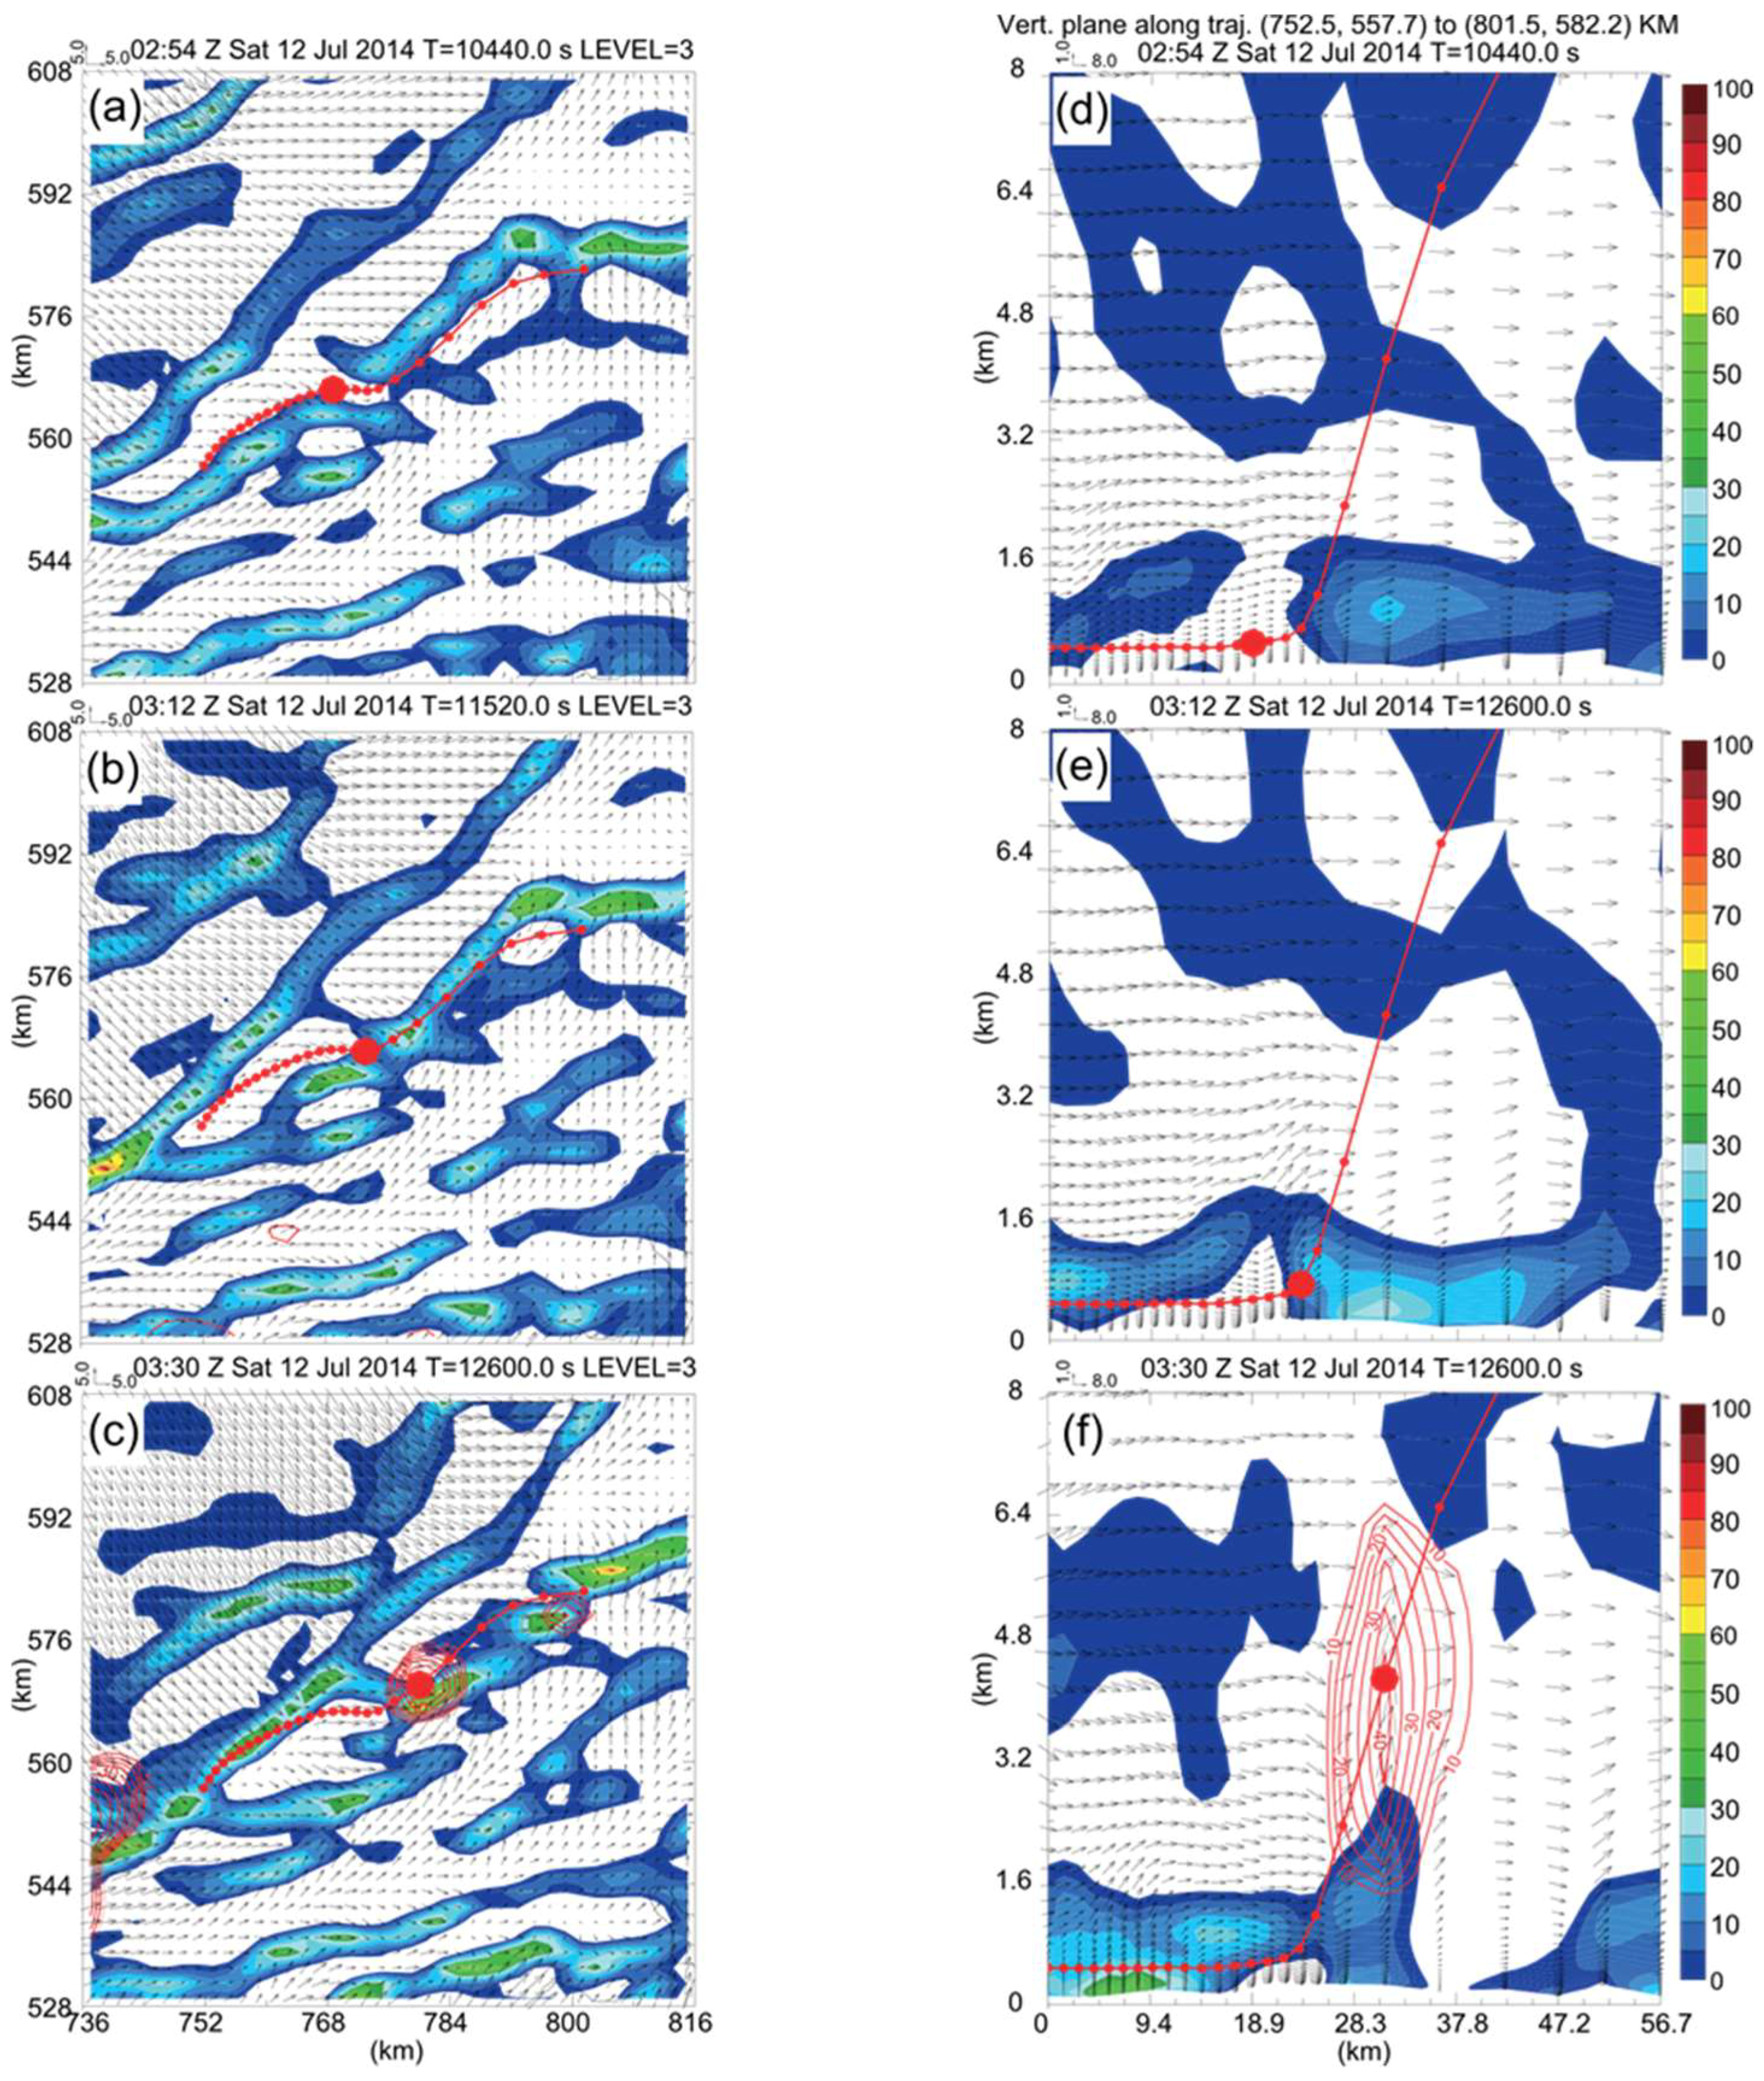
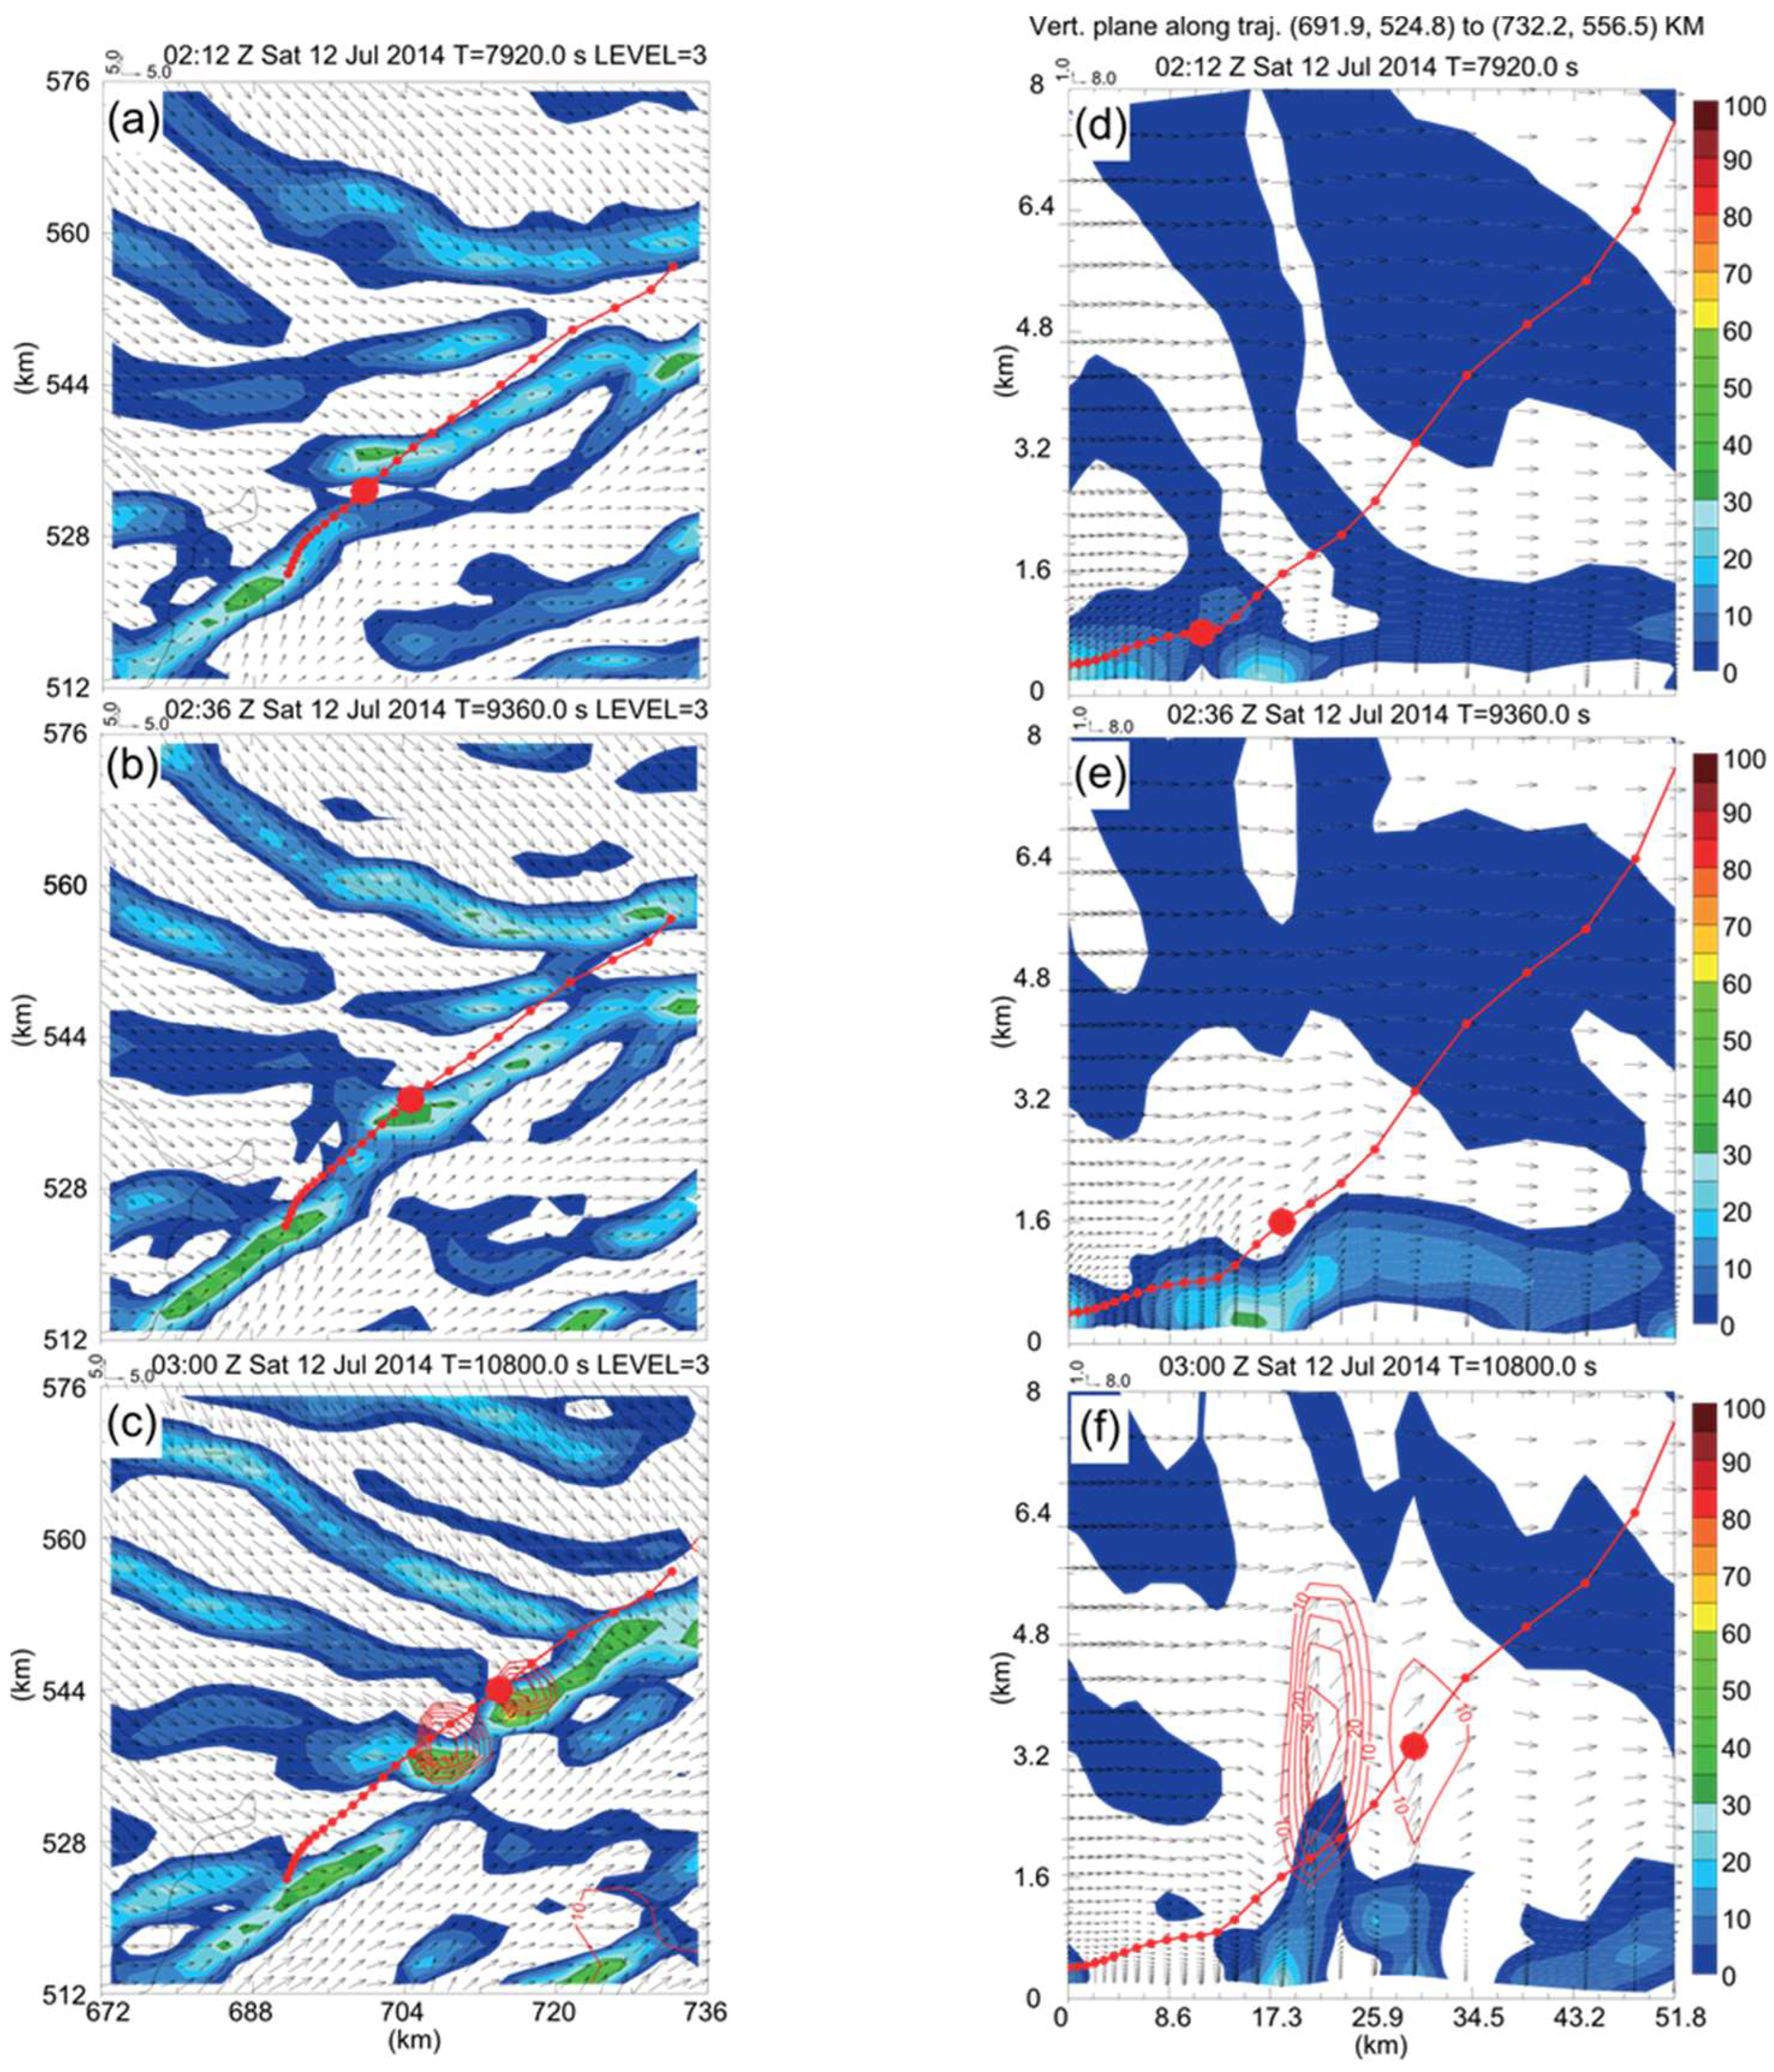
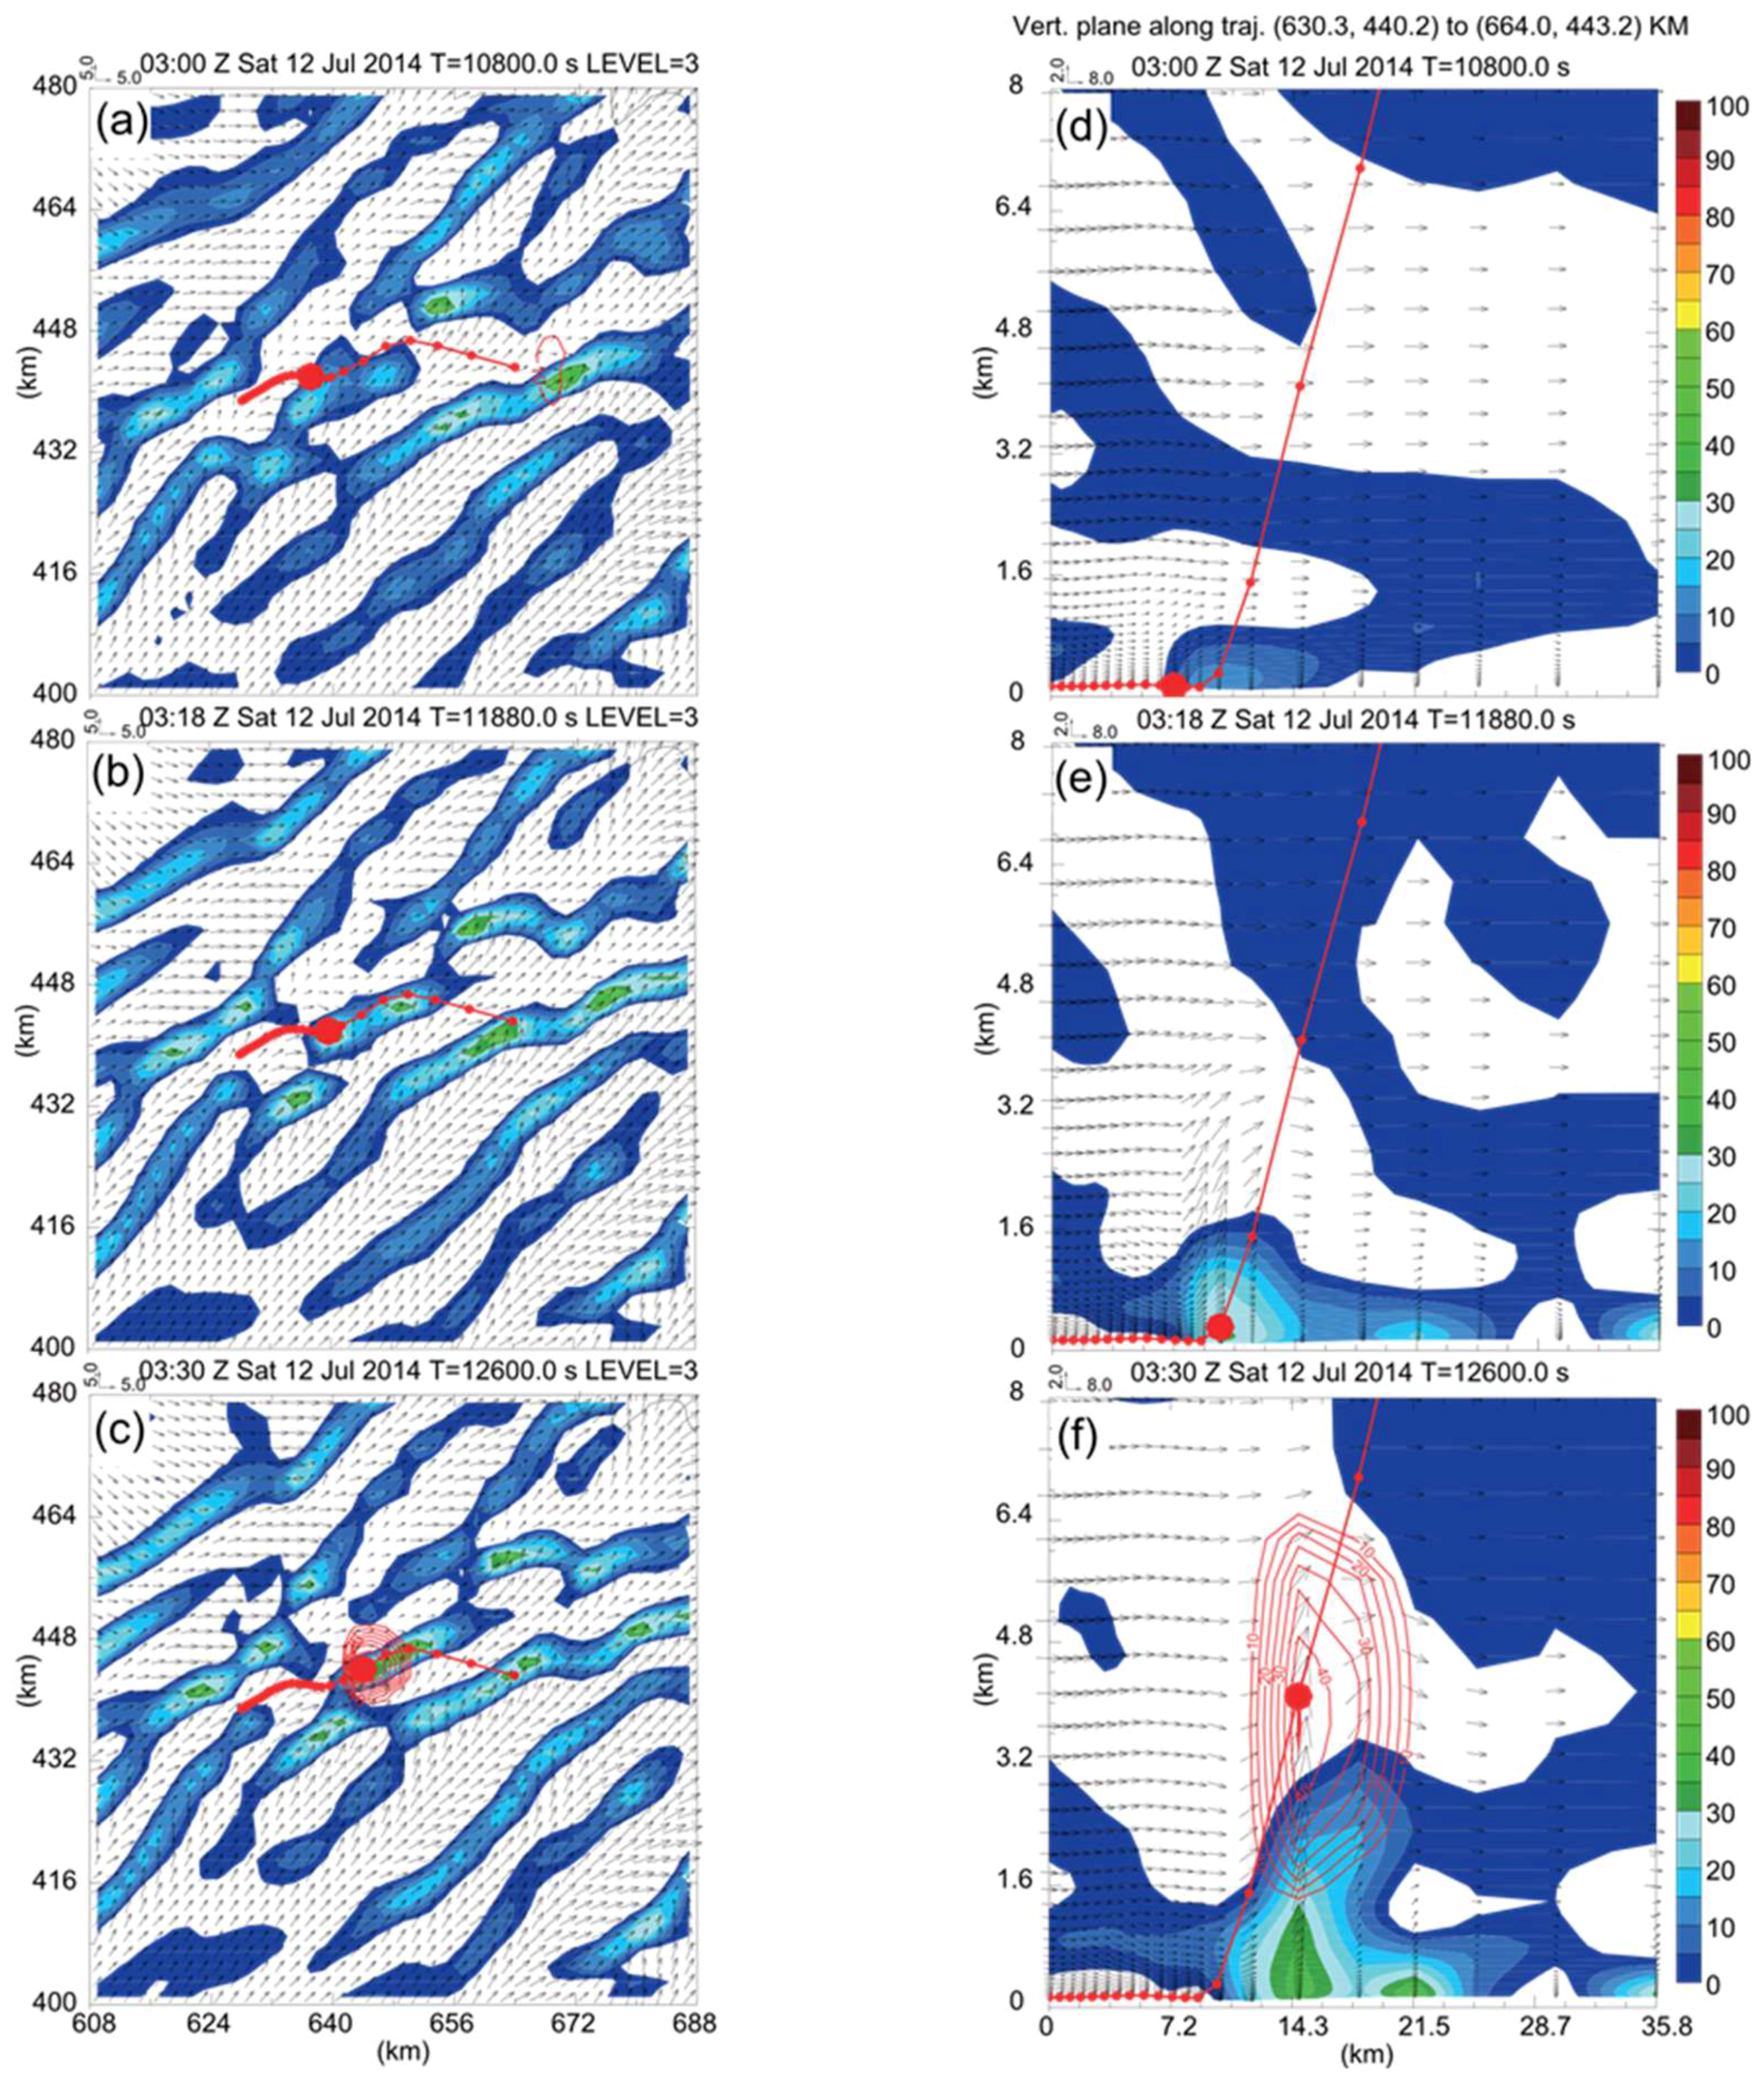
The above analyses have elucidated some relationships between the evolution of BL structures and CI-B, except how air parcels develop to finally breed in the initiated convective cell. To catch the source of air parcels feeding the initiated storms and to determine associated upward lifting preceding CIs, parcel trajectories are initialized at their corresponding CI timings and traced forward for two hours and backward in time and space for half an hour. The initialized location and the level of updraft core of cells B, C, and D are shown, respectively, in Figure 11c,f, Figure 12c,f, and Figure 13c,f. Projections of three trajectories onto the near-surface horizontal plane are plotted in Figure 11a–c, Figure 12a–c, and Figure 13a–c, together with the cross sections along their corresponding trajectories of the moisture convergence, which excludes the advection term, composite radar reflectivity, and wind fields in Figure 11d–f, Figure 12d–f, and Figure 13d–f. The location of the traced parcels at the specific time is marked by a large dot, and dots are shown each 6 min.
Figure 11a shows that the initial movement of parcel B is sandwiched between the HCR band where storm B is triggered and the main gust front zone, and is mainly affected by the strengthened northwesterly steering flow due to the southeastward approach of the secondary gust front zone. That is why the motion of storm B continues to drift to the southeast before 0254. Afterwards, owing to a gradually increasing south-southwesterly flow and deepened mixed layer, this HCR band becomes more organized and presents enhanced moisture convergence at 0312 (Figure 11b). Meanwhile, parcel B starts to move over the HCR band accompanied by potentially upward lifting over the moisture convergence bulge (Figure 11e). As expected, parcel B rises with a dramatic height increase from 0.75 km at 0312 to 4.2 km at 0330 (Figure 11f). Its sharp ascending motion also indicates that the locally enhanced convergence, which can lead to CI, is rather difficult to capture, especially within such a short time. For storm B, the propagation of the secondary gust front zone, the intensified southwesterly flow, and the deepened mixed layer all contribute to its initiation, whereas the enhanced localized convergence is of crucial importance to determine the exact CI timing and location.
5.2.2. CI-C
There are some differences in the flow structures in the cross sections along C1-C2 through CI-C and those of CI-B, but there are some major resemblances as well. Given that these cross sections extend more into the cold dome, the change in the BL thermodynamic character is more distinctive at 0100. Along C1–C2, the leading edge of the cold air wedge lies at around 40~45 km and is some distant way from the wind shear zone at about 50 km. It should be noted here that no upward bulge exists over this wedge, because the upstream precipitation systems have not come over (Figure 9c). As in the case of CI-B, at this time, the BL convective eddies have emerged from the southwest of the wind front. Also, as the cold dome progresses forward, the establishment of the enhanced upward lifting over the wedge frontier is increasingly evident. At 0300, the temperature front has moved forward about 15 km and produces a strong updraft over 2 km height. Unlike CI-B, a temperature buffer presents at the forefront of this cold wedge and separates the great temperature gradient zone from the wind front (Figure 9d). Obviously, storm C is initiated right over the wind convergence zone rather than over the cold wedge leading edge. This result reveals that the density current associated with the cold dome is still unable to provide sufficient lifting for air parcel over the LFC, and that the essential upward forcing for CI-C mainly results from the gust front convergence.
The 0100 sounding for CI-C has a similar structure as that for the CI-B location, except for the relatively larger surface CAPE value and a deeper saturated layer down to 700 hPa, since CI-C occurred further south. The low-level wind shear over the main gust front convergence zone (Figure 10c,d) is apparently stronger than that on the HCR band and explains why cell C is initiated first in the model. Parcel C keeps moving over the main gust front zone for the entire time, and each location always coincides with the maximum convergence area (Figure 12a,c). For this reason, the vertical lifting for parcel C shows a gradual increase rather than an abrupt jump, much like parcel B (Figure 12d,f). Overall, its consistent northeastward movement and concomitant ascending motion are mainly due to the propagation of the main cold dome and the gradually increasing southwesterly flow. Another maximum reflectivity core appearing along the parcel C trajectory (Figure 12c,f) moves almost together with parcel C over the low-level convergence maximum. Most notably, the development processes of these two adjacent parcels are identical. After 0300, these two parcels merge into one cell storm C.
5.2.3. CI-D
The cross sections through CI-D at 0100 (Figure 9e) are quite different from the two sections discussed above. Although these cross sections extend a little to the cold area, the thermodynamic difference of air masses along D1–D2 is unidentified. However, the near-surface to the southeast of 45 km is a little bit higher, suggesting that the BL convective activities are still rather weak at this time. As the surface heating increases, a close correspondence is revealed between the individual bulge and each HCR band. At 0330, approximately six HCR bands cut through D1–D2, coincident with the presence of six bulges in the cross sections (Figure 9f). Meanwhile, these upward branches have been able to lift air parcels over their LCL, and associated shallow clouds have already formed on top of the corresponding HCR bands. Storm D is then triggered over one of the HCR bands, which exhibits the strongest vertical lifting.
The evolution of soundings located at CI-D (Figure 10e,f) also reveals some differences in BL structures when compared with those for CI-B and CI-C. For CI-C and CI-B at 0100, the troposphere layer between 500 hPa and 600 hPa is almost saturated, corresponding to the adjacent mid-layer clouds. With respect to CI-D, the mid-layer is relatively drier and warmer (Figure 10e). Since the location of CI-D is more affected by the surface heating, by 0330, the surface CAPE reaches 3046 J kg−1 (Figure 10f), which is the largest value among these three CI locations at CI times. At CI-D, the relatively uniform southwesterly flow in the low-level explains the predominant southwest to northwest orientation of HCR bands. In the first three hours, parcel D moves quite slowly between two adjacent HCR bands (Figure 13a), and its northeastward movement is nearly close to the surface (Figure 13d), indicating the surrounding southwesterly wind and associated vertical momentum mixing are still weak during this period. At 0300, parcel D starts to embed in its right-hand HCR band and appears over the relatively large convergence area. Afterwards, parcel D continues to move along this HCR band (Figure 13b,c), while the upward forcing over this HCR band becomes stronger (Figure 13e) with the exhibition of more organized structures by the HCR bands. After 0318, parcel D obtains persistent lifting, and CI-D ensues in the next 12 min (Figure 13f). Of interest is that after HCRs evolve into OCCs at 0348, the nearby surface wind divergence field produced by the descending motion of OCCs forces the northeastward movement of storm D to deviate a lot to the southeast.
The above analyses of CI-B, CI-C, and CI-D can represent three typical initiation processes for IOP-8 convective storms. Although the propagation of the cold dome plays a crucial role in enhancing the gust frontal convergence, which is enough to force cell C over its LFC, CI-B still appears along the HCR band rather than the secondary gust front zone. It means that the exact initiation of cell B is determined by the locally enhanced convergence associated with the BL rolls, while CI-C is the most typical of the gust front initiation. CI-D is quite distinguished from the above two types, since the gust front convergence has little influence, and the main forcing for cell D comes from the HCR circulations. The soundings at these three initiation locations have some similarities, which also represent the environmental characters in Meiyu season, such as relatively high humidity, weak low-level wind shear, and small CIN. Also, as the surface heating increases in the morning, the mixed layer keeps deepening in the hours preceding CIs and brings in higher southwesterly momentum to enhance the surface convergence. Nevertheless, as the weather in Meiyu season shows characteristics of cloudy, abundant precipitation and short daily sunshine, how much could the surface and BL processes contribute to this moist convection? Are there similarities with the dryline cases in the United States Southern Great Plains (SGP)? Detailed explanations will be given in the next section.
6. Sensitivity Experiments
6.1. Surface Heat Flux Turned off
We rerun the simulation that is identical to the CTRL, except that the surface heat flux is turned off (denoted as the nosflx). We also plot the same fields with Figure 7 but at 0230, 0300, and 0330 in Figure 14a–c. The differences in temperature and wind fields between the CTRL and nosflx are also shown in Figure 14d–f. In nosflx, the initiations of focused convective cells do not present at their corresponding CI timings. Specifically, the delays of CI-B, CI-C, and CI-D are, respectively, 1.5 h, 1 h 48 min, and 2 h 18 min, and all of their location deviations extend more to the southeast because of the strengthened cold northwesterly flow. The convergence bands, including the main gust front and HCRs, become unidentifiable. Some weaker convergence regions are still shown but are distributed in unorganized structures. Actually, as revealed in the difference fields, the remarkable change demonstrates in the clear air region south of the gust front that the surface temperature cannot rise without the surface heating, so that the southwesterly momentum mixing towards the surface is dramatically reduced. This not only leads to the HCRs ceasing to develop but to the surface convergence weakening along the main gust front zone.
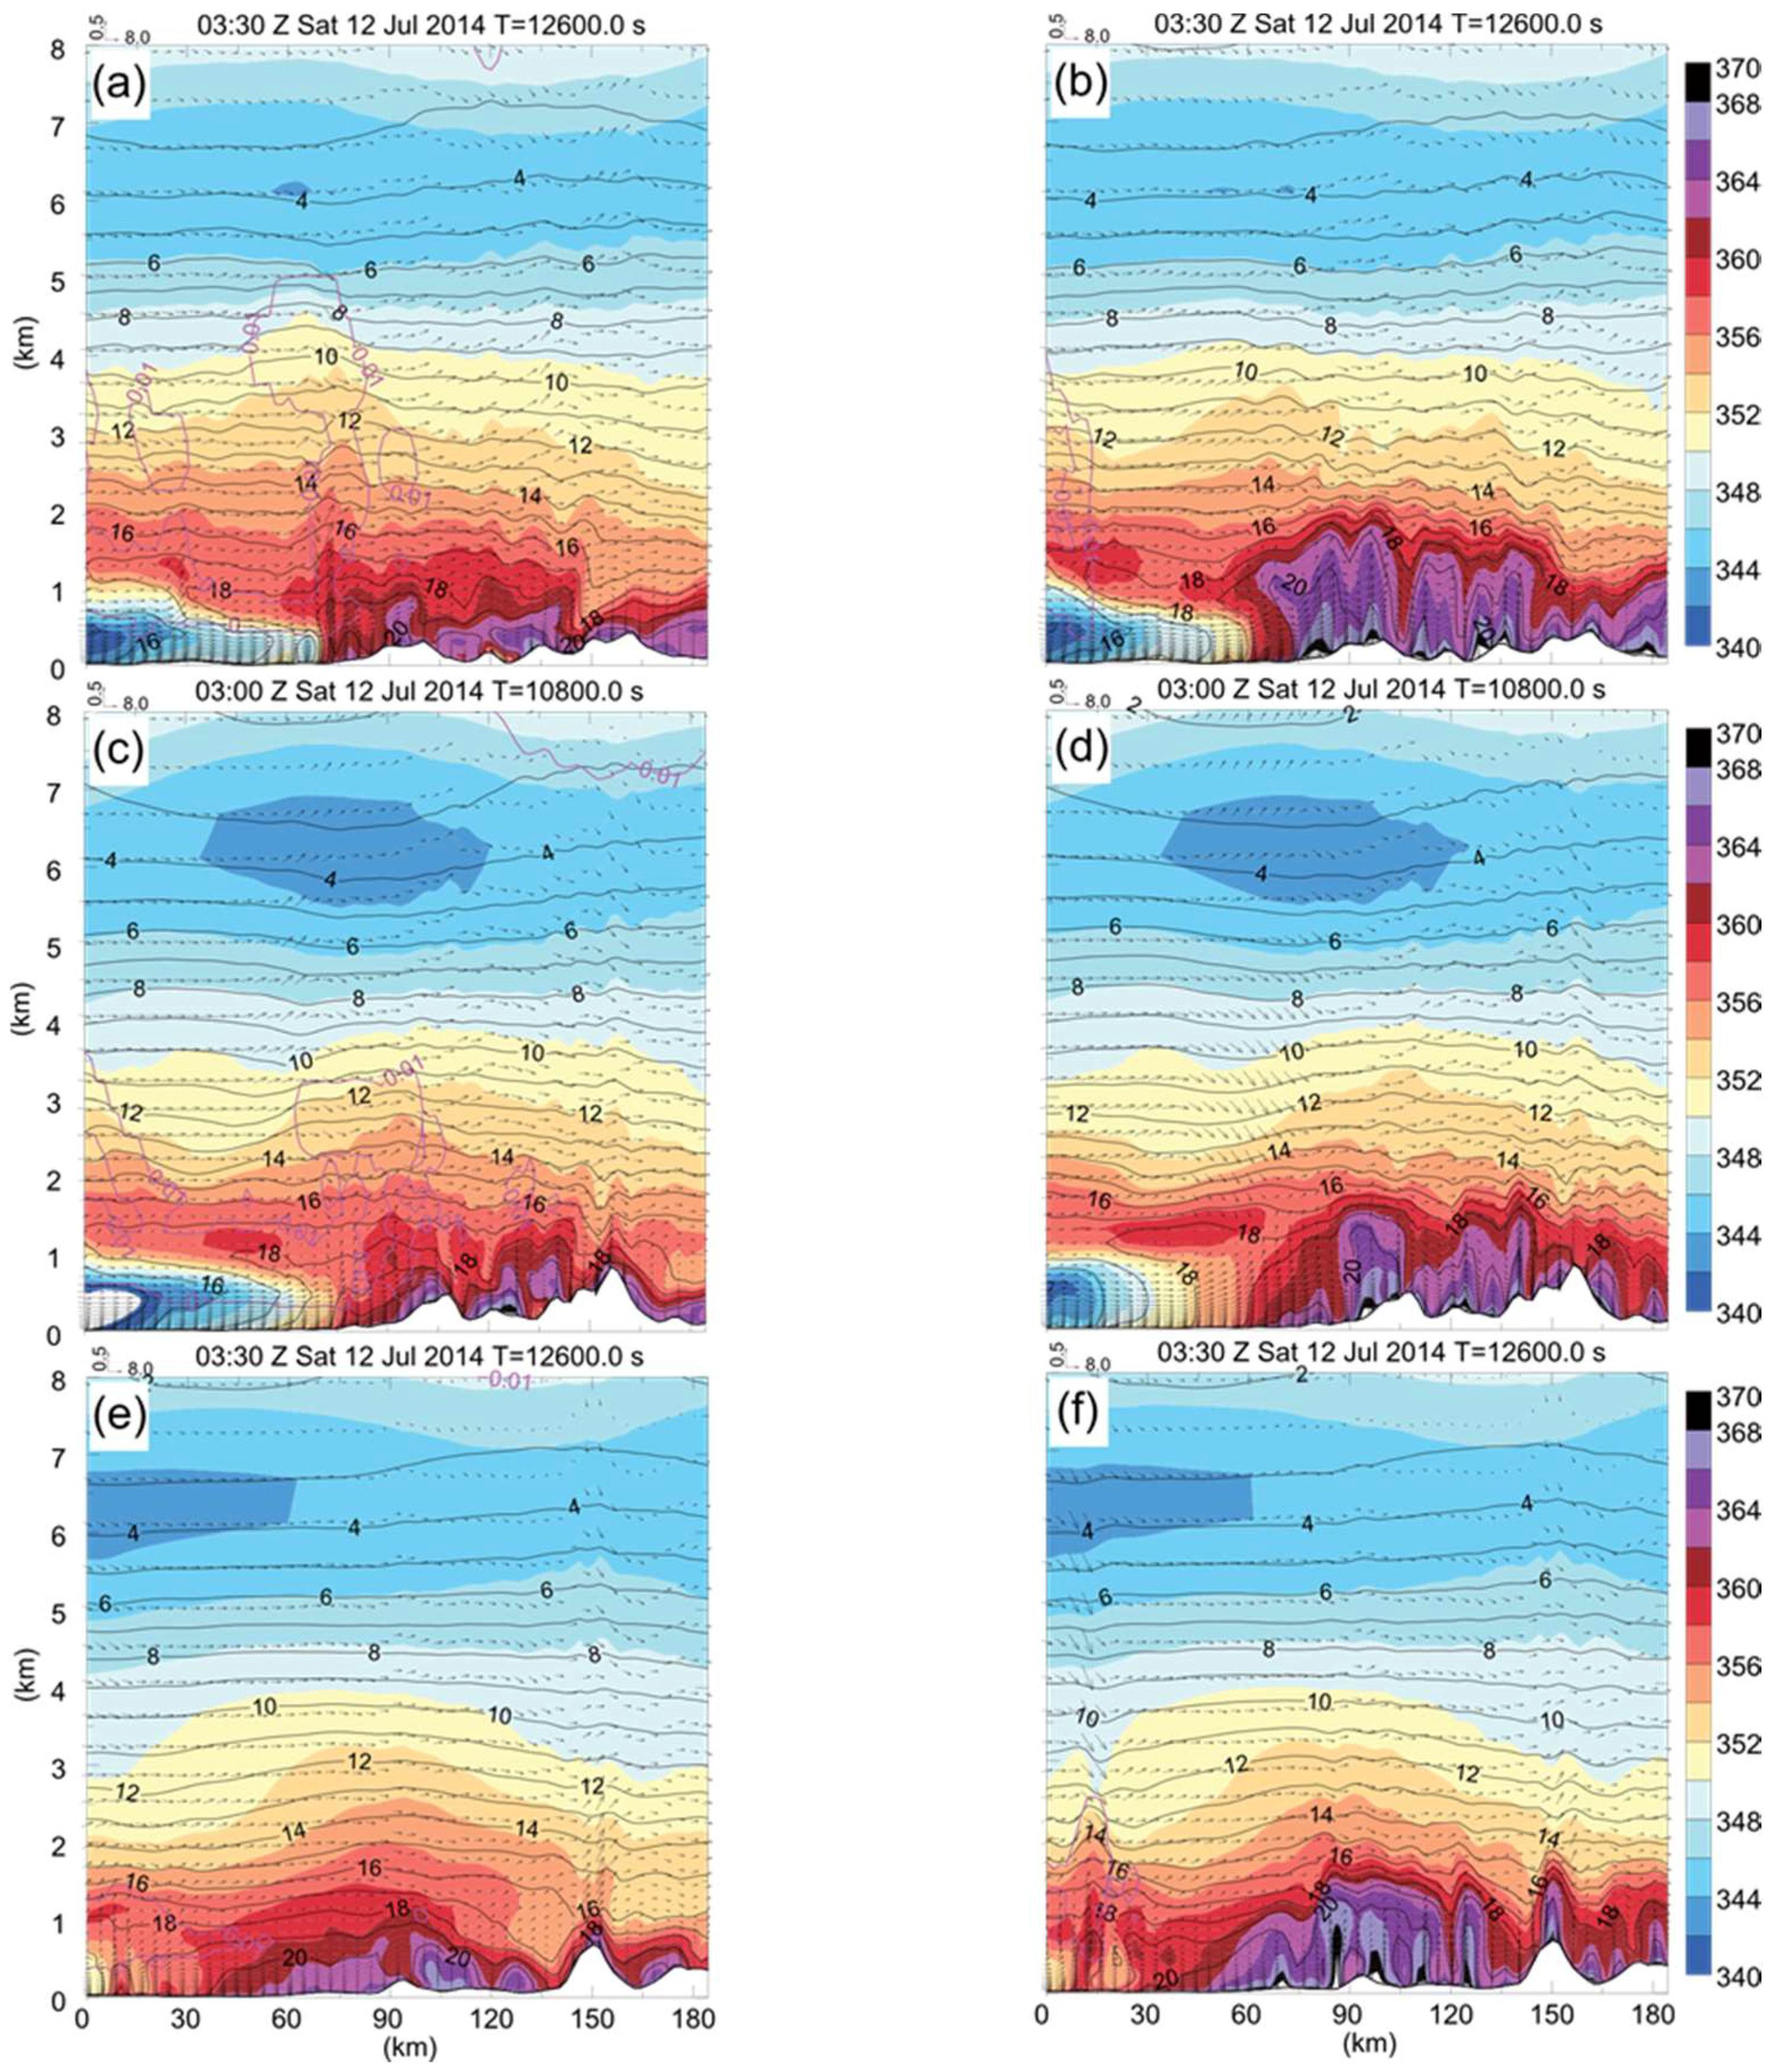
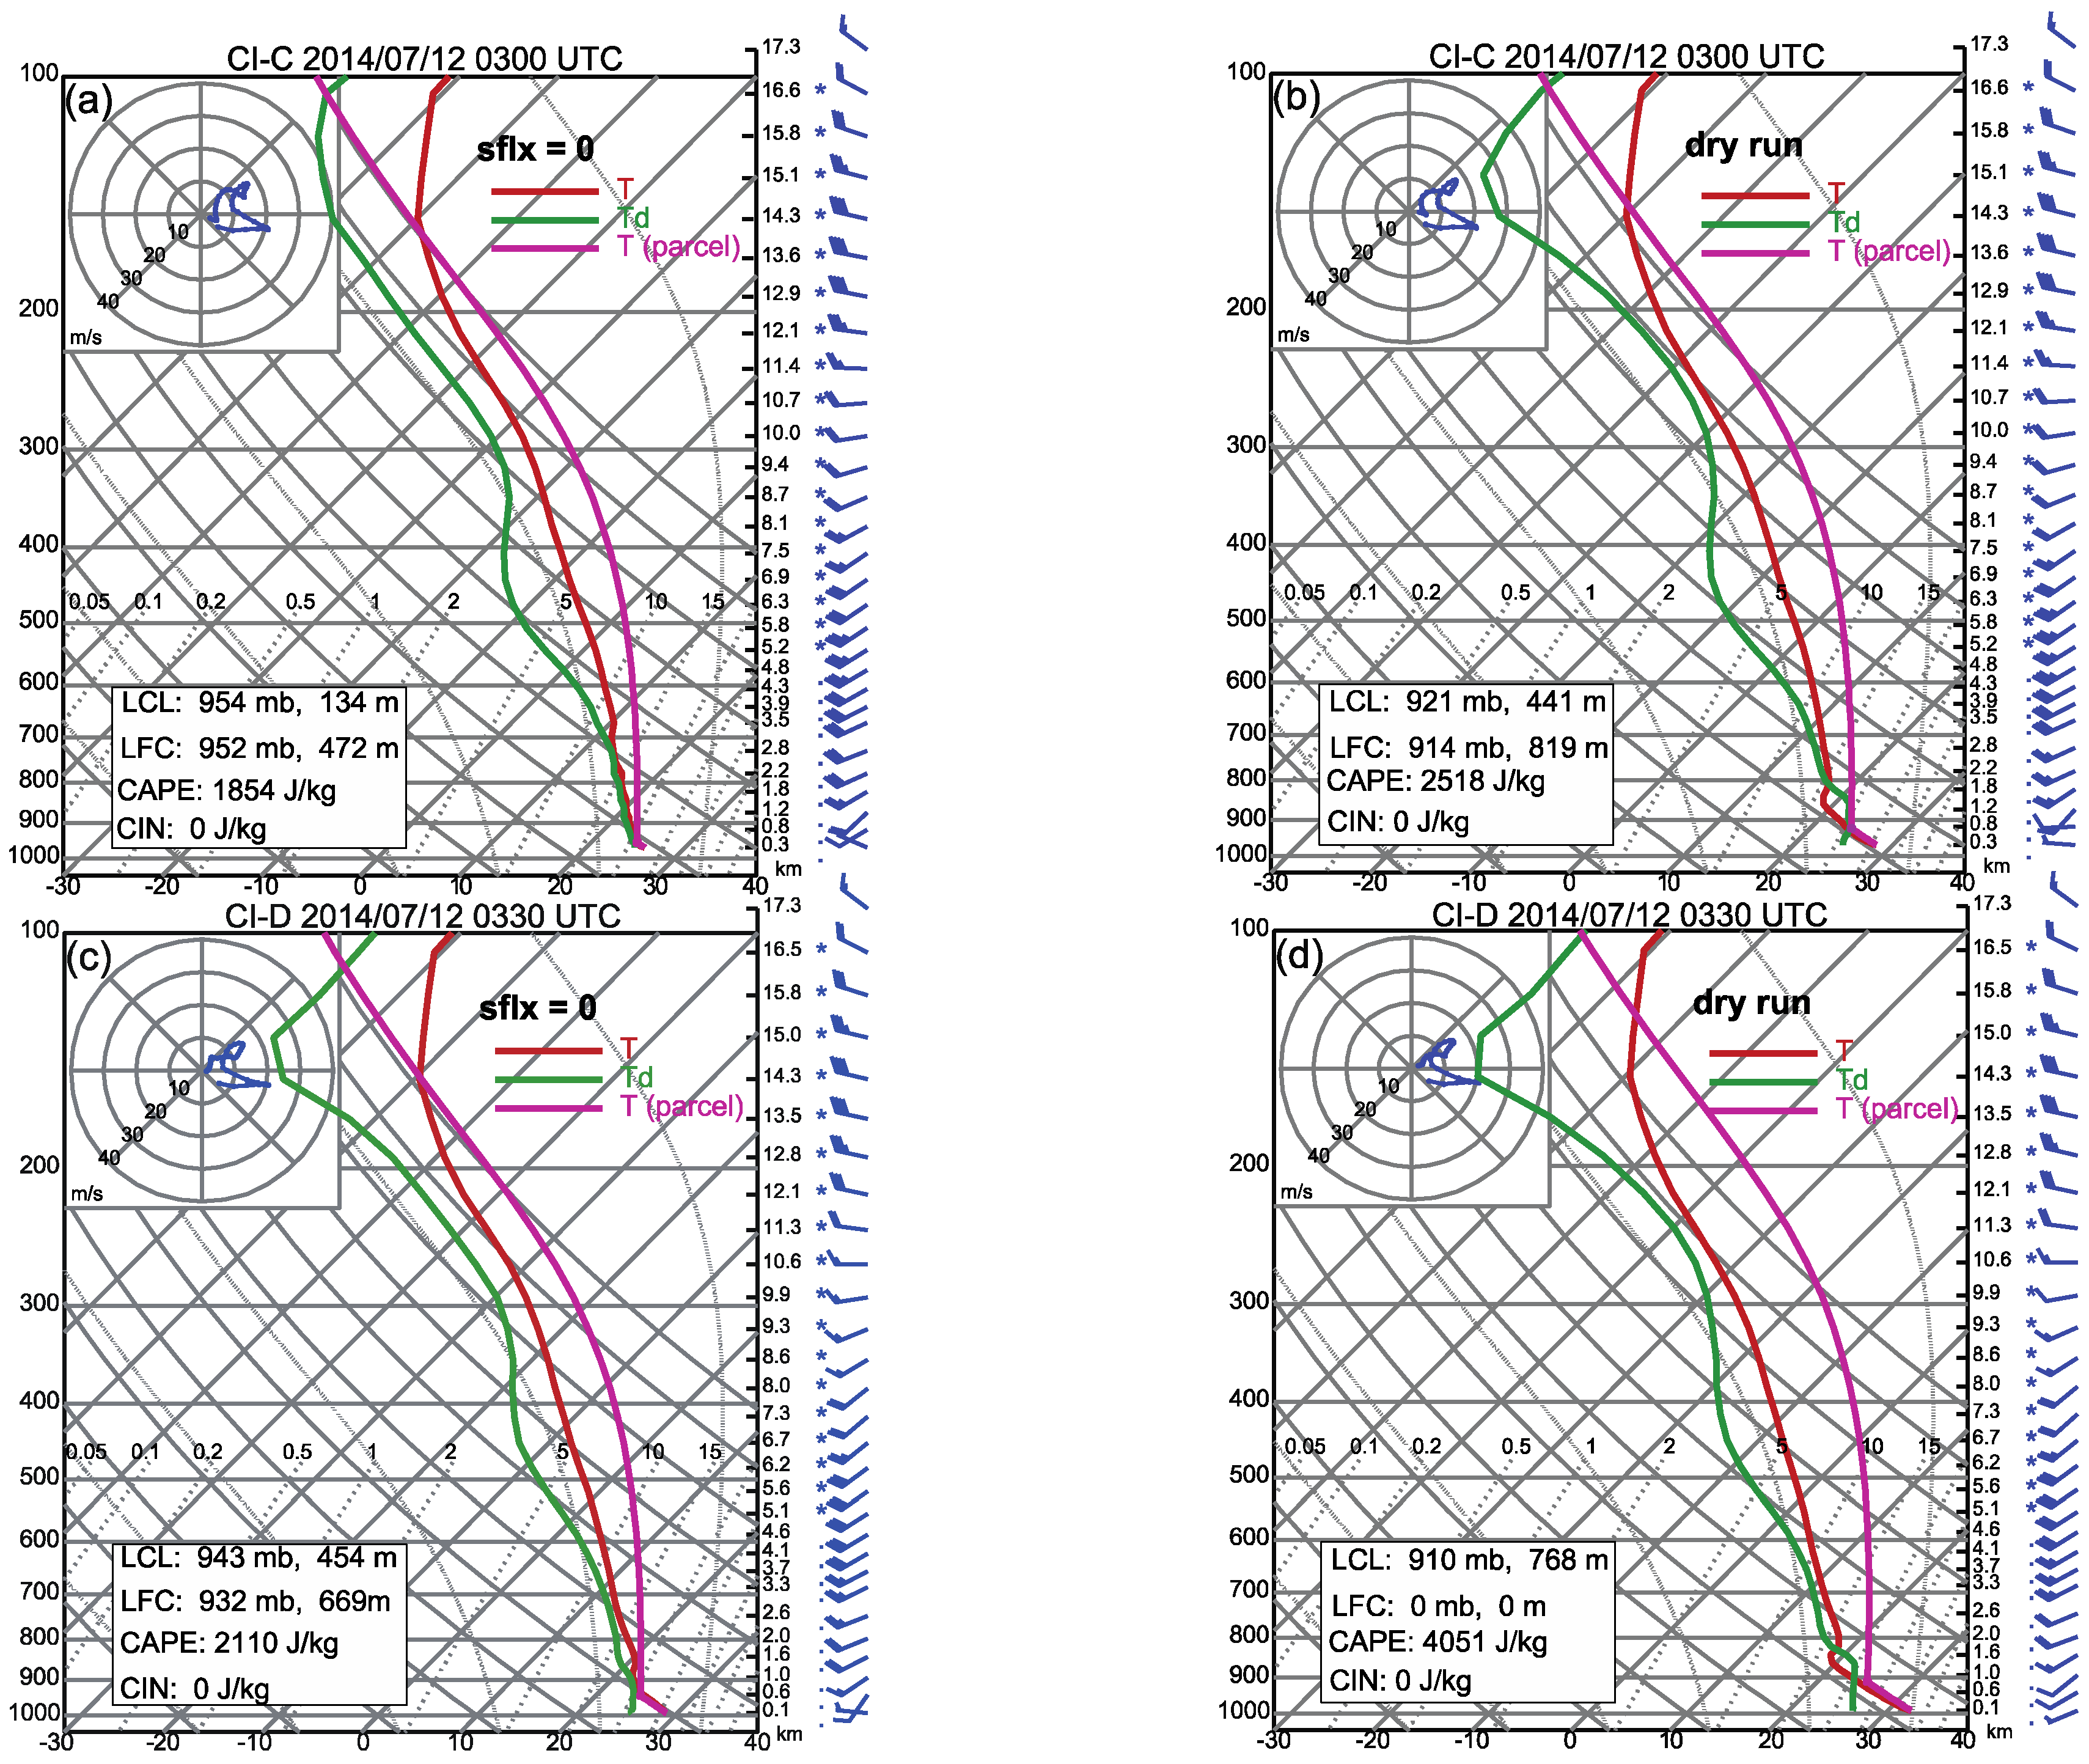
In order to show more detailed BL structures in nosflx, Figure 15 further compares the variations of fields shown in Figure 9. Although the strength of the cold wedge increases and concomitant ascending motion over the leading edge still exists, the upward bulges in these three cross sections are all confined below 1 km, suggesting that the surface convergence at these times provides as much upward forcing as that in CTRL. The extracted soundings at CI-C and CI-D in nosflx are also illustrated in Figure 16a,b. With the surface heat flux turned off, the surface temperature falls by a few degrees, and the associated surface CAPE decreases almost by 1000 J kg−1. The mixed moisture fields in the lower troposphere layer for CI-D basically vanish and only exist below 700 hPa for CI-C. However, as shown in CTRL, the moisture gets mixed rather well in the low layer.
Overall, the primary role of the surface heating is to cause the vertical mixing, mainly including the temperature, moisture, and wind fields in the BL, so as to facilitate the BL air to be lifted. Furthermore, the surface convergence could also be enhanced, because the strong vertical mixing is capable of bringing higher southwesterly momentum to the lower level. For this case, the surface heating and induced BL vertical mixing provide indispensable environment forcing. Apart from the dynamic forcing produced by the wind convergence zone, the release of the condensational heating can also increase convective instability and, consequently, enhance localized upward motion. For CI cases occurring in Meiyu season, analysis of such feedback effect could be quite interesting.
6.2. Dry Run
To evaluate the contribution of the condensational heating feedback, another simulation with the moisture processes turned off (the water vapor transition processes are excluded, denoted as dry run) is performed. Note that the dry run is only operated in a specific area (the plotted area shown in Figure 8) that covers the studied convective cells, the major parts of the gust front, and HCR bands; additionally, the rest of the model configurations are the same with the CTRL. The point of such an operation is to avoid the evaporative cooling affecting the main cold dome, thereby protecting the flow pattern in the entire model from a dramatic change and not over-evaluating the impact of the condensational heating.
The vertical cross sections in dry run are also shown in Figure 15 to reveal the BL structures. As shown in Figure 15d,e, the leading edge of the cold wedge retreats a little to the northwest, indicating the weakening of the cold dome and its associated density currents. However, the upward bulge and concomitant ascending motion at CI locations still can develop above the height of 1.5 km. Here, these upward forcings are believed to be established by the low-layer convergence only associated with HCRs and/or gust front. Additionally, the soundings in dry run for CI-C and CI-D present a super-saturation layer near 800 hPa. Between 850 and 800 hPa, the atmosphere is neutrally stable, and the unstable convection layer with a higher lapse rate appears below 850 hPa. The accumulation of the surface CAPE after the condensation process is disallowed is also shown in Figure 15d. Therefore, convective bursts will be immediately triggered near 900 hPa if the moisture processes are turned on in the model. It turns out that the condensational heating is of less importance for this case initiation, and that only the upward forcing supported by the gust front and HCR bands enables one to bring the near-surface air masses over their LFC. The above two sensitivity experiments also demonstrate that even in the moist Meiyu season, the BL processes for some CI cases could be as important as for CIs in some drier environments, such as those associated with drylines over the United States SGP.
7. Summary and Conclusions
In this study, the initiation of convective cells that evolved into a squall line on the southern flank of a Meiyu front on 12 July 2014 is simulated using the ARPS. Surface observations are assimilated into the initial conditions of control experiment (CTRL) using the ARPS 3DVAR. Another experiment (no-DA) that is the same as CNTL but without surface data assimilation is also performed to assess the impact of initial condition.
The initial four convective cells (denoted as A through D) are reasonably captured in CTRL. In observations, cells A to C appeared at the same times close to the junction of the three provinces Hubei, Hunan, and Jiangxi, and cell C soon grew into the dominant storm with larger size and stronger intensity. About 18 min later, cell D was initiated a little farther southwest of this system, creating a southwest to northeast convective line through cell C where later new storms consecutively formed. In CTRL, the initiation of cell C is predicted at the correct time but with a 80 km northeastward deviation. In fact, affected by the earlier frontal precipitation systems, the predicted CI locations in CTRL all deviate to the northeast. As for timing, the errors of predicted CI-A (CI-B) and CI-D are within 30 min and 12 min, respectively. Additionally, the general evolutions of the above four CIs in the hours are predicted fairly well. Nevertheless, the first convective cell in no-DA appears almost one hour earlier than observed, because the corresponding background field with larger surface CAPE and stronger southwesterly flow is too conducive to convection. The results in CTRL are more realistic, and are therefore used for detailed analysis of the CI processes.
Among these four CIs, only CI-C forms in the gust front zone. The other three CIs all appear along convergence bands associated with BL HCRs. Most of these BL HCRs appear south of the gust front, and they become more organized when the surface heating increases the low-layer convective instability and enhances the BL vertical mixing. Preceding CI-B, the propagation of the cold dome produced by earlier frontal precipitation causes two gust fronts to merge; therefore, the northwesterly flow over the frontal leading edge intensifies. The vertical cross sections through CI-B indicate that the gust frontal forcing itself is not sufficient to lift the low-level air parcels above their LFC, and that the localized maximum convergence over the adjacent HCR band plays a decisive role in determining the exact CI location. CI-C is a typical gust front initiation with the frontal convergence providing the main upward forcing. CI-D occurs south of and sufficient far away from the gust front, and is mainly forced by enhanced HCR circulations. Note that as CI-A and CI-B are caused by the same process, detailed analysis of CI-B is enough. Figure 17 is a conceptual diagram that shows the key elements involved in this case with several types of CI.
The analysis of air parcel trajectories reveals that, unlike the persistent forcing over the gust front zone for CI-C, vertical lifting associated with HCR bands for the other three cells undergoes a sudden enhancement in just a few minutes. This behavior definitely increases the difficulty of predicting CI in such conditions. Soundings extracted at CI locations exhibit some typical characteristics of the environment field in Meiyu season, such as relatively high humidity, weak low-level shear, and small CIN. Additionally, as CI-D occurs over the southern cloud free area, the corresponding BL is more affected by the surface heating.
The critical role of the surface and BL process for this case is confirmed in experiments with the surface heat flux or moist processes turned off. With surface heat flux turned off, the initiations of convection are much delayed due to the lack of HCR-related vertical lifting (and reduced CAPE). The weakened BL vertical mixing directly leads to a significant reduction of the downward transport of southwesterly momentum towards the surface, so that the surface gust front convergence and the HCR circulations are much weaker. Especially for the HCRs, almost all of them remain unorganized. Compared with the essential contribution of the BL process, the feedback of condensational heating is less important, as long as the near-surface parcel over the gust front zone or HCR bands can be lifted to above their level of free convection.
Because the sky in the Meiyu frontal zone across the Yangtze-Huai River is generally cloudy and the season is characterized by abundant precipitation and loss of sunshine, so not much attention has been paid to the relationship between the BL processes and CI. Therefore, this study helps to gain insights into their detailed interactions. Even though 2 km grid spacing in this model may not be enough to accurately simulate the detailed HCR structures, their roles in CI are believed to be qualitatively correct in the simulations.
Author Contributions
X.L. performed the numerical experiments, data analysis and manuscript preparation. M.X. motivated the study, selected the case and guided the process analysis. J.F. contributed to the analyses of physical processes.
Funding
This research was funded by [National Natural Science Foundation of China] grant number [41230421, 41730965].
Acknowledgments
This work was primarily supported by the National Natural Science Foundation of China grants 41230421 and 41730965. The first author also thanks Zhu Kefeng and Sun Zhengqi for assistance with the model simulations.
Conflicts of Interest
The authors declare no conflict of interest.
References
- Ding, Y.H. Summer monsoon rainfalls in China. J. Meteorol. Soc. Jpn. 1992, 70, 373–396. [Google Scholar] [CrossRef]
- Chen, G.T.-J.; Yu, C.-C. Study of low-level jet and extreme heavy rainfall for northern Taiwan in the Meiyu season. Mon. Weather Rev. 1998, 116, 884–891. [Google Scholar] [CrossRef]
- Ding, Y.H.; Chan, J.C.L. The East Asian summer monsoon: An overview. Meteorol. Atmos. Phys. 2005, 89, 117–142. [Google Scholar]
- Wang, C.-C.; Chen, G.T.-J.; Huang, S.-Y. Remote trigger of deep convection by cold outflow over the Taiwan Strait in the Meiyu season: A modeling study of the 8 June 2007 case. Mon. Weather Rev. 2011, 139, 2854–2875. [Google Scholar] [CrossRef]
- Zhang, M.; Zhang, D.-L. Subkilometer simulation of a torrential-rain-producing mesoscale convective system in East China. Part I: Model verification and convective organization. Mon. Weather Rev. 2012, 140, 184–201. [Google Scholar] [CrossRef]
- Luo, Y.; Gong, Y.; Zhang, D.-L. Initiation and organizational modes of an extreme-rain-producing mesoscale convective system along a Meiyu front in East China. Mon. Weather Rev. 2014, 142, 203–221. [Google Scholar] [CrossRef]
- Sun, J.H.; Zhao, S.X.; Xu, G.K.; Meng, Q.T. Study on a mesoscale convective vortex causing heavy rainfall during the Meiyu season in 2003. Adv. Atmos. Sci. 2010, 27, 1193–1209. [Google Scholar] [CrossRef]
- Sun, J.; Zhang, F. Impacts of mountain-plains solenoid on diurnal variations of rainfalls along the Meiyu front over east China plains. Mon. Weather Rev. 2012, 140, 379–397. [Google Scholar] [CrossRef]
- Qian, J.H.; Tao, W.K.; Lau, K.M. Mechanisms for torrential rain associated with the Meiyu development during SCSMEX 1998. Mon. Weather Rev. 2004, 132, 3–27. [Google Scholar] [CrossRef]
- Yu, R.-C.; Zhou, T.J.; Xiong, A.Y.; Zhu, Y.J.; Li, J. Diurnal variations of summer precipitation over contiguous China. Geophys. Res. Lett. 2007, 34. [Google Scholar] [CrossRef]
- Zhou, T.-J.; Yu, R.; Chen, H.; Dai, A.; Pan, Y. Summer precipitation frequency, intensity, and diurnal cycle over China: A comparison of satellite data with rain gauge observations. J. Clim. 2008, 21, 3997–4010. [Google Scholar] [CrossRef]
- Chen, H.; Yu, R.; Li, J.; Yuan, W.; Zhou, T. Why nocturnal long-duration rainfall presents an eastward-delayed diurnal phase of rainfall down the Yangtze River valley. J. Clim. 2010, 23, 905–917. [Google Scholar] [CrossRef]
- Wilson, J.W.; Carbone, R. Nowcasting with Doppler Radar. The Forecaster-Computer Relationship; European Space Agency: Paris, France, 1984.
- Schreiber, W.E. Case study of thunderstorms initiated by radar observed convergence lines. Mon. Weather Rev. 1986, 114, 2256–2266. [Google Scholar] [CrossRef]
- Wilson, J.W.; Schreiber, W.E. Initiation of convective storms at radar-observed boundary-layer convergence lines. Mon. Weather Rev. 1986, 114, 2516–2536. [Google Scholar] [CrossRef]
- Karan, H.; Knupp, K. Radar and profiler analysis of colliding boundaries: A case study. Mon. Weather Rev. 2009, 137, 2203–2222. [Google Scholar] [CrossRef]
- Crook, N.A. Sensitivity of moist convection forced by boundary layer processes to low-level thermodynamic fields. Mon. Weather Rev. 1996, 124, 1767–1785. [Google Scholar] [CrossRef]
- Weckwerth, T.M.; Wilson, J.W.; Wakimoto, R.M. Thermodynamic variability within the convective boundary layer due to horizontal convective rolls. Mon. Weather Rev. 1996, 124, 769–784. [Google Scholar] [CrossRef]
- Wang, Q.-W.; Xue, M. Convective initiation on 19 June 2002 during IHOP: High-resolution simulations and analysis of the mesoscale structures and convection initiation. J. Geophys. Res. 2012, 117. [Google Scholar] [CrossRef]
- Ziegler, C.L.; Rasmussen, E.N. The initiation of moist convection at the dryline: Forecasting issues from a case study perspective. Weather Forecast. 1998, 13, 1106–1131. [Google Scholar] [CrossRef]
- Byers, H.R.; Braham, R.R. The Thunderstorm; U.S. Government Printing Office: Washington, DC, USA, 1949.
- Ulanski, S.L.; Garstang, M. The role of surface divergence and vorticity in the life cycle of convective rainfall. Part I: Observations and analysis. J. Atmos. Sci. 1978, 35, 1047–1062. [Google Scholar] [CrossRef]
- Garstang, M.; Cooper, H.J. The role of near surface outflow in maintaining convective activity. In Nowcasting: Mesoscale Observations and Short-Range Prediction; Battrick, B., Mort, J., Eds.; European Space Agency: Paris, France, 1981; Volume 165, p. 161. [Google Scholar]
- Purdom, J.F.W. Subjective Interpretations of Geostationary Satellite Data for Nowcasting; Academic Press: Cambridge, MA, USA, 1982. [Google Scholar]
- Weckwerth, T.M.; Parsons, D.B.; Koch, S.E.; Moore, J.A.; LeMone, M.A.; Demoz, B.B.; Flamant, C.; Geerts, B.; Wang, J.; Feltz, W.F. An overview of the International H2O Project (IHOP_2002) and some preliminary highlights. Bull. Am. Meteorol. Soc. 2004, 85, 253–277. [Google Scholar] [CrossRef]
- Emanuel, K.A. Atmospheric Convection; Oxford University Press: Oxford, UK, 1994. [Google Scholar]
- Mueller, C.K.; Carbone, R.E. Dynamics of a thunderstorm outflow. J. Atmos. Sci. 1987, 44, 1879–1898. [Google Scholar] [CrossRef]
- Lin, Y.-L.; Deal, R.L.; Kulie, M.S. Mechanisms of cell regeneration, development, and propagation within a two-dimensional multicell storm. J. Atmos. Sci. 1998, 55, 1867–1886. [Google Scholar] [CrossRef]
- May, P.T. Thermodynamic and vertical velocity structure of two gust fronts observed with a wind profiler/RASS during MCTEX. Mon. Weather Rev. 1999, 127, 1796–1807. [Google Scholar] [CrossRef]
- Weiss, C.C.; Bluestein, H.B. Airborne pseudo-dual Doppler analysis of a dryline–outflow boundary intersection. Mon. Weather Rev. 2002, 130, 1207–1226. [Google Scholar] [CrossRef]
- Brown, R.A. Longitudinal instabilities and secondary flows in the planetary boundary layer: A review. Rev. Geophys. Space Phys. 1980, 18, 683–697. [Google Scholar] [CrossRef]
- Etling, D.; Brown, R.A. Roll vortices in the planetary boundary layer: A review. Bound.-Layer Meteorol. 1993, 65, 215–248. [Google Scholar] [CrossRef]
- Xue, M.; Martin, W.J. A high-resolution modeling study of the 24 May 2002 case during IHOP. Part II: Horizontal convective rolls and convective initiation. Mon. Weather Rev. 2006, 134, 172–191. [Google Scholar] [CrossRef]
- Xue, M.; Martin, W.J. A high-resolution modeling study of the 24 May 2002 case during IHOP. Part I: Numerical simulation and general evolution of the dryline and convection. Mon. Weather Rev. 2006, 134, 149–171. [Google Scholar] [CrossRef]
- Weckwerth, T.M. The effect of small-scale moisture variability on thunderstorm initiation. Mon. Weather Rev. 2000, 128, 4017–4030. [Google Scholar] [CrossRef]
- Xue, M. Preface to the special issue on the “Observation, Prediction and Analysis of severe Convection of China” (OPACC) National“973” Project. Adv. Atmos. Sci. 2016, 33, 1099–1101. [Google Scholar] [CrossRef]
- Xue, M.; Droegemeier, K.K.; Wong, V. The Advanced Regional Prediction System (ARPS)—A multiscale nonhydrostatic atmospheric simulation and prediction tool. Part I: Model dynamics and verification. Meteorol. Atmos. Phys. 2000, 75, 161–193. [Google Scholar] [CrossRef]
- Lin, Y.-L.; Farley, R.D.; Orville, H.D. Bulk parameterization of the snow field in a cloud model. J. Clim. Appl. Meteorol. 1983, 22, 1065–1092. [Google Scholar] [CrossRef]
- Gao, J.-D.; Xue, M.; Brewster, K.; Droegemeier, K.K. A three dimensional variational data analysis method with recursive filter for Doppler radars. J. Atmos. Ocean. Technol. 2004, 21, 457–469. [Google Scholar] [CrossRef]
- Baidu Drive. Available online: https://pan.baidu.com/s/1NeyRYFPbVQeOH4pVUZ7LnA (passwd: 33gf) (accessed on 11 May 2018).
- Kain, J.S.; Coniglio, M.C.; Correia, J.; Clark, A.J.; Marsh, P.T.; Ziegler, C.L.; Lakshmanan, V.; Miller, S.D., Jr.; Dembek, S.R.; Weiss, S.J.; et al. A feasibility study for probabilistic convection initiation forecasts based on explicit numerical guidance. Bull. Am. Meteorol. Soc. 2013, 94, 1213–1225. [Google Scholar] [CrossRef]
- Wang, Q.; Xue, M.; Tan, Z.-M. Convective initiation by topographically induced convergence forcing over the Dabie Mountains on 24 June 2010. Adv. Atmos. Sci. 2016, 33, 1120–1136. [Google Scholar] [CrossRef]
- Banacos, P.C.; Schultz, D.M. The use of moisture flux convergence in forecasting convective initiation: Historical and operational perspectives. Weather Forecast. 2005, 20, 351–366. [Google Scholar] [CrossRef]
Figure 1.
Topography (shaded) of the model domain and the intensive automated weather stations (marked as hollow triangles). Relevant provinces are labeled.
Figure 1.
Topography (shaded) of the model domain and the intensive automated weather stations (marked as hollow triangles). Relevant provinces are labeled.

Figure 2.
Geopotential height (black contours, 10 m) and wind barbs (one full barb represents 4 m s−1) at 0000 UTC 12 July 2014, at (a) 250-, (b) 500-, (c) 700-, and (d) 850-hPa levels. Regions with wind speed greater than 20 m s−1 at 250 hPa, 15 m s−1 at 500 hPa, and 10 m s−1 at 700 hPa are color-shaded. The black body temperature (color-shaded, °C) in (d) can show regions of clouds or convection, and the Meiyu front is represented by 345-K contour of the equivalent potential temperature () (red dashed line). The red box marks the CI region.

Figure 3.
Observed composite reflectivity fields at (a) 0300, (b) 0318, (c) 0336, (d) 0354, (e) 0412, and (f) 0430 UTC 12 July 2014. A~D denote the initial four storms.
Figure 3.
Observed composite reflectivity fields at (a) 0300, (b) 0318, (c) 0336, (d) 0354, (e) 0412, and (f) 0430 UTC 12 July 2014. A~D denote the initial four storms.

Figure 4.
Forecast composite reflectivity fields and surface winds at (a–e) 0206, (b–f) 0230, (c–g) 0300, and (d–h) 0336 in no-DA (right column) and CTRL (left column). Relevant provinces are labeled in (a,e).
Figure 4.
Forecast composite reflectivity fields and surface winds at (a–e) 0206, (b–f) 0230, (c–g) 0300, and (d–h) 0336 in no-DA (right column) and CTRL (left column). Relevant provinces are labeled in (a,e).

Figure 5.
Surface temperature (shaded, °C) and winds (m s−1) at (a,c) 0200, and at (b,d) 0230 UTC 12 July 2014 in no-DA (right column) and in CTRL (left column); (e,f) present the differences of surface potential temperature (shaded, K) and wind fields between no-DA and CTRL.
Figure 5.
Surface temperature (shaded, °C) and winds (m s−1) at (a,c) 0200, and at (b,d) 0230 UTC 12 July 2014 in no-DA (right column) and in CTRL (left column); (e,f) present the differences of surface potential temperature (shaded, K) and wind fields between no-DA and CTRL.

Figure 6.
Composite reflectivity fields in observations (shaded) at (a) 0300, (b) 0318, (c) 0330, and (d) 0342 12 July 2014; and (e–h) the corresponding forecast composite reflectivity, together with surface wind vectors. Gust fronts are labeled as front lines. A~D denote the initial four storms.
Figure 6.
Composite reflectivity fields in observations (shaded) at (a) 0300, (b) 0318, (c) 0330, and (d) 0342 12 July 2014; and (e–h) the corresponding forecast composite reflectivity, together with surface wind vectors. Gust fronts are labeled as front lines. A~D denote the initial four storms.

Figure 7.
The surface convergence (color-shaded, amplified by 1000, s−1), surface temperature (pink contours, °C), 10 dBz composite reflectivity (red contours), and horizontal winds f (m s−1) at (a) 0200, (b) 0230, (c) 0300, and (d) 0330 UTC 12 July 2014. Cells (A, B, C, and D) are marked in the figures, and the front lines that label the gust fronts thick black lines (B1B2, C1C2, and D1D2, respectively, across B, C, and D) are the vertical cross sections shown in Figure 9.

Figure 8.
Moisture convergence at 30 m AGL (color-shaded, amplified by 1000, g kg−1 s−1) and the maximum cloud mixing ratio (orange contours, g kg−1) at (a) 0300, (b) 0318, and (c) 0330 UTC 12 July 2014; (d–f) The water vapor specific humidity (, color-shaded, g kg−1) and the vertical velocity (black contours, m s−1) at 1.2 MSL. Storm cells (A, B, C, and D) are marked.

Figure 9.
Vertical cross sections along lines (a,b) B2–B1, (c,d) C2–C1, and (e,f) D2–D1 in Figure 7 at 0100 (a,c,e) and the times of CI-B, CI-C, and CI-D (b,d,f). Plots are equivalent potential temperature (, color-shaded, K), water vapor-specific humidity (, black contours, g kg−1), and winds projected to the cross sections (vector unit shown in the plots, m s−1), and the 0.01 g kg−1 total condensed water outlining the clouds (pink contours). Double and single arrows, which, respectively, indicate the temperature front (analyzed mostly based on the temperature gradient) and the wind front, are located on the bottom axis of the plots.

Figure 10.
Skew-T plots of soundings at 0100 at the locations of (a) CI-B, (c) CI-C, and (e) CI-D and at (b) CI-B location at 0330; (d) CI-C location at 0300 and (f) CI-D location at 0330.
Figure 10.
Skew-T plots of soundings at 0100 at the locations of (a) CI-B, (c) CI-C, and (e) CI-D and at (b) CI-B location at 0330; (d) CI-C location at 0300 and (f) CI-D location at 0330.

Figure 11.
Horizontal (a–c) and vertical cross sections (d–f) of the moisture convergence s (color-shaded, values amplified by 1000, g kg−1 s−1), radar reflectivity (red contours, dBz), and winds (m s−1) at 0300 (a,d), 0312 (b,e), and 0330 (c,f) UTC 12 July 2014. Based on the initial updraft core of CI-B, an air parcel is initialized at its CI time (0330UTC). The vertical cross sections are plotted along its trajectory.

Figure 12.
The same as Figure 11, except for the initial updraft core of CI-C at 0300 UTC. Times are (a,d) 0212, (b,e) 0236, and (c,f) 0300 UTC 12 July 2014.
Figure 12.
The same as Figure 11, except for the initial updraft core of CI-C at 0300 UTC. Times are (a,d) 0212, (b,e) 0236, and (c,f) 0300 UTC 12 July 2014.

Figure 13.
The same as Figure 11, except for the initial updraft core of CI-D at 0330 UTC. Times are (a,d) 0300, (b,e) 0318, and (c,f) 0330 UTC 12 July 2014.
Figure 13.
The same as Figure 11, except for the initial updraft core of CI-D at 0330 UTC. Times are (a,d) 0300, (b,e) 0318, and (c,f) 0330 UTC 12 July 2014.

Figure 14.
The same fields with Figure 7 but with the surface heat flux turned off (nosflx) at (a) 0230, (b) 0300, and (c) 0330; (d–f) are the differences in the potential temperature (shaded, K) and winds of noslfx from CTRL.
Figure 14.
The same fields with Figure 7 but with the surface heat flux turned off (nosflx) at (a) 0230, (b) 0300, and (c) 0330; (d–f) are the differences in the potential temperature (shaded, K) and winds of noslfx from CTRL.

Figure 15.
The same as Figure 9b,d,f, except for (a,c,e) in the nosflx and (b,d,f) in the dry run.
Figure 15.
The same as Figure 9b,d,f, except for (a,c,e) in the nosflx and (b,d,f) in the dry run.

Figure 16.
The same as Figure 10d,f, except (a,c) in the nosflx and (b,d) in the dry run.
Figure 16.
The same as Figure 10d,f, except (a,c) in the nosflx and (b,d) in the dry run.

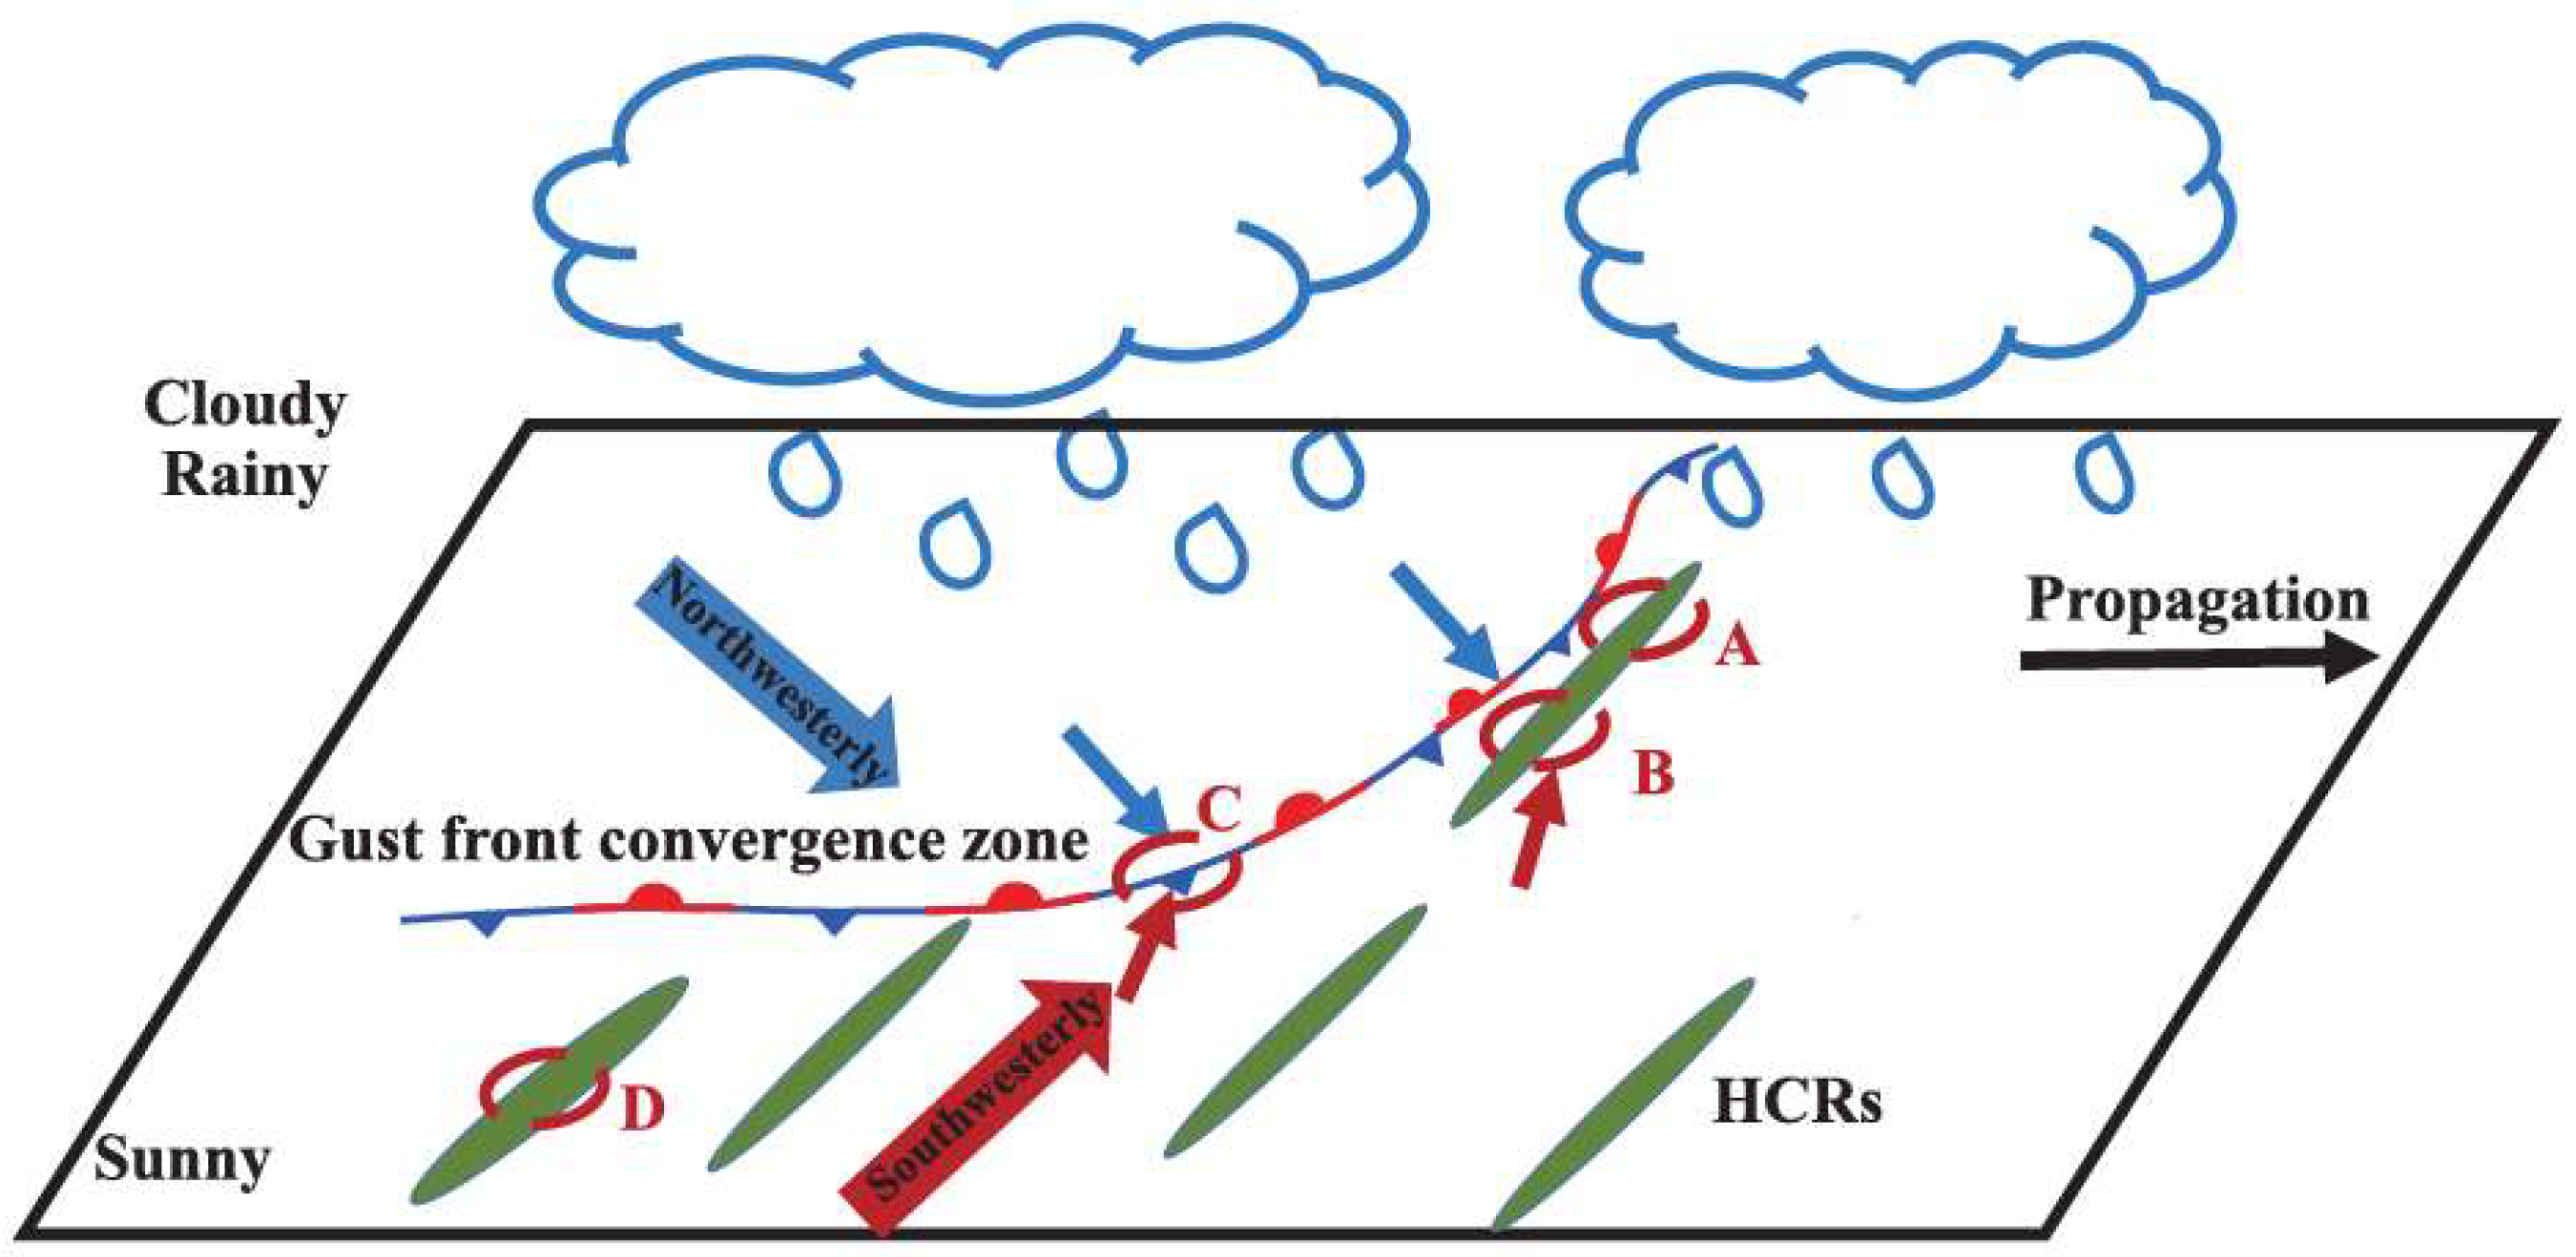
Figure 17.
A conceptual model of three typical initiations of convective cells associated with a squall line on the southern flank of a Meiyu front. The southeast propagation of the cold dome produced by existing frontal precipitation (clouds) brings along strengthened northwesterly flow (blue arrows). Combined with increased vertical mixing and southwesterly flow (red arrows), cell C is triggered directly over the gust front by enhanced frontal forcing. Even the frontal lifting provides additional forcing; the initiation locations of cell A and B are still determined by local maximum convergence over the adjacent BL HCRs (green ellipses). Cell D is mainly forced by HCR circulations, and therefore appears in clear air area to south of the gust front. See text for further details.

© 2018 by the authors. Licensee MDPI, Basel, Switzerland. This article is an open access article distributed under the terms and conditions of the Creative Commons Attribution (CC BY) license (http://creativecommons.org/licenses/by/4.0/).
Share and Cite
MDPI and ACS Style
Luo, X.; Xue, M.; Fei, J. Simulation and Analysis of the Initiation of a Squall Line within a Meiyu Frontal System in East China. Atmosphere 2018, 9, 183. https://doi.org/10.3390/atmos9050183
AMA Style
Luo X, Xue M, Fei J. Simulation and Analysis of the Initiation of a Squall Line within a Meiyu Frontal System in East China. Atmosphere. 2018; 9(5):183. https://doi.org/10.3390/atmos9050183
Chicago/Turabian StyleLuo, Xia, Ming Xue, and Jianfang Fei. 2018. "Simulation and Analysis of the Initiation of a Squall Line within a Meiyu Frontal System in East China" Atmosphere 9, no. 5: 183. https://doi.org/10.3390/atmos9050183
Note that from the first issue of 2016, this journal uses article numbers instead of page numbers. See further details here.