Comparative Analysis of Public Attitudes toward Nuclear Power Energy across 27 European Countries by Applying the Multilevel Model


1
Department of Public Administration, Honam University, 417, Eodeung-daero, Gwangsan-gu, Gwangju 62399, Korea
2
Department of Public Administration, Ajou University, Worldcup-ro, Suwon 16499, Korea
*
Author to whom correspondence should be addressed.
Sustainability 2018, 10(5), 1518; https://doi.org/10.3390/su10051518
Submission received: 15 February 2018
/
Revised: 7 May 2018
/
Accepted: 7 May 2018
/
Published: 10 May 2018
(This article belongs to the Section Energy Sustainability)
Abstract
:Despite its potential risks, nuclear power energy offers some economic benefits including cheap electricity. This benefit clarifies part of the reason why people support nuclear energy. Our research examined whether there was a difference in the acceptance of nuclear energy across 27 European countries in 2009, before the Fukushima accident. In particular, we analyzed how each factor at the individual and contextual level influences the acceptance. To answer this question, we set up the acceptance of nuclear energy as a dependent variable, and 5 perception variables at the individual level and 11 structural ones at the contextual level as independent variables. We executed multilevel modeling by using a Eurobarometer survey, which covered 27 European countries. The analysis results showed that at the individual level, the perceived benefit explained the largest variance of the acceptance, followed by perceived risk and trust. At the contextual level, the share of the energy supply by nuclear power, environmentalism and ideology influenced the acceptance of nuclear energy. This study shows that individuals’ acceptance of nuclear energy is based on individual beliefs and perceptions, but it is also influenced by the institutional and socio-cultural context which each country faces.
1. Introduction
After the Fukushima nuclear power plant accident, the nuclear power renaissance faded and European countries have taken different policy directions for nuclear energy. Until March 2011 when the accident occurred, Germany produced one-quarter of its electricity from nuclear energy by operating 17 reactors. Immediately after the accident, Germany shut down eight reactors. Then, the German government announced the vision of Energiewende, in other words, the energy transition plan. Germany planned to close its nuclear power plants and transform the energy system into one stressing renewable energy. In August 2017, 14% of Germany’s electricity came from eight reactors, while 43% of electricity was obtained from coal. The remaining nine reactors will be closed by the end of 2022. Moreover, Switzerland has generated up to 40% of its electricity by operating five nuclear reactors. After the Fukushima accident, the Swiss parliament decided in June 2011 to phase out nuclear power gradually. This decision was confirmed in a 2017 referendum. The Italian government had planned to have 25% of its electricity supplied by nuclear power by 2030. However, this plan was rejected in a referendum in June 2011. France, the largest net exporter of electricity in the world, operated 58 nuclear reactors through Electricité de France (EDF). In October 2014, the National Assembly passed the Energy Transition for Green Growth bill, which has a plan to reduce nuclear energy’s share of electricity from 75% to 50% by 2025 [1].
The above descriptions predict the nuclear energy downturn in Europe. However, the world remains heavily dependent on nuclear energy. According to IAEA [2], in December 2016, 448 reactors operated worldwide with a net capacity of 391,116 MW(e). Moreover, 61 reactors are under construction with a net capacity of 61,264 MW(e), supplying 894.9 TW(e)∙h electricity, and from 2011 to 2016, construction started on 33 reactors.
Furthermore, the UK, Hungary, and Slovakia recently revealed more favorable moves toward nuclear energy. The UK has operated 15 reactors, generating 21% of its electricity. In November 2015, the UK government expressed policy priorities for UK energy, including a much greater reliance on nuclear energy. In July 2017, the National Grid’s Future Energy Scenarios projected that new nuclear plants would generate 14.5 GW(e) by 2035 and 31% of the demand in 2050 would be supplied by nuclear energy [3]. Furthermore, Hungary has operated four nuclear reactors, which generated more than one-third of its electricity. The government had plans to increase nuclear energy’s share of electricity by 60%. Four nuclear reactors have generated half of Slovakia’s electricity. Two further reactors are under construction [1].
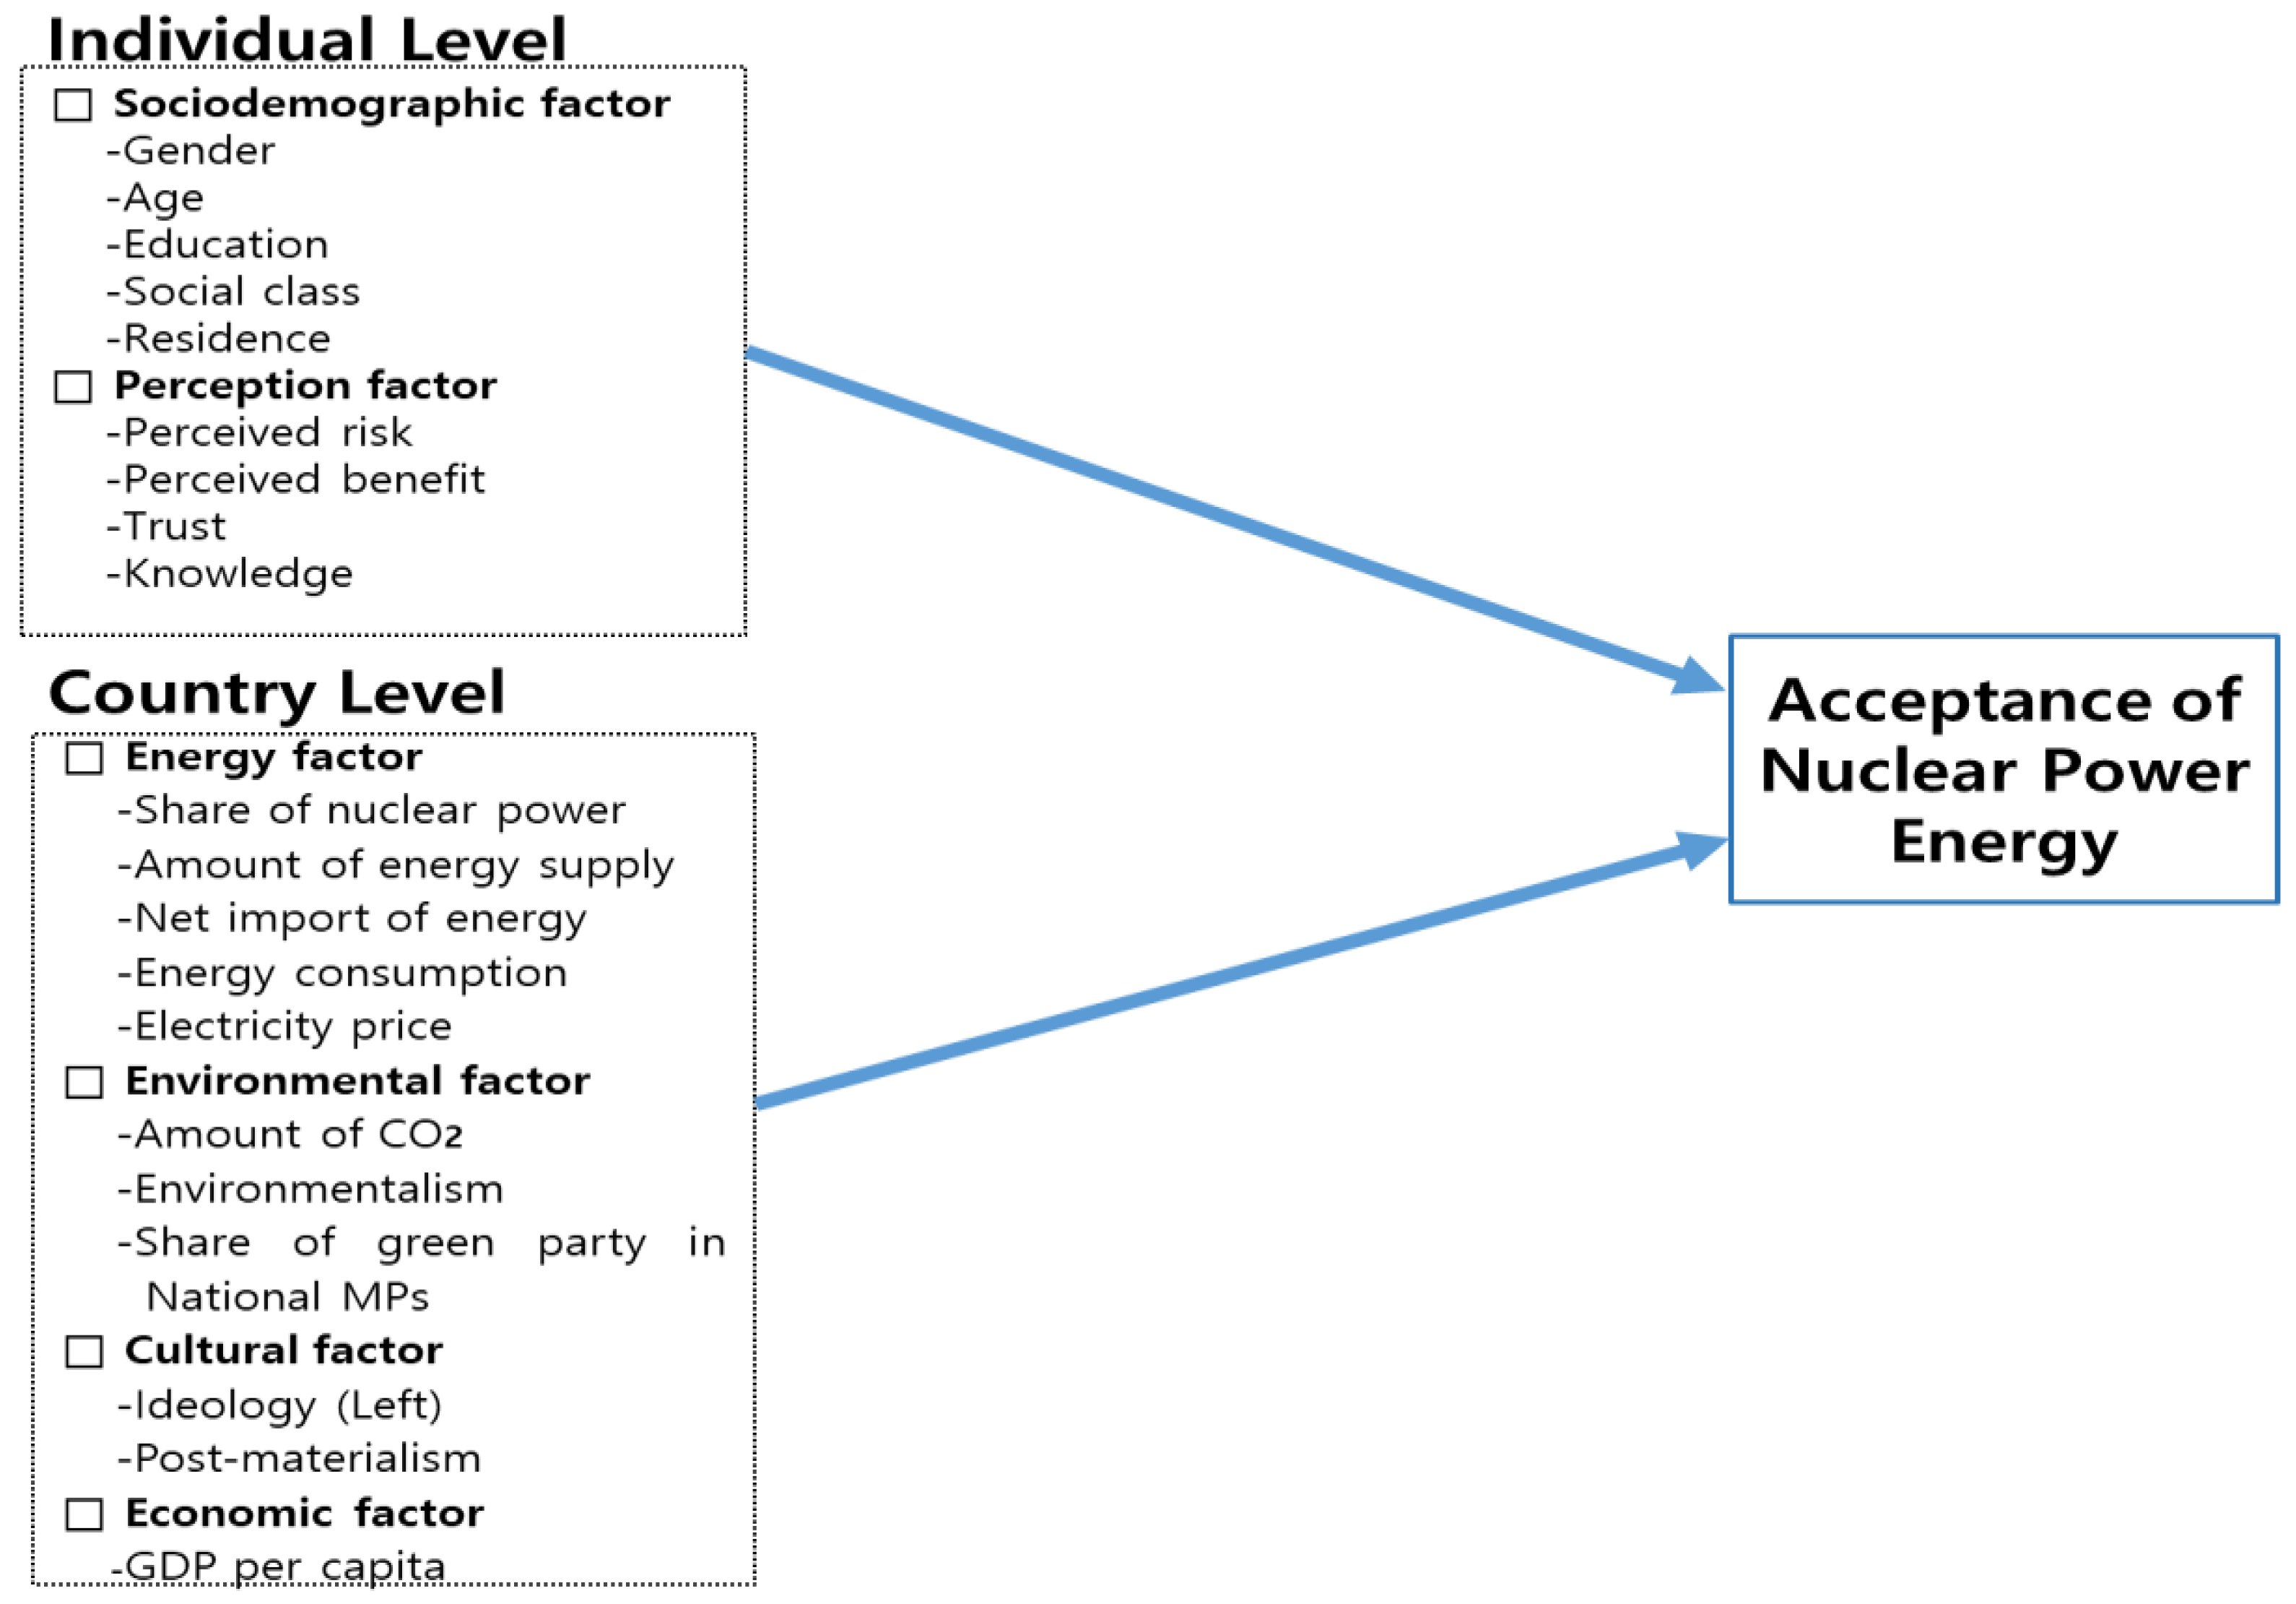
Since the change in energy policy depends on the public’s attitude toward nuclear energy, to know the structure of acceptance of nuclear energy and its determinant is very important for research themes. Our research question is to ask how each factor at the individual and contextual level influences the acceptance of nuclear energy. Mainly based on a Eurobarometer survey, this study will comparatively analyze the public’s attitude toward nuclear energy and its determinants across 27 countries. For this task, we set up the acceptance of nuclear energy as a dependent variable and, as independent ones, the perception factor (4 variables) at the individual level and 4 contextual factors (11 variables) at the country level. In particular, we focused on comparing the power of determinants between the individual and country levels. Although not only individual-level perceptions but also country-level contextual structures play a role in influencing people’s acceptance of nuclear energy, they do not always change energy policies according to the country context.
The next research model in Figure 1 shows the factors and variables related to the acceptance of nuclear energy across 27 European countries.
2. Theoretical Background
2.1. Acceptance of Nuclear Energy
Studies about the acceptance of nuclear energy are divided into two streams: individual-level research studies versus country-level ones.
At the individual level, many studies about peoples’ attitudes toward nuclear energy have focused on the risk perception toward nuclear power energy, despite the survey data revealing the existence of visible cross-country variations in attitudes [4]. Those studies mainly analyzed individual attitudes within the country that is regarded as a given context, not a viable predictor. Kim et al. [5] examined how individual-level variables such as knowledge, trust, risk, and benefit were related to the public acceptance of nuclear energy across 19 countries. After comparing attitudinal positions of three samples at the individual level from Germany, Japan, and the Philippines, Swaton and Renn [6] revealed that Japanese respondents were most in favor of nuclear energy, followed by German ones and Filipino ones. Moreover, Peters et al. [7] demonstrated that worldviews and affect-laden imagery contribute independently in explaining the support for nuclear power. Slovic et al. [8] showed that the French public and the American public generally regarded nuclear power as a serious risk. However, since the French public perceived a greater economic benefit from nuclear power and had higher levels of trust in experts, government, and science, they were slightly more likely to support nuclear energy.
Such individual-level analyses have demonstrated the micro-foundation of attitude and its structure related to nuclear energy. However, since they are heavily depended on methodological individualism in which individual perception was merely regarded as a byproduct of an individual’s rational thinking or perception, they did not fully consider the significant role of the structural factors, for example, the country or neighborhood, or contextual variables, such as national economic welfare and social capital [9].
Recently, several studies show the significance of macro-level variables. For example, Wiegman et al. [10] compared France, maintaining the highest density of nuclear power plants in Europe, with the Netherlands, with one of the lowest. They showed that the French had a higher risk perception and a more negative attitude toward nuclear power than the Dutch did. To explain national nuclear divergence, technological capacity, and consumption in Europe’s “energy union”, Lawrence et al. [11] specified five factors, such as capacity and consumption; economic cost; security and materiality; political, ideological, and institutional factors; and national perception. They argued that those macro-factors raised the path dependence that each country took.
Although those studies demonstrated the significant role of contextual or institutional variables at the country level, they dismissed the significant role of individuals’ perceptions as a causal factor to influence the acceptance of nuclear energy.
In short, since each research wave has both advantages and weaknesses, a more comprehensive framework is needed to include the variables that each approach has focused on. In this vein, we include both the perception factor and contextual one in each model by applying multilevel modeling.
2.2. Perception Factor at the Individual Level
In risk studies, the psychometric paradigm is the dominant approach. Paul Slovic and his colleagues proposed the psychometric paradigm (that is, the risk perception paradigm) that regards risk as a subjective construct, not an objective one [12]. This paradigm has focused on perceived risk, perceived benefit, trust, and knowledge in the acceptance of nuclear power.
First, the perceived benefit and risk are key variables that explain an individual’s risk judgments [13]. Perceived risk and benefit are paired variables to explain the acceptance of nuclear power in terms of the opposite direction [14]. There are both benefits and risks to a nuclear power station. The benefit is the cheaper price of electricity. However, the tradeoff to such a benefit is the risk. The main risk of nuclear power is the fear of probable disaster, not the objective probability of an accident breaking out. The objective probability of accidents occurring in nuclear power generation is very low. After June 1954, when Russia launched the commercial nuclear power plant in Obninsk, the first nuclear power plant in the world, three accidents have occurred: the Three Mile Island accident in 1979, Pennsylvania, United States; the Chernobyl disaster in 1986, USSR; and the 2011 Fukushima nuclear accident, Fukushima, Japan. The perceived risk induces antinuclear sentiment.
According to Vainio et al. [15] (2017), the higher perceived risk decreases the acceptance of nuclear power as a way to mitigate climate change. In terms of benefit, the operational experience with nuclear power plants can help a country create a well-designed emergency response system for nuclear plant accidents [5] (p. 823). After comparing the Netherlands and France, Wiegman et al. [10] demonstrated that higher perceived risks and lower benefits in the former lead to the lower acceptance of nuclear energy than those in the latter. According to Kim et al. [16], supplying electricity by nuclear energy influences acceptance of nuclear power. Moreover, Tanaka [17] demonstrated that the effect of the perceived benefit and risk of acceptance can vary according to different contexts. In a general situation, the perceived risk and perceived benefit are key factors for the public acceptance of nuclear power. However, in a citing situation, the former is more important for the public acceptance of nuclear facilities than the latter is.
Nevertheless, such benefit and risk effects vary indirectly rather than directly with those who are subject. According to De Groot and Steg [18], beliefs in the risks and benefits of nuclear energy were less powerful for supporters in explaining the variance of personal norms (PN) and willingness to take action than for opponents.
Second, trust is closely related to risk perception and the acceptance of nuclear power. By examining the attitude change after the Fukushima accident, Kim et al. [5] indicated that trust is effective in shifting public attitudes from opposition to reluctant acceptance. Regardless of how the countries are grouped, trust in inspection authorities is crucial for the decision to accept nuclear power.
The degree of trust critically depends on which object people place trust in. The generally targeted object of trust is the government. Flynn et al. [19] (1992) showed that the lack of trust in the government results in higher perceptions of risks and lower perceptions of the benefits of nuclear power. Moreover, the effect of trust on acceptance varies according to the countries: trust in the inspection authorities is more important in countries with a low level of reluctant acceptance and a high level of strong acceptance [4]. According to Vainio et al. [13], not only trust itself but also the kind of trust that influences the acceptance of nuclear power such as the trust in ministries, research institutes, and nuclear energy companies, let people regard nuclear power as a solution for climate change. Moreover, on the basis of a nationwide survey (N = 967) conducted in Finland, Vainio et al. [13] show that trust in different information sources brings out its variant degree. The trust in NGOs decreases the belief in nuclear power as an acceptable way to mitigate climate change, whereas trust in ministries, research institutes, and nuclear energy companies increases it.
Third, knowledge plays a role in reducing the perceived risk of nuclear energy, which finally increases its acceptance. Sjöberg and Drottz-Sjöberg [20] empirically showed that power plant workers who had less knowledge of radiation risks perceived higher levels of risk. In the UK, Costa-Font et al. [21] demonstrated that the perception of not being informed about knowledge influences the acceptance of nuclear power stations: the former decreases it, whereas the latter increases it. According to Kim et al. [5], knowledge about nuclear inspection is a more critical factor than trust in inspection authorities in case of creating stronger public acceptance. Such patterns were well observed in the countries with a high level of reluctant acceptance and a low level of strong acceptance. Jäckle and Bauschke [4] showed that knowledge plays a significant role in increasing acceptance of nuclear power. After examining the influence of assessed and perceived knowledge on public risk perceptions, Stoutenborough and Vedlitz [22] showed that those who had more assessed knowledge showed less risk evaluation toward a nuclear meltdown. However, the perceived knowledge, a less reliable predictor, increases the perceived risk of nuclear power.
On the other hand, people generally have less knowledge about nuclear energy. A remarkable discrepancy between professed and actual knowledge of nuclear issues exists: few respondents knew that the EU had the largest number of NPPs in the world [23] (p. 53).
2.3. Contextual Factor at the Country Level
Each country goes under the contextual factor by which all of its people were influenced. We focused on four variables, energy, environment, political, and economic factors, as contextual variables. This selection depends not only on the theoretical bases but also on the availability of data that are used for our analysis.
First, the energy factor is related to the energy situations that each country faces. The necessity of nuclear energy is generally judged in terms of the supply and demand of energy. On the supply side, despite the possible risk of nuclear power, it has an advantage in terms of energy security, meaning energy security can be defined as a reliable and uninterrupted supply of energy at a reasonable price sufficient to meet the needs of the economy at the same time [24]. Pampel [25] demonstrated that the presence of operating nuclear power plants in a country led to higher public support for nuclear power. According to Kim et al. [16], the country’s level of dependence on nuclear energy for electricity is an important factor in influencing its accumulated acceptance of nuclear power. They showed that regardless of the Fukushima accident, the number and density of nuclear power reactors, the proportion of nuclear energy, and the history of operating experience of nuclear power generation increased the acceptance of nuclear power.
Moreover, on the supply side, the amount of energy supply and imported energy is critical for energy security. Insecure energy supply increases support for nuclear energy. Those who are more concerned about the country’s energy situation, for example, an energy shortage, are likely to believe that there is a higher risk of meltdown from a nuclear power [22]. According to Corner et al. [26], people who expressed concern about energy security were less likely to favor nuclear power. On the basis of energy security and metrics, Jun et al. [27] indicated that nuclear energy is the most competitive energy source in terms of energy security in Korea because of its balanced supply and demand, relatively stable price, and high abundance. Our study focused on the net amount of energy imported and amount of energy supplied among the energy security factors. If countries are heavily dependent on imported energy, they are likely to feel the instability of energy supply. In addition, if the supply exceeds the countries’ capacity, the countries would want to have more effective energy generation, such as nuclear power, for the sake of satisfying the energy demand that is too high.
On the demand side, electricity consumption is a key factor in making the decision over whether or not a country depends on nuclear energy. Lawrence et al. [11] explained that those countries that built nuclear power stations had experienced a wave of consumption growth of at least 50% (and sometimes 100–200%) higher than the average electricity growth rate for the subsequent three to four decades. If built, nuclear power plants had a path-dependent influence on the following trajectory of energy policy. Moreover, consumers are always sensitive to the energy price, which is closely connected with the cost of electricity generation. Choi [28] demonstrated that the cost that the people should carry has an impact on the acceptance of not only nuclear energy but also fossil and renewable energy.
Second, environmental factors are related to recent issues of environmentalism and climate change. It is generally accepted that environmentalism has a negative impact on the acceptance of nuclear energy. In empirical studies, those who are more concerned about the environment tend to believe that there is a higher risk of meltdown from nuclear power [21]. According to Spence et al. [29], environmental concern not only decreased the support for nuclear energy but also moderated the negative relationship between the concern about climate change and evaluations of nuclear power. Pampel [25] demonstrated that those countries that give priority to protecting the environment appeared less favorable to nuclear energy, relative to renewable or fossil energy. Moreover, environmentalism is closely connected with support for a political party. Green Party supporters will oppose nuclear energy. In a Finnish study, Green Party supporters did not perceive nuclear power as an acceptable way to mitigate climate change [15]. Successful nuclear developments often depend on a society’s low levels of civic activism [11]. However, higher scores in the New Environmental Paradigm (NEP) correlated with slightly more positive attitudes toward nuclear energy [30].
There are heated debates over the role of nuclear energy in climate change. Nuclear energy has been regarded as an environmentally friendly energy source because of its lower level of carbon emissions in power generation than fossil fuels. Therefore, concern for climate change and support for nuclear power are closely related. According to Corner et al. [26], people who expressed worry about climate change and possessed higher environmental values were less likely to favor nuclear power. In Finland, those who were concerned with climate change did not think that nuclear power was an acceptable way to mitigate climate change [15]. According to Spence et al. [29], despite stressing nuclear power as a low-carbon electricity source, people who are generally concerned about climate change tend to perceive nuclear energy negatively, believing that nuclear power does not help to mitigate climate change. Pampel [25] also showed that if those countries stressed fighting global warming as an energy policy goal, they were less favorable toward nuclear energy.
Third, a cultural factor is the invisible hand to influence public attitudes. Out of various cultural factors, we focused on ideology and post-materialism.
Ideology is one of the heuristic cues that individuals used in making judgments. Those who were more liberal were more negative toward nuclear energy [30]. According to Costa-Font et al.’s [21] survey, studies on the UK population showed that 40.1% of leftists favored nuclear power, whereas 59.5% of right-wingers did. On the other hand, 50.0% of the first group opposed nuclear power, whereas 28.3% of the latter group did so. Rothman and Lichter [31] explained that the more progressive environmental movement in the 1960s and 1970s led to declining public support for nuclear energy.
Post-materialism is one of the new value orientations to have an impact on risk judgment. Inglehart [32] and Abramson and Inglehart [33] showed that because of different social-historical experience, the younger generation possesses the new value orientation, so-called post-materialism, that differs from that of the old. Post-materialists place less value on, for example, economic development or social authority than on, for example, the environment, the women’s movement, and the peace movement. Nations with post-materialistic self-expression values exhibit stronger political division over nuclear energy [25].
The final factor is an economic one. Economic wealth has a negative effect on the acceptance of nuclear power. Pampel [25] explained that most national variables related to economic development, for example, high income, reduce support for nuclear energy since people can better afford to invest in expensive but safer renewable sources. Moreover, Kim et al. [16] demonstrated that higher-income nations turned against nuclear power after the Fukushima accident. Kim et al. [5] (p. 47) explained that if people who live in more advanced (rich) countries have more experience in the hazards coming from newly developed science and technology, they may show less support for nuclear power energy as one of the advanced technologies.
3. Data and Measures
To answer the research question, we analyzed the survey data of Eurobarometer 72.2 [34]. This survey was carried out between 11 September and 5 October 2009. Samples were selected by the multistage national probability sampling method. The subtitle of this survey is ‘Nuclear Energy, Corruption, Gender Equality, Healthcare, and Civil Protection’. The survey consists of approximately 1000 face-to-face interviews per country. The interviews were executed by professional interviewers employed by the survey company. The main measures at the individual level are shown in Table 1.
Our study defined the acceptance in terms of the individual level; acceptance means the support for the increment of nuclear power energy. We used four factors consisting of 11 predictors at the country level. Among the energy factors, data on the share of nuclear power is obtained from the IAEA [35]. The amount of the energy supply (that is, TPES (total primary energy supply, unit: toe)/GDP (2000 USD)), net import of energy (unit: Mtoe), amount of CO2 (that is, CO2/pop., unit: tCO2/capita), and energy consumption (that is, Elec.Cons./pop., unit: kWh/capita) came from the World Energy Agency [36] (2009). We retrieved the data on electricity prices (unit: kWh per capita) from Eurostat [37]. The reference year for all data is 2009.
Environmentalism and ideology come from the European Value Survey (EVS, 2008, Q85, Q58). Post-materialism is collected from Eurobarometer 63.1 [38]. This survey was conducted in 2005 and examined social values on science and technology. Individual interviews were conducted with people from 27 European countries, such as Eurobarometer 72.2. Our study refers to the Europe Parliament [39] for information on the Green Party share of national MPs. GDP per capita (current USD) was retrieved from the World Bank [40].
4. Analysis and Findings
4.1. The Difference of Acceptance across Countries
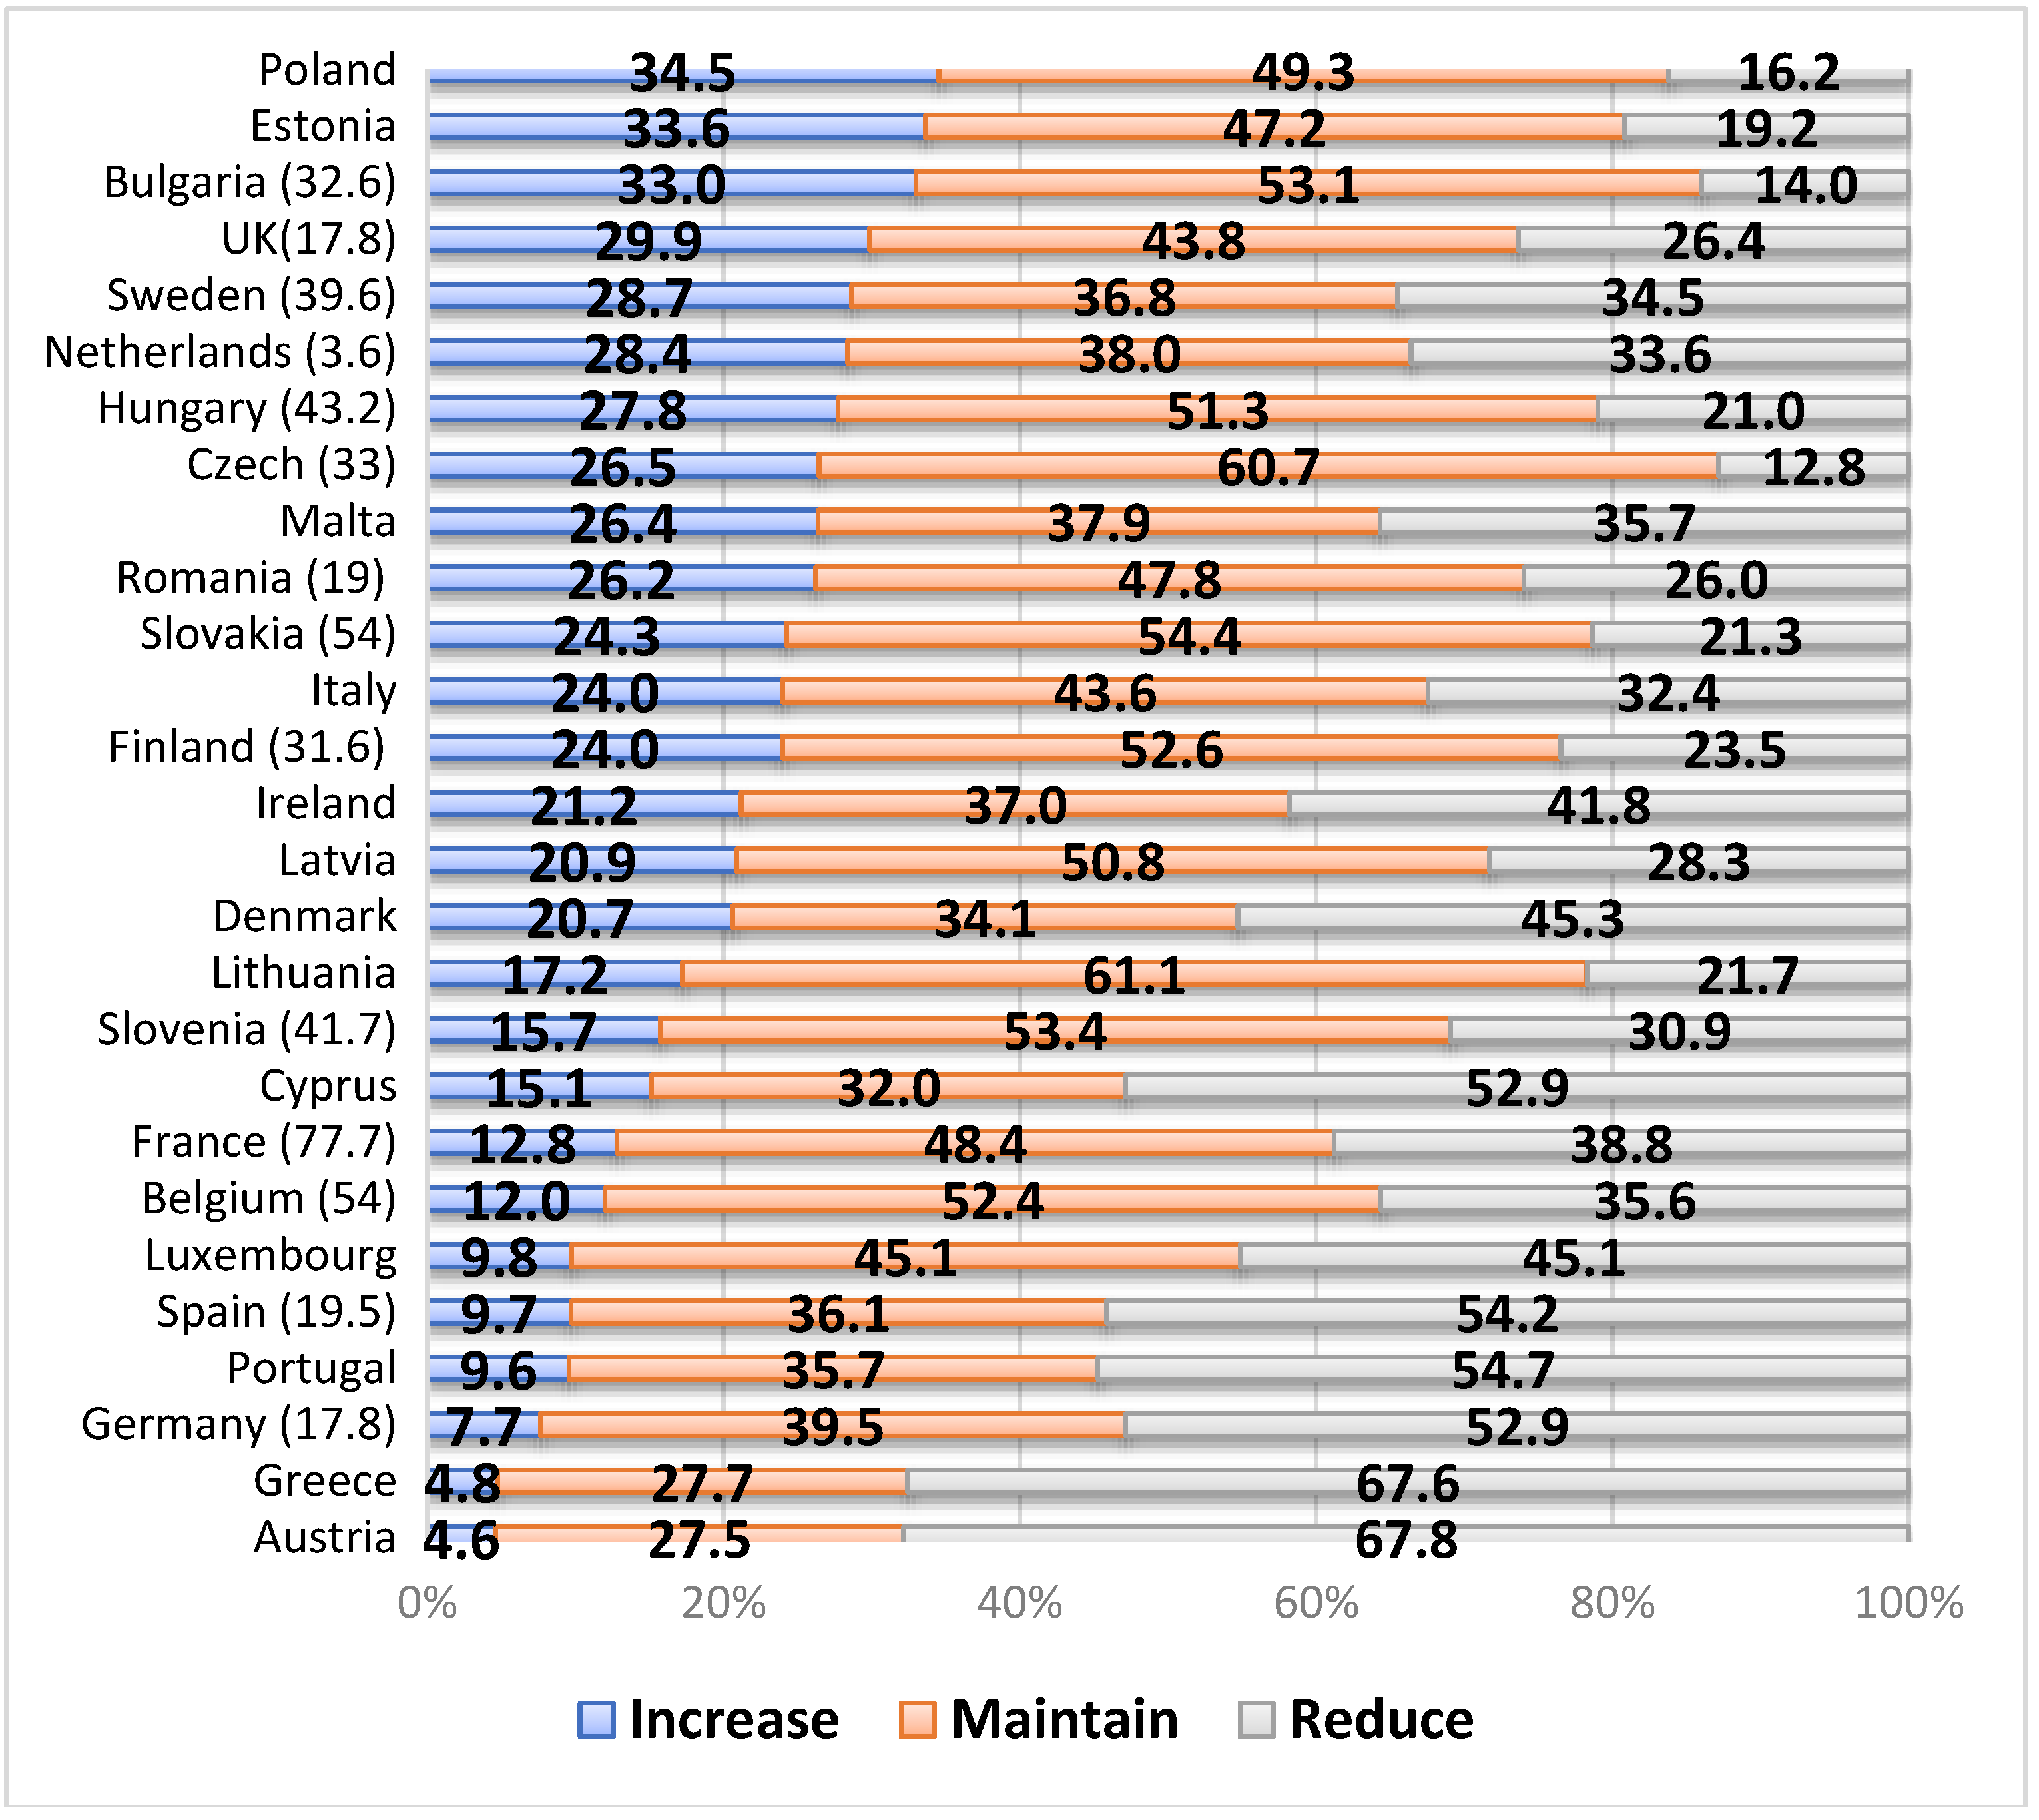
From the question about reduced, maintained, and increased nuclear energy (QA150), we derived Figure 2. We defined “reduced” as rejection, “increased” as acceptance, and “maintained” as no-preference. Among the 23,671 respondents, 34.3% supported the reduction of nuclear power, 44.6% said “maintained”, and 20.0% said “increased.” It is noticeable that the neutral respondents who support maintaining the present level of nuclear power are the largest percentage. There are variations across countries. Figure 2 shows the different responses to the acceptance of nuclear energy. Respondents’ support (percentage of increase) for nuclear energy varies from country to country: 34.5% in Poland, followed by 33.6% in Estonia, and 33.0% in Bulgaria. However, a small portion of respondents, such as 4.6% in Austria, followed by 4.8% in Greece and 7.7% in Germany, declared their support for nuclear power. In terms of opposition, 67.8% in Austria, followed by 67.6% in Greece and 54.7% in Portugal, support the reduction of nuclear power, whereas 12.8% in the Czech Republic, followed by 14.0% in Bulgaria and 16.2% in Poland, do so. On maintaining the present state, 61.1% in Lithuania, 60.7% in the Czech Republic, and 54.4% in Slovakia agree, whereas 27% in Austria, 27.7% in Greece, and 32.0% in Cyprus disagree.
From Figure 2, we find several noticeable points. First, compared to the increase or decrease, many respondents across countries show a neutral attitude toward nuclear power. In particular, most respondents in former communist countries, for example, Lithuania (61.1%), the Czech Republic (60.7%), Slovakia (54.4%), Slovenia (53.4%), and Bulgaria (53.1%), show a neutral attitude. Second, some countries show a more determined opposition to nuclear power. For example, more than half in Austria (67.8%) and Greece (67.6%) disagree with the increase in nuclear power. Third, the dependence on nuclear power at the time of the data set survey seems to influence the attitude toward it. In Figure 2, the amount in parentheses next to a country’s name is the share of electricity produced by nuclear energy. Although France gets 77.7% of electricity from nuclear energy, 38.8% of respondents agree with the reduction, whereas 12.8% of them agree with the increase. On the other hand, even though Poland does not have nuclear power stations, 34.5% of respondents agree with more nuclear power, whereas 16.2% disagree with it. Such findings imply that the dependence on nuclear power does not make the path dependence by which nuclear energy could gain legitimacy for building more nuclear power stations.
4.2. Individual-Level Analysis
To compare the explanatory power of determinants for acceptance of nuclear power, we regressed it on the sociodemographic variables—gender, age, education, social class—and the perception variables—perceived risk, perceived benefit, trust, and information—which have usually been examined by the psychometric paradigm. The analysis results appear in Table 2.
From the whole model in Table 2, we know that five sociodemographic variables show a significant impact on the acceptance of nuclear power. Age and education have a positive impact on acceptance, whereas gender, social class, and residence have a negative impact on it. As people become older, they reveal more positive attitude toward nuclear power. Such an older-age effect confirmed the research findings by Slovic et al. [8]. Enlightenment from education increases support for nuclear power. According to Kim et al. [16], higher education brings out more acceptance. Women are not as accepting of nuclear power as men are. Kim et al. [16] showed that men tend to accept nuclear power, regardless of the Fukushima accident. Moreover, the men perceive nuclear power as an acceptable way to mitigate climate change more than the women [15]. Solomon et al. [41] explained that the gender gap can be traced back to women’s propensity to rationally process negative information about nuclear power. The perceived higher social class reduces the support for nuclear power. This confirmed Pampel’s [25] finding that at the individual level, a high socioeconomic status tends to increase the support for nuclear energy. Previous residence in an area close (within a 50-km radius) to a nuclear power plant decreased in their acceptance of nuclear power. Jäckle and Bauschke [4] demonstrated the negative impact of geographic distance to the nearest nuclear power plant.
In the psychometric variables, the perceived risk reduces the acceptance of nuclear power, whereas the perceived benefit, trust, and knowledge increase it. On the basis of standardized regression coefficients, trust is the foremost variable to explain the variance of acceptance, followed by perceived benefit, perceived risk 1, and perceived risk 2. Those five variables are included in the psychometric paradigm. However, five sociodemographic predictors possess weak explanatory power. These findings imply that the acceptance of nuclear power is more a byproduct of perception than that of social structure.
In the whole model, it is noticeable that two kinds of perceived risks, in other words, the threat to person or family and relative risks of nuclear energy, have different impacts on acceptance. On the basis of a standardized regression coefficient, the first has a larger negative effect on acceptance than the latter does. It implies that the risk that influences personal lives has more of an impact on acceptance than that based on respondents’ comparative judgment.
Across 27 countries, we discover the following five remarkable points. First, the significance of predictors changes across countries. In the whole model, all of the independent variables show a statistically significant impact on the acceptance of nuclear power. However, among 27 countries, 14 in gender, 11 in age, 3 in education, 6 in social class, and 3 in residence show significant influence. Gender seems to have a more generalized effect on acceptance than other sociodemographic variables.
Among psychometric paradigms, the perceived benefit has a positive impact on acceptance across 26 countries, the one exception being Austria. The perceived risk 1 had a significant effect on 24 countries, whereas the perceived risk 2 did in 18 ones. The trust shows statistical significance in 23 countries. However, knowledge takes effect only in eight countries. The perceived benefit and risk have more generalized explanatory power across countries.
Second, when we examined the direction of the predictors’ impact on the acceptance across countries, the age, education, social class, residence, and knowledge show a contrasting effect. Age generally had a positive impact on the acceptance except for Greece in which older people show a more negative attitude toward nuclear power than younger persons. Education increases acceptance in the UK and the Netherlands, whereas it decreases acceptance in France. Moreover, higher social class increases the acceptance of nuclear power in Ireland and the Netherlands, whereas it decreases acceptance in Bulgaria, Luxembourg, Malta, and Romania. Residence near a nuclear power station increases acceptance in Portugal and decreases acceptance in Estonia and Poland. Finally, although knowledge generally increases acceptance, it decreases acceptance in the Netherlands.
Third, viewed from the size of the standardized beta-coefficients, the perceived benefit has the largest explanatory power in 12 countries, whereas the perceived risk has in 5 countries. Moreover, trust has the strongest impact on acceptance in 10 countries. Generally, the big-three variables, such as perceived risk, benefit, and trust, ranked from first to third, explaining the large variance of the acceptance across 27 countries. However, exceptionally, gender ranked second in Cyprus and Estonia, and ranked third in Latvia, Malta, and Poland.
Fourth, to compare the explanatory power between sociodemographic and psychometric factors, we get two adjusted R2 values, which are calculated by regression analyses for each of Model 1 (five sociodemographic variables) and Model 2 (five psychometric ones) (see the last three rows in Table 2). Model 1 shows values from 0.1% (the smallest) in Luxembourg to 7.8% (the largest) in the UK, whereas Model 2 shows values from 37.0% in Ireland to 9.7% in Lithuania. This confirms that the psychometric factor is more important than the sociodemographic one. This fact is also confirmed when we check the R2 change, which ranges from 36.7% in Germany to 9.1% in Lithuania. However, the adjusted R2 of the psychometric factors based on Model 2 is more than 20% in 22 countries, compared to less than 20% in five countries. This suggested that the psychometric factor’s impact on acceptance can vary with countries.
Fifth, to judge the explanatory power of the present model based on 10 variables, we compared R² across 27 countries. Finland shows the highest value at 39.0%, followed by Germany at 37.2%, and 37.1% in the Netherlands. However, Lithuania has the lowest value at 11.3%, followed by Romania at 12.0% and 18.1% in Hungary. Those three countries shared a history of communism.
In short, from the regression analysis, several generalizable rules were found. First, the perceived risks, benefit, and trust are key variables in explaining the social acceptance of nuclear power across countries. Among the sociodemographic variables, only gender shows a more effective role in the acceptance of nuclear power. Second, the explanatory power of the present models based on the 10 variables differs across countries, with R² ranging from 39.0% to 11.3%. Third, viewed from the adjusted R2 and R2 change, the psychometric factors explain the large degree of variance of acceptance.
4.3. Country-Level Analysis
To examine which contextual factors influence the acceptance of nuclear power across 27 countries at the country level, we executed the regression analysis. For this analysis, we aggregated the data for five perception variables that were used in the regression in Table 2 and collected the hard data for 11 variables that were not adopted at individual-level analyses. Therefore, the data consisted of 27 cases.
In Table 3, Model 1 shows the impact of perception on acceptance. Only trust influences acceptance. Model 2 reveals the positive impact of the share of nuclear power, amount of energy supply, and the negative effect of environmentalism and ideology (left) on acceptance.
The amount of energy supply is the factor that explains the largest variation of acceptance at the country level, followed by environmentalism, and ideology. It is noticeable that both objective variables, for example, the supply of energy, and subjective ones, for example, environmentalism, influence the acceptance of nuclear power. This means that the acceptance depends not only on the objective contextual factors that countries face, but also on subjective ones that people socially constructed.
Although Model 3 explained the large variance of acceptance at the aggregate level, 74.0%, there is only one significant independent variable, that is, ideology. This result confirmed Jäckle and Bauschke’s [4] finding that ideology as a self-placement on a political scale showed an impact on attitude toward nuclear energy. Few significant variables in Model 3 might come from the small data set; 17 independent variables do not give a sufficient degree of freedom for model specification. If we add more cases to the data set, there might be more significant independent variables.
4.4. Multilevel Analysis
To compare the impact from individual factors and contextual ones on the acceptance of nuclear power in one analytic model, we execute multilevel modeling. Based on the use of Restricted Maximum Likelihood (REML), Table 4 indicates the output of multilevel modeling, in other words, the coefficients, (co)variance parameter, and fit index. REML provides more accurate variance estimates in the case of smaller sample sizes, especially when the number of estimated parameters increases [42]. As shown in Table 4, our study constructs four multilevel models, each of which has its own reason as a model.
Model 1 is an unconstrained null model, in other words, an unconditional means model [43]. This model was mainly applied to compute the proportion of variance in dependent variables (for example, in our model, the level of acceptance of nuclear energy) that exists among second-level units (for example, in our model, the countries) [44].
To analyze any nested data set, we first check whether or not the data sets are appropriate for executing multilevel modeling. If there is sufficient variance at level 2, in other words, the country level in our study, it is possible to do a further step for multilevel analysis. Unconditional Model 1 calculates the intra-class correlation coefficient (ICC), which compares the variance between level 1 and level 2.
The third column in Table 4 presents the output from unconditional mean modeling. The estimate for the grand mean of acceptance of nuclear power is 1.842. The variance within countries, 0.474, and between countries, 0.054, appears statistically significant. The first is much larger than the second level. The Wald Z test for variance at the country level is statistically significant (Wald Z = 3.703, p-value < 0.01). This means that there is sufficient variation across countries for the acceptance of nuclear power. Furthermore, to judge the significant variance of acceptance across countries, we calculate ICC—in other words, a composite measure of intra-observer and inter-observer variability—that is used to judge the existence of systematic differences. If ICC has a value that is more than zero, there is some variation in the acceptance across countries at level 2. In Model 1, ICC was 0.102 (0.054/[0.474 + 0.054]); the context effect that occurred across countries at level 2 explains 10.02% of variance in the acceptance of nuclear power. Since Muthén [45] argued an ICC of 5% as the threshold value for stratifying the statistical standard, in the present model, 10.02% of the variance is sufficiently beyond this reference point.
Model 2 is a random intercept model, which was adapted to know the increase of explanation by putting the covariate at level 2 into the null model. It indicates the significant role of contextual variables in explaining the unexplained variance. We input 11 covariate variables at level 2 to Model 1. In Model 2, we examine whether or not 11 contextual variables are fixed factors and not random ones, significantly influencing the mean of the acceptance of nuclear power. To know the significant contribution of the contextual variables, after excluding the variance of the individual level, in explaining the acceptance of nuclear power, we check the significance of two variances and the amount of change in the decrease of residuals when contextual variables are added to Model 1. In Model 2, in the fourth column in Table 4, two variances appear statistically significant. When three contextual variables were added to Model 1, the residual variance of acceptance of nuclear power decreased by 96.5% ([0.055 − 0.019]/0.055). This means that contextual variables make a significant contribution to decreasing the unexplained variance in the acceptance of nuclear power.
Out of 11 variables, four covariates—in other words, the share of nuclear power, the amount of energy supply, environmentalism, and ideology—have a significant impact on acceptance. The first two variables increase the acceptance of nuclear energy, whereas the following two decrease it. Four contextual variables explain a significant part of the between-country variance in the intercept. It is noticeable that, even though environmentalism and ideology share the political value, two variables show an independent impact on acceptance.
To see whether or not variance at the country level still significantly remains after controlling the variables at the individual level, we execute a random intercept model, Model 3, the fifth column in Table 4. We examine to what extent the variables at the individual level contribute to explaining the acceptance of nuclear power. When we include 10 variables at level 1, they reduce the variance by 27.28% ((0.475 − 0.343)/0.475), which means that the variables at the individual level make a significant contribution to explaining the variance of acceptance across countries. Table 4 shows that 1.284 in constant, which is the expected mean of the acceptance for an individual whose value is zero in the country.
Moreover, in random-effect estimates, the two variances of residuals and the intercept appear statistically significant. Since the variance of the intercept reveals statistical significance, it signals the independent role of contextual covariates in the acceptance of nuclear energy. In other words, the variance across countries remains after adding variables at the individual level to Model 1.
Model 4 is the intercepts with the slope as the outcome model, which shows the effect of both the individual and contextual variables. To see the significance of the full Model 4, we calculate the deviance, which shows the lack of fit between the data and the model [44]. We obtained the difference of deviance between Model 1 and Model 4, and then executed the Chi-square test with the degree of freedom. Difference in deviance shows statistical significance, 2 = 20,326.22(49,667.366 − 29,341.146) with degree of freedom = 22, p < 0.01. It means Model 4 with 22 predictors is more fitted with the data than Model 1. Lower values of lower Akaike Information Criterion (AIC) and Schwarz’s Bayesian Information Criterion (BIC) in Model 4 than that in Model 1 confirm the goodness-of-model fit. The variance change in the intercept from 0.041 in Model 3 to 0.025 in Model 4 signals a 39.02% ((0.041 − 0.025)/0.041) increase of the explanatory power. However, the variance of the intercept is not significant in terms of Wald Z.
The impact of the predictors at the individual level is like the results in Model 3. There is no change in the significance of the variables at the individual level, which means they have a robust explanatory power. Only 2 out of 11 predictors at the country level appear statistically significant. The net import of energy increases the acceptance of nuclear energy, whereas post-materialism decreases it.
5. Conclusions
5.1. Summary
Our research examined whether there was a difference in the acceptance of nuclear energy across 27 European countries in 2009, before the Fukushima accident. Moreover, we explored how variables at the individual level and country level influence the acceptance of nuclear power. Furthermore, to compare the causal power of independent variables at both the individual and contextual level, we executed the multilevel analysis. Our main findings are the following.
First, the descriptive analysis showed that 34.3% of respondents supported “the reduction” of nuclear power; 44.6% said “maintained,” and 20.0% said “increased.” Because only one in five respondents supported “increased,” future prospects for building nuclear power stations across European countries are expected to be negative. However, there will be a lot of difference in respondents’ attitudes toward the acceptance of nuclear energy, varying from country to country: 34.5% in Poland versus 4.6% in Austria in the “rate of acceptance”; 61.1% in Lithuania versus 27% in Austria in “maintained”; 67.8% in Austria versus 12.8% in the Czech Republic in “decreased”. Moreover, Austrians show a more deterministic attitude toward nuclear power, and the descriptive percentage shows that a large portion of them have a neutral attitude toward nuclear energy. In particular, those in former communist countries show such a neutral response toward nuclear power.
Second, at the individual level, in an overall model covering 27 countries, the perceived risk decreases the acceptance of nuclear power, whereas the perceived benefit, trust, and knowledge increase it. Trust is the foremost variable to explain the variance of acceptance, followed by perceived benefit, perceived risk 1, and perceived risk 2. Five sociodemographic predictors possess weak explanatory power. The psychometric factor explains more variance of acceptance than the sociodemographic one does.
When we executed the regression analysis to each country, each predictor’s coverage for explanation varies by country: the perceived benefit has a positive impact in 26 countries; the perceived risk 1, in 24; trust, in 23; perceived risk 2, in 18; and knowledge, in 8. Among the sociodemographic variables, gender has significant explanatory power in 14 countries.
In the explanatory power, the perceived benefit has the largest explanatory power in 12 countries, followed by trust in 10 countries, and perceived risk in 1 country. However, the direction of the predictors’ impact on the acceptance across countries appeared to not be the same; age, education, social class, residence, and knowledge showed contrasting effects across countries. This confirms the effect of countries as contexts that play a role in inducing the different results in acceptance. Moreover, the explanatory power of the present model based on the 10 predictors ranged from 39.0% in Finland to 11.3% in Lithuania.
Third, at the country level, although the full model explains the large variance of acceptance at the aggregate level, in other words, 74.0%, there is only one significant independent variable, in other words, ideology. This means that progressives disagree with the increase of nuclear energy.
Fourth, at the multilevel analysis, Model 1 (unconstrained null model) proved that a significant proportion of variance in acceptance exists between second-level units. Variables at level 2 explained 10.02% of the variance of acceptance. Moreover, the Wald Z test suggested the statistical significance of variance at the country level. Model 2 (random-intercept model) in Table 4 showed that when the covariate at level 2 was put into the null model, the residual variance of acceptance of the nuclear power decreased by 96.5%. This means that the contextual variables make a significant contribution to decreasing the unexplained variance in acceptance. The share of nuclear power and amount of energy supply increase the acceptance of nuclear power, whereas environmentalism and ideology (progressive) decrease it.
Model 3 (random-intercept model) shows that the variance explained by variables at the country level still significantly remains under the control of the variables at the individual level. Moreover, this model showed that predictors at the individual level contribute to decreasing the unexplained variables.
Model 4 (intercepts with slope as the outcome model) proved that this model based on 22 predictors was more fitted with the data than Model 1. Age, perceived benefit, trust, knowledge, and net import of energy increased acceptance, whereas gender (female), perceived risk, and post-materialism decreased it. However, although changing from Model 3 to Model 4 resulted in a 39.02% increase in the explanatory power, the variance of the intercept is not significant in terms of Wald Z.
5.2. Implication
Our analysis demonstrated that the acceptance of nuclear power depends not only on perceptual factors at the individual level but on contextual ones at the country level. This result suggested the meaningful role of the individual and country context in influencing the acceptance of nuclear power. Social construction at the individual level and structural constraints at the country level have joint effects on individuals’ the acceptance of nuclear power. Based on findings, we predicted some future for nuclear energy in Europe. For the last few decades, since increases not only in the energy supply, but also in environmentalism and the Green Party’s share in national parliaments have become major trends in European countries, conflicts between pro- and anti-groups related to nuclear energy are expected. Moreover, because individual and contextual variables influence the acceptance of nuclear energy across countries differently, wide policy variations around nuclear energy will appear in the future across European countries.
5.3. Limitations
Although our analysis shows the causal relationships between predictors at the individual and contextual levels on the one hand, and the acceptance of nuclear power on the other, it has limits.
First, we did not cover the attitudes after the Fukushima nuclear accident. Second, our study has the limitation in that it did not use primary data, but rather, interpreted an existing survey. Moreover, the data used in this study was collected in 2009 when there were no Eurobarometer data covering the nuclear issues after the Fukushima nuclear accident, which had a strong impact on nuclear energy policies and the awareness of nuclear power in the world. In future research, it will be necessary to compare the attitude changes of nuclear power before and after the Fukushima nuclear accident. Moreover, it needs to check the variation of attitude changes across countries after the Fukushima accident. We expect that there are wide variations of attitude change and stability across countries because every country has different contexts of energy and resources. Third, we did not cover all of the variables which influence the attitude. When examined the history, not only do catastrophic disasters such as the Three Mile Island accident in 1979 and the Chernobyl disaster 626 in 1986 influenced people’s attitude toward energy but various factors do as well.
5.4. The State of Energy in EU
EU proposed Energy 2020: a strategy for competitive, sustainable, and secure energy. For this work, in January 2008, the European Commission proposed the Energy and Climate package with “20-20-20 by 2020” goals: reduction in greenhouse gas emissions to 20% below 1990 level, 30% in the context of a global agreement on climate; a 20% share of renewables in the final energy consumption; a reduction in primary energy use to 20% below the baseline projection for 2020 [46]. This policy focused on giving the priority on increasing renewable energy and reducing fossil energy.
On nuclear energy, the EU assumed that nuclear energy contributes to combating climate change and strengthening the security of supply by reducing EU’s external dependence on oil and gas. It believed that as one of the cheapest low carbon energy sources, nuclear energy also contributes to the EU’s competitiveness. The EU developed the most advanced framework for nuclear safety, security, and non-proliferation. A legally binding framework for nuclear safety was agreed in June 2009 [46]. This means that the EU had no intention to decrease nuclear power energy.
Such nuclear-energy-oriented policies in EU were caused by a higher dependency on nuclear energy. In 2009, the EU-27 had the largest number of commercial nuclear power stations in the world: some 150 nuclear reactors were in operation, providing around one-third of the EU’s electricity [47]. Additionally, according to the International Energy Agency [47], in 2009, nuclear power accounted for 14% of TPED (Total Primary Energy Demand), followed by oil, gas, and coal. However, in power generation, nuclear power accounted for 33% of the total in 2009. Moreover, nuclear power energy took 28% of electricity generation, followed by coal (27%), gas (23%), and oil (3%).
Table 5 shows the share of each energy in the EU. This table shows that there was variation in energy sources across countries.
As a whole, the ratio of nuclear power in electric power production to 2009, pre-Fukushima, is lower than that in nuclear power generation in 2012 after the Fukushima accident. This can be interpreted as a result of the long-term energy policy direction of the EU, which has been established since 2006, though it was affected by the Fukushima accident. In particular, in Germany, the share of nuclear power in power generation dropped sharply from 23.2% in 2009 to 16% in 2012. In France, nuclear power accounted for 76.3% in 2009, which was the largest share of electric power generation among the EU countries. However, the nuclear dependency rate was slightly reduced from 76.3% to 75.8% in 2012. However, countries such as the United Kingdom, Hungary, and Slovakia experienced an increasing dependence on nuclear power in 2012 after the Fukushima accident [48].
According to Win-Gallup International [49], in Figure 3, a survey on the attitude toward nuclear energy after the Fukushima accident showed that the net favor of nuclear energy worldwide dropped from 25% to 6%. However, those who supported nuclear power continued to have a higher share than those who opposed it.
The following Table 6 summarizes the public attitude toward nuclear power in European countries before and after the Fukushima accident. Overall, the percentage of ‘favor’ for nuclear power decreased after the Fukushima accident rather than before the Fukushima accident. The ratio of ‘not favor’ increased. However, the countries where the support for nuclear power before the Fukushima accident was continued to maintain the same pattern even after the Fukushima accident, and vice versa. These results suggest that the Fukushima accident affected the general public’s attitude toward nuclear power but did not significantly affect the pattern of favor. It needs more studies about the attitude change after Fukushima accident.
Author Contributions
Two authors contributed equally to this work.
Funding
This study was supported by research fund from Honam University, 2015. This research was funded by the Ministry of Education of the Republic of Korea and the National Research Foundation of Korea (NRF-2016S1A5A2A01022542).
Conflicts of Interest
The authors declare no conflict of interest.
References
- World Nuclear Association. Country Profile. 2017. Available online: www.world-nuclear.org (accessed on 1 April 2018).
- International Atomic Energy Agency (IAEA). Nuclear Power Reactors in the World; Reference Data Series No. 2; IAEA: Vienna, Austria, 2017. [Google Scholar]
- National Grid. Future Energy Scenarios; National Grid: London, UK, 2017. [Google Scholar]
- Jäckle, S.; Bauschke, R. Comparing socialization, cultural and individual level effects on attitudes towards nuclear energy—A multilevel analysis of 27 European countries. Polit. Cult. Soc. 2012, 2, 341–366. [Google Scholar]
- Kim, Y.; Kim, W.; Kim, M. An international comparative analysis of public acceptance of nuclear energy. Energy Policy 2014, 66, 475–483. [Google Scholar] [CrossRef]
- Swaton, E.; Renn, O. Attitudes towards Nuclear Power: A Comparison between Three Nations; A-2361; International Institute for Applied Systems Analysis (IIASA): Laxenburg, Austria, 1984. [Google Scholar]
- Peters, E.; Slovic, P. The Role of Affect and Worldviews as Orienting Dispositions in the Perception and Acceptance of Nuclear Power. J. Appl. Soc. Psychol. 1996, 26, 1427–1453. [Google Scholar] [CrossRef]
- Slovic, P.; Flynn, J.; Mertz, C.K.; Poumadere, M.; Mays, C. Nuclear power and the public: A Comparative study of risk perception in France and the United Sates. In Cross-Cultural Risk Perception; Renn, O., Rohrmann, B., Eds.; Kluwer Academic: Boson, MA, USA, 2000; pp. 55–102. [Google Scholar]
- Kim, S.; Choi, S.; Wang, J. Individual perception vs. structural context: Searching for multilevel determinants of social acceptance of new science and technology across 34 countries. Sci. Public Policy 2014, 41, 44–57. [Google Scholar] [CrossRef]
- Wiegman, O.; Gutteling, J.M.; Cadet, B. Perception of Nuclear Energy and Coal in France and the Netherlands. Risk Anal. 1995, 15, 513–521. [Google Scholar] [CrossRef] [PubMed]
- Lawrence, A.; Sovacool, B.; Stirling, A. Nuclear energy and path dependence in: Coherence or continued divergence? Clim. Policy 2016, 16, 622–641. [Google Scholar] [CrossRef]
- Slovic, P. The Perception of Risk; Routledge: London, UK, 2016. [Google Scholar]
- Fischhoff, B.; Slovic, P.; Lichtenstein, S.; Read, S.; Combs, B. How safe is safe enough? A psychometric study of attitudes toward technological risks and benefit. Policy Sci. 1978, 9, 127–152. [Google Scholar] [CrossRef]
- Alhakami, A.S.; Slovic, P. A psychological study of the inverse relationship between perceived risk and perceived benefit. Risk Anal. 1994, 14, 1085–1096. [Google Scholar] [CrossRef] [PubMed]
- Vainio, A.; Paloniemi, R.; Varho, V. Weighing the Risks of Nuclear Energy and Climate Change: Trust in Different Information Sources, Perceived Risks, and Willingness to Pay for Alternatives to Nuclear Power. Risk Anal. 2017, 37, 557–569. [Google Scholar] [CrossRef] [PubMed]
- Kim, Y.; Kim, M.; Kim, W. Effect of the Fukushima nuclear disaster global public acceptance of nuclear energy. Energy Policy 2013, 61, 822–828. [Google Scholar] [CrossRef]
- Tanaka, Y. Major Psychological Factors Determining Public Acceptance of the Siting of Nuclear Facilities. J. Appl. Soc. Psychol. 2004, 34, 1147–1165. [Google Scholar] [CrossRef]
- De Groot, J.I.M.; Steg, L. Morality and Nuclear Energy: Perceptions of Risks and Benefits, Personal Norms, and Willingness to Take Action Related to Nuclear Energy. Risk Anal. 2010, 30, 1363–1373. [Google Scholar] [CrossRef] [PubMed]
- Flynn, J.; Burns, W.; Mertz, C.K.; Slovic, P. Trust as a determinant of opposition to a high-level radioactive waste repository: Analysis of a structural model. Risk Anal. 1992, 12, 417–430. [Google Scholar] [CrossRef]
- Sjöberg, L.; Drottz-Sjöberg, B. Knowledge and risk per-ception among nuclear power plant employees. Risk Anal. 1991, 11, 607–618. [Google Scholar] [CrossRef] [PubMed]
- Costa-Font, J.; Rudisill, C.; Mossialos, E. Attitudes as an Expression of Knowledge and “Political Anchoring”: The Case of Nuclear Power in the United Kingdom. Risk Anal. 2008, 28, 1273–1288. [Google Scholar] [CrossRef] [PubMed]
- Stoutenborough, J.W.; Vedlitz, A. The role of scientific knowledge in the public’s perceptions of energy technology risks. Energy Policy 2016, 96, 206–216. [Google Scholar] [CrossRef]
- Nuclear Energy Agency (NEA). Public Attitudes to Nuclear Power; NEA—OECD: Paris, France, 2010; p. 6859. Available online: https://www.oecd-nea.org/ndd/reports/2010/nea6859-public-attitudes.pdf (accessed on 2 March 2018).
- Bielecki, J. Energy security: Is the wolf at the door? Q. Rev. Econ. Financ. 2002, 42, 235–250. [Google Scholar] [CrossRef]
- Pampel, F.C. Support for Nuclear Energy in the Context of Climate Change: Evidence from the European Union. Organ. Environ. 2011, 24, 249–268. [Google Scholar] [CrossRef]
- Corner, A.; Venables, D.; Spence, A.; Poortinga, W.; Demski, C.; Pidgeon, N. Nuclear power, climate change and energy security: Exploring British public attitudes. Energy Policy 2011, 39, 4823–4833. [Google Scholar] [CrossRef]
- Jun, E.; Chang, S.H. The analysis of security cost for different energy source. Appl. Energy 2009, 86, 1894–1901. [Google Scholar] [CrossRef]
- Choi, Y. Study on the determinant of social acceptance of energy resource: Focusing fossil, nuclear power and renewable energy. J. Gov. Stud. 2015, 21, 295–330. [Google Scholar]
- Spence, A.; Poortinga, W.; Pidgeon, N. Public Perceptions of Energy Choices: The Influence of Beliefs about Climate Change and the Environment. Energy Environ. 2010, 21, 385–407. [Google Scholar] [CrossRef]
- Besley, J.C.; Oh, S. The Impact of Accident Attention, Ideology, and Environmentalism on American Attitudes toward Nuclear Energy. Risk Anal. 2014, 34, 949–964. [Google Scholar] [CrossRef] [PubMed]
- Rothman, S.; Lichter, S.R. Elite Ideology and Risk Perception in Nuclear Energy Policy. Am. Polit. Sci. Rev. 1987, 81, 383–404. [Google Scholar] [CrossRef]
- Inglehart, R. The silent revolution in Europe: Intergenerational change in post-industrial societies. Am. Polit. Sci. Rev. 1971, 65, 991–1017. [Google Scholar] [CrossRef]
- Abramson, P.R.; Inglehart, R. Generational replacement and value change in six West European societies. Am. J. Polit. Sci. 1986, 30, 1–25. [Google Scholar] [CrossRef]
- European Commission. Eurobarometer 72.2 (Sep-Oct 2009); ZA4976; TNS OPINION & SOCIAL, Brussels [Producer]; GESIS Data Archive; Data file Version 3.0.0; European Commission: Cologne, Germany, 2012; Available online: http://zacat.gesis.org (accessed on 7 May 2018). [CrossRef]
- IAEA. Nuclear Share of Electricity Generation in 2017. Available online: http://www.iaea.org/PRIS/WorldStatistics/NuclearShareofElectricityGeneration.aspx (accessed on 4 March 2018).
- World Energy Agency. Key world Energy Statistics; World Energy Agency: Paris, France, 2009. [Google Scholar]
- Eurostat. Available online: http://ec.europa.eu/eurostat/statistics-explained/index.php/Electricity_price_statistics (accessed on 4 March 2017).
- European Commission. Eurobarometer 63.1 (Jan-Feb 2005); TNS OPINION & SOCIAL, Brussels [Producer]; GESIS Data Archive; ZA4233 Data file Version 1.1.0; European Commission: Cologne, Germany, 2012; Available online: http://zacat.gesis.org (accessed on 7 May 2018). [CrossRef]
- The European Parliament. 2009 Election Results. Available online: http://www.europarl.europa.eu/elections2014-results/en/election-results-2009.html (accessed on 5 March 2018).
- Word Bank. Selected Indicators for 2009. Available online: http://data.worldbank.org/indicator (accessed on 5 March 2018).
- Solomon, L.S.; Tomaskovic-Devey, D.; Risman, B.J. The gender gap and nuclear power: Attitudes in a politicized environment. Sex Roles 1989, 21, 401–414. [Google Scholar] [CrossRef]
- Peugh, J.L. A practical guide to multilevel modeling. J. Sch. Psychol. 2010, 48, 85–112. [Google Scholar] [CrossRef] [PubMed]
- Peugh, J.L.; Enders, C.K. Using the SPSS mixed procedure to fit cross-sectional and longitudinal multilevel models. Educ. Psychol. Meas. 2005, 65, 717–741. [Google Scholar] [CrossRef]
- Luke, D.A. Multilevel Modeling; Sage: London, UK, 2004. [Google Scholar]
- Muthén, B.O. Multilevel covariance structure analysis. Soc. Methods Res. 1994, 22, 376–398. [Google Scholar] [CrossRef]
- European Commission. State of Play in the EU Energy Policy. 2010. Available online: http://eur-lex.europa.eu/legal-content/EN/TXT/PDF/?uri=CELEX:52010SC1346&from=EN (accessed on 6 March 2018).
- International Energy Agency. World Energy Outlook 2011. Available online: https://webstore.iea.org/world-energy-outlook-2011 (accessed on 6 March 2018).
- European Commission. Energy in Figures. 2014. Available online: https://ec.europa.eu/energy/sites/ener/files/documents/2014_pocketbook.pdf (accessed on 7 March 2018).
- Win-Gallup International. Impact of Japan Earthquake on Views about Nuclear Energy. 2011. Available online: http://www.nrc.co.jp/report/pdf/110420_2.pdf (accessed on 1 April 2018).
Figure 1.
The research model

Figure 2.
The percentage of the increase, maintenance, and decrease.

Figure 3.
The impact of Japan’s earthquake on the views on nuclear energy (%). Source. Win-Gallup International [49].
Figure 3.
The impact of Japan’s earthquake on the views on nuclear energy (%). Source. Win-Gallup International [49].


Table 1.
The measures at the individual level.
| Theoretical Concept | Questionnaire | Response Scale |
|---|---|---|
| Acceptance | QA15: In your opinion, should the current level of nuclear energy as a proportion of all energy sources be reduced, maintained the same, or be increased? | 1. Reduced, 2. Maintained the same, 3. Increased |
| Residence | QA1: Residence: Have you ever lived in an area close (within a 50-km radius) to a nuclear power plant? | 1. No, 2. Yes |
| Perceived Risk 1 (personal risk) | QA9: To what extent do you think that (the) nuclear power plant(s) in (OUR COUNTRY) represent(s) a risk to you and your family? | 1. Not a risk at all, 2. Not much of a risk, 3. Some risk, 4. A big risk |
| Perceived Risk 2 (relative risk) | QA10: Nuclear incidents sometimes raise major concerns in the media and among the public. In your opinion, compared to other safety risks in our lives, would you say that nuclear risks are…? | 1. Strongly exaggerated, 2. Somewhat exaggerated, 3. Somewhat underestimated, 4. Strongly underestimated |
| Perceived benefit | QA12: To what extent do you agree or disagree with each of the following three statements on the value of nuclear energy? (for example, nuclear energy helps to limit climate change) | 1. Totally disagree, 2. Tend to disagree, 3. Tend to agree, 4. Totally agree |
| Trust | QA11: To what extent do you agree or disagree with each of the following “seven” statements? (for example, it is possible to operate a nuclear power plant in a safe manner) | 1. Totally disagree, 2. Tend to disagree, 3. Tend to agree, 4. Totally agree |
| Knowledge | QA5: How informed do you think you are about the safety of nuclear power plants? | 1. Not at all informed, 2. Fairly well informed, 3. Not very well informed, 4. Very well informed |
Table 2.
The regression analysis at the individual level.
| Variables | Whole Model | Austria | Greece | Portugal | Cyprus | Denmark | Luxembourg | |||||||
| B(SE) | β | B(SE) | β | B(SE) | β | B(SE) | β | B(SE) | β | B(SE) | β | B(SE) | β | |
| Gender (1 = Women) | −0.069 ***(0.010) | −0.047 | −0.029(0.044) | −0.025 | −0.055(0.039) | −0.049 | 0.040(0.068) | 0.029 | −0.419 ***(0.143) | −0.270 | −0.151 **(0.065) | −0.096 | 0.018(0.067) | 0.013 |
| Age | 0.002 ***(0.000) | 0.045 | −0.001(0.002) | −0.024 | −0.002 *(0.001) | −0.073 | 0.001(0.002) | 0.017 | −0.008(0.005) | −0.166 | 0.006 ***(0.002) | 0.133 | 0.001(0.002) | 0.030 |
| Education (1 = above 15 years) | 0.058 ***(0.016) | 0.026 | 0.055(0.091) | 0.023 | −0.035(0.053) | −0.028 | −0.011(0.077) | −0.008 | −0.086(0.255) | −0.035 | 0.008(0.138) | 0.002 | −0.136(0.136) | −0.050 |
| Social Class | −0.013 ***(0.003) | −0.028 | 0.027(0.017) | 0.061 | 0.006(0.014) | 0.017 | −0.039(0.030) | −0.069 | 0.033(0.048) | 0.064 | −0.007(0.020) | −0.015 | −0.050 **(0.023) | −0.105 |
| Residence | −0.031 **(0.015) | −0.014 | −0.005(0.096) | −0.002 | −0.037(0.183) | −0.007 | 0.473 *(0.254) | 0.096 | - | - | 0.110(0.071) | 0.063 | 0.028(0.064) | 0.021 |
| Perceived Risk 1 | −0.127 ***(0.006) | −0.155 | −0.065 **(0.030) | −0.093 | −0.078 ***(0.028) | −0.106 | −0.214 ***(0.044) | −0.261 | −0.183 ***(0.067) | −0.247 | −0.051(0.038) | −0.058 | −0.113 ***(0.040) | −0.157 |
| Perceived Risk 2 | −0.095 ***(0.007) | −0.106 | −0.109 ***(0.033) | −0.161 | −0.031(0.026) | −0.045 | −0.043(0.048) | −0.048 | −0.059(0.080) | −0.071 | −0.077(0.047) | −0.076 | −0.159 ***(0.048) | −0.181 |
| Perceived Benefit | 0.203 ***(0.008) | 0.211 | 0.041(0.035) | 0.058 | 0.168 ***(0.028) | 0.254 | 0.196 **(0.072) | 0.172 | 0.210 **(0.082) | 0.264 | 0.255 ***(0.048) | 0.238 | 0.115 **(0.051) | 0.132 |
| Trust | 0.233 ***(0.009) | 0.219 | 0.260 ***(0.044) | 0.322 | 0.161 ***(0.043) | 0.165 | 0.230 ***(0.080) | 0.196 | 0.203 *(0.112) | 0.177 | 0.363 ***(0.059) | 0.294 | 0.193 ***(0.062) | 0.190 |
| Knowledge | 0.017 **(0.007) | 0.017 | 0.059 *(0.033) | 0.072 | 0.002(0.030) | 0.003 | 0.088(0.058) | 0.084 | −0.035(0.106) | −0.033 | −0.004(0.043) | −0.004 | −0.037(0.043) | −0.044 |
| F-Value | 703.93 *** | 25.27 *** | 17.96 *** | 11.50 *** | 5.00 *** | 19.10 *** | 10.31 *** | |||||||
| Adjusted R2 | 0.301 | 0.322 | 0.194 | 0.257 | 0.281 | 0.281 | 0.215 | |||||||
| Adjusted R2 in Model 1 | 0.028 | 0.032 | 0.036 | 0.031 | 0.055 | 0.058 | 0.002 | |||||||
| Adjusted R2 in Model 2 | 0.290 | 0.323 | 0.211 | 0.251 | 0.222 | 0.252 | 0.208 | |||||||
| R2 Change | 0.276 | 0.285 | 0.176 | 0.243 | 0.199 | 0.243 | 0.220 | |||||||
| Variables | Ireland | Malta | Italy | Latvia | Lithuania | Estonia | Poland | |||||||
| B(SE) | β | B(SE) | β | B(SE) | β | B(SE) | β | B(SE) | β | B(SE) | β | B(SE) | β | |
| Gender (1 = Women) | −0.089(0.055) | −0.057 | −0.246 *(0.127) | −0.155 | −0.093 *(0.053) | −0.062 | −0.160 ***(0.061) | −0.113 | −0.107 **(0.049) | −0.087 | −0.192 ***(0.063) | −0.133 | −0.190 ***(0.057) | −0.133 |
| Age | 0.003(0.002) | 0.061 | 0.001(0.005) | 0.012 | 0.002(0.002) | 0.037 | 0.004 **(0.002) | 0.090 | 0.004 **(0.002) | 0.107 | 0.001(0.002) | 0.020 | 0.001(0.002) | 0.026 |
| Education (1 = above 15 years) | 0.149(0.094) | 0.059 | −0.167(0.176) | −0.087 | −0.054(0.067) | −0.031 | −0.081(0.237) | −0.014 | −0.029(0.115) | −0.011 | 0.013(0.162) | 0.004 | 0.043(0.122) | 0.015 |
| Social Class | 0.031 *(0.017) | 0.062 | −0.117 ***(0.041) | −0.234 | −0.029(0.022) | −0.047 | 0.004(0.020) | 0.008 | 0.022(0.016) | 0.053 | −0.003(0.019) | −0.007 | 0.014(0.018) | 0.031 |
| Residence | 0.148(0.160) | 0.032 | 0.113(0.310) | 0.029 | 0.179(0.125) | 0.051 | 0.014(0.096) | 0.006 | 0.014(0.087) | 0.006 | −0.286 *(0.172) | −0.069 | −0.358 *(0.216) | −0.065 |
| Perceived Risk 1 | −0.176 ***(0.036) | −0.194 | −0.101(0.074) | −0.110 | −0.353 ***(0.031) | −0.424 | −0.039(0.029) | −0.062 | −0.132 ***(0.029) | −0.204 | −0.093 ***(0.033) | −0.129 | −0.172 ***(0.034) | −0.221 |
| Perceived Risk 2 | −0.150 ***(0.040) | −0.165 | −0.114 *(0.062) | −0.146 | −0.064(0.039) | −0.071 | −0.070*(0.036) | −0.095 | 0.014(0.036) | 0.017 | −0.112 ***(0.043) | −0.125 | −0.020(0.039) | −0.024 |
| Perceived Benefit | 0.203 ***(0.043) | 0.201 | 0.324 ***(0.082) | 0.318 | 0.144 ***(0.046) | 0.135 | 0.207 ***(0.046) | 0.215 | 0.135 ***(0.040) | 0.147 | 0.304 ***(0.051) | 0.292 | 0.117**(0.046) | 0.118 |
| Trust | 0.187 ***(0.052) | 0.170 | 0.184 *(0.101) | 0.153 | 0.045(0.059) | 0.038 | 0.290 ***(0.060) | 0.246 | 0.073(0.048) | 0.070 | 0.112*(0.058) | 0.101 | 0.301 ***(0.057) | 0.262 |
| Knowledge | 0.053(0.036) | 0.053 | 0.090(0.079) | 0.091 | 0.062 *(0.037) | 0.061 | 0.047(0.044) | 0.046 | 0.002(0.036) | 0.002 | 0.086 *(0.047) | 0.081 | 0.055(0.041) | 0.056 |
| F-Value | 33.12 *** | 4.51 *** | 24.01 *** | 14.36 *** | 8.62 *** | 18.26 *** | 19.62 *** | |||||||
| Adjusted R2 | 0.368 | 0.201 | 0.279 | 0.232 | 0.113 | 0.288 | 0.281 | |||||||
| Adjusted R2 in Model 1 | 0.048 | 0.003 | 0.004 | 0.025 | 0.031 | 0.076 | 0.050 | |||||||
| Adjusted R2 in Model 2 | 0.370 | 0.150 | 0.259 | 0.173 | 0.097 | 0.268 | 0.250 | |||||||
| R2 Change | 0.315 | 0.219 | 0.278 | 0.223 | 0.091 | 0.229 | 0.246 | |||||||
| Variables | Spain | Germany | France | Belgium | Sweden | Netherlands | Slovenia | |||||||
| B(SE) | β | B(SE) | β | B(SE) | β | B(SE) | β | B(SE) | β | B(SE) | β | B(SE) | β | |
| Gender (1 = Women) | 0.010(0.043) | 0.007 | 0.029(0.029) | 0.023 | −0.057(0.045) | −0.042 | 0.007(0.042) | 0.006 | −0.064(0.050) | −0.040 | −0.123 **(0.048) | −0.078 | −0.098 **(0.046) | −0.070 |
| Age | −0.001(0.001) | −0.017 | 0.001(0.001) | 0.028 | 0.003 **(0.001) | 0.086 | 0.002(0.001) | 0.052 | 0.005 ***(0.002) | 0.096 | 0.006 ***(0.001) | 0.123 | 0.002(0.001) | 0.043 |
| Education (1 = above 15 years) | −0.057(0.054) | −0.039 | 0.005(0.044) | 0.003 | −0.148 **(0.067) | −0.080 | 0.018(0.071) | 0.009 | 0.023(0.084) | 0.008 | −0.049(0.110) | −0.014 | −0.064(0.115) | −0.019 |
| Social Class | −0.009(0.018) | −0.017 | −0.016(0.010) | −0.036 | −0.010(0.015) | −0.022 | 0.005(0.014) | 0.011 | 0.012(0.017) | 0.021 | 0.033*(0.018) | 0.055 | 0.005(0.014) | 0.011 |
| Residence | −0.022(0.092) | −0.008 | 0.056(0.037) | 0.034 | −0.070(0.055) | −0.040 | −0.020(0.045) | −0.014 | 0.066(0.061) | 0.032 | 0.000(0.059) | 0.000 | 0.051(0.073) | 0.023 |
| Perceived Risk 1 | −0.212 ***(0.030) | −0.252 | −0.077 ***(0.023) | −0.098 | −0.129 ***(0.035) | −0.138 | −0.070 **(0.029) | −0.088 | −0.095 **(0.039) | −0.084 | −0.112 ***(0.034) | −0.111 | −0.084 ***(0.030) | −0.106 |
| Perceived Risk 2 | −0.147 ***(0.030) | −0.174 | −0.127 ***(0.021) | −0.181 | −0.126 ***(0.034) | −0.136 | −0.060 **(0.030) | −0.070 | −0.246 ***(0.037) | −0.238 | −0.102 ***(0.034) | −0.106 | −0.071 **(0.031) | −0.081 |
| Perceived Benefit | 0.186 ***(0.037) | 0.189 | 0.112 ***(0.023) | 0.141 | 0.142 ***(0.035) | 0.151 | 0.302 ***(0.038) | 0.312 | 0.302 ***(0.043) | 0.248 | 0.289 ***(0.035) | 0.280 | 0.217 ***(0.037) | 0.249 |
| Trust | 0.219 ***(0.041) | 0.205 | 0.274 ***(0.028) | 0.318 | 0.225 ***(0.044) | 0.196 | 0.139 ***(0.046) | 0.124 | 0.131 ***(0.047) | 0.110 | 0.317 ***(0.049) | 0.256 | 0.245 ***(0.045) | 0.237 |
| Knowledge | 0.070 **(0.033) | 0.072 | −0.026(0.019) | −0.032 | −0.001(0.035) | −0.001 | −0.014(0.029) | −0.016 | 0.041(0.037) | 0.034 | −0.088 ***(0.033) | −0.084 | 0.039(0.031) | 0.043 |
| F-Value | 35.51 *** | 74.63 *** | 24.60 *** | 23.43 *** | 37.76 *** | 46.02 *** | 31.78 *** | |||||||
| Adjusted R2 | 0.353 | 0.372 | 0.234 | 0.217 | 0.308 | 0.371 | 0.311 | |||||||
| Adjusted R2 in Model 1 | 0.007 | 0.006 | 0.040 | 0.018 | 0.053 | 0.069 | 0.033 | |||||||
| Adjusted R2 in Model 2 | 0.340 | 0.363 | 0.215 | 0.223 | 0.299 | 0.336 | 0.291 | |||||||
| R2 Change | 0.353 | 0.367 | 0.196 | 0.201 | 0.258 | 0.307 | 0.284 | |||||||
| Variables | UK | Romania | Finland | Slovakia | Hungary | Bulgaria | Czech Republic | |||||||
| B(SE) | β | B(SE) | β | B(SE) | β | B(SE) | β | B(SE) | β | B(SE) | β | B(SE) | β | |
| Gender (1 = Women) | −0.160 ***(0.051) | −0.105 | 0.011(0.062) | 0.008 | −0.145 ***(0.042) | −0.105 | −0.085 **(0.042) | −0.062 | −0.051(0.050) | −0.035 | 0.016(0.052) | 0.012 | −0.117 ***(0.034) | −0.095 |
| Age | 0.006 ***(0.001) | 0.138 | 0.000(0.002) | −0.002 | 0.003 ***(0.001) | 0.078 | 0.003 **(0.001) | 0.061 | 0.004 **(0.002) | 0.088 | −0.002(0.002) | −0.058 | 0.002(0.001) | 0.044 |
| Education (1 = above 15 years) | 0.182 *(0.101) | 0.061 | 0.013(0.106) | 0.006 | −0.017(0.085) | −0.006 | 0.044(0.166) | 0.008 | 0.031(0.064) | 0.018 | 0.185 *(0.108) | 0.066 | 0.085(0.203) | 0.011 |
| Social Class | −0.011(0.015) | −0.022 | −0.029 *(0.018) | −0.075 | 0.010(0.012) | 0.023 | 0.004(0.013) | 0.008 | −0.027(0.017) | −0.056 | −0.032 *(0.017) | −0.072 | 0.007(0.011) | 0.018 |
| Residence | 0.043(0.071) | 0.020 | 0.068(0.193) | 0.015 | −0.041(0.064) | −0.018 | 0.018(0.051) | 0.010 | 0.016(0.101) | 0.005 | −0.031(0.149) | −0.008 | −0.044(0.057) | −0.021 |
| Perceived Risk 1 | −0.133 ***(0.036) | −0.139 | −0.178 ***(0.034) | −0.239 | −0.151 ***(0.031) | −0.169 | −0.175 ***(0.030) | −0.202 | −0.146 ***(0.037) | −0.151 | −0.121 ***(0.032) | −0.173 | −0.131 ***(0.026) | −0.173 |
| Perceived Risk 2 | −0.074*(0.039) | −0.071 | −0.051(0.036) | −0.065 | −0.126 ***(0.034) | −0.125 | −0.102 ***(0.034) | −0.108 | −0.048(0.038) | −0.049 | −0.109 ***(0.041) | −0.121 | −0.093 ***(0.031) | −0.111 |
| Perceived Benefit | 0.227 ***(0.045) | 0.199 | 0.147 ***(0.043) | 0.161 | 0.255 ***(0.036) | 0.248 | 0.271 ***(0.037) | 0.259 | 0.205 ***(0.035) | 0.227 | 0.158 ***(0.042) | 0.163 | 0.155 ***(0.032) | 0.171 |
| Trust | 0.269 ***(0.055) | 0.210 | 0.073(0.050) | 0.071 | 0.225 ***(0.045) | 0.199 | 0.070(0.044) | 0.060 | 0.142 ***(0.048) | 0.123 | 0.243 ***(0.049) | 0.241 | 0.211 ***(0.039) | 0.214 |
| Knowledge | 0.018(0.034) | 0.018 | 0.037(0.040) | 0.042 | 0.023(0.030) | 0.024 | 0.047(0.030) | 0.050 | 0.081 **(0.035) | 0.083 | 0.096 ***(0.036) | 0.109 | 0.082 ***(0.023) | 0.103 |
| F-Value | 30.16 *** | 7.35 *** | 51.31 *** | 29.40 *** | 17.21 *** | 23.38 *** | 51.95 *** | |||||||
| Adjusted R2 | 0.291 | 0.120 | 0.390 | 0.251 | 0.181 | 0.310 | 0.363 | |||||||
| Adjusted R2 in Model 1 | 0.078 | 0.005 | 0.099 | 0.020 | 0.014 | 0.017 | 0.037 | |||||||
| Adjusted R2 in Model 2 | 0.282 | 0.142 | 0.380 | 0.258 | 0.161 | 0.294 | 0.352 | |||||||
| R2 Change | 0.213 | 0.131 | 0.292 | 0.233 | 0.174 | 0.303 | 0.328 | |||||||
* p < 0.1; ** p < 0.05; *** p < 0.01.
Table 3.
The regression analysis at the country level.
| Model 1 | Model 2 | Model 3 | |||||
|---|---|---|---|---|---|---|---|
| B | Beta | B | Beta | B | Beta | ||
| Micro Variables | (Constant) | 1.350(1.886) | - | 4.223(0.071) | - | 2.987(0.575) | |
| Perceived Risk 1 | −0.133(0.170) | −0.195 | - | - | 0.251(0.224) | 0.368 | |
| Perceived Risk 2 | −0.171(0.340) | −0.140 | - | - | −0.332(0.344) | −0.272 | |
| Perceived Benefit | 0.357(0.232) | 0.327 | - | - | 0.135(0.251) | 0.124 | |
| Trust | 0.386 **(0.205) | 0.430 | 0.409(0.297) | 0.456 | |||
| Knowledge | −0.318(0.196) | −0.303 | - | - | 0.217(0.393) | 0.207 | |
| Macro Variables | GDP per capita | - | - | −0.001(0.000) | −0.114 | −0.001(0.000) | −0.191 |
| Share of nuclear power | - | - | 0.004 *(0.002) | 0.342 | 0.002(0.002) | 0.174 | |
| Amount of energy supply | - | - | 0.635 **(0.269) | 0.542 | 0.139(0.404) | 0.118 | |
| Net import of energy | - | - | 0.001(0.001) | 0.007 | 0.001(0.001) | 0.194 | |
| Energy consumption | - | - | 0.001(0.000) | 0.136 | −0.001(0.000) | −0.241 | |
| Electricity price | - | - | 0.275(0.976) | 0.057 | −0.050(0.961) | −0.010 | |
| Amount of CO2 | - | - | 0.011(0.015) | 0.150 | 0.025(0.016) | 0.351 | |
| Environmentalism | - | - | −0.763 **(0.282) | −0.384 | −0.347(0.364) | −0.174 | |
| Share of Green Party among national MPs | - | - | −0.009(0.010) | −0.231 | −0.001(012) | −0.033 | |
| Ideology (Left) | - | - | −0.241 *(0.112) | −0.374 | −0.315 **(125) | −0.487 | |
| Post-materialism | - | - | 0.425(0.272) | 0.279 | −0.057(481) | −0.038 | |
| F-Value | 8.208 *** | 5.232 *** | 5.635 *** | ||||
| Adjusted R-Square | 0.581 | 0.793 | 0.740 | ||||
* p < 0.1; ** p < 0.05; *** p < 0.01. The numbers in parentheses are standard errors.
Table 4.
The multilevel analysis.
| Model 1 | Model 2 | Model 3 | Model 4 | ||
|---|---|---|---|---|---|
| Regression Coefficient (Fixed-effect) | |||||
| Constant | 1.850 *** | 4.228 *** | 1.284 *** | 4.418 *** | |
| Level 1: Individual Predictors | Gender (1 = Women) | −0.080 *** | −0.079 *** | ||
| Age | 0.002 *** | 0.002 *** | |||
| Education (1 = above 15 years) | −0.004 | −0.004 | |||
| Social Class | −0.002 | −0.002 | |||
| Residence | 0.017 | 0.017 | |||
| Perceived Risk 1 | −0.133 *** | −0.133 *** | |||
| Perceived Risk 2 | −0.091 *** | −0.092 *** | |||
| Perceived Benefit | 0.200 *** | 0.199 *** | |||
| Trust | 0.198 *** | 0.198 *** | |||
| Knowledge | 0.031 *** | 0.030 *** | |||
| Level 2: Contextual Predictors | GDP per capita | 0.000 | 0.000 | ||
| Share of nuclear power | 0.003 * | −0.001 | |||
| Amount of energy supply | 0.660 ** | 0.483 | |||
| Net import of energy | 0.000 | 0.004 ** | |||
| Energy consumption | 0.000 | 0.000 | |||
| Electricity price | 0.159 | −0.527 | |||
| Amount of CO2 | 0.008 | −0.005 | |||
| Environmentalism | −0.789 ** | −0.072 | |||
| Share of Green Party among national MPs | −0.006 | −0.019 | |||
| Ideology (Left) | −0.231 * | −0.206 | |||
| Post-materialism | 0.417 | −1.112 ** | |||
| Variance Components (random effects) | |||||
| Variance of Residual() (at the individual level) | 0.475 *** | 0.475 *** | 343 *** | 0.343 *** | |
| Variance of Intercept() (at the country level) | 0.055 *** | 0.019 ** | 0.041 *** | 0.025 | |
| Sum of variance and covariance of slope’s deviation | - | - | 0.015 | 0.014 | |
| Model Summary | |||||
| Effect Index | Intraclass Correlation (ICC) | 10.02% | 3.94% | 13.91% | 10.45% |
| Model Fit Index | Deviance Statistic (−2 log likelihood) | 49667.366 | 49718.844 | 29287.455 | 29341.146 |
| Akaike’s Information Criterion (AIC) | 49671.366 | 49722.844 | 29311.455 | 29365.146 | |
| Schwarz’s Bayesian Criterion(BIC) | 49687.510 | 49738.989 | 29403.858 | 29457.540 | |
* p < 0.1; ** p < 0.05; *** p < 0.01.
Table 5.
The share of the Gross Electricity Generation in EU Countries.
| 2009 (Pre-Fukushima) | 2010 (Pre-Fukushima) | 2011 (Post-Fukushima) | 2012 (Post-Fukushima) | |||||||||||||
|---|---|---|---|---|---|---|---|---|---|---|---|---|---|---|---|---|
| 1 | 2 | 3 | 4 | 1 | 2 | 3 | 4 | 1 | 2 | 3 | 4 | 1 | 2 | 3 | 4 | |
| EU Total | 28.8 | 23.6 | 28.1 | 19.5 | 27.5 | 23.8 | 27.6 | 21.1 | 28.3 | 22.4 | 27.7 | 21.6 | 29.8 | 18.8 | 27.0 | 24.4 |
| POL | 89.8 | 4.0 | 0.0 | 6.1 | 88.6 | 4.1 | 0.0 | 7.3 | 87.0 | 4.6 | 0.0 | 8.3 | 84.3 | 5.0 | 0.0 | 10.7 |
| EST | 88.5 | 5.7 | 0.0 | 5.7 | 86.8 | 5.4 | 0.0 | 7.8 | 85.3 | 5.4 | 0.0 | 9.3 | 82.5 | 5.0 | 0.0 | 12.5 |
| BGR | 49.8 | 4.7 | 35.6 | 10.0 | 49.4 | 4.3 | 32.6 | 13.7 | 54.8 | 4.2 | 32.3 | 8.7 | 48.7 | 5.1 | 33.3 | 12.9 |
| UK | 29.1 | 44.8 | 18.4 | 7.7 | 29.7 | 46.4 | 16.4 | 7.6 | 30.6 | 40.3 | 18.9 | 10.3 | 40.4 | 27.9 | 19.4 | 12.2 |
| SWE | 1.4 | 1.4 | 38.4 | 58.8 | 2.4 | 2.6 | 39.2 | 55.8 | 1.4 | 1.5 | 40.6 | 56.5 | 0.9 | 0.8 | 38.7 | 59.6 |
| NLD | 23.1 | 63.5 | 3.8 | 9.7 | 20.5 | 66.4 | 3.4 | 9.6 | 20.6 | 64.6 | 3.7 | 11.1 | 25.2 | 58.5 | 3.9 | 12.4 |
| HUN | 19.3 | 29.4 | 43.1 | 8.1 | 18.0 | 31.5 | 42.5 | 8.1 | 18.4 | 30.2 | 43.9 | 7.5 | 18.9 | 27.6 | 45.9 | 7.6 |
| CZE | 56.1 | 4.5 | 33.0 | 6.3 | 55.1 | 4.8 | 32.6 | 7.6 | 54.0 | 4.6 | 32.4 | 9.0 | 50.9 | 4.5 | 34.6 | 10.1 |
| MLT | 100.0 | 0.0 | 0.0 | 0.0 | 100.0 | 0.0 | 0.0 | 0.0 | 100.0 | 0.0 | 0.0 | 0.0 | 100.0 | 0.0 | 0.0 | 0.0 |
| ROU | 39.1 | 13.3 | 20.3 | 27.2 | 35.3 | 12.0 | 19.1 | 33.5 | 41.2 | 13.5 | 18.8 | 26.5 | 40.1 | 14.7 | 19.5 | 25.7 |
| SVK | 17.2 | 9.2 | 54.0 | 19.5 | 15.1 | 9.7 | 52.5 | 22.7 | 14.7 | 12.6 | 53.8 | 18.9 | 13.7 | 11.6 | 54.4 | 20.4 |
| ITA | 22.6 | 52.0 | 0.0 | 25.4 | 20.5 | 52.6 | 0.0 | 26.8 | 21.6 | 50.1 | 0.0 | 28.3 | 23.0 | 45.2 | 0.0 | 31.8 |
| FIN | 26.5 | 13.6 | 31.1 | 28.7 | 26.6 | 14.7 | 28.5 | 30.2 | 21.4 | 13.7 | 31.8 | 33.2 | 15.9 | 10.3 | 33.0 | 40.8 |
| IRL | 26.5 | 57.6 | 0.0 | 15.9 | 24.5 | 61.9 | 0.0 | 13.6 | 25.9 | 54.4 | 0.0 | 19.7 | 30.2 | 49.8 | 0.0 | 20.0 |
| LAT | 0.0 | 35.7 | 0.0 | 64.3 | 0.0 | 45.5 | 0.0 | 54.5 | 0.0 | 56.3 | 0.0 | 43.7 | 0.0 | 33.9 | 0.0 | 66.1 |
| DNK | 56.3 | 20.1 | 0.0 | 23.7 | 46.6 | 20.7 | 0.0 | 32.7 | 42.0 | 16.8 | 0.0 | 41.2 | 36.7 | 14.0 | 0.0 | 49.3 |
| LTU | 4.6 | 13.9 | 72.2 | 9.3 | 10.9 | 58.2 | 0.0 | 30.9 | 4.3 | 58.7 | 0.0 | 37.0 | 4.2 | 60.4 | 0.0 | 35.4 |
| SVN | 31.3 | 3.7 | 35.0 | 30.1 | 32.3 | 3.0 | 34.8 | 29.9 | 33.1 | 3.1 | 38.8 | 25.0 | 32.7 | 3.2 | 35.3 | 28.8 |
| CYP | 100.0 | 0.0 | 0.0 | 0.0 | 100.0 | 0.0 | 0.0 | 0.0 | 96.0 | 0.0 | 0.0 | 4.0 | 93.8 | 0.0 | 0.0 | 6.3 |
| FRA | 4.9 | 4.9 | 76.3 | 13.9 | 5.2 | 4.7 | 75.6 | 14.6 | 3.1 | 5.2 | 79.2 | 12.4 | 4.1 | 4.4 | 75.8 | 15.7 |
| BEL | 6.1 | 33.7 | 52.5 | 7.7 | 4.9 | 35.5 | 51.2 | 8.4 | 4.1 | 30.9 | 54.3 | 10.8 | 4.3 | 31.5 | 49.6 | 14.5 |
| LUX | 0.0 | 0.0 | 0.0 | 100.0 | 0.0 | 0.0 | 0.0 | 100.0 | 0.0 | 63.9 | 0.0 | 36.1 | 0.0 | 63.2 | 0.0 | 36.8 |
| ESP | 18.8 | 37.1 | 18.0 | 26.2 | 13.9 | 32.3 | 20.5 | 33.3 | 20.0 | 29.6 | 19.7 | 30.7 | 23.7 | 25.0 | 20.7 | 30.5 |
| PRT | 32.5 | 29.5 | 0.0 | 38.1 | 18.8 | 27.7 | 0.0 | 53.5 | 24.0 | 28.6 | 0.0 | 47.4 | 33.0 | 23.1 | 0.0 | 44.0 |
| DEU | 44.9 | 14.6 | 23.2 | 17.2 | 43.8 | 15.6 | 22.7 | 17.8 | 44.6 | 16.1 | 17.9 | 21.4 | 45.8 | 14.1 | 16.0 | 24.1 |
| GRC | 68.2 | 17.9 | 0.0 | 13.8 | 64.5 | 17.1 | 0.0 | 18.4 | 62.4 | 23.4 | 0.0 | 14.2 | 61.1 | 22.0 | 0.0 | 16.9 |
| AUT | 7.1 | 19.8 | 0.0 | 73.0 | 8.8 | 22.8 | 0.0 | 68.4 | 9.8 | 22.0 | 0.0 | 68.2 | 7.1 | 16.0 | 0.0 | 76.8 |
1. Fuels (Solid fuel + Petroleum and Products), 2. Gases, 3. Nuclear, 4. Renewables. Source: EC [48].
Table 6.
The attitude toward nuclear power energy.
| Country | Before Fukushima | After Fukushima | ||||
|---|---|---|---|---|---|---|
| Favorable (1) | Unfavorable (2) | Net Favor (1–2) | Favorable (1) | Unfavorable (2) | Net Favor (1–2) | |
| Bulgaria | 68 | 16 | 52 | 62 | 23 | 39 |
| Czech | 63 | 31 | 32 | 61 | 34 | 27 |
| France | 66 | 33 | 34 | 58 | 41 | 17 |
| Switzerland | 40 | 56 | 16 | 47 | 44 | 3 |
| Austria | 13 | 87 | −74 | 9 | 90 | −81 |
| Italy | 28 | 71 | −43 | 24 | 75 | −51 |
| Germany | 34 | 64 | −30 | 26 | 72 | −46 |
| Poland | 36 | 41 | −5 | 30 | 50 | −20 |
| Netherlands | 51 | 43 | 8 | 44 | 50 | −6 |
| Spain | 39 | 42 | −3 | 41 | 44 | −3 |
Source: Win-Gallup International [49].
© 2018 by the authors. Licensee MDPI, Basel, Switzerland. This article is an open access article distributed under the terms and conditions of the Creative Commons Attribution (CC BY) license (http://creativecommons.org/licenses/by/4.0/).
Share and Cite
MDPI and ACS Style
Wang, J.; Kim, S. Comparative Analysis of Public Attitudes toward Nuclear Power Energy across 27 European Countries by Applying the Multilevel Model. Sustainability 2018, 10, 1518. https://doi.org/10.3390/su10051518
AMA Style
Wang J, Kim S. Comparative Analysis of Public Attitudes toward Nuclear Power Energy across 27 European Countries by Applying the Multilevel Model. Sustainability. 2018; 10(5):1518. https://doi.org/10.3390/su10051518
Chicago/Turabian StyleWang, Jaesun, and Seoyong Kim. 2018. "Comparative Analysis of Public Attitudes toward Nuclear Power Energy across 27 European Countries by Applying the Multilevel Model" Sustainability 10, no. 5: 1518. https://doi.org/10.3390/su10051518
Note that from the first issue of 2016, this journal uses article numbers instead of page numbers. See further details here.