Article

Classical Polarizable Force Field to Study Hydrated Hectorite: Optimization on DFT Calculations and Validation against XRD Data

1
UMR 8234 PHENIX, CNRS, Sorbonne Université, F-75005 Paris, France
2
IC2MP, UMR 7285 CNRS, Université de Poitiers, 5 rue Albert Turpain, Bât. B8, TSA 51106, 86073 Poitiers CEDEX 9, France
3
UMR 5275 ISTerre, CNRS, Université Grenoble Alpes, 38000 Grenoble, France
*
Author to whom correspondence should be addressed.
Minerals 2018, 8(5), 205; https://doi.org/10.3390/min8050205
Submission received: 7 March 2018 / Revised: 3 May 2018 / Accepted: 4 May 2018 / Published: 10 May 2018
(This article belongs to the Special Issue Molecular Simulation of Mineral-Solution Interfaces)

Abstract

:
Following our previous works on dioctahedral clays, we extend the classical Polarizable Ion Model (PIM) to trioctahedral clays, by considering dry Na-, Cs-, Ca- and Sr-hectorites as well as hydrated Na-hectorite. The parameters of the force field are determined by optimizing the atomic forces and dipoles on density functional theory calculations. The simulation results are validated by comparison with experimental X-ray diffraction (XRD) data. The XRD patterns calculated from classical molecular dynamics simulations performed with the PIM force field are in very good agreement with experimental results. In the bihydrated state, the less structured electronic density profile obtained with PIM compared to the one from the state-of-the-art non-polarizable force field clayFF explains the slightly better agreement between the PIM results and experiments.

1. Introduction

Clays are widely used in industrial applications and environmental contexts because of their remarkable retention properties. Molecular simulations provide a detailed understanding of the system at the atomic scale and constitute a complementary tool to experiments [1,2,3,4,5,6,7,8,9,10,11,12], analytical theories and modeling at larger scales [11,13,14,15,16,17,18,19,20,21]. They are based on the calculation of the interatomic interactions which are defined by a set of equations and parameters, the force-field. Several force-fields have been developed for clay/water systems which offered a realistic description of such systems at the atomic scale [22,23,24,25,26,27].
However, they do not account for the polarizability of the atoms and molecules, which can play an important role at the interface between the fluid and the charged layers and especially if the solution contains multivalent and/or ions with large radii [28,29,30]. We expect that taking the polarizability into account could provide new quantitative insights into the behavior of clays in the presence of water. In particular, the study of synthetic fluorohectorites with very well defined swelling behavior compared to natural clays (no interstratification) showed low water uptakes and diffusion coefficients which could not be reproduced by molecular dynamics simulations with existing force fields [9,31,32]. This suggests that the behavior of the fluid in clay nanopores could be rather different from the one obtained from molecular simulations and the role of the polarizability on the dynamics in clays was already pointed out in the literature [28]. We have recently extended the force field based on the Polarizable Ion Model (PIM) [33,34] to two neutral clays, talc and pyrophyllite, and a charged equivalent of the latter, a montmorillonite compensated by cations of various charge and size (Na + , Cs + , Ca 2 + and Sr 2 + ) [35,36]. The simulations performed with the PIM model were shown to give results equivalent or in better agreement with X-ray diffraction data than the ones performed with the popular and widely used force-field clayFF. In particular, the deformation of the clay layer and the layer-to-layer distances were better retrieved. Moreover we have shown that the PIM model could be transferred to other types of aluminosilicates such as zeolites [36].
In the present article, we focus on another type of clay mineral, an hydroxylated hectorite (OH-Ht). The studied hectorite is the charged equivalent of talc, with Na + , Cs + , Ca 2 + and Sr 2 + as counter-ions. The first results obtained in the presence of water are also presented. Talc and hectorite have a TOT structure: they are composed of two tetrahedral sheets of SiO 4 sandwiching an octahedral sheet of XO 4 (OH) 2 where X is a cation, here a magnesium Mg 2 + . The elementary cell of talc is Si 8 Mg 6 O 20 (OH) 4 . In hectorite, a fraction of Mg 2 + is substituted by cations of lower charge, here Li + . Thus, the elementary cell of hectorite is X x / n Si 8 Mg 6 x Li x O 20 (OH) 4 [31]. X is a cation of valence n which compensates the negative charge of the clay sheet.
In talc and hectorite (trioctahedral clays), all the octahedral sites present in the octahedral layers are occupied by a magnesium or a lithium whereas in pyrophyllite and montmorillonite (dioctahedral clays), only two thirds of the octahedral sites are occupied. As a consequence, the orientation of hydroxyl groups of the octahedral layer are different in these two types of clays. In the case of talc and hectorite, hydroxyl groups have their hydrogen atom pointing away from the surface of the clay layer as seen in Figure 1, which gives the possibility for water molecules to adsorb at low humidity by forming hydrogen bonds with the hydroxyl [6]: these hydrogen bonds are responsible for the hydrophilic property of talc at low relative humidity [37] which is not seen in the case of pyrophyllite or fuorotalc, which remain hydrophobic at all humidities [6,37]. In charged clays however, the ability of the cations to hydrate has a crucial influence on the interaction with water and explains why hectorites are hydrophilic and have similar swelling behaviours to other smectites such as montmorillonite [31,38].
In the present article, we determine the PIM parameters for an hectorite with a charge close to x = 0.7 . In the dry state, several counter-ions are considered: Na + , Cs + , Ca 2 + and Sr 2 + . In the hydrated state, we focus on the hectorite containing one or two layers of water (mono- and bihydrated states) with Na + as counterions. The PIM force field for the hydrated systems is then validated by comparison with X-ray diffraction (XRD) patterns. Indeed, combinations of molecular simulations and diffraction methods have been shown to provide constraints on the computed interlayer model and associated force field used to model clay-water systems [39]. Since both methods probe the periodic structures on the same length scale, their combination has allowed a deeper understanding of interlayer organization of water in smectites with different compositions or hydration states [7,40,41] as well as in the presence of organic molecules in the interlayer [42,43]. There exists relatively few computational studies of hydrated hectorites [10,44,45,46,47,48,49]. Our results were also compared with the simulation results given by the state-of-the-art force field ClayFF [27] and previous relevant studies.

2. Parametrization of PIM Force Field

2.1. Characteristics of the Polarizable Ion Model

In the PIM model, the potential energy is decomposed into four different terms:
V total = V Charge + V Dispersion + V Repulsion + V Polarization .
The charge term corresponds to the Coulomb interaction (here in atomic units) between two atoms,
V Charge = i < j q i q j r i j ,
where q i and q j are the charges of the atoms i and j respectively, and r i j is the distance between them. In PIM model, the formal charges are used: O 2 , OH , Mg 2 + , Al 3 + and Si 4 + contrary to non polarizable force-fields where partial charges are used to describe charge transfers in ionocovalent systems. Only the charge transfer within the hydroxyl group, of total charge −1, is modelled by partial charges on the corresponding atoms: O OH ( 2 δ ) and H OH ( 1 δ ) + with δ = + 0.8983 .
The dispersion term in Equation (1) is due to the instantaneous correlations of density fluctuations between the electronic clouds. It is given by [50,51,52]:
V Dispersion = i < j f 6 i j ( r i j ) C 6 i j ( r i j ) 6 + f 8 i j ( r i j ) C 8 i j ( r i j ) 8 ,
where C 6 i j and C 8 i j are the dipole-dipole and dipole-quadrupole dispersion coefficients. The Tang-Toennies damping function f n i j is used to correct the short-range interaction as [53]:
f n i j ( r i j ) = 1 e b n i j r i j k = 0 n ( b n i j r i j ) k k ! ,
where 1 / b n i j is the range of the damping.
The repulsion term in Equation (1) is modelled as:
V Repulsion = i < j A i j e B i j r i j ,
where A i j and B i j are two parameters.
Finally, the polarization term in Equation (1) contains three contributions: charge-dipole and dipole-dipole interactions, as well as the energy cost for deforming the electronic cloud of the atom:
V Polarization = i < j q i r i j · μ j r i j 3 g 4 i j ( r i j ) μ i · r i j q j r i j 3 g 4 j i ( r i j ) + μ i · μ j r i j 3 3 r i j · μ i r i j · μ j r i j 5 + i μ i 2 2 α i ,
where α i is the polarizability of ion i, μ i and μ j are the induced dipoles, g i j is the short-range correction to the multipolar expansion by the Tang-Toennies damping function:
g 4 i j ( r i j ) = 1 c i j e b D i j r i j k = 0 4 ( b D i j r i j ) k k ! .
The polarization term includes many-body electrostatic effects since the induced dipoles fluctuate along the simulation depending on the positions of all the ions. They are calculated at each molecular dynamic step by minimizing the polarization energy:
V Polarization μ α i = 0 .
The purpose of the present work is to derive the parameters of the PIM repulsion and polarization terms for the atomic interactions between cations, water and clay layers. Some of these parameters have already been determined in our previous studies: the interactions between the counter-ions and the atoms constituting the sheets of montmorillonites [35,36] and the interactions between Na + and water [54] are already known. The interactions parameters between water and clay have been determined in hydrated montmorillonites and constitute the subject of an article in preparation [55]. Moreover, the parameters for the dispersion term C 6 i j , C 8 i j and b n i j were taken from elsewhere [34,35]. Repulsive and dispersion interaction between cations were neglected due to the predominant strong electrostatic repulsion. In this study we focus on the repulsive and polarization interactions between the lithium present in the octahedral layers of hectorites and all the other atoms of the system. In the following, we briefly describe the procedure for obtaining the parameters from ab initio calculations, and refer the reader to our previous work [35] for a complete description.

2.2. Optimization Procedure

The optimization procedure aims at finding the set of parameters ( A i j , B i j , c i j and b D i j ) that minimize the error made in the classical calculation of the forces and dipoles with respect to a series of reference Density Functional Theory (DFT) calculations. To determine A i j and B i j parameters for the repulsion potential (Equation (5)) and c i j and b D i j parameters of the Tang-Toennies function (Equation (7)) for the polarization potential (Equation (6)), we used exactly the same process that was used previously [35,36]. The optimization procedure can be summarized as follows:
  • Generation of a series of representative configurations using classical molecular dynamics (MD)
  • DFT calculations on each of these configurations
    (i)
    Determination of the ground-state wavefunction, which provides the DFT forces
    (ii)
    Wannier localization [56,57,58,59], from which the DFT induced dipoles are calculated
  • Minimization of the error function on the dipoles χ Dipole 2 with respect to the parameters of the polarization term (V Polarization ) and of χ Force 2 with respect to the repulsion term (V Repulsion ):
    χ Dipoles 2 ( b D i j , c i j ) = 1 N conf 1 N atom conf atom | | μ classical μ DFT | | 2 | | μ DFT | | 2 ,
    χ Forces 2 ( A i j , B i j , b D i j , c i j ) = 1 N conf 1 N atom conf atom | | F classical F DFT | | 2 | | F DFT | | 2 ,
    where N conf is the number of configurations on which DFT calculations are performed, N atom is the number of atoms per configuration, μ classical are the dipoles obtained by classical molecular dynamics using a given set of parameters. F classical are the forces obtained by classical molecular dynamics.

2.3. Simulation Details

2.3.1. Dry Hectorites

Four hectorite boxes were used for the optimization of PIM parameters. For systems with monovalent counter-ions, they contained two clay layers of lateral dimensions 26.30 Å × 18.20 Å each, corresponding to ten unit cells of formula X 0.7 Si 8 Mg 5.3 Li 0.7 O 20 (OH) 4 with X = Na + or Cs + . For systems with divalent counter-ions, they contained two clay layers of lateral dimensions 21.04 Å × 18.20 Å each, corresponding to eight unit cells of formula X 0.75 / 2 Si 8 Mg 5.25 Li 0.75 O 20 (OH) 4 with X = Ca 2 + or Sr 2 + . The lithium cations were placed randomly in the octahedral sheet, with an exclusion rule preventing two substitutions from being adjacent. During the optimization, the layer-to-layer distances were fixed to 10 Å, typical values of dry layer-to-layer distances of smectites being situated between 9.5 and 10.5 Å [40,60,61,62,63] hectorite being no exception with a distance of about 9.7 Å for sodium cations [31,64]. To generate the initial trajectories from which the configurations used for the optimization are taken, the parameters for lithium interactions with clay oxygen atoms were chosen to be the same as between a hydrated Li + and water oxygen atoms [54]. The starting parameters between polarizable cations Ca 2 + , Sr 2 + , Cs + , Na + and the lithium charge, c Li Cation and b D Li Cation , were arbitrarily set to zero. The polarizability of Li was neglected [54]. All the other parameters were determined previously and can be found in Supplementary Materials.
Molecular dynamics (MD) simulations were performed with version 2.4 of CP2K simulation package [65]. Periodic boundary conditions were used in the three directions of space. The temperature T = 300 K was controlled via a Martyna et al. thermostat [66] with a time constant equal to 1 ps. Electrostatic interactions were computed using dipolar Ewald summation [33,67], with a tolerance of 10 7 . For each system we performed an equilibration of 50 ps using a time step of 0.5 fs. The last configuration was taken for the optimization. Thus, the optimization of lithium parameters was done on four configurations at the same time, each configuration containing a different counter-ion. We have shown previously that three configurations (with a number of atoms comparable to the present case) are sufficient to ensure convergence and that increasing the number of configurations does not change the parameters. In the present case, the fact that the counter-ions are different in the four configurations is not critical since the interactions which are crucial for describing Li + behavior are the repulsion (Equation (5)) and damping terms (Equation (7)) between Li + which is located in the middle of the sheet and its surrounding clay oxide anions.
Density functional theory (DFT) calculations were performed on these configurations with the PBE functional for all of the systems [68]. Goedecker-Teter-Hutter pseudopotentials [69,70,71] were used with DZVP plane-wave basis sets and an energy cutoff of at least 400 Ry. After determining the ground state wave functions, the forces acting on each atom were computed, and the dipoles were calculated from the Maximally Localized Wannier Functions (MLWFs) [71,72,73]. The numerical minimization of forces and dipoles were performed with the Minuit library [74].

2.3.2. Hydrated Na-Hectorite

For hydrated hectorites, we used the rigid Dang-Chang polarizable model for water [75]. The Dang-Chang model is a four-site model, the fourth site MW carrying the negative charge and the dipole of the molecule. The characteristics of the model are given in Table 1.
The PIM parameters for the hydrated cations have been determined previously and have shown to give excellent agreement with the experiment from the structural, thermodynamical and dynamical points of view [54]. This model has also been used to parametrize the PIM model in montmorillonite [55]. The SHAKE algorithm was used to enforce the rigidity of the water molecules [76].
The optimization of lithium parameters was done in the bihydrated state of the Na-hectorite, i.e., the interlayer spaces contained two layers of water. The charge and the lateral dimensions of the clay layers were the same as in the dry systems. The layer-to-layer distances were fixed to the experimental value of 15.51 Å corresponding to an hectorite of similar charge at 80% of humidity [31]. The number of water molecules per unit cell was fixed to the experimental value of 8.9, which corresponds to 178 water molecules in the box. To generate the initial trajectories from which the configurations used for the optimization were taken, the parameters for lithium interactions with water oxygen atoms were chosen to be the same as between a hydrated Li + in solution and water oxygen atoms [54].

2.4. Force Field Parameters

Figure 2 illustrates the comparison between the dipoles and the forces for one of the hydrated hectorite configurations calculated with the optimized classical force field and from the DFT calculations.
The corresponding error functions for the dehydrated and the bihydrated hectorite, χ Dipoles 2 and χ Forces 2 are shown in Table 2. Most of the errors on the forces come from the forces exerted on the aluminium, silicon, magnesium and apical oxygen atoms. All errors observed on the dipoles come from the oxygen atoms of the hydroxyl groups. χ Dipoles 2 and χ Forces 2 obtained with the dry hectorites are larger than those with the neutral clays [35] but similar to the errors found for dry montmorillonites from our previous work [36]. The errors on hydrated charged clays are larger, especially for the forces. χ Dipoles 2 and χ Forces 2 coming from the fit of the interactions between water and clay in hydrated montmorillonite were found to be 0.073 and 1.253 respectively [55]. These high relative errors are due to very small values of forces and dipoles. For hectorite, all the parameters were taken to be the same as in montmorillonite, except for Li. Indeed, we expect PIM to be transferable from one clay to another, as long as the environment of the atoms remains the same, which is not exactly the case since Mg 2 + represent only a part of the metallic cations in montmorillonite, whereas they are the majority in hectorite. As a consequence, keeping the parameters obtained on montmorillonite for hectorite leads to higher errors for hectorite. As shown below, the resulting force field is however able to capture the structural characteristics of the studied clays. All the parameters obtained for Li are summarized in Table 3.

3. Validation of the Force Field

In order to proceed to the validation of the force field, molecular dynamics simulations were performed with the parameters determined above. The validation was done by comparison with existing XRD data. For the hydrated systems, MD-generated XRD profiles were compared to experimental XRD patterns [31] obtained on a hydroxylated hectorite of similar charge.

3.1. Simulations Details

In order to obtain the characteristics of the unit cells in dry hectorites, simulations were performed with CP2K package [65] in the anisotropic NPT ensemble, after a phase of equilibration in the NVT ensemble. The pressure was fixed to 1 bar thanks to an extension of the Nosé-Hoover barostat developed by Martyna et al. [66] with barostat and thermostat time constants equal to 2 and 1 ps respectively. The other simulation details are the same as the ones used for the generation of configurations described above.
For hydrated hectorites, 1 ns production runs were performed in the NVT ensemble by fixing the layer-to-layer distances and the number of water molecules to the experimental values obtained by Dazas et al. [31] and corresponding to the conditions of relative humidity detailed in the experimental section below. The characteristics of the simulation boxes are given in Table 4.
For comparison, simulations were done on the same systems with the state-of-the-art nonpolarizable force field clayFF [27] and the TIP4P/2005 water model [77] which is one of the best models to describe the structural and dynamical behavior of water on a large range of pressure and temperature. The simulations with clayFF were performed with the LAMMPS package [78]. Periodic boundary conditions were used in the three directions of space. The temperature T = 300 K was controlled via a Nosé-Hoover style thermostat [79] with a time constant equal to 1 ps. Electrostatic interactions were computed using particle-particle particle-mesh solver [80], with an accuracy of 10 5 . The SHAKE algorithm was used to enforce the rigidity of the water molecules [76]. A realistic configuration was first generated with a home made Monte Carlo code in which clay layers are rigid. Then 5 ns runs were used for the analysis of the trajectories after 50 ps of equilibration.

3.2. XRD Materials and Methods

The hectorite sample with structural formula Na 0.72 Si 8 Mg 5.28 Li 0.72 O 20 (OH) 4 was synthesized hydrothermally from gel precursors in an externally heated Morey-type pressure vessel with an internal silver tubing [31,81]. Synthesis conditions were 400 C at 1 kbar P(H 2 O) during four weeks. The sample was then Na + -saturated at room temperature by contact with aqueous solutions of NaCl (1 mol/L) as described by Dazas et al. [31] Oriented slide was prepared by drying at room temperature an aqueous hectorite dispersion on a glass slide. Hectorite sample was initially equilibrated at 97% relative humidity (RH) over a saturated CuSO 4 solution before being transferred to the chamber and XRD patterns, leading to almost homogeneous 2W and 1W states, were collected at 80% and 28% RH, respectively [31]. At 80% RH, the dominant layer is the 2W state (97%) against 3 % for the 1W and 0% for the 0W. At 28% RH, the dominant layer is the 1W state (97%) against 3 % for the 2W and 0% for the 0W.
The algorithms developed initially by Sakharov and co-workers were used to calculate theoretical XRD profiles over the 2–50 2 θ CuK α range with a trial-and-error approach [82,83]. Instrumental and experimental factors such as horizontal and vertical beam divergences, goniometer radius, length, and thickness of the oriented slides were measured and introduced without further adjustment. The mass absorption coefficient ( μ *) was set to 45 cm 2 ·g 1 , as recommended [84]. Additional parameters include the layer-to-layer distance set as proposed by Dazas et al. [31] and the coherent scattering domain size along the c* axis, which was characterized by a maximum value, set to 50 layers, and by a variable mean value (N) [85]. N was taken equal to 6 and 5 in the 2W and the 1W state respectively. The z-coordinates of all atoms building up the 2:1 layer were set as determined for hectorite [86].
Calculations of XRD profiles were performed taking into account the hydration heterogeneities (proportion of 0W, 1W, and 2W layers) reported above. The interlayer species density profiles calculated from MD simulations were introduced for the dominant layer according to the methodology proposed elsewhere [7,39,40], whereas the interlayer configurations of the other layer types were set as described by Dazas et al. [31].

3.3. Results and Discussion

3.3.1. Dry Hectorites

The unit cell parameters obtained for the dry hectorite are summarized in Table 5. Few experimental data are available for hydroxylated hectorites containing other cations than Na + . However, the dimensions of the unit cells and the layer-to-layer distances can be compared with talc and other smectites. a, b and γ parameters which correspond to the dimensions of the unit cell in the plane of the clay sheet compare well with the experimental values obtained on talc. The c, α and β parameters are not directly comparable since their value will depend strongly on the arrangement of the counter-ions in between the clay layers. However, the layer-to-layer distance h obtained for Na-hectorite is identical to the value obtained by Bowers et al. [64] and Dazas et al. [31] from XRD patterns, h = 9.7 Å. The layer-to-layer distances for the other hectorites are close to the experimental values obtained on swelling clays with similar charges: 10.7–11.5 Å for smectites containing Cs + [60,61,88], 9.55–10.0 Å for smectites containing Ca 2 + [40,62,63], 9.8–10 Å for smectites containing Sr 2 + [40,62,63].
As for talc, the hexagonal cavity at the clay surface obtained with PIM is deformed as seen on Figure 1. As discussed elsewhere [36], the shape of the cavity could result in a smaller space for the cations, which may enter less deeply in the cavity. It explains the larger values of h found with PIM than with clayFF for the small cations (9.6 Å for Na and Ca-hectorite [48]), which cannot enter the cavity in the PIM case.

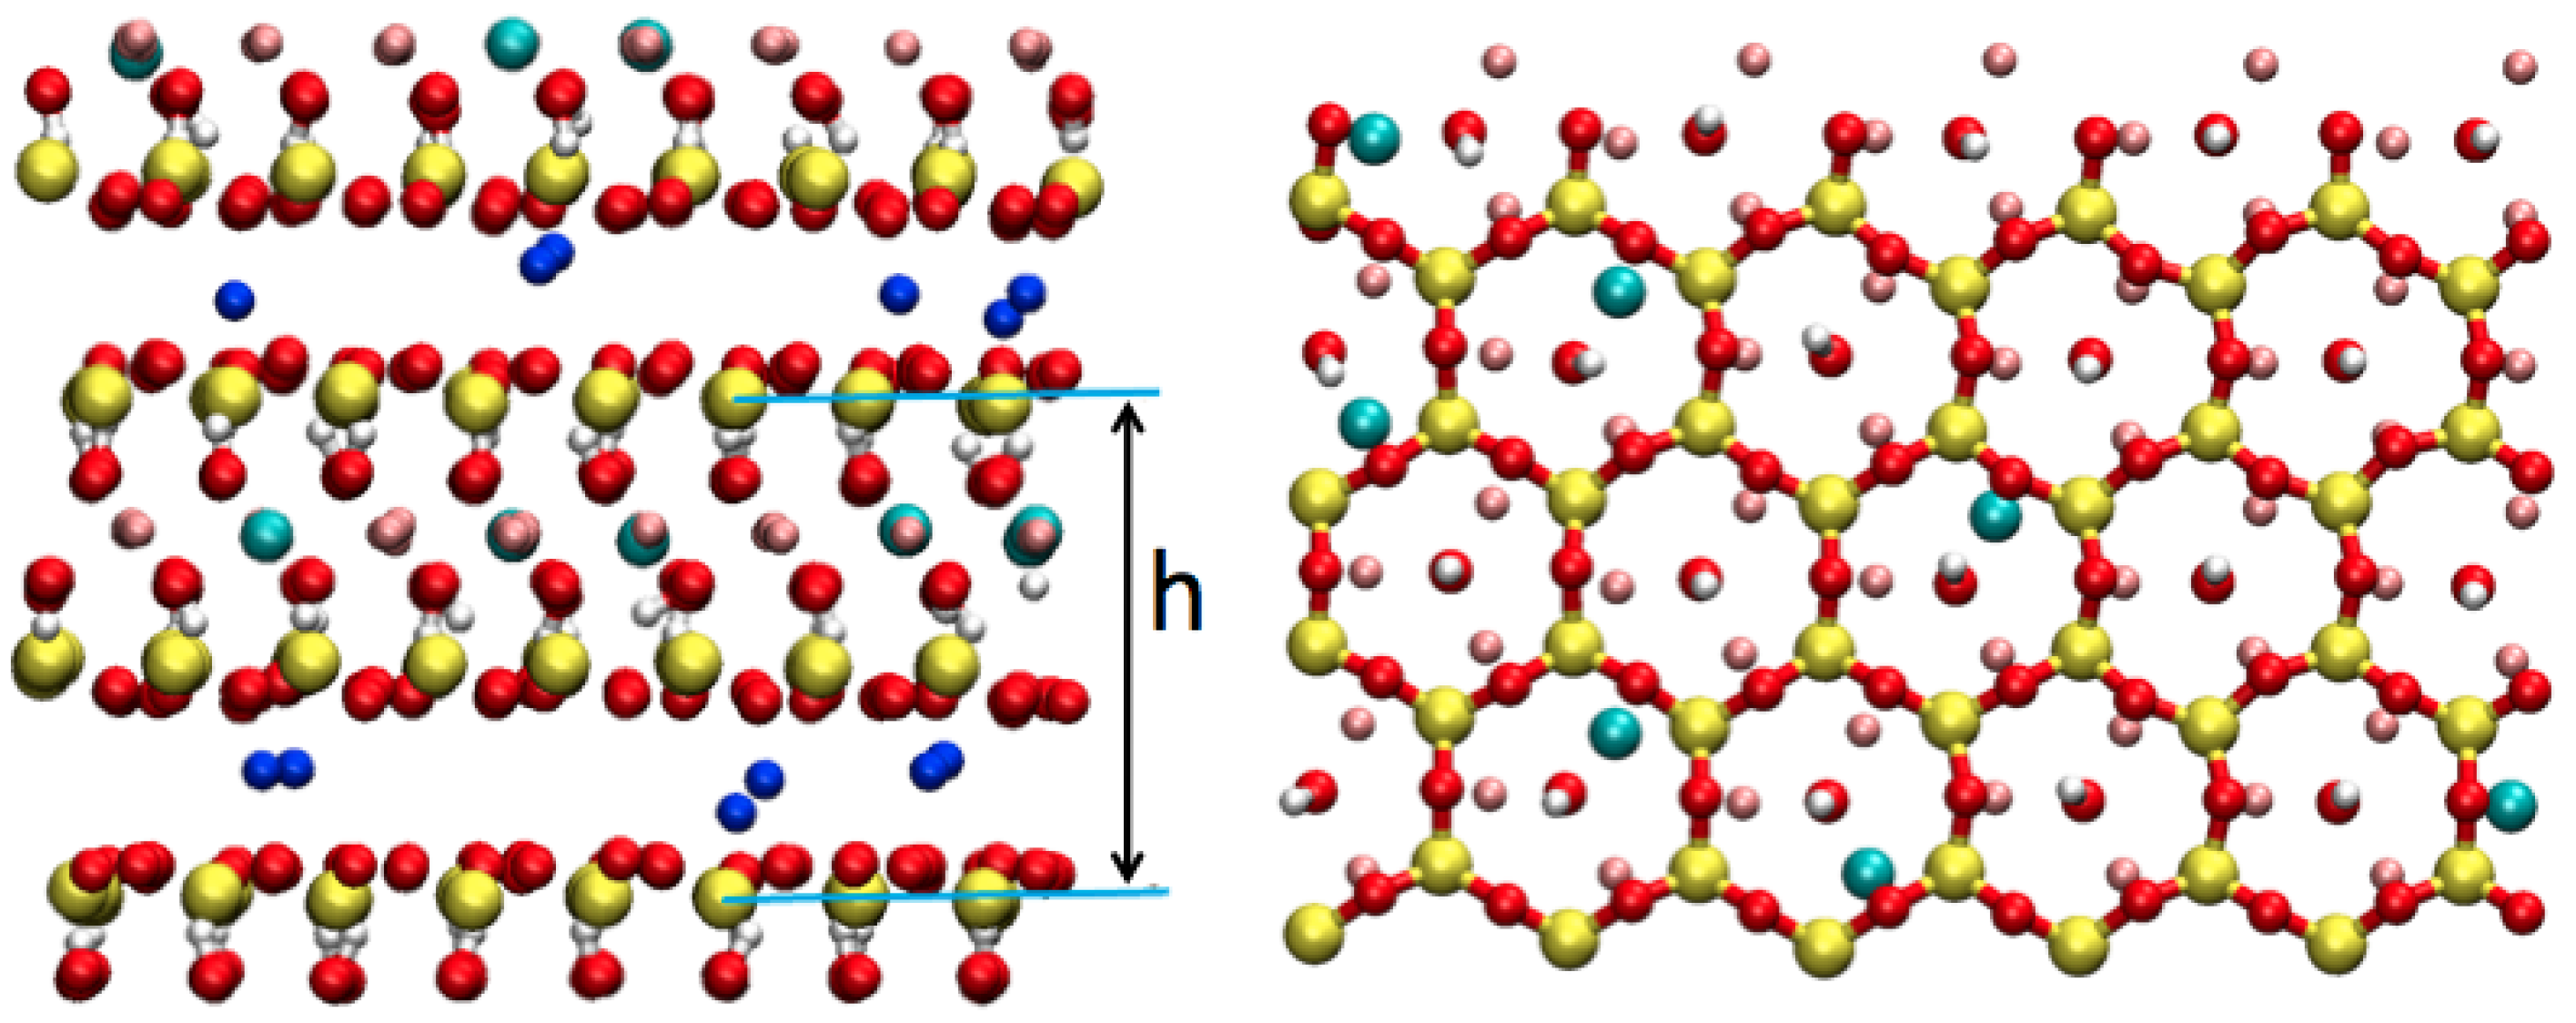
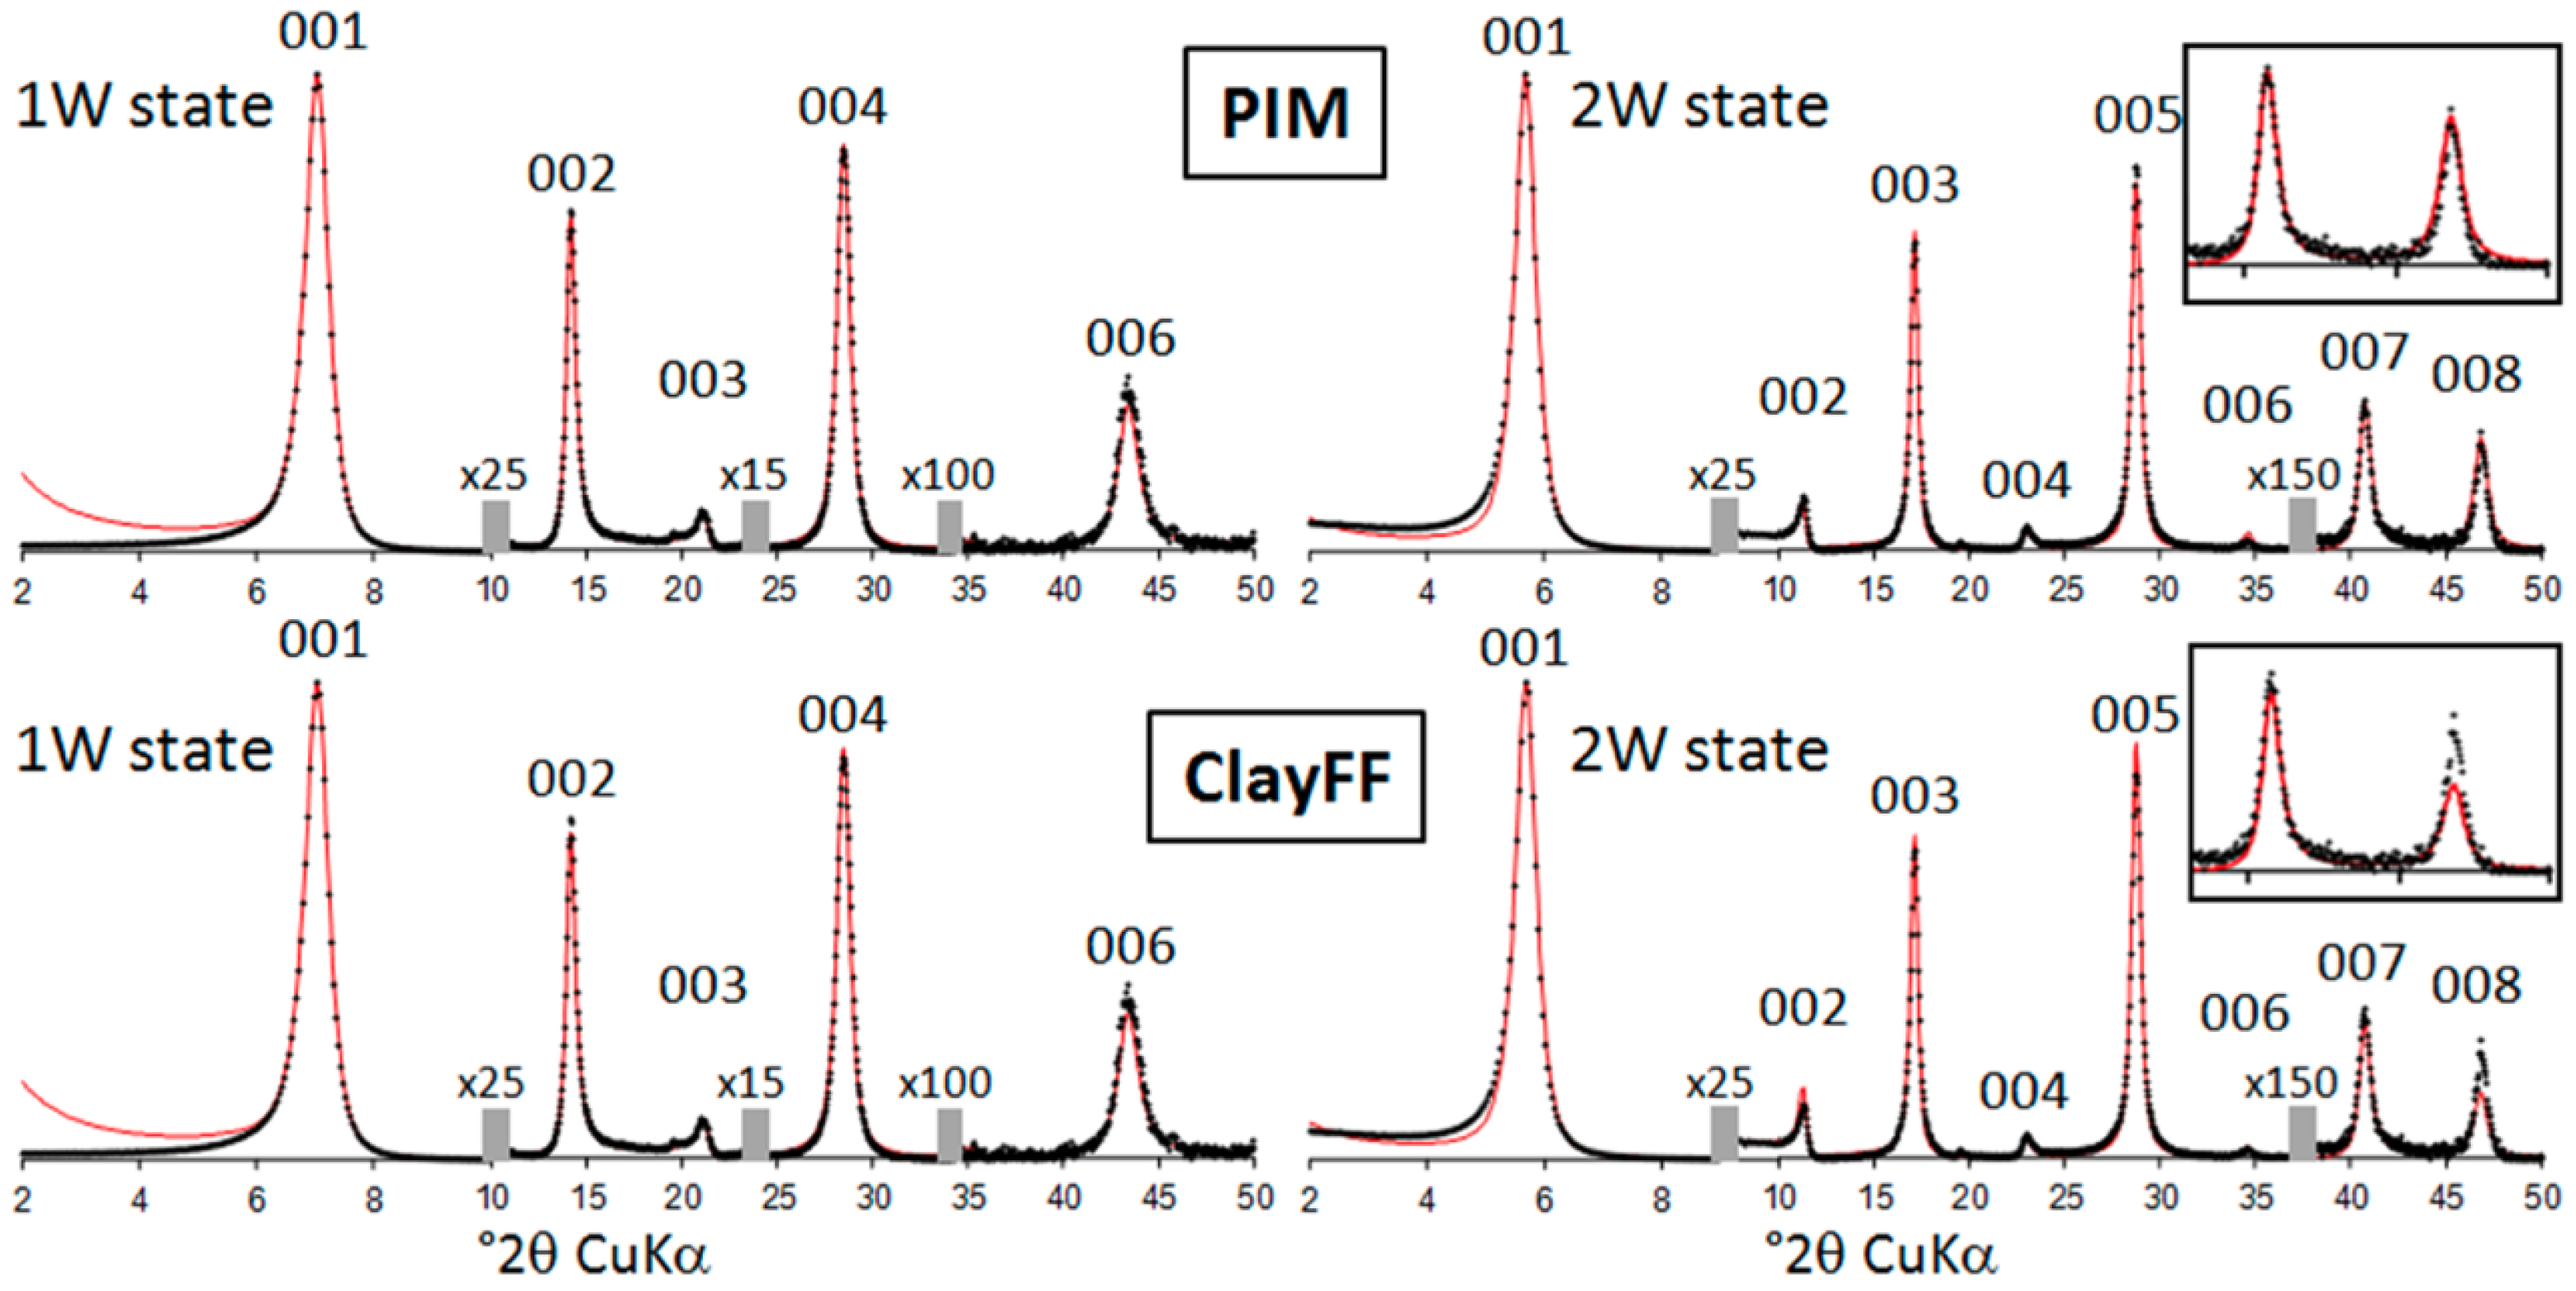
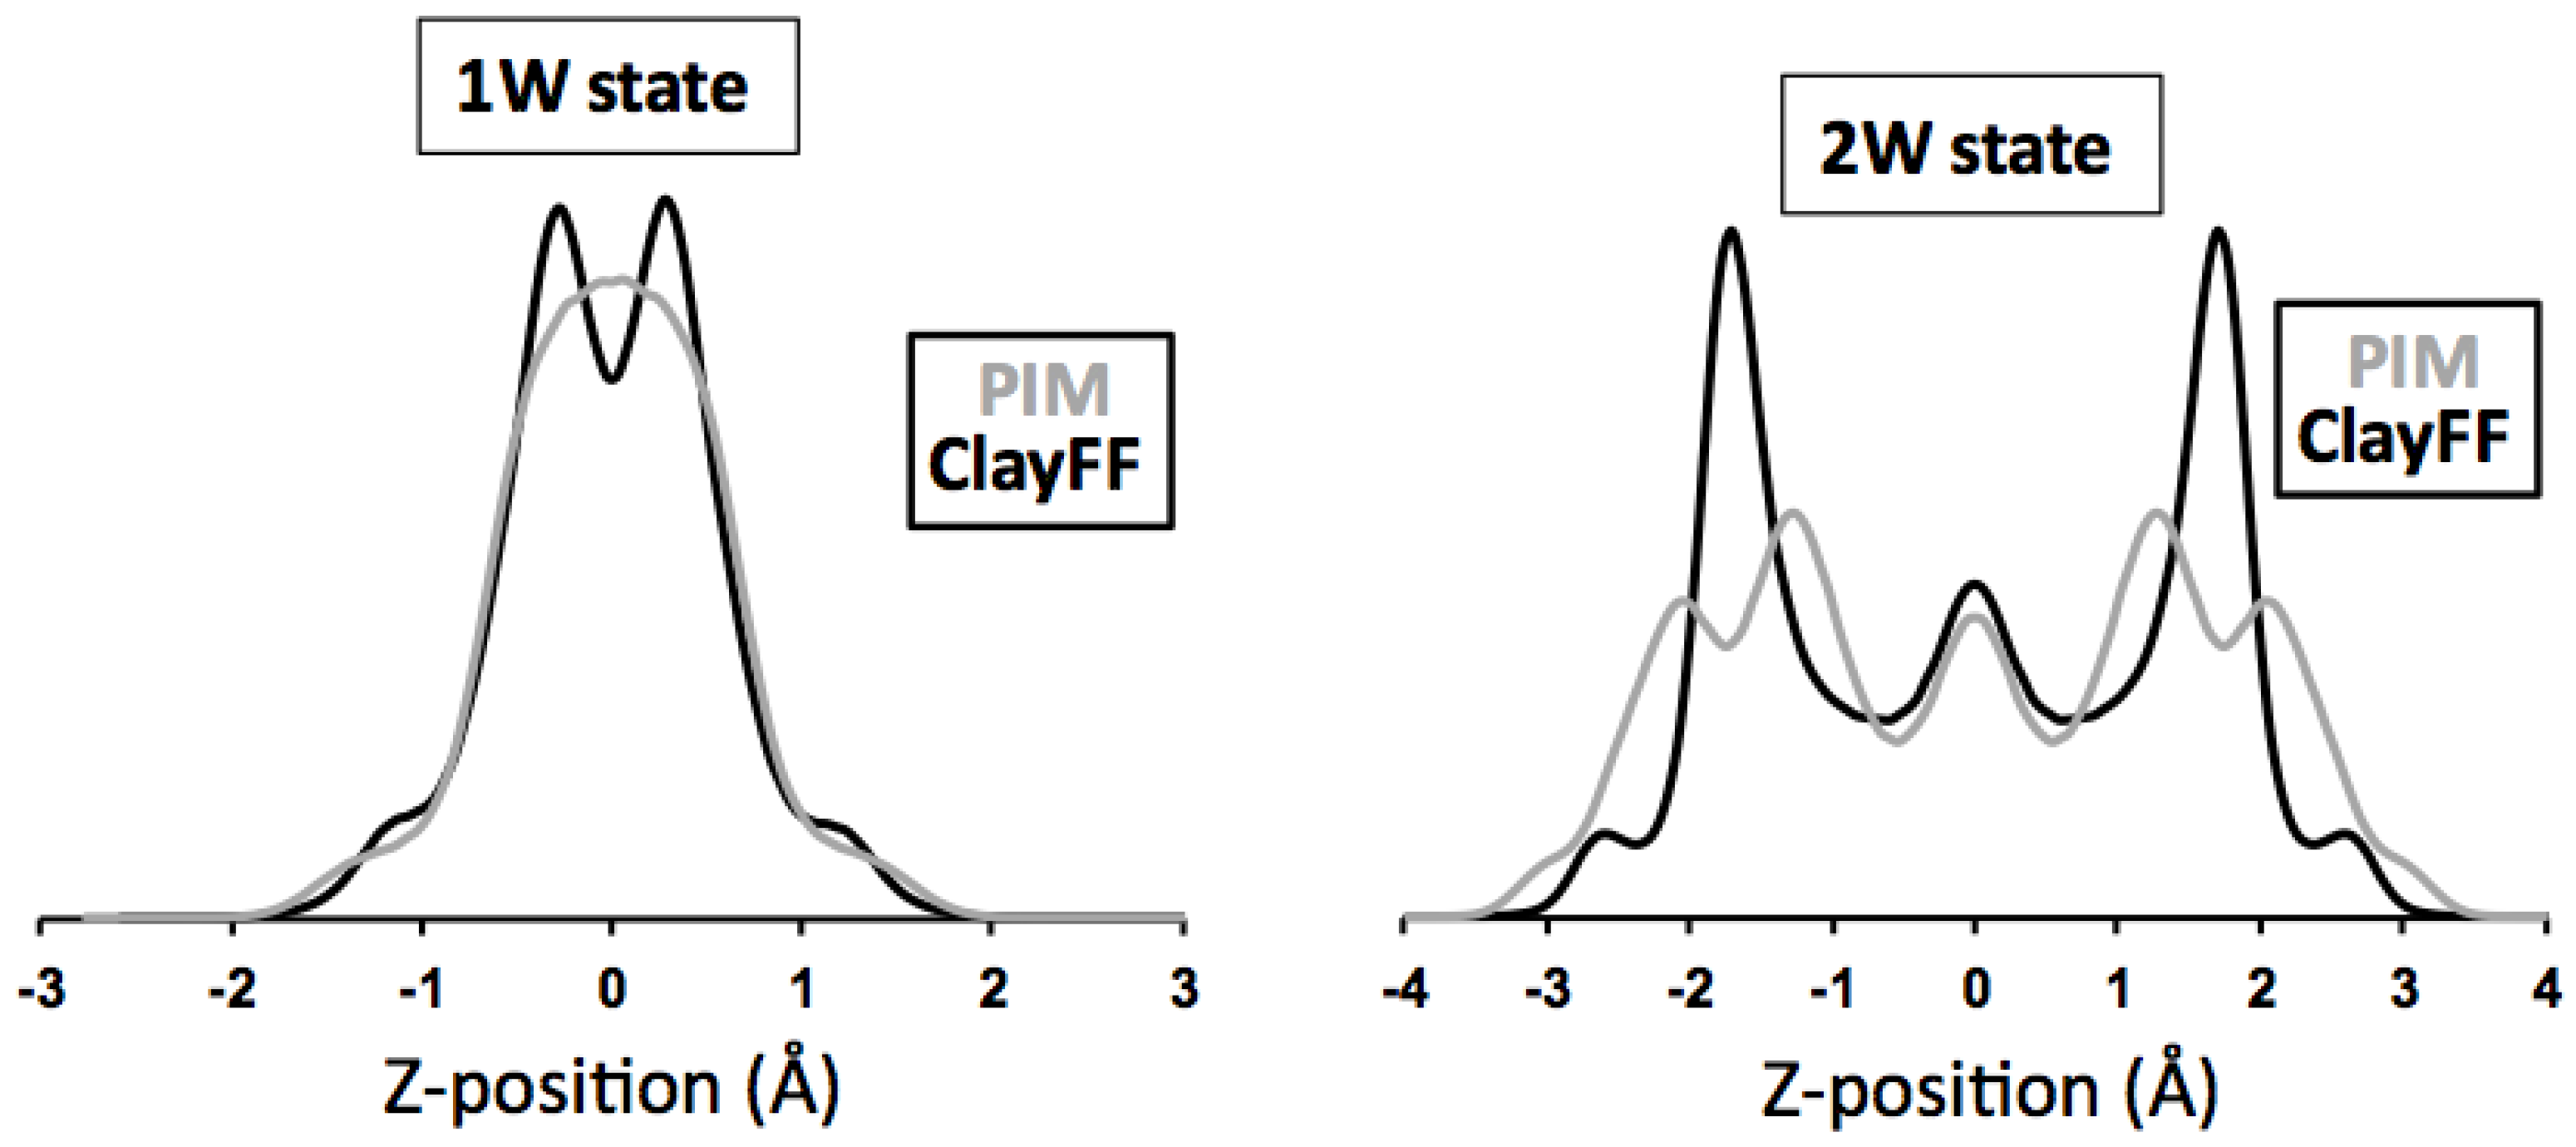
3.3.2. Hydrated Hectorites

Atomic density profiles along Z-axis obtained using PIM and ClayFF force field and made symmetric with respect to the mid-plane are compared in Figure 3. In the case of 1W hydration state, the interlayer distribution of water is similar, but the equilibrated positions for sodium cations display contrasted behavior. Using the PIM force field, interlayer cations are indeed found to remain on the interlayer mid-plane while they tend to be located closer to the clay surface for ClayFF model. For the 2W hydration state, the situation differs as sodium profiles are similar in both models. The interlayer equilibrium positions for water, however, are significantly different and display an increased broadening for the PIM model compared to the clayFF force field, which is clearly seen on the electronic density profiles of Figure 5.
Let us note that the density profiles obtained with ClayFF are every similar to the ones obtained in a previous study with ClayFF and the flexible SPC model [10].
Assessment of the obtained MD configurations from the comparison between experimental and MD-generated XRD profiles is shown in Figure 4 using the structure parameters detailed in the section “XRD materials and methods”. For this purpose, the interlayer atomic density profiles from MD simulations are divided into a series of individual atomic planes (separated by a δ Z of ∼0.05 Å) containing O, H, or Na as neutral atoms. No thermal fluctuation parameter is considered for these planes because the positional disorder related to temperature is accounted for in the optimized atomic configurations extracted from MD simulations. Comparison between MD-generated and experimental XRD patterns for the 1W hydration state show a good agreement for both PIM and ClayFF models despite the aforementioned difference in atomic Z-positions for cations (Figure 4). Because of the interaction of X-rays with electrons, XRD is extremely sensitive to the overall electronic density distribution and not to the nature of atomic species. The electronic density profile related to both models and compared in Figure 5 is calculated by summing, for each interlayer plane at a given Z-coordinate, the electronic content related to the amount and nature of atoms lying on this plane. As shown in Figure 5, the electronic density profile is principally governed by the distribution of O atoms and even though Na atoms contain a higher amount of electrons than O (i.e., 11 and 8 electrons for Na and O, respectively), the low Na content does not imply significant changes on the electronic profile, which are similar for both PIM and ClayFF models. More differences between MD-generated XRD profiles using PIM or ClayFF models can be noticed in the case of the 2W hydration state, in particular for the intensity ratio between the 007 and 008 reflections (Figure 4). Whereas a good fit is received for all other 00l reflections, the 008:007 intensity ratio is larger for PIM than for ClayFF model. As discussed previously by Ferrage et al. [7], the intensity ratio between these two high-order reflections strongly depends on the heterogeneous distribution of water molecules along Z-axis, an increase in positional disorder inducing a rise on the 008:007 intensity ratio. In agreement with this statement, the comparison of electronic density profile (Figure 5) for the 2W state shows that PIM model induces a more disordered organization of water molecules compared to the ClayFF force field, likely responsible for the slightly better reproduction of the experimental feature with this model.

3.4. Beyond Validation: Dynamics

To go further, in this paragraph we compare the dynamical properties obtained with clayFF and PIM.
The diffusion coefficients D were calculated as the slope of the parallel mean-squared displacement of the mobile species ( x 2 + y 2 ) as a function of time in a region where it is linear. Because of the low number of cations in the simulation box, the region was limited to [50–150] ps for Na + . For water molecules, the region between 100 and 300 ps was chosen.
We also calculated the intermittent residence time of water molecules around sodium cations. It consists in calculating the survival probability for a molecule to be found within a given distance d of the Na + :
P ( t ) = S I ( t ) S I ( 0 )
where S I ( t ) = 1 if the water molecule is present in the sphere of radius d centered around the sodium both at time 0 and t, and S I ( t ) = 0 otherwise. Such a definition allows for molecules to leave and come back into the sphere between 0 and t and characterizes an intermittent survival probability. d was taken as the position of the first minimum of OW-Na radial distribution functions, i.e., 3.3 Å. As a first approximation, P ( t ) can be fitted by a decreasing exponential exp ( t / τ ) where τ can be assimilated to a residence time within the sphere.
The water diffusion coefficients were found to be 1.2 × 10 9 m 2 ·s 1 and 9.4 × 10 10 m 2 ·s 1 for clayFF and PIM respectively: water diffuses around 20% more slowly with PIM than with clayFF. This result is encouraging since we found previously that in swelling clays, simulated water diffusion coefficients could be too high when compared to quasi-elastic neutron scattering data [9,32,89]. The sodium diffusion coefficients were found to be very close with the two force fields (5 × 10 10 and 4.5 × 10 10 m 2 ·s 1 for clayFF and PIM respectively). A previous simulation of Na-hectorite with a close water content (10 H 2 O per cation) gave smaller diffusion coefficients, with clayFF and flexible SPC water model: 1.5 × 10 10 m 2 ·s 1 for Na + and 4.8 × 10 10 m 2 ·s 1 for water [10]. These differences could come from the water model but also from the layer-to-layer distance, which was 15.1 Å in this study, around 0.4 Å smaller than in this work. Indeed it has been already shown that the layer-to-layer distance could greatly influence the diffusion coefficients [32].
Surprisingly, the intermittent residence time of water molecules around sodium cations was found to be smaller with PIM (48 ps) than with clayFF (80 ps). It can be concluded that the slowing down of water molecules is less due to the presence of the cations in the case of PIM than in the case of clayFF. The influence of the clay surfaces could be stronger in this case. This behavior could still differ more when changing the nature of the cation (more charged or polarizable cations); this will be the subject of future works.

4. Conclusions

In this work, we extend the PIM polarizable force field to hectorite clays, using the same procedure as previously for pyrophyllite, talc and montmorillonite. The structure of the atomic clay structure in dehydrated, 1W and 2W states was validated by direct comparison with XRD patterns obtained on the same systems. Such direct comparison between experimental and MD-generated XRD patterns shows that the atomic density profiles resulting from our PIM model and the very popular ClayFF model are in overall good agreement with the experimental data, but that the former more accurately reproduces features of the water distribution in the interlayer. Note that this approach is not sufficiently sensitive to assess the relative merits of the two force fields for Na or H atoms, due to their low amount in the unit cell and their low electronic content, respectively. Additional experimental data such as neutron diffraction on deuterated specimen could provide additional constraints on the validation of the atomic distribution of H atoms [7].
We now plan to extend this approach to fluorohectorites. When put in the presence of water, such synthetized clays show much less interstratification than natural samples [31,90]. As a consequence, almost pure mono- and bihydrated states can be obtained from the experimental point of view and direct comparison with molecular dynamics simulations is easier compared to natural clays [89]. The comparison between PIM results and existing structural and dynamical experimental data on this specific clay is the next step towards PIM validation.
We also plan to extend PIM to ions with large radii, the polarizability of which will play a crucial role on sorption properties. As we showed in this paper, the mechanisms of diffusion can be rather different from one force field to the next. The differences between PIM and non polarizable force fields could be enhanced in this case and change our understanding of these systems. This is especially important for applications like soil and ground water remediation or radioactive waste storage.

Supplementary Materials

The following are available online at https://www.mdpi.com/2075-163X/8/5/205/s1, Table S1: Parameters of the PIM force field for the interactions between clay atoms, Table S2: Parameters of the PIM force field for the interactions between counterions and clay atoms, Table S3: Parameters of the PIM force field for the interactions between water and the other atoms, Table S4: Atomic polarizabilities.

Author Contributions

R.H., S.T., M.S., B.R. and V.M. contributed to the optimization of the PIM force field; V.R. and V.M. performed the MD simulations with PIM and clayFF; B.D., E.F. and B.L. calculated the simulated XRD patterns and compared with experiment.

Acknowledgments

R.H. and V.M. acknowledge financial support from NEEDS-MIPOR via project TRANSREAC, V.R. from BRGM and IRSN, S.T. from Labex MiChem. We also thank the Direction des Systèmes d’Information of Jussieu for access to computational resources.

Conflicts of Interest

The authors declare no conflict of interest.

References

  1. Greathouse, J.A.; Stellalevinsohn, H.R.; Denecke, M.A.; Bauer, A.; Pabalan, R.T. Uranyl surface complexes in a mixed-charge montmorillonite: Monte Carlo computer simulation and polarized XAFS results. Clays Clay Miner. 2005, 53, 278–286. [Google Scholar] [CrossRef]
  2. Tambach, T.J.; Bolhuis, P.G.; Hensen, E.J.M.; Smit, B. Hysteresis in clay swelling induced by hydrogen bonding: Accurate prediction of swelling states. Langmuir 2006, 22, 1223–1234. [Google Scholar] [CrossRef] [PubMed]
  3. Rotenberg, B.; Morel, J.-P.; Marry, V.; Turq, P.; Morel-Desrosiers, N. On the driving force of cation exchange in clays: Insights from combined microcalorimetry experimnets and molecular simulation. Geochim. Cosmochim. Acta 2009, 73, 4034–4044. [Google Scholar] [CrossRef]
  4. Malikova, N.; Dubois, E.; Marry, V.; Rotenberg, B.; Turq, P. Dynamics in clays—Combining neutron scattering and microscopic simulation. Z. Phys. Chem. 2010, 224, 153–181. [Google Scholar] [CrossRef]
  5. Anderson, R.L.; Ratcliffe, I.; Greenwell, H.C.; Williams, P.A.; Cliffe, S.; Coveney, P.V. Clay swelling—A challenge in the oilfield. Earth Sci. Rev. 2010, 98, 201–216. [Google Scholar] [CrossRef]
  6. Rotenberg, B.; Patel, A.J.; Chandler, D. Molecular explanation for why talc surfaces can be both hydrophilic and hydrophobic. J. Am. Chem. Soc. 2011, 133, 20521–20527. [Google Scholar] [CrossRef] [PubMed]
  7. Ferrage, E.; Sakharov, B.A.; Michot, L.J.; Delville, A.; Bauer, A.; Lanson, B.; Grangeon, S.; Frapper, G.; Jiménez-Ruiz, M.; Cuello, G.J. Hydration properties and interlayer organization of water and ions in synthetic Na-smectite with tetrahedral layer charge. Part 2. Toward a precise coupling between molecular simulations and diffraction data. J. Phys. Chem. C 2011, 115, 1867–1881. [Google Scholar] [CrossRef]
  8. Michot, L.J.; Ferrage, E.; Jiménez-Ruiz, M.; Boehm, M.; Delville, A. Anisotropic features of water and ion dynamics in synthetic Na- and Ca-smectites with tetrahedral layer charge. A combined quasi-elastic neutron-scattering and molecular dynamics simulations study. J. Phys. Chem. C 2012, 116, 16619–16633. [Google Scholar] [CrossRef]
  9. Marry, V.; Dubois, E.; Malikova, N.; Breu, J.; Haussler, W. Anisotropy of water dynamics in clays: Insights from molecular simulations for experimental QENS analysis. J. Phys. Chem. C 2013, 117, 15106–15115. [Google Scholar] [CrossRef]
  10. Morrow, C.P.; Yazaydin, A.Ö.; Krishnan, M.; Bowers, G.M.; Kalinichev, A.G.; Kirkpatrick, R.J. Structure, energetics and dynamics of smectite clay interlayer hydration: Molecular dynamics and metadynamics investigation of Na-hectorite. J. Phys. Chem. C 2013, 117, 5172–5187. [Google Scholar] [CrossRef]
  11. Churakov, S.V.; Gimmi, T.; Unruh, T.; Van Loon, L.R.; Juranyi, F. Resolving diffusion in clay minerals at different time scales: Combination of experimental and modeling approach. Appl. Clay Sci. 2014, 96, 36–44. [Google Scholar] [CrossRef]
  12. Porion, P.; Warmont, F.; Faugère, A.-M.; Rollet, A.-L.; Dubois, E.; Marry, V.; Michot, L.J.; Delville, A. 133Cs nuclear magnetic resonance relaxometry as a probe of the mobility of cesium cations confined within dense clay sediments. J. Phys. Chem. C 2015, 119, 15360–15372. [Google Scholar] [CrossRef]
  13. Rotenberg, B.; Marry, V.; Dufrêche, J.-F.; Malikova, N.; Giffaut, E.; Turq, P. Modelling water and ion diffusion in clays: A multiscale approach. C. R. Chim. 2007, 10, 1108–1116. [Google Scholar] [CrossRef]
  14. Tournassat, C.; Chapron, Y.; Leroy, P.; Bizi, M.; Boulahya, F. Comparison of molecular dynamics simulations with triple layer and modified Gouy-Chapman models in a 0.1 M NaCl-montmorillonite system. J. Colloid Interface Sci. 2009, 339, 533–541. [Google Scholar] [CrossRef] [PubMed]
  15. Jardat, M.; Dufrêche, J.-F.; Rotenberg, B.; Marry, V.; Rotenberg, B.; Turq, B. Salt exclusion in charged porous media: A coarse-graining strategy in the case of montmorillonite clays. Phys. Chem. Chem. Phys. 2009, 11, 2023–2033. [Google Scholar] [CrossRef] [PubMed]
  16. Bourg, I.C.; Sposito, G. Connecting the molecular scale to the continuum scale for diffusion processes in smectite-rich porous media. Environ. Sci. Technol. 2010, 44, 2085–2091. [Google Scholar] [CrossRef] [PubMed]
  17. Hedström, M.; Karnland, O. Donnan equilibrium in Na-montmorillonite from a molecular dynamics perspective. Geochim. Cosmochim. Acta 2012, 77, 266–274. [Google Scholar] [CrossRef]
  18. Boţan, A.; Marry, V.; Rotenberg, B.; Turq, P.; Noetinger, B. How electrostatics influences hydrodynamic boundary conditions: Poiseuille and electro-osmostic flows in clay nanopores. J. Phys. Chem. C 2013, 117, 978–985. [Google Scholar] [CrossRef]
  19. Ebrahimi, D.; Whittle, A.J.; Pellenq, R.J.M. Mesoscale properties of clay aggregates from potential of mean force representation of interactions between nanoplatelets. J. Chem. Phys. 2014, 140, 154309. [Google Scholar] [CrossRef]
  20. Tinnacher, R.M.; Holmboe, M.; Tournassat, C.; Bourg, I.C.; Davis, J.A. Ion adsorption and diffusion in smectite: Molecular, pore, and continuum scale views. Geochim. Cosmochim. Acta 2016, 177, 130–149. [Google Scholar] [CrossRef]
  21. Bacle, P.; Dufrêche, J.-F.; Rotenberg, B.; Bourg, I.C.; Marry, V. Modeling the transport of water and ionic tracers in a micrometric clay sample. Appl. Clay Sci. 2016, 123, 18–28. [Google Scholar] [CrossRef]
  22. Skipper, N.T.; Refson, K.; McConnell, J.D.C. Computer calculation of water-clay interactions using atomic pair potentials. Clay Miner. 1989, 24, 411–425. [Google Scholar] [CrossRef]
  23. Delville, A. Structure and properties of confined liquids: A molecular model of the clay-water interface. J. Phys. Chem. 1993, 97, 9703–9712. [Google Scholar] [CrossRef]
  24. Skipper, N.T.; Chang, F.-R.C.; Sposito, G. Monte Carlo simulation of interlayer molecular structure in swelling clay minerals. I: Methodology. Clays Clay Miner. 1995, 43, 285–293. [Google Scholar] [CrossRef]
  25. Teppen, B.J.; Rasmussen, K.; Bertsch, P.M.; Miller, D.M.; Schäfer, L. Molecular dynamics modeling of clay minerals: 1. Gibbsite, kaolinite, pyrophyllite and beidellite. J. Phys. Chem. B 1997, 101, 1579–1587. [Google Scholar] [CrossRef]
  26. Sainz-Diaz, C.I.; Hernández-Laguna, A.; Dove, M.T. Modeling of dioctahedral 2:1 phyllosilicates by means of transferable empirical potentials. Phys. Chem. Miner. 2001, 28, 130–141. [Google Scholar] [CrossRef]
  27. Cygan, R.T.; Liang, J.-J.; Kalinichev, A.G. Molecular models of hydroxide, oxyhydroxide, and clay phases and the development of a general force field. J. Phys. Chem. B 2004, 108, 1255–1266. [Google Scholar] [CrossRef]
  28. Reddy, U.V.; Bowers, G.M.; Loganathan, N.; Bowden, M. Water structure and dynamics in smectites: X-ray diffraction and 2H NMR spectroscopy of Mg-, Ca-, Sr-, Na-, Cs-, and Pb-hectorite. J. Phys. Chem. C 2016, 120, 8863–8876. [Google Scholar] [CrossRef]
  29. Lopes, P.E.M.; Roux, B.; MacKerell, A.D. Molecular modeling and dynamics studies with explicit inclusion of electronic polarizability: Theory and applications. Theor. Chem. Acc. 2009, 124, 11–28. [Google Scholar] [CrossRef] [PubMed]
  30. Cieplak, P.; Dupradeau, F.-Y.; Duan, Y.; Wang, J. Polarization effects in molecular mechanical force fields. J. Phys. Condens. Matter 2009, 21, 333102. [Google Scholar] [CrossRef] [PubMed]
  31. Dazas, B.; Lanson, B.; Breu, J.; Robert, J.-L.; Pelletier, M.; Ferrage, E. Smectite fluorination and its impact on interlayer water content and structure: A way to fine tune the hydrophilicity of clay surfaces? Microporous Mesoporous Mater. 2013, 181, 233–247. [Google Scholar] [CrossRef]
  32. Marry, V.; Dubois, E.; Malikova, N.; Durand-Vidal, S.; Longeville, S.; Breu, J. Water dynamics in hectorite clays: Influence of temperature studied by coupling neutron spin echo and molecular dynamics. Environ. Sci. Technol. 2011, 45, 2850–2855. [Google Scholar] [CrossRef] [PubMed]
  33. Aguado, A.; Bernasconi, L.; Jahn, S.; Madden, P.A. Multipoles and interaction potentials in ionic materials from planewave-DFT calculations. Faraday Discuss. 2003, 124, 171–184. [Google Scholar] [CrossRef] [PubMed]
  34. Jahn, S.; Madden, P.A. Modeling earth materials from crustal to lower mantle conditions: A transferable set of interaction potentials for the CMAS system. Phys. Earth Planet. Inter. 2007, 162, 129–139. [Google Scholar] [CrossRef]
  35. Tesson, S.; Salanne, M.; Rotenberg, B.; Tazi, S.; Marry, V. A classical polarizable force field for clays: Pyrophyllite and talc. J. Phys. Chem. C 2016, 120, 3749–3758. [Google Scholar] [CrossRef]
  36. Tesson, S.; Louisfrema, W.; Salanne, M.; Boutin, A.; Rotenberg, B.; Marry, V. Classical polarizable force field to study dry charged clays and zeolites. J. Phys. Chem. C 2017, 121, 9833–9846. [Google Scholar] [CrossRef]
  37. Michot, L.J.; Villieras, F.; François, M.; Yvon, F.; Le Dred, R.; Cases, J.M. The structural microscopic hydrophilicity of talc. Langmuir 1994, 10, 3765–3773. [Google Scholar] [CrossRef]
  38. Brigatti, M.F.; Galan, E.; Theng, B.K.G. Handbook of clay science—Structures and Mineralogy of Clay Minerals. Dev. Clay Sci. 2006, 2, 19–86. [Google Scholar]
  39. Ferrage, E. Investigation of the interlayer organization of water and ions in smectite from the combined use of diffraction experiments and molecular simulations. A review of methodology, applications and perspectives. Clays Clay Miner. 2016, 64, 346–371. [Google Scholar] [CrossRef]
  40. Ferrage, E.; Lanson, B.; Malikova, N.; Plançon, A.; Sakharov, B.; Drits, V.A. New insights on the distribution of interlayer water in bi-hydrated smectite from x-ray diffraction profile modeling of 00l reflections. Chem. Mater. 2005, 17, 3499–3512. [Google Scholar] [CrossRef] [Green Version]
  41. Dazas, B.; Ferrage, E.; Delville, A.; Lanson, B. Interlayer structure model of tri-hydrated low-charge smectite by X-ray diffraction and Monte Carlo modeling in the grand canonical ensemble. Am. Miner. 2014, 99, 1724–1735. [Google Scholar] [CrossRef]
  42. Szczerba, M.; Kalinichev, A.G. Intercalation of ethylene glycol in smectites: Several molecular simulation models verified by X-ray diffraction data. Clays Clay Miner. 2016, 64, 488–502. [Google Scholar] [CrossRef]
  43. Szczerba, M.; Ufer, K. New model of ethylene glycol intercalate in smectites for XRD modeling. Appl. Clay Sci. 2018, 153, 113–123. [Google Scholar] [CrossRef]
  44. Greathouse, J.; Sposito, G. Monte Carlo and Molecular Dynamics Studies of Interlayer Structure in Li(H2O)3-Smectites. J. Phys. Chem. B 1998, 102, 2406–2414. [Google Scholar] [CrossRef]
  45. Sutton, R.; Sposito, G. Molecular Simulation of Interlayer Structure and Dynamics in 12.4 Å Cs-Smectite Hydrates. J. Colloid Interface Sci. 2001, 237, 174–184. [Google Scholar] [CrossRef] [PubMed]
  46. Sutton, R.; Sposito, G. Animated molecular dynamics simulations of hydrated caesium-smectite interlayers. Geochem. Trans. 2002, 3, 73–80. [Google Scholar] [CrossRef]
  47. Greathouse, J.A.; Hart, D.B.; Bowers, G.M.; Kirkpatrick, R.J.; Cygan, R.T. Molecular Simulation of Structure and Diffusion at Smectite?Water Interfaces: Using Expanded Clay Interlayers as Model Nanopores. J. Phys. Chem. C 2015, 119, 17126–17136. [Google Scholar] [CrossRef]
  48. Loganathan, N.; Yazaydin, A.Ö.; Bowers, G.M.; Kalinichev, A.G.; Kirkpatrick, R.J. Cation and Water Structure, Dynamics, and Energetics in Smectite Clays: A Molecular Dynamics Study of Ca-Hectorite. J. Phys. Chem. C 2016, 120, 12429–12439. [Google Scholar] [CrossRef]
  49. Loganathan, N.; Yazaydin, A.Ö.; Bowers, G.M.; Kalinichev, A.G.; Kirkpatrick, R.J. Structure, Energetics, and Dynamics of Cs+ and H2O in Hectorite: Molecular Dynamics Simulations with an Unconstrained Substrate Surface. J. Phys. Chem. C 2016, 120, 10298–10310. [Google Scholar] [CrossRef]
  50. Fumi, F.G.; Tosi, M.P. Ionic sizes and born repulsive parameters in the nacl-type alkali halides—I: The huggins-mayer and pauling forms. J. Phys. Chem. Solids 1964, 25, 31–43. [Google Scholar] [CrossRef]
  51. Tosi, M.P.; Fumi, F.G. Ionic sizes and born repulsive parameters in the nacl-type alkali halides—II: The generalized huggins-mayer form. J. Phys. Chem. Solids 1964, 25, 45–52. [Google Scholar] [CrossRef]
  52. Wang, B.; Truhlar, D.G. Including charge penetration effects in molecular modeling. J. Chem. Theory Comput. 2010, 6, 3330–3342. [Google Scholar] [CrossRef] [PubMed]
  53. Tang, K.T.; Toennies, J.P. An improved simple model for the van der waals potential based on universal damping functions for the dispersion coefficients. J. Chem. Phys. 1984, 80, 3726–3741. [Google Scholar] [CrossRef]
  54. Tazi, S.; Molina, J.J.; Rotenberg, B.; Turq, P.; Vuilleumier, R.; Salanne, M. A transferable ab initio based force field for aqueous ions. J. Chem. Phys. 2012, 136, 114507. [Google Scholar] [CrossRef] [PubMed]
  55. Tesson, S.; Louisfrema, W.; Ferrage, E.; Rotenberg, B.; Salanne, M.; Boutin, A.; Marry, V. Classical polarizable force field to study hydrated charged clays and zeolites. 2018; submitted. [Google Scholar]
  56. Silvestrelli, P.L.; Parrinello, M. Water molecule dipole in the gas and in the liquid phase. Phys. Rev. Lett. 1999, 82, 3308–3311. [Google Scholar] [CrossRef]
  57. Bernasconi, L.; Wilson, M.; Madden, P.A. Cation polarizability from first-principles: Sn2+. Comput. Mater. Sci. 2001, 22, 94–98. [Google Scholar] [CrossRef]
  58. Bernasconi, L.; Madden, P.A.; Wilson, M. Ionic to molecular transition in AlCl3: An examination of the electronic structure. PhysChemComm 2002, 5, 1–11. [Google Scholar] [CrossRef]
  59. Souza, I.; Wilkens, T.; Martin, R.T. Polarization and localization in insulators: Generating function approach. Phys. Rev. B 2000, 62, 1666–1683. [Google Scholar] [CrossRef]
  60. Bérend, I.; Cases, J.M.; François, M.; Uriot, J.P.; Michot, L.J.; Masion, A.; Thomas, F. Mechanism of adsorption and desorption of water vapor by homoionic montmorillonites: 2. The Li+, Na+, K+, Rb+, and Cs+ exchanged forms. Clay Clay Miner. 1995, 43, 324–336. [Google Scholar] [CrossRef]
  61. Besson, G.; Glaeser, R.; Tchoubar, C. Le cesium, révélateur de structure des smectites. Clay Miner. 1983, 18, 11–19. [Google Scholar] [CrossRef]
  62. Cases, J.M.; Berend, I.; Francois, M.; Uriot, J.P.; Michot, L.J.; Thomas, F. Mechanism of adsorption and desorption of water vapor by homoionic montmorillonite. 3. The Mg2+, Ca2+, Sr2+ and Ba2+ exchanged forms. Clays Clay Miner. 1997, 45, 8–22. [Google Scholar] [CrossRef]
  63. Ferrage, E.; Lanson, B.; Sakharov, B.; Drits, V.A. Investigation of smectite hydration properties by modeling experimental x-ray diffraction patterns: Part I. Montmorillonite hydration properties. Am. Mineral. 2005, 90, 1358–1374. [Google Scholar] [CrossRef]
  64. Bowers, G.M.; Singer, J.W.; Bish, D.L.; Kirkpatrick, R.J. Alkali metal and H2O dynamics at the smectite/water interface. J. Phys. Chem. C 2011, 115, 23395–23407. [Google Scholar] [CrossRef]
  65. CP2K Developers Group. Available online: http://cp2k.berlios.de (accessed on 19 November 2016).
  66. Martyna, G.J.; Klein, M.L.; Tuckerman, M. Nosé-Hoover chains: The canonical ensemble via continuous dynamics. J. Chem. Phys. 1992, 97, 2635–2643. [Google Scholar] [CrossRef]
  67. Laino, T.; Hutter, J. Notes on “Ewald summation of electrostatic multipole interactions up to quadrupolar level” [J. Chem. Phys.119, 7471 (2003)]. J. Chem. Phys. 2008, 129, 074102. [Google Scholar] [CrossRef] [PubMed] [Green Version]
  68. Perdew, J.P.; Burke, K.; Ernzerhof, M. Generalized gradient approximation made simple. Phys. Rev. Lett. 1996, 77, 3865–3868. [Google Scholar] [CrossRef] [PubMed]
  69. Goedecker, S.; Teter, M.; Hutter, J. Separable dual-space gaussian pseudopotentials. Phys. Rev. B 1996, 54, 1703–1710. [Google Scholar] [CrossRef]
  70. Hartwigsen, C.; Goedecker, S.; Hutter, J. Relativistic separable dual-space gaussian pseudopotentials from h to rn. Phys. Rev. B 1998, 58, 3641–3662. [Google Scholar] [CrossRef]
  71. Krack, M. Pseudopotentials for h to kr optimized for gradient-corrected exchange-correlation functionals. Theor. Chem. Acc. 2005, 114, 145–152. [Google Scholar] [CrossRef]
  72. Silvestrelli, P.L. Maximally localized wannier functions for simulations with supercells of general symmetry. Phys. Rev. B 1999, 59, 9703–9706. [Google Scholar] [CrossRef]
  73. Marzari, N.; Souza, I.; Vanderbilt, D. An introduction to maximally-localized wannier functions. Psi-K Newsl. 2003, 57, 129–166. [Google Scholar]
  74. James, F.; Roos, M. Minuit—A system for function minimization and analysis of the parameter errors and correlations. Comput. Phys. Commun. 1975, 10, 343–367. [Google Scholar] [CrossRef]
  75. Dang, L.X.; Chang, T.-M. Molecular dynamics study of water clusters, liquid, and liquid-vapor interface of water with many-body potentials. J. Chem. Phys. 1997, 106, 8149–8159. [Google Scholar] [CrossRef]
  76. Ryckaert, J.-P.; Ciccotti, G.; Berendsen, H.J.C. Numerical integration of the cartesian equations of motion of a system with constraints: Molecular dynamics of n-alkanes. J. Comput. Phys. 1977, 23, 327–334. [Google Scholar] [CrossRef]
  77. Abascal, J.L.F.; Vega, C. A general purpose model for the condensed phases of water: TIP4P/2005. J. Chem. Phys. 2005, 123, 234505. [Google Scholar] [CrossRef] [PubMed]
  78. Plimpton, J. Fast parallel algorithms for short-range molecular dynamics. J. Comput. Phys. 1995, 117, 1–19. [Google Scholar] [CrossRef]
  79. Sinoda, W.; Shiga, M.; Mikami, M. Rapid estimation of elastic constants by molecular dynamics simulation under constant stress. Phys. Rev. B 2004, 69, 134103. [Google Scholar] [CrossRef]
  80. Hockney, R.W.; Eastwood, J.W. Computer Simulation Using Particles; Taylor & Francis: New York, NY, USA, 1988; ISBN-13: 9780852743928. [Google Scholar]
  81. Robert, J.-L.; Beny, J.-M.; Della Ventura, G.; Hardy, M. Fluorine in micas: Crystal-chemical control of the OH-F distribution between trioctahedral and dioctahedral sites. Eur. J. Mineral. 1993, 5, 7–18. [Google Scholar] [CrossRef]
  82. Sakharov, B.A.; Naumov, A.S.; Drits, V.A. X-ray diffraction by mixed-layer structures with random distribution of stacking faults. Dokl. Akad. Nauk 1982, 265, 339–343. [Google Scholar]
  83. Sakharov, B.A.; Naumov, A.S.; Drits, V.A. X-ray intensities scattered by layer structure with short range ordering parameters S>1 and G>1. Dokl. Akad. Nauk 1982, 265, 871–874. [Google Scholar]
  84. Moore, D.M.; Reynolds, R.C., Jr. X-ray Diffraction and the Identification and Analysis of Clay Minerals; Oxford University Press: New York, NY, USA, 1997; ISBN-13: 9780195087130. [Google Scholar]
  85. Drits, V.A.; Srodon, J.; Eberl, D.D. XRD measurement of mean crystallite thickness of illite and illite/smectite: Reappraisal of the kubler index and the scherrer equation. Clays Clay Miner. 1997, 45, 461–475. [Google Scholar] [CrossRef]
  86. Seidl, W.; Breu, J. Single crystal structure refinement of tetramethylammonium-hectorite. Z. Kristallogr. 2005, 220, 169–176. [Google Scholar] [CrossRef]
  87. Rayner, J.H. The crystal structure of talc. Clays Clay Miner. 1973, 21, 103–114. [Google Scholar] [CrossRef]
  88. Dzene, L.; Verron, H.; Delville, A.; Michot, L. J.; Robert, J.L.; Tertre, E.; Hubert, F.; Ferrage, E. Influence of tetrahedral layer charge on the fixation of cesium in synthetic smectite. J. Phys. Chem. C 2017, 121, 23422–23435. [Google Scholar] [CrossRef]
  89. Malikova, N.; Cadéne, A.; Marry, V.; Dubois, E.; Turq, P.; Zanotti, J.M.; Longeville, S. Diffusion of water in clays—Microscopic simulation and neutron scattering. Chem. Phys. 2005, 317, 226–235. [Google Scholar] [CrossRef]
  90. Malikova, N.; Cadéne, A.; Dubois, E.; Marry, V.; Durand-Vidal, S.; Turq, P.; Breu, J.; Longeville, S.; Zanotti, J.M. Water diffusion in a synthetic hectorite clay studied by quasi-elastic neutron scattering. J. Phys. Chem. C 2007, 111, 17603–17611. [Google Scholar] [CrossRef]
Figure 1. On the left: view of the hectorite sheets as simulated. h is the layer-to-layer distance. On the right: View of the surface of an hectorite sheet simulated with Polarizable Ion Model (PIM). Yellow: Si; Red: O; White: H; Pink: Mg; light blue: Li.; Dark blue: counter-ion
Minerals 08 00205 g001
Figure 2. Forces for each atom for one of the hydrated hectorite configurations. The predictions of the classical force field (black lines) for the force ( F x , F y and F z ) and dipole ( μ x , μ y and μ z ) components are compared to the DFT results (red lines). The atom indices are grouped by atoms types: cations (Na, Mg, Li, Si), clay oxygen atom (O), clay oxygen atoms in hydroxyl groups (Oh) and water oxygen atoms (OW). The groups are delimited by the dashed lines.
Minerals 08 00205 g002
Figure 3. Atomic density profiles (arbitrary units) of oxygen (red), hydrogen (gray), and sodium (pink) atoms generated from MD simulations using PIM (left) or ClayFF (right) models for monohydrated (1W-top) and bihydrated (2W-bottom) hydration states. Atomic Z coordinates (in Å) are given relative to the mid-plane of the interlayer.
Minerals 08 00205 g003
Figure 4. Experimental (black crosses) and calculated (red lines) intensities of 00l reflections for hectorite under monohydrated (1W-left) and bihydrated (2W-right) state and using PIM (top) or ClayFF (bottom) models. The vertical gray bars indicate a modified scale factor for the high-angle regions as compared to the low-angle part of the patterns. 00l reflections are indexed on the top part of the figure. For 2W state, a zoom of the 007 and 008 reflections is shown for both models.
Minerals 08 00205 g004
Figure 5. Interlayer electronic density profiles (arbitrary units) calculated from atomic density profiles generated using PIM (gray) or ClayFF (black) models for monohydrated (1W-left) and bihydrated (2W-right) hydration states. Atomic Z coordinates (in Å) are given relative to the mid-plane of the interlayer.
Minerals 08 00205 g005
Table 1. Characteristics of the Dang-Chang water model. The oxygen atoms interact via a Lennard- Jones potential. The negative charge and the dipole are carried by the fourth site MW.
d OH (Å) d OM (Å)Angle ( ) ϵ O (kcal/mol) σ O (Å) q H α M 3 )
0.97520.215104.520.18253.23400.51901.444
Table 2. χ 2 for the dipoles and the forces for dehydrated and bihydrated hectorite.
Systems χ Dipoles 2 χ Forces 2
Dry hectorite0.1230.561
Wet hectorite0.1703.025
Table 3. Parameters of the PIM force field for the interactions between lithium and the other atoms. The parameters C 6 i j , C 8 i j and b n i j between Li and O are equal to the interactions O OH -X (with X = Al, Mg, Si, O or O OH ) [34]. The repulsion and dispersion interactions between Li and the other cations are negligible because the electrostatic repulsion predominates. As lithium polarizability is negligible, the polarization potential is restricted to the interactions between the charge of Li and the dipoles of polarizable ions.
Damping Interaction
between q j and μ i
Ion Pair (ij) A ij (Ha) B ij −1) C 6 ij (Ha·Å6) C 8 ij (Ha·Å8) b n ij −1) c ij ( ) b D ij −1)
Li-O9.682.780.04770.1564.171.192.79
Li-O OH 24.63.820.04770.1564.171.162.78
Li-OW0.4273.500.04770.1564.17--
Li-MW-----3.751.24
Li-Na-----0.5874.64
Li-Cs-----0.04234.99
Li-Ca-----3.873.64
Li-Sr-----0.8954.69
Table 4. Characteristics of the simulations boxes for hydrated hectorites.
SystemSuper Cell DimensionsA (Å)B (Å)h (Å)Number of H 2 O per Unit Cell
monohydrated (1W)5 × 2 × 226.318.212.534.2
bihydrated (2W)5 × 2 × 226.318.215.518.9
Table 5. Unit cell parameters of dry hectorites with the PIM model. The error on the last significant digit is reported between parenthesis.
Counteriona (Å)b (Å)c (Å)h (Å) α (deg) β (deg) γ (deg)
Na + 5.235 (1)9.108 (4)9.813 (7)9.711 (1)91.8 (2)96.4 (2)90.02 (5)
Cs + 5.258 (5)9.106 (7)10.674 (7)10.524 (5)89.90 (6)99.53 (7)89.95 (4)
Ca 2 + 5.255 (9)9.15 (2)10.23 (1)9.676 (1)90.1 (1)108.1 (2)90.2 (1)
Sr 2 + 5.231 (6)9.11 (2)10.28 (2)9.767 (5)90.1 (2)106.9 (2)90.1 (1)
talc (exp) [87]5.2939.1799.4699.38190.5798.9190.03

