
Abstract
In this paper, an analytical model of a micro-electromechanical (MEM) resonator used as a 4-bit digital-to-analog converter (DAC) is presented. First, we derive the dynamic equation of the 4-bit DAC device, and the nonlinear governing equation is solved by the Galerkin method combined with a shooting technique to simulate the static response, linear eigenvalue problem, and forced vibration response of the device for various electrostatic actuation cases. Also, we optimize the air gaps in the linear domain to ensure enhanced performance of the DAC. Further, to analyze the operation of the DAC in the nonlinear regime, two experimental samples powered by −2 dBm and −12 dBm AC inputs are examined. Forward and backward frequency sweeps are conducted experimentally and analytically. The proposed analytical results are validated by comparison with experimental data. The results indicate that the presented modeling, simulations, and optimization are effective tools for the design of MEM resonator-based circuits.
Export citation and abstract BibTeX RIS

Original content from this work may be used under the terms of the Creative Commons Attribution 4.0 license. Any further distribution of this work must maintain attribution to the author(s) and the title of the work, journal citation and DOI.
1. Introduction
Micro-beams are the most commonly used structures in micro-electromechanical systems (MEMS) resonators [1, 2]. In particular, clamped-clamped beams, a key resonator component, have been extensively explored for many practical applications such as in band-pass filters [3–5], oscillators, digital logic gates [6–11], and memory devices [12, 13]. The static and dynamic behaviors of resonant beams are complicated, especially under the nonlinear electrostatic-force actuation. Thus, it is necessary to understand the behavior of resonant beams in such cases.
Considerable effort has been made to understand the complex static and dynamic behaviors of MEMS structures, especially beams. A review of recent advances in this field is presented in [14]. Mestrom et al [15] studied the softening and hardening behaviors of a clamped-clamped beam resonator through a combined analytical-numerical and experimental approach. The obtained results show softening or hardening nonlinear dynamics depending on excitations. Mestrom et al [16] also utilized the clamped-clamped beam resonator to predict the measured resonator response and the nonlinear dynamic steady-state behaviors under different parameters. A good quantitative match was achieved between simulation and experimental results. Venstra et al [17] studied the clamped-clamped mechanical resonators in water through a magnetomotive drive. The results demonstrate that the magnetomotive technique can be used to drive and detect micromechanical resonator vibrations. Azizi et al [18] investigated the nonlinear chaotic dynamics of an electrostatically and piezo-electrically actuated clamped-clamped micro beam. The results indicate that an appropriate DC source to piezoelectric layer can passively control the chaotic response of the micro system. Hu et al [19] investigated the snap-through, pull-in behaviors and dynamics of an initially curved micro clamped-clamped beam under an electro-dynamical actuation. Kumar et al [20] studied the nonlinear dynamics and the internal resonances of a clamped-clamped beam MEMS resonator by using Galerkin based reduced-order model and a finite element method. Their results can serve as guidelines for developing controllers that regulate the displacement of driven mode by its interaction with the coupled mode. Ghayesh et al [21] analytically presented an investigation on an electrically actuated MEMS clamped-clamped resonator and studied the pull-in instability, force-response, and dynamic behavior of the system through the time histories and phase-plane portraits. Li et al [22] studied the nonlinear modal interactions of electrically actuated clamped-clamped micro beams and the effects of antisymmetric modes on the nonlinear dynamics. The results show that the nonlinear modal interactions can transfer the energy from one mode to a nearby mode.
As mentioned above, the Galerkin method has been widely used to investigate the dynamics of MEMS structures. However, under low damping conditions and for complex electrostatic actuation, the Galerkin method suffers since it can only catch part of the dynamic state (solution). Furthermore, simulations using this method are time-consuming and do not converge easily. To alleviate this, a combined Galerkin-shooting technique can be used [1]. Most resonance curves, especially near the bifurcation point [1, 23], can be captured by this powerful method. Nayfeh et al [24] and Younis et al [25] adopted a shooting method along with the Galerkin method to study the nonlinear dynamics of a novel MEMS switch excited around the primary resonance and undergoing large motion. Yu et al [26] adopted the combined Galerkin-shooting technique to analyze the electromechanical post-buckling response of a clamped-clamped beam actuator subjected to axial residual stresses and a symmetric electrostatic field. Using same technique, Emam et al [27] experimentally and analytically investigated the nonlinear behaviors of a clamped-clamped buckled beam near subharmonic resonance and investigate the stability and bifurcations based on a combined method of Galerkin-shooting. Nayfeh and Younis [28] utilized the combination of the shooting technique and a reduced-order model to analyze and simulate the dynamics of an electrically actuated micro-beam, near primary, sub-harmonic, and super-harmonic resonances.
Digital-to-analog converters (DACs) are basic elements for electronics and microcontrollers in MEMS. Recent, efforts have been made to realize DACs using MEMS technology motivated by the need to reduce power consumption, which has a more promising digital signal processing application in MEMS devices [29]. Yeh et al [30] demonstrated a technique to create a 3-bit mechanical DAC by using lever arms and thermal actuator arrays. It can take digital electrical signals and produce mechanical displacements at the output which can be used in applications such as micro-optics, mechanical-computing, and micro-robotics. Toshiyoshi et al [31] discussed the design and implementation of a 4 bit micromachined electrostatic actuator-based MEMS DAC in which a set of local digital displacements are converted into an analog output displacement. Pandiyan et al [32] used a bending beam electro thermal compliant actuator to design and simulate an MEMS-based DAC. The proposed DAC generates a mechanical displacement at the output from the digital input based on the principle of weighted stiffness which is analogous to binary-weighted resistor DAC.
The investigated DACs above based on different micro-structures are complicated consisting of arrays of many asymmetric and symmetric structures with multi-bent beam actuators. As a result, these kinds of reported DACs structures occupy large areas. Also, some of the reported DACs need DC currents for their operation, which results in high energy consumption. The proposed DAC here consists of a single straight micro clamped-clamed beam with multi-partial electrodes, which is simple and easy to fabricate. Also, this DAC does not need a DC current, hence it consumes less power. The proposed DAC can be used to internet of things (IoT) applications that demand moderate speed and lower power consumption.
In this paper, we analytically and experimentally investigate the statics and dynamics of the MEMS resonator-based 4-bit DAC [33, 34] in depth. The device consists of a clamped-clamped beam, separated from various partial electrodes of different air-gap sizes. The digital inputs are DC voltages, applied to four partial electrodes, which tune the beam's resonance frequency using the electrostatic softening effect. Our objective is to develop a theoretical model, predict all the relevant aspects of the experimental response, and optimize the device performance. First, we derive the dynamic equations of the device, and then we investigate the static deflection, eigenvalue problem (EVP), optimization, and dynamic response of the micro-resonator based on the Galerkin-shooting procedure. Lastly, we examine two measurement samples of the DAC under the nonlinear operation. The forward and backward frequency sweep on each digital case is conducted, and excellent agreements are found between the experimental and theoretical results.
The outline of the rest of the paper is as follows. Section 2 describes the modeling procedure. The static response, EVP, and optimization are presented in sections 3 and 4, respectively. Section 5 experimentally and analytically illustrates the frequency response for the forward and backward frequency sweeps and examines the effects of the biasing voltage of the beam on the DAC. Finally, conclusions remarks are summarized in the last section.
2. Problem formulation
A picture of the proposed resonator DAC is shown in figure 1(a). The device is fabricated by MEMSCAP Inc foundry through SOIMUMPs process [35] using a surface micromachining process on a silicon on an insulator wafer. The process starts by defining electrodes with gold by lifting off a Cr/Au bi-layer (20 nm/500 nm), and then the silicon device layer (25 µm thick) is patterned by deep reactive ion etching to define the beam, the anchors, and corner electrodes. Finally, the structure is released by etching the SiO2 in using vapor Hydrogen Fluoride (HF). The used wafer has the following layer thicknesses: (a) silicon thickness: 25 ± 1 µm; (b) oxide thickness: 1 ± 0.05 µm; (c) handle wafer (substrate) thickness: 400 ± 5 µm.
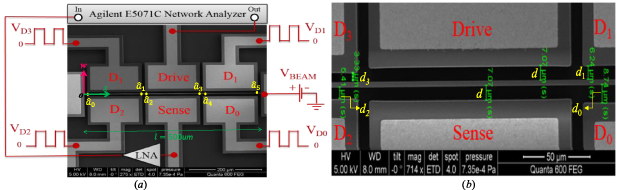
Figure 1. (a) Experimental setup with an SEM image of the fabricated micro-resonator DAC; (b) A zoomed-in picture showing the dimensions of the obtained air gaps after fabrication. © 2020 IEEE. Reprinted, with permission, from [34].
Download figure:
Standard image High-resolution imageThe DAC device consists of an in-plane-clamped-clamped micro beam based resonator (length l= 500 µm, lateral width W= 2.66 µm, thickness h= 25 µm) with a DC voltage (VBeam), and side partial electrodes with various air-gap widths as shown in figure 1(b). The digital inputs of the DAC are DC voltages, applied to four corner electrodes marked as D3, D2, D1, and D0 in figure 1(a). The actuation of the micro beam resonator is realized through the different digital input combinations (DC source) and AC voltage components. The resonator here is driven to vibrate on the first vibration mode.
The input vector D3 D2 D1 D0 is a binary number where D3 (with the smallest gap) is the most significant bit and D0 (with the largest gap) is the least significant bit. Each bit can be either '1' (on) or '0' (off), which are defined as '40' V or '0' V, respectively. Thus, there are 16 combinations (24 = 16) for the inputs ranging from '0000' to '1111' representing the decimal numbers from 0 to 15. The resonance frequency of the beam should increase as the decimal equivalent value of the applied digital input increases.
The equations of motion governing the transverse deflection  of a clamped-clamped beam under the partial electrode actuation can be described as
with the following boundary conditions:

where the prime indicates the derivative in space  and the dot indicates the derivative in time
  .
.
Here, x is the position along the beam length, E and I are the elastic modulus and the moment of inertia, b is the width of the beam, h is the beam thickness,  is the viscous damping coefficient,
  is the axial load, A is the cross-section area of the beam, l is the length of the beam, d is the gap between the beam and drive or sense electrode. The air gaps between the corner electrodes and beam are d0, d1, d2, and d3, respectively. Also, U(x) is a step function. The distance of each partial electrode position to the left starting point (o) of the resonator in figure 1(a) is
  (i = 0, 1, 2, 3, 4, 5) respectively. The detailed values are illustrated in table 1.
Table 1. The specifications of the resonator.
| Symbol | Value | Quantity | Value |
|---|---|---|---|
| d0 | 8.74 µm |

| 8 µm |
| d1 | 6.24 µm |

| 163.9 µm |
| d2 | 5.41 µm |

| 171.9 µm |
| d3 | 3.33 µm |

| 327.8 µm |
| d | 7.075 µm |

| 335.8 µm |
| l | 500 µm |

| 491.7 µm |
| h | 25 µm | W | 2.66 µm |
Equation (1) is governed by 16 key parameters (d1, d2, d3, d4, d, and  , VD0, VD1, VD2, VD3, VBeam). To facilitate analysis of the equation, the following dimensionless variables are introduced
We substitute equation (3) into equations (1) and (2), yielding the non-dimensional equation
The above is subjected to the non-dimensional boundary conditions:

The non-dimensional parameters appearing in equation (4) are
The deflection of the clamped-clamped micro beam under the electrostatic force is expressed as a static normalized deflection ws(x) due to the DC voltage component and a normalized dynamic component due to the AC source, denoted by wd(x, t); that is

To determine ws(x), we set the time derivative and the AC forcing terms in equation (4) equal zero and obtain
with the associated boundary conditions

By plugging equation (7) into equation (4), and only keeping linear terms of wd after the electrostatic force is expanded in wd by Taylor series expansions, we obtain
By eliminating the terms representing the equilibrium position of equation (8) and the AC term from equation (10), this yields:
with the associated boundary condition

In the following analysis, we only consider the 3-bit DAC while keeping the D0 un-actuated to compare the analytical result with the experimental data reported in [33, 34]. The air gaps between the beam and the corner electrodes are adjusted based on the weight of each bit such that the more significant bits have stronger effects on the beam. This is realized by making the gap of D0 the largest while making the gap of D3 the smallest.
Next, we resort to the Galerkin procedure [1] to solve for the EVP and dynamic responses of the system by assuming the micro-beam deflection as
where ϕi (x) is the ith mode shape of the micro-beam at zero voltage load and uj is its modal amplitude. Equation (13) is then substituted into equation (11) for the EVP, and equation (4) for the forced vibration response, then we multiply the outcome by the mode shape, apply the orthogonality condition of the mode shapes, and integrate over the beam domain from 0 to l. A convergence study needs to be conducted to determine the minimum number of modes that are needed to capture the dynamic behavior accurately [1]. In this work, for simplicity, we use a single-mode to approximate the dynamic response. The obtained analytical results reach good agreement with the experimental ones. Thus, a single-mode yields sufficient accuracy.
3. Static deflection analysis
Here, we examine the static response to better understand how static deflection can impact the system behavior. We explore and simulate the static response for each digital combination cases. For the static analysis, due to the complicated denominator of forcing terms in equation (8), the solution does not easily converge and the adoption of the Galerkin method is time-consuming. To improve the efficiency of simulations, and obtain more accurate results, we resort to a shooting method to solve such equations [36, 37].
Next, we solve the static response based on the shooting method with the boundary value problem. We shoot for the value of the complicated integral mid-plane stretching term of equation (8) iteratively by the Newton Raphson method until achieving convergence to within a very small predefined tolerance. Figure 2 shows the static deflections along the micro beam for eight different digital input combination cases from case-000 to case-111.
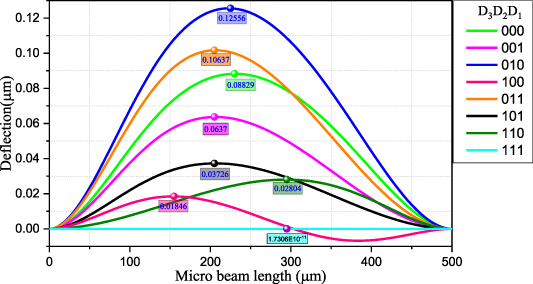
Figure 2. The static deflection curves and marked maximum deflection point of the beam for different digital input combinations.
Download figure:
Standard image High-resolution imageFrom figure 2, the static deflection curve and the maximum deflection point of the micro beam for different digital input combinations are illustrated. We conclude that the static deflection curves vary for different digital input combinations. Also, we observe that the multi-actuated electrode configuration for the digital input can shift the maximum deflection along the micro beam. This is due to the fact that the generated electrostatic force by different digital combinations varies along the beam, and also due to the digital electrodes with different gap widths. Therefore, the maximum position along the micro beam varies with the digital input combinations.
For example, the digital case-010 (the bits D3 and D1 are off while the D2 is on) exhibits the maximum static deflection. The electrode D3 with the smallest air-gap generates the largest electrostatic force, and then the partial electrodes D3 and D1 on the same side of the beam work together to yield the higher amplitude response. However, for the digital case-111, the electrostatic force generated by the connected corner partial electrodes (D3 D2 D1) neutralize the ones from the micro beam, thus, almost zero amplitude is generated in this case. To examine case-100, one can see that D3 is digitally connected while the D2 and D1 are not connected, which means the electrostatic force generated by electrodes D2 and D3 works on the beam. But these forces mainly concentrate on the area around the anchor of either side of the micro beam, which bends the micro beam. Thus, the static deflection for case-100 is similar to a sinusoidal function.
We notice that, compared to the smallest air gaps (d3 = 3.33 µm), the maximum deflection for every single digital case is very weak, particularly for the digital case-111. Thus, in other words, the static deflection of the micro beam at 40 V is almost zero which is negligible. As a result, we will neglect the static deflection ws (x) when solving the EVP in the following section.
4. Linear EVP
As pointed out previously, the static deflection is very low when digital partial electrodes 40 V are connected. Hence, to ease the computational cost, we solve the EVP in equations (11) and (12) without the damping term, while also neglecting the static deflection ws(x). We apply a single-mode in the Galerkin model, and convert the partial differential equation into an ordinary differential equation. Then, we collect the coefficients of the linear term u(t); and take its square root, which yields the following expression for the first natural (resonance) frequency of the beam under electrostatic actuation:
Note that the resonance frequency of the resonator is a complicated function of eight key parameters. Based on equation (14), the resonance frequency of a resonator can be further analyzed and optimized.
To study the operation of the DAC in the linear domain, we experimentally test the DAC device under a large vacuum level. Figure 3(a) shows the measured frequency curves for different eight input combinations. For the resonator to work as a DAC, the frequency of the drive signal should be fixed at a selected operating frequency, for example, f1 or f2, and the output level should decrease or increase when a digital input is applied. Figure 3(b) shows the time response when the drive frequency is fixed around f1. The resonance frequencies extracted from the experiment, figure 3(a), are plotted in figure 3(c), in which the frequency shifts range from 81.807 kHz for case-000 to 82.670 kHz for case-111. Based on the derived equation (14), the analytical resonance frequencies of the resonator for different input combinations are shown in figure 3(d). One can note good agreement between the analytical and experimental results.
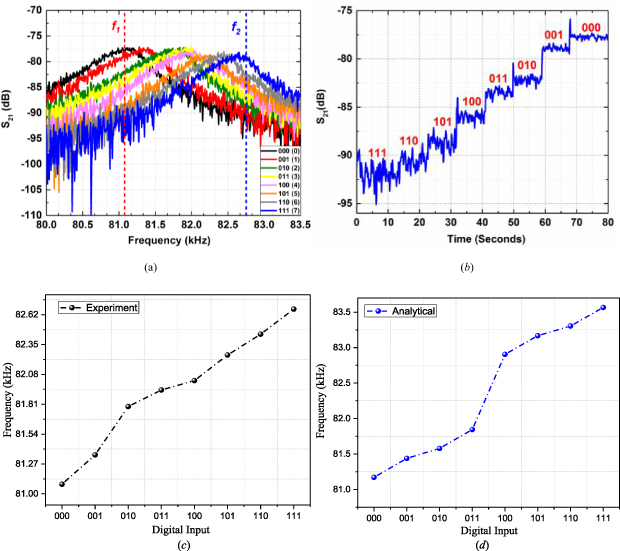
Figure 3. The resonance frequency of the beam for 3-bit-DAC (eight different input combinations). (a) Measured resonance peaks of the resonator for each digital input combinations (50 V beam bias, 40 V digital '1', 4.7 Torr, −2 dBm AC drive power. (b) Time-response curve obtained experimentally by fixing the frequency of the drive signal at f1 and varying the applied digital inputs, which shows how the resonator can work as a DAC. © 2020 IEEE. Reprinted, with permission, from [34]. (c) The resonance frequencies of the beam obtained experimentally for different input combinations. (d) Analytical resonance frequencies obtained from the developed model.
Download figure:
Standard image High-resolution imageHowever, it is noticed that the experimentally obtained frequency response curves in figure 3(a) indicate considerable overlaps for the output under different combinations, which makes the amplitude levels created by different inputs at f1 or f2 very close and undistinguishable. Also, the range of the frequency-shifting for different electrode combinations is not large. It is difficult to separate each frequency curve, which is a basic requirement for the proper operation of the DAC [34]. Here, there are two explanations. One is the voltage generated by partial electrodes can partly neutralize the one from the micro beam. The effective power source to trigger the micro resonator, as a result, will be reduced if more partial electrodes are joined. Another one is that the four corner electrodes close to the anchor of the micro beam have less influence on its actuation/deformation.
To overcome this, one can optimize the sizes of air gaps to generate various electrostatic forces along the micro beam under different digital combination cases. By changing air gaps, the distribution of electrostatic force along the micro beam can be reallocated. The expected frequency shift for each case can be improved by optimizing the air gap sizes.
To optimize the air gaps, we introduce ds as a basic scaling parameter, valued at ds = 5 μm, for normalization ( ). This process will enable us to optimize all the gaps including d1, d2, d3, and d. It is worthy to note that the new normalization-based ds here is mainly responsible for the optimization part. Applying the same normalization procedure to the obtained equation (14), the resonance frequency can be rewritten as below:
Here, we resort to multi-objective goal attainment problems [38] of all the gaps including d1, d2, d3, and d. We optimize the gaps over the size range from 2 µm to 8 µm. Next, we define a target function and restricted conditions. The restrictions need to satisfy the following conditions: (a) the difference between each neighboring digital frequency is larger than 0.3 kHz in a specific domain; (b) the frequency difference between the last case (111) and first case (000) is not too far away; (c) and the frequency linearly and monotonically increase between each case. We optimize the frequency based on the equation (15). The outcome of the optimized gaps is d1 = 5.47 µm, d2 = 4.53 µm, d3 = 3.58 µm, d= 4.84 µm. The simulation results based on these values are shown in figure 4. As noted in figure 4, the resonance frequencies for each digital case are linearly ordered.

Figure 4. The resonance frequency for each digital case after optimization under the following conditions: VBeam = 50 V, digital '1' = 40 V, digital '0' = 40 V.
Download figure:
Standard image High-resolution image5. Forced vibration response
To further study the forced vibration response of the micro-beam, we apply the procedure of the Galerkin discretization with a single-mode. First, we substitute equation (13) into equation (4), multiply both sides of the outcome by ϕj, and then we integrate the results from the beam domain zero to one. The outcome yields:
Next, we rewrite equation (16) by assuming u1 (t) = Y as below
in which Y is a modal coordinate amplitude. Above, the various function Fi (Y) are defined as
Due to the term with Y in the denominator of the electrostatic force terms, the integral terms are not easily evaluated, which will cause computational problems [1, 39]. One approach to resolve this issue is by pre-calculating numerically these complicated terms F1(Y), F2(Y), F3(Y), F4(Y), F5(Y), F6(Y) of equation (18) for each step of ΔY = 0.05, and then tabulate and store them, as shown in the
Here, to clarify the DAC function well in the linear domain, we solve the forced vibration response by the method of shooting and conduct the frequency sweeps around the primary resonance by using the optimized air gap sizes. One can notice that the frequency for each digital case in figure 5 shows linear response and shift to the higher frequency due to the different digital input ranging from the case-000 to case-111. When the DAC resonator is operated at any single driven frequency signal such as f1 or f2, the corresponding output response can be clearly distinguished. For example, the output level, at different driving signals f1 or f2, can significantly decrease or increase when subjected to the different digital input bits. Therefore, the optimized resonator-based DAC can function well in the linear domain compared to the previously proposed one of figure 3(a).
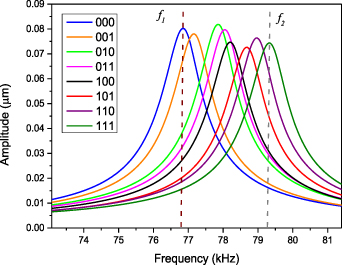
Figure 5. Forward frequency sweeps for the resonator working in the linear regime for each input combination under the following conditions: damping c = 0.25, VBeam = 50 V, digital '1' = 40 V, digital '0' = 40 V.
Download figure:
Standard image High-resolution imageIt is worthy to mention that the proposed resonator-based DAC also can work in the nonlinear regime. Next, we can examine the operation of the proposed DAC in the nonlinear regime if we properly adjust the input power source and vacuum level (damping). Here, two experimental samples with very low damping are considered. It is noted that the frequency response curves are evaluated by calculating the average amplitude response value between maximum and minimum of the steady-state response for each case when conducting time integration.
Here, we compare the experimental data with the analytical results [34]. Figure 6(a) experimentally demonstrates the forward and backward frequency sweep of the resonator in the nonlinear regime for all digital combinations under −2 dBm AC input power level. Due to the different air gap sizes between the beam and digital input electrodes, distributions of the electrostatic load will be non-uniform along the micro beam and it will generate differences for each of the input combinations. In the nonlinear operation, one can notice that the amplitude response in the forward frequency sweep bends to higher values, nonlinear hardening behavior, due to the dominant mid-stretching nonlinearity over the softening electrostatic one. Figure 6(b) shows the S21 parameter subjected to the digital inputs ranging from case-111 to case-000, in descending order. We can see that the digital case-000 input has the largest amplitude at operating point f1 while case-111 has the smallest one. That is because the digital bits for case-111 generates the least influence on the actuation of the micro beam.

Figure 6. Experimentally forward and backward frequency sweeps for the resonator working in the non-linear regime for each input combination under the following conditions: 40 mTorr, 40 V beam bias, 40 V digital '1', 0 V digital '0' and −2 dBm input AC signal power in (a) frequency response (b) the S21 parameter for transitions from 111 to 000 in descending order at f1. © 2020 IEEE. Reprinted, with permission, from [34].
Download figure:
Standard image High-resolution imageThe frequencies are swept under different digital input combinations and the inset for forward and backward frequency is shown in figure 7. The analytical results of figure 7 have good agreement with the experiment data of figure 6(a). To better understand the behavior at reached maximum excitation frequency point, we examine their eigenvalues (Floquet Multipliers) at that point. We found that the Multipliers of the system gradually approach the boundary of the unit circle when the excitation increases, and then the microsystem generates cyclic fold bifurcation phenomenon [1] at the maximum reached frequency.

Figure 7. Simulated frequency response curves under each digital input combination under the following conditions: VBeam = 40 V, digital '1' = 40 V, digital '0' = 40 V, damping c = 0.0025.
Download figure:
Standard image High-resolution imageAs mentioned, the shooting technique can capture all the periodic motions. Figure 8 depicts the appearance of three periodic solutions (for digital case-000) with different amplitude levels consisting of the upper branch (resonance stable branch, blue), the lower branch (non-resonance stable branch, magenta), and the intermediate branch (unstable branch, orange), which mainly depend on the initial conditions. As the frequency of excitation is increased or decreased, there are jumps in the response amplitude. For the forward excitation frequency sweep, we note that one Floquet multiplier approaches unity at the maximum amplitude of 3.59 µm, and also the upper stable branch and unstable branch are intersected at the point of the reached maximum frequency. This indicates a cyclic fold bifurcation [1].
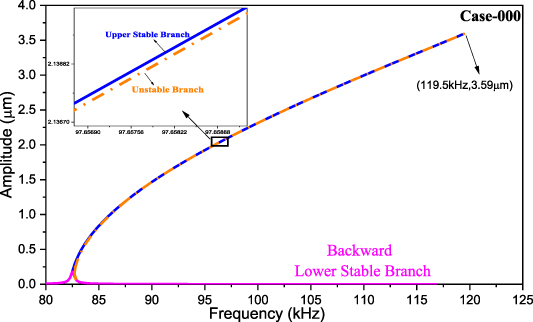
Figure 8. The frequency-amplitude response for digital case-000.
Download figure:
Standard image High-resolution imageFigure 9 compares the dynamic response between theory and experiment at −12 dBm AC input signal power [30]. We notice that decreasing the AC source can lower the amplitude response. The frequency response curves experimentally and analytically show the same nonlinear hardening behavior. Thus, we observe a satisfactory agreement for the response among experimental and analytical results.
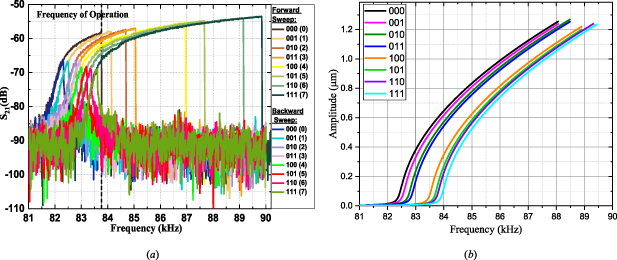
Figure 9. Forward and backward frequency sweep for the resonator working in the non-linear regime for each input combination under the following conditions: 40 mTorr, 40 V beam bias, 40 V digital '1', 0 V digital '0' and −12 dBm: (a) experimental, (b) simulation. © 2020 IEEE. Reprinted, with permission, from [34].
Download figure:
Standard image High-resolution imageNext, we notice that electrode D3 (with the smallest air gap), and VBeam both play a significant role in the operation of the DAC. To clarify the influence of the electrode D3, we select the representative samples digital case-011 (represent the first four cases, D3 'off') and case-111 (represent the last four cases, D3 'on') in figures 10(a) and (b), respectively. From the simulated results, one can notice that lowering VBeam can make the frequency-swept curve right-shifted and clearly distinguished due to the nonlinear softening effects. Also we note that VBeam also can generate a big difference for case-011, compared to the case-111.
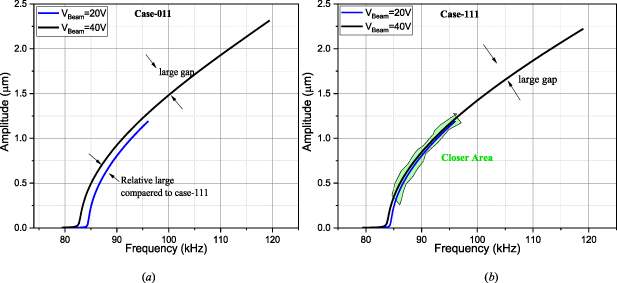
Figure 10. The effect of VBeam on the DAC operation of the condition 40 V digital '1', 0 V digital '0', damping c = 0.0025 and AC = −2 dBm power level (a) for digital case-011; (b) for digital case-111.
Download figure:
Standard image High-resolution image6. Conclusions
In this work, we analytically and experimentally presented modeling, investigation, validation, and optimization of the MEMS resonator-based 3-bit DAC consisting of an in-plane clamped-clamped beam actuated by partial electrodes with different air-gap. First, we derived a dynamic equation of the proposed 3-bit DAC device, and the static response, linear EVPs, and dynamic response were solved then based on the method of the Galerkin-shooting technique. Second, to ensure the DAC function well in the linear domain, we optimized the size of air gaps. The optimized results indicate that the frequency responses ranging from the digital case '000' to '111' are monotonically increasing, linearly ordered, and significantly separated for the output at a single frequency. Third, we experimentally and analytically explored two samples of the DAC device under the nonlinear operation at −2 dBm and −12 dBm AC power levels, respectively. Forward and backward frequency sweeps were also investigated for all digital cases and were validated with measured results. The frequency response exhibit the characteristic bending toward higher frequencies and show the nonlinear hardening behaviors due to the high mid-plane stretching term. Moreover, we also notice that decreasing the AC power level from −2 dBm to −12 dBm can reduce the amplitude response and swept-range of the frequency curves. Last, we explored and discussed the effects of VBeam on the DAC operation. Thus, the results suggest that the proposed modeling, simulations, and optimization analysis could be successfully implemented in the design of the DAC under various digital combinations. The rich nonlinear behavior with lower energy consumption could provide some high potential applications in IoT, such as logic, computation, sensing, and actuation.
Acknowledgment
We acknowledge the financial support from King Abdullah University of Science and Technology (KAUST).
Data availability statement
The data that support the findings of this study are available upon reasonable request from the authors.
: Appendix
The direct integration of equation (16) can make the simulation very slow when we analyze the dynamic system [40]. To overcome this and improve the efficiency, first, we numerically integrate the complicated terms Fi (Y) and then store the values in a table choosing the step ΔY = 0.05. Here, the numerical evaluation Fi (Y) is reported.

Figure A. Evaluations of Fi (Y) by the numerical integration.
Download figure:
Standard image High-resolution image