Article

Drought Extent and Severity on Arable Lands in Romania Derived from Normalized Difference Drought Index (2001–2020)

1
Department of Geography, Faculty of Geography and Geology, Alexandru Ioan Cuza University of Iași, 20A Carol I Blvd., 700 505 Iasi, Romania
2
Meteo Romania, National Meteorological Administration, 013686 Bucharest, Romania
*
Author to whom correspondence should be addressed.
Remote Sens. 2021, 13(8), 1478; https://doi.org/10.3390/rs13081478
Submission received: 7 March 2021 / Revised: 1 April 2021 / Accepted: 8 April 2021 / Published: 12 April 2021
(This article belongs to the Special Issue Temporal Resolution, a Key Factor in Environmental Risk Assessment)

Abstract

:
The aim of this study was to evaluate the frequency and severity of drought over the arable lands of Romania using the Normalized Difference Drought Index (NDDI). This index was obtained from the Moderate Resolution Imaging Spectro-Radiometer (MODIS) sensor of the Terra satellite. The interval between March and September was investigated to study the drought occurrence from the early stage of crop growth to its harvest time. The study covered a long period (2001–2020), hence it is able to provide a sound climatological image of crop vegetation conditions. Corine Land Cover 2018 (CLC) was used to extract the arable land surfaces. According to this index, the driest year was 2003 with 25.6% of arable land affected by drought. On the contrary, the wettest year was 2016, with only 10.8% of arable land affected by drought. Regarding the multiannual average of the period 2001–2020, it can be seen that drought is not a phenomenon that occurs consistently each year, therefore only 11.7% of arable land was affected constantly by severe and extreme drought. The correlation between NDDI and precipitation amount was also investigated. Although the correlations at weekly or monthly levels are more complicated, the annual regional mean NDDI is overall negatively correlated with annual rainfall. Thus, from a climatic perspective, we consider that NDDI is a reliable and valuable tool for the assessment of droughts over the arable lands in Romania.

Graphical Abstract

1. Introduction

Drought is generally considered the most complex meteorological phenomenon [1], given that many factors contribute to its onset, such as precipitation amount, soil characteristics, terrestrial water accessible to plants, soil/air temperature and humidity or wind speed. Other factors that define the characteristics of the active surface, or the physiological peculiarities of the plants, in addition to the anthropogenic influence on the environment, are highly significant in its occurrence [1,2]. Despite the policies and efforts to reduce extreme weather effects, droughts will remain unavoidable.
As present, because regional development is considered to be one of the main factors contributing to economic growth, the better prepared a region to cope with adverse weather conditions, such as drought, the more the region can contribute to the development of the whole country [3,4]. Therefore, strategies and actions to mitigate drought impacts in less developed countries are essential, because these regions are among the most vulnerable, with the lowest financial and technical capacity to adapt or to mitigate the effect of this extreme phenomenon [5].
Scientific research has led to a wide variety of results and applications in the field of monitoring and control of drought effects [2]. However, several scientific problems and challenges remain, such as finding solutions to mitigate drought effects and improve living standards, which can be solved through a better understanding of meteorological extremes, with the aim of preventing possible future impacts [1,2].
The relevance of this topic derives, in particular, from the fact that in the context of climate change, the impact of this climatic phenomenon is expected to become more pronounced because periods of drought are expected to become longer in numerous regions of the world [5,6].
Classically, Wilhite and Glantz [7] defined four types of drought: meteorological (lack of precipitation), hydrological (lack of water supply), agricultural (crop water deficit) and socio-economic (combined effect of drought on human activities). Regardless of its type, the drought phenomenon has been investigated using a variety of indices which have been developed over time, such as the Palmer Drought Sensitivity Index (PDSI) [8], the Standardized Precipitation Index (SPI) [9,10], or the Standardized Precipitation Evaporation Index (SPEI) [11]. In addition, some indices based on the relationship between land surface temperature (LST) and land cover have been developed, such as the Temperature Condition Index (TCI) [12], Vegetation Temperature Condition Index (VTCI) [13] or Temperature Vegetation Dryness Index (TVDI) [14,15].
Taken into account the complicated definition of drought [7,16], vegetation indices appear to provide more appropriate estimations of drought occurrence and intensity and the associated agriculture impacts. In this regard, remote sensing products such as the Normalized Difference Vegetation Index (NDVI), Normalized Difference Water Index (NDWI), Leaf Area Index (LAI) and Fraction of Photosynthetically Active Radiation (FPAR) have also been developed [17,18,19,20,21,22]. Furthermore, other indices have been investigated, such as the Vegetation Condition Index (VCI) [12], Crop Water Stress Index (CWSI) [23], Vegetation Health Index (VHI) [12], Global Vegetation Moisture Index (GVMI) [24], Soil Water Index (SWI) [25] or Remote Sensing Drought Risk Index (RSDRI) [26,27]. Among these, one of the most flexible and useful indices to be applied for drought investigation on arable lands is the Normalized Difference Drought Index (NDDI) [20].
In Europe, many studies have focused on drought and its characteristics using various methods, indices and satellite products. For example, a study focusing on the north-east of the Iberian Peninsula developed by Vicente-Serrano [28] used vegetation indices derived from AVHRR (Advanced Very High Resolution Radiometer) images. In Spain and the Mediterranean region, Vicente-Serrano et al. [29] used AVHRR images and the NDVI index to study the drought impact over agricultural lands located in the Middle Ebro valley, one of the most arid regions in Europe. In addition, Gouveia et al. [30] analyzed the drought impacts on vegetation over the entire Mediterranean basin, using NDVI and SPEI indices, with the purpose of determining the stage at which vegetation is more impacted by drought. Drought was analyzed by Sepulcre-Canto et al. [31], who combined the SPI, the anomalies of soil moisture and the anomalies of the FPAR. Furthermore, Dalezios et al. [32] applied a number of drought indices based on NOAA (National Oceanic and Atmospheric Administration)-AVHRR and the Reconnaissance Drought Index (RDI) in Thessaly, central Greece, which is a drought-prone agricultural region characterized by vulnerable agriculture. The driest years, such as 2000, 2003 or 2008, were analyzed in many studies aiming to monitor the drought severity in Europe. For this, Sea-Viewing Wide Field-of-view Sensor (SeaWiFS) and Medium Resolution Imaging Spectrometer (MERIS) instruments [33] or MODIS vegetation indices (VIs), NDVI and enhanced vegetation index (EVI) [34] have been used. It should be noted that the assessment of drought at the continental scale identified the Carpathians region as subject to an increase in drought for 1950–2012 [35].
With the increase in the availability of remote sensing products and indices, their use has also become more frequent in Romania. These have been used to analyze and detect floods [36], land cover changes [37,38], landslide-prone hilly areas in Moldova and various other areas [39] and Saharan dust intrusion [40,41], and it is clear that they can also help to precisely monitor drought.
A comprehensive analysis of the correlation between NDVI and SPEI, aiming to evaluate the response of vegetation’s photosynthetic activity to drought conditions from 1998 to 2014 over Romania and the Republic of Moldova, was undertaken by Páscoa et al. [11]. Changes in the forest ecosystems in south-western Romania, due to global climate change and anthropogenic impacts during the past three decades, and correlated with the evolution of aridization, were assessed by Prăvălie et al. [42] using the NDVI and the UNEP (United Nations Environmental Programme) aridity index. In addition, remote sensing data have been used in several studies to monitor the summer surface urban heat island of the city of Bucharest [43], Cluj-Napoca [44], and Galați [45]. Due to climate change, some studies have discussed the topic of desertification [46], which was studied in the south-east of Romania using LANDSAT TM images and LST.
Recently, Angearu et al. [47] analyzed drought severity using the Drought Severity Index (DSI) in Romania and its validation based on meteorological data, soil moisture content and agricultural production. In addition, drought assessment based on a multi-temporal analysis and trends of the DSI obtained from Terra MODIS satellite images was undertaken.
In this context, the main objective of our study was to enhance the knowledge on drought frequency and severity in Romania by providing a long-term (2001–2020) and comprehensive view of its impact over arable lands as reflected by the NDDI. Our results show that NDDI is a highly reliable and valuable tool for the assessment of droughts over the arable lands in Romania.

2. Materials and Methods

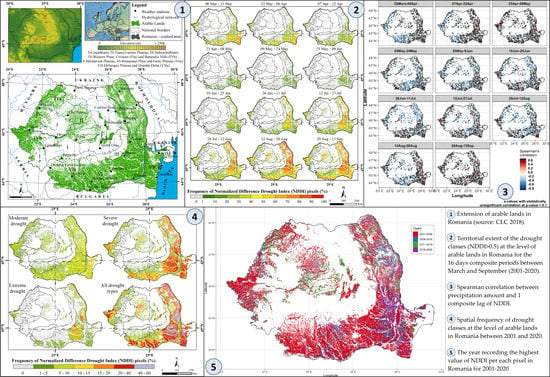
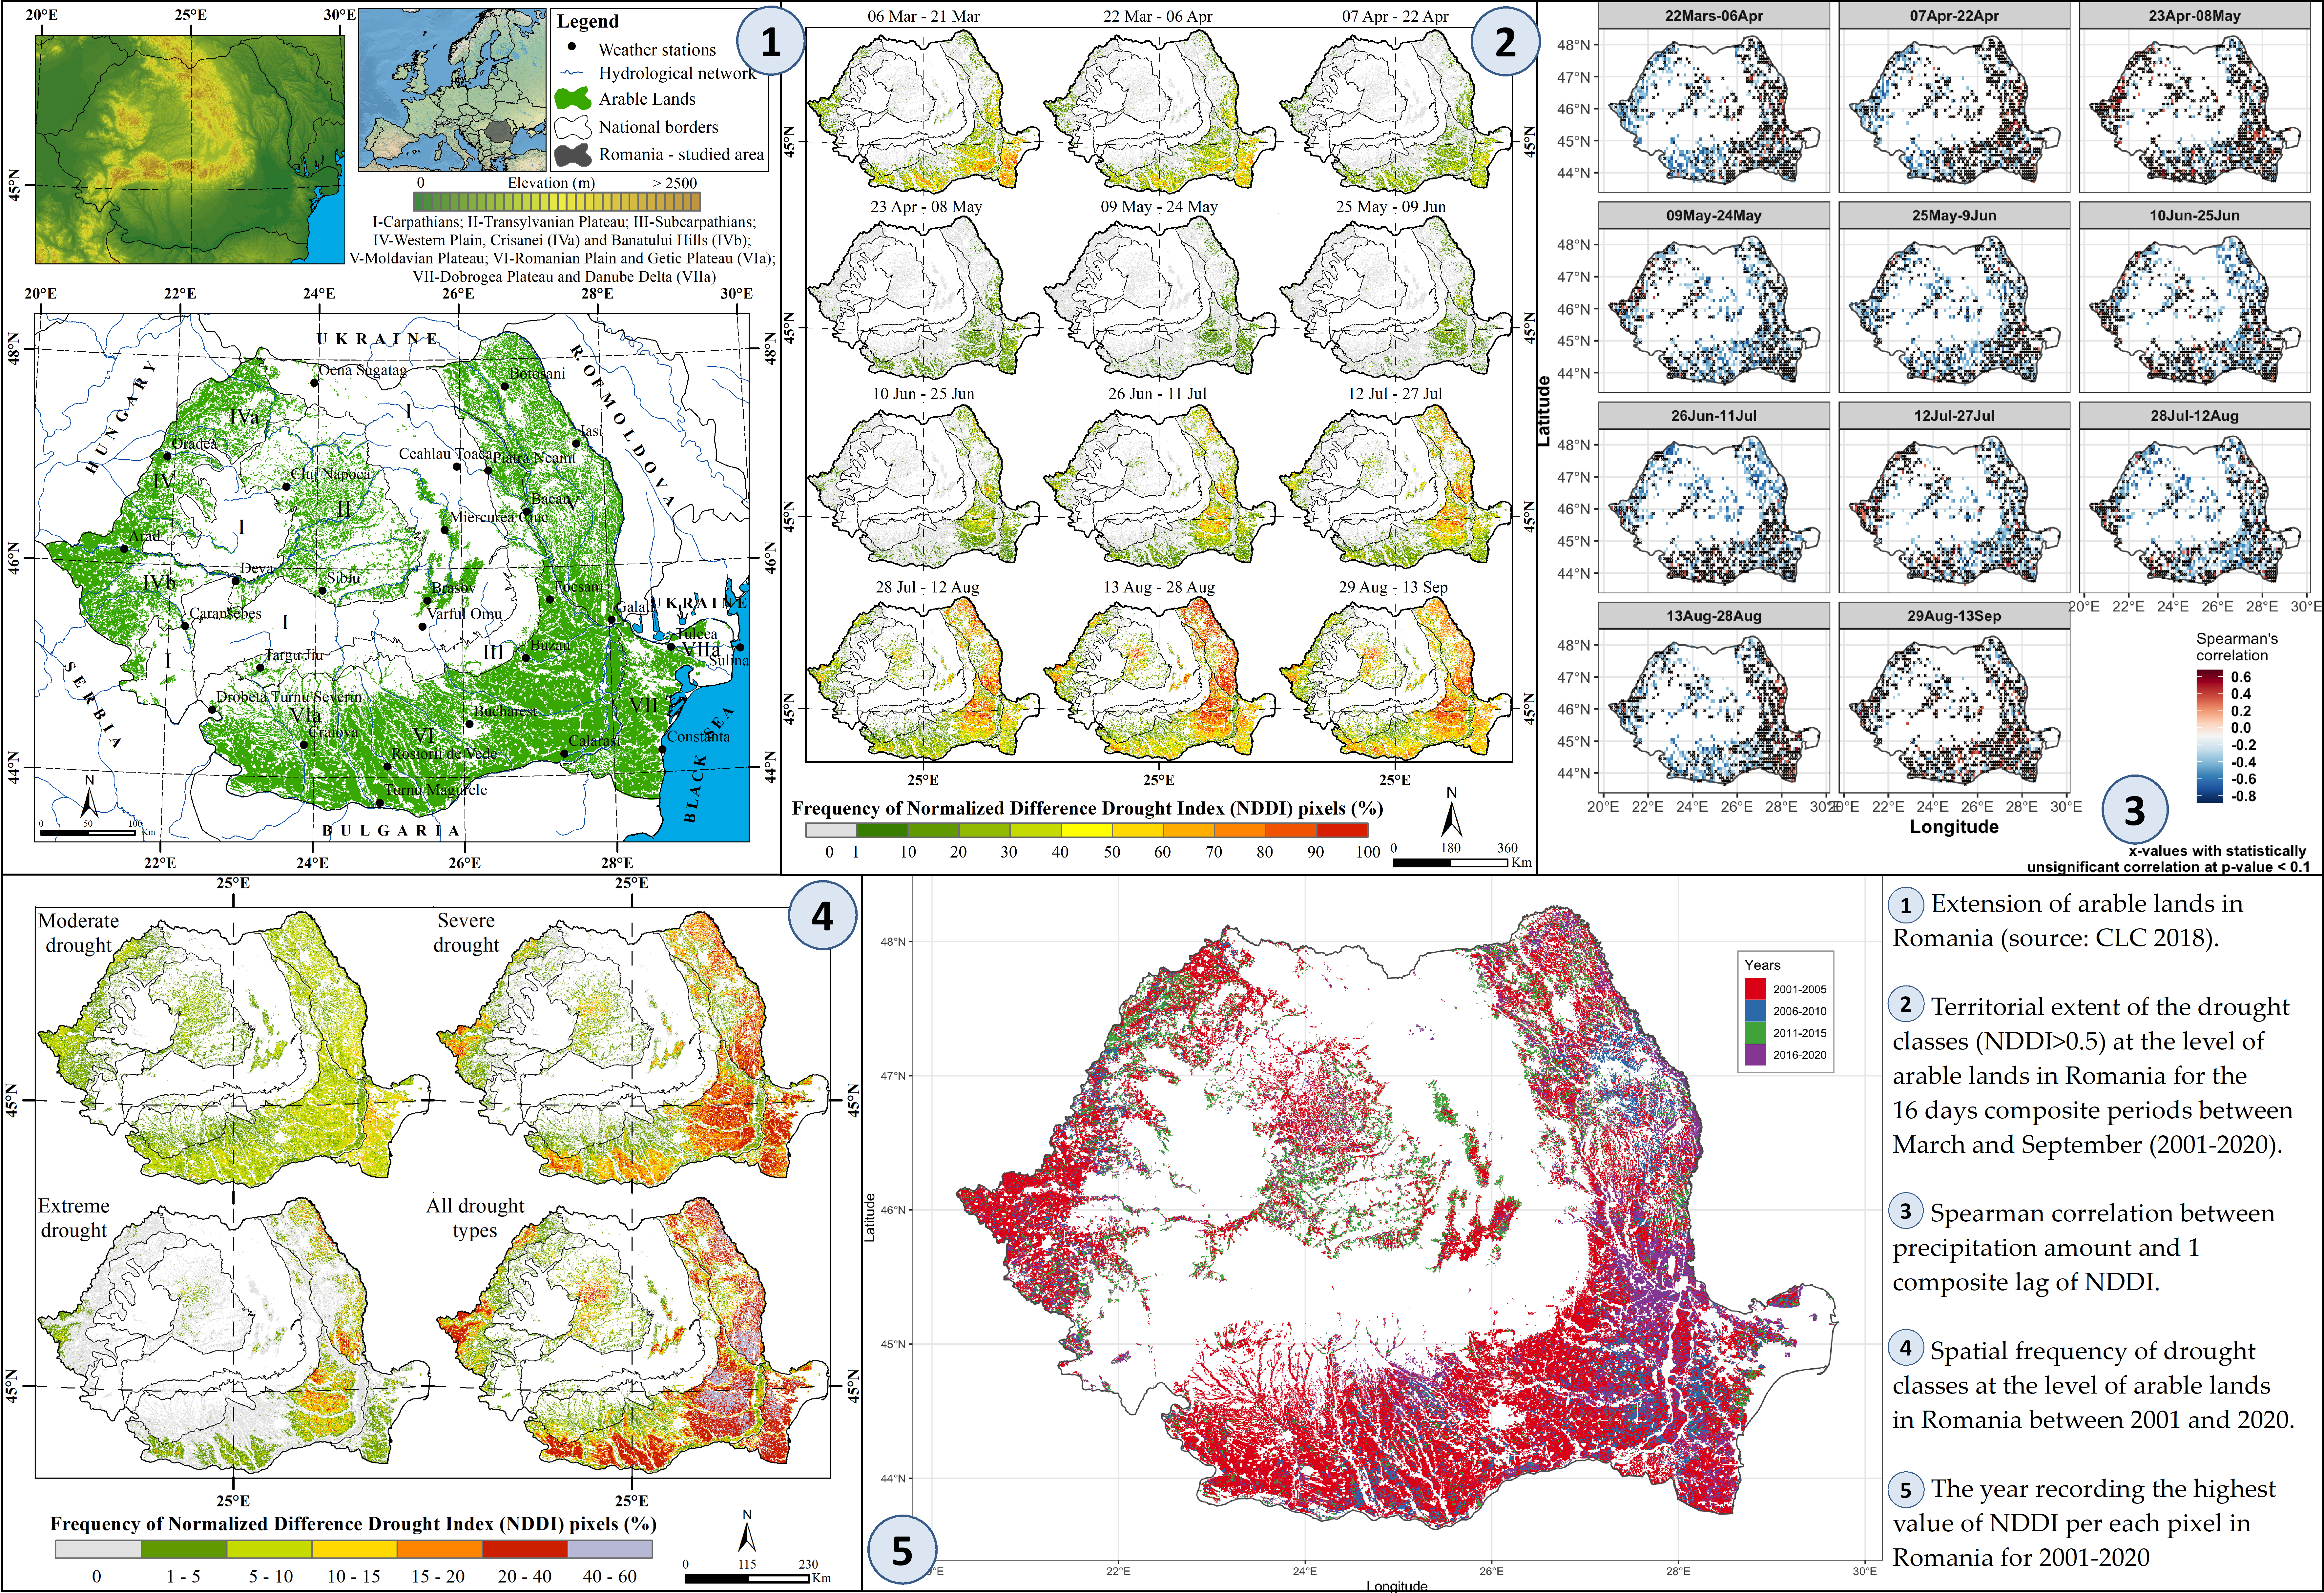
2.1. Study Area and Its Geographical Features

With a territory of about 238,500 km2, Romania is the largest country in south-eastern Europe (Figure 1). The distribution of major landforms, with 31% mountainous area, 33% hills and sub-mountainous areas and 36% plains and meadows, provides its territory with significant climatic diversity [48].
First, regarding latitude, the average annual temperature decreases by 3 °C between the south and the north of Romania (from 11 to 8 °C), and regarding altitude it decreases by about 14 °C from the lowlands to the highest mountain peaks (from 11 to −3 °C). The amounts of precipitation are also strongly influenced by the topography. Compared to the average values in the plain areas from the west (about 600 mm) and east (about 400 mm) of the country, in the high mountain areas average precipitation rises on the slopes exposed to the advection of humid air masses at more than 1400 mm [49].
Second, the western and central regions of Romania are particularly impacted by the cyclones formed in the Atlantic and Mediterranean Seas (following a Pannonian track). These cyclones produce significantly more precipitation compared to the cyclones of Mediterranean origin, following a trans-Balkanian track, which produce more significant precipitation in the southern and eastern regions of the country [41,49,50,51,52,53].
It should be noted that the multiannual amount of precipitation at the country scale remained generally stable during the last interval [50], except for some areas in the north and north-west of Romania, with a positive trend, and from the east, south and south-east of the country, with a negative trend [54]. At the same time, there was an increase in evapotranspiration in Romania which led to increased aridity [46,50], which led some authors [46] to discuss a possible ongoing process of desertification, similarly to that in other regions of southern Europe, such as Spain [55], Italy [56] and Greece [57].
The arable lands in Romania cover an area of about 11 million hectares, of which more than 50% are located in the plain regions of the south, west and extreme north-east of the country, where the arable lands represent the main type of land cover (Figure 1, Table 1).
Moreover, due to the large extent of arable lands, it should be noted that Romania represents one of the main producers of maize and wheat in Europe [50], but given the small ratio of irrigated land, representing less than 10% of all arable lands [58], the annual rank in cereal production at European level is highly variable depending on year-to-year weather conditions.

2.2. Data Used

2.2.1. Moderate Resolution Imaging Spectroradiometer (MODIS) Data

The MODIS Vegetation Indices (MOD13Q1) Version 6, based on a 16-day composite at 250 m spatial resolution [59,60,61], were used to calculate the NDDI. The MOD13Q1 product includes 12 layers, of which only three layers were used: band 1 (16 days Red reflectance—620 to 670 nm), band 2 (16 days Near Infrared reflectance—841 to 876 nm) and band 7 (16 days Middle Infrared reflectance—2105 to 2155 nm) (Table 2 and Table 3). These MODIS products were extracted from the Land Processes Distributed Active Archive Center (LP DAAC), using Application for Extracting and Exploring Analysis Ready Samples (AppEEARS), ver. 2.42.1 [62]. Thus, 721 Surface Reflectance Bands for 16-day composite images (1, 2 and 7 bands) were used to calculate the NDDI.
The 16-day composite was chosen because it minimizes the errors induced by clouds. However, these errors generated by the clouds were still present and were eliminated as further explained in Section 2.3.1.

2.2.2. Corine Land Cover (CLC) Data for Arable Lands

The arable lands from Romania were extracted from CLC 2018. CLC 2018 is a dataset produced within the framework of the Copernicus Land Monitoring Service that refers to the land cover status of 2018 in Europe. The CLC service has a long heritage (formerly known as the “CORINE Land Cover Program”), and is coordinated by the European Environment Agency (EEA). It provides consistent and thematically detailed information on land cover and land cover changes in Europe. This project has a regular update time period of approximately six years [63]. In this classification, arable lands represent a distinct land cover category.

2.2.3. Precipitation Data

The relationship between atmospheric precipitation amount and NDDI was also analyzed, in order to understand how the crop vegetation responds to this major atmospheric driver of drought occurrence. The precipitation time series used in this study were taken from the ENSEMBLE project gridded data set E-OBS [64]. These data were obtained using a kriging interpolation procedure from the European Climate Assessment and Dataset (ECA&D) time series at meteorological stations [65]. The E-OBS version used in this study was version 21 (release date: May 2019) and covers Europe with a spatial resolution of 0.1° from 1950 to 2019 at a daily time step. The precipitation amount for the year 2020 was added from the ERA-5 land reanalysis hourly dataset of the Copernicus Climate Change Service C3S Climate Data Store (CDS) [66]. Reanalysis was conducted by combining the model data with observations across the world into a complete and consistent dataset. The spatial resolution of the ERA-5 land reanalysis is 0.1°, thus no resampling was needed. The precipitation amount was calculated for each 16-day composite (12 composites between March and September) and for each year (20 years), similar to that of the NDDI.

2.3. Methodology

2.3.1. Gap-Filling of MODIS Images

The quality of remote sensing products is highly influenced by weather conditions. Among these factors, cloud cover can frequently induce gaps in the time series of the satellite optical imagery. To fill these gaps retrieved from MODIS over Romania, the Data Interpolating Empirical Orthogonal Functions (DINEOF) procedure was applied [67,68,69]. Recently, this method has been used in various remote sensing products such as for the reconstruction of total suspended matter [70] sea surface salinity [71], sea surface temperature derived from MODIS [68,72], MODIS-Aqua chlorophyll products [73] or LST over Bucharest [74]. More appropriate to our study, Filliponi et al. [75] applied the DINEOF algorithm to the reconstruction of the MODIS Fraction of Green Vegetation around the world.
The DINEOF procedure was run to gap-fill all MODIS NDDI composites and reconstruct the missing pixels. A full completeness (100% availability) composite (August 2012) was set as a profile mask, thus only pixels within the arable lands were filled. The DINEOF gap-filling method was applied using the rtsa R package version 0.3 for Raster time series Analysis (https://github.com/ffilipponi/rtsa/blob/master/DESCRIPTION (accessed on 15 February 2020) [75]. To evaluate the DINEOF method, artificial gaps were created for a full completeness composite and compared with the original. The difference between pixels of the original composite and DINEOF gap-filled pixels are shown in Table 4. For more details regarding this procedure see Figures S1–S3 in the Supplementary Materials.

2.3.2. NDDI Calculation and Drought Assessment

Generally, no index can fully describe the complexity of drought at both temporal and spatial levels. Hence, it is recommended to combine several parameters, indicators or indices (including remote sensing data) in a single product for drought classification [20].
First, band 1 (B1), band 2 (B2) and band 7 (B7) from 16-day composite images at 250 m resolution of the MOD13Q1 product were extracted. Using these bands, the NDVI was calculated using B1 and B2 bands [20], by applying Equation (1), and NDWI was calculated from B2 and B7 [20,76], by applying Equation (2).
The NDVI is a classical index which measures the development and the density of vegetation and has values from −1.0 to 1.0. Negative values indicate clouds or water, whereas positive values indicate soil without vegetation (values near to zero), and dense green vegetation (values equal or higher than 0.6) [77,78]. The NDVI is widely used to evaluate the main parameters of vegetation, induced mainly by climate conditions, human activities and other anthropic or natural causes. NOAA/AVHRR, SPOT (French: Satellite Pour l’Observation de la Terre), MODIS or LANDSAT [9,10] imagery can be used to achieve these products. It should be noted that the NDVI is included in this product and can be downloaded already calculated. The NDVI was calculated using the following formula [20]:
NDVI Modis = B 2 B 1 B 2 + B 1 ,
where B1 and B2 refer to MODIS band 1 and band 2, respectively.
Additionally, the NDWI is an index which measures the water content of leaves and is used for detecting and monitoring vegetation humidity. The NDWI is influenced by plant dehydration, and it is considered to be a better indicator for drought monitoring than the NDVI [77]. The NDWI also has values from −1.0 to 1.0. The common range for green vegetation is −0.1 to 0.4. This index increases with vegetation water content or from dry soil to free water [78,79]. Both the NDVI and NDWI have been used in different studies to observe their relationship with LAI for the study of the characteristics of vegetation that covers different regions, including arable lands [80,81,82] or FPAR [19,83]. The NDWI was calculated using the following formula [20]:
NDWI Modis = B 2 B 7 B 2 + B 7 ,
where B2 and B7 refer to MODIS band 2 and band 7, respectively.
It has been found that the NDWI is more sensitive than the NDVI to drought conditions, providing information about the amount of water that enters the plant [20]. In addition, it has been found that the average in cases of drought is below 0.5/0.3 in the case of the NDVI/NDWI, whereas in periods without drought, the NDWI/NDVI has values above 0.4/0.6 [6].
Although meteorological drought has been and can be well studied further using the NDVI and NDWI, a new index combines the information provided by the NDVI and NDWI. The NDDI was recently developed [20], and has been used to monitor the drought parameters in different regions of the world [6,84,85,86,87], representing a sensitive drought assessment tool for agriculture [88]. The first research to analyze the potential of this drought monitoring index was conceived with good results for the Flint Hills region of eastern Kansas and north-eastern Oklahoma [89].
Using the NDVI and NDWI results, the NDDI was calculated according to the equation below [20]:
NDDI = NDVI NDWI NDVI + NDWI ,
The resulting values of the NDDI range generally from 0 (no drought) to >1.0 (extreme drought).
The NDDI has a stronger response to summer drought conditions than a simple difference between the NDVI and NDWI, and is more sensitive indicator of drought in grasslands and arable lands than the NDVI alone. Because NDWI values decrease more than NDVI values during summers with severe drought, suggesting that the NDWI is more sensitive than the NDVI to drought conditions, the calculation of the NDDI is considered to be a more complex calculation compared to the NDWI and NDVI [20].
Finally, it was found that the NDDI combines well the information provided by the NDVI and NDWI, that it has a wider range of values than a simple NDVI–NDWI differentiation, and that it can be used, based on MODIS images at a good resolution, for the analysis of drought at local scales [90]. Thus, it has been used increasingly often in different regions to study the extent and severity of drought, especially during the vegetation period [6,22,86,91]. Because the NDDI is more sensitive and more accurate, drought-affected territories will be identified more often compared to using the NDVI or NDWI, with differences of up to 5% [6,90]. In Romania, this index has also been used based on MODIS images but to a small extent [83,84,92].
Using the final NDDI products for the 12 composites for each year between 2001 and 2020, a total of 240 16-day composites were derived. In these composite images, the absolute and relative frequency of NDDI values indicating drought (>0.5) were computed for each pixel. To assess the drought severity, the drought frequency for each pixel was considered, taking into account the NDDI classes [84,89] higher than 0.5, which indicate moderate drought (0.5–0.6), severe drought (0.6–1.0) and extreme drought (>1.0). Furthermore, these results were aggregated at annual and multiannual levels.
All of the cartographic presentations of the drought spatial distribution in this paper were constructed using ArcGIS software, version 10.3, produced by ESRI (Environmental Systems Research Institute).

2.3.3. Spearman’s Correlation Analysis between NDDI and Precipitation Amount

To check the relationship between the NDDI and the precipitation amount—one of the major drivers of drought conditions—Spearman’s correlation was applied. Using an iteration for each pixel, Spearman’s correlation was first applied between each 16-day composite precipitation amount and the corresponding NDDI values for the same period, and then for the entire analyzed period (2001–2020). In this analysis a significance level of p-value <0.10 was used.
However, the relationship between atmospheric precipitation and the NDDI is far more complex. Therefore, in addition to a direct Spearman correlation between the two parameters, we determined the inertial effect of atmospheric precipitation on the state of crop vegetation. For this, a lagged correlation was applied between the composite n of atmospheric precipitation and the composite n + 1 of the NDDI (1lagged composite correlation). Similarly, we applied the correlation for 2composites lagged (n composite of atmospheric precipitation with n + 2 composite of NDDI) to fully cover the inertial response of the NDDI to precipitation input.

3. Results and Discussions

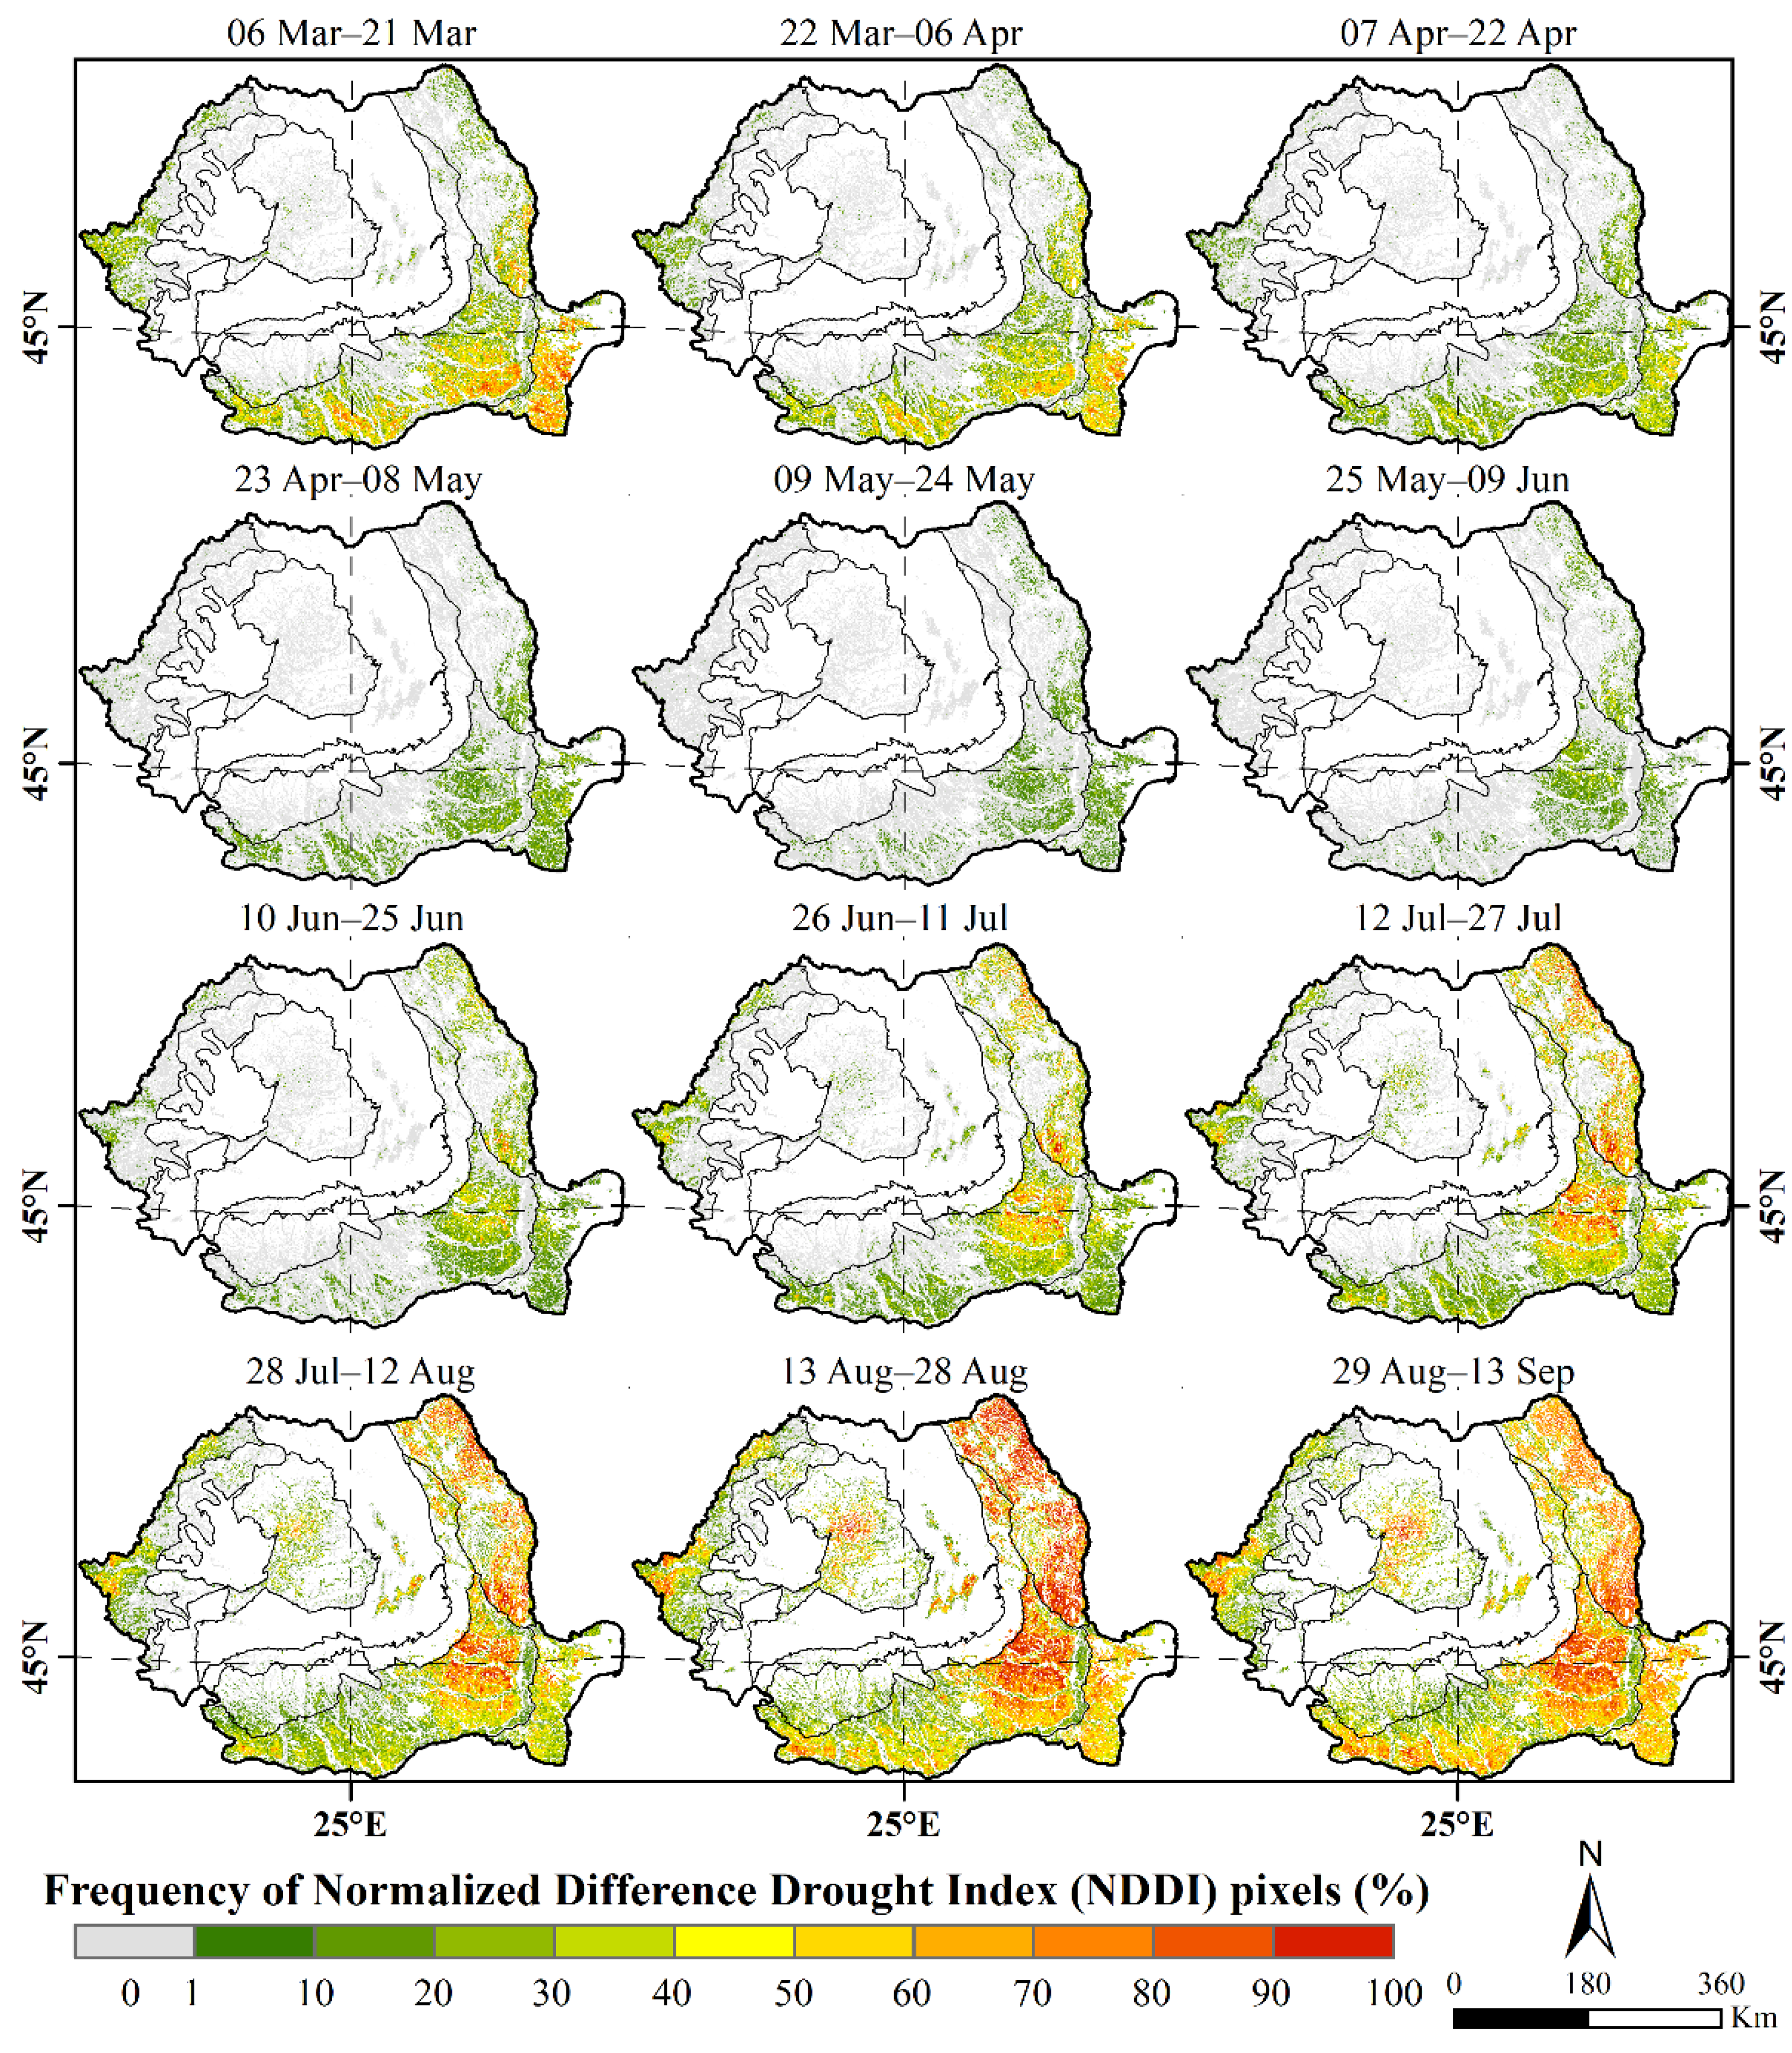
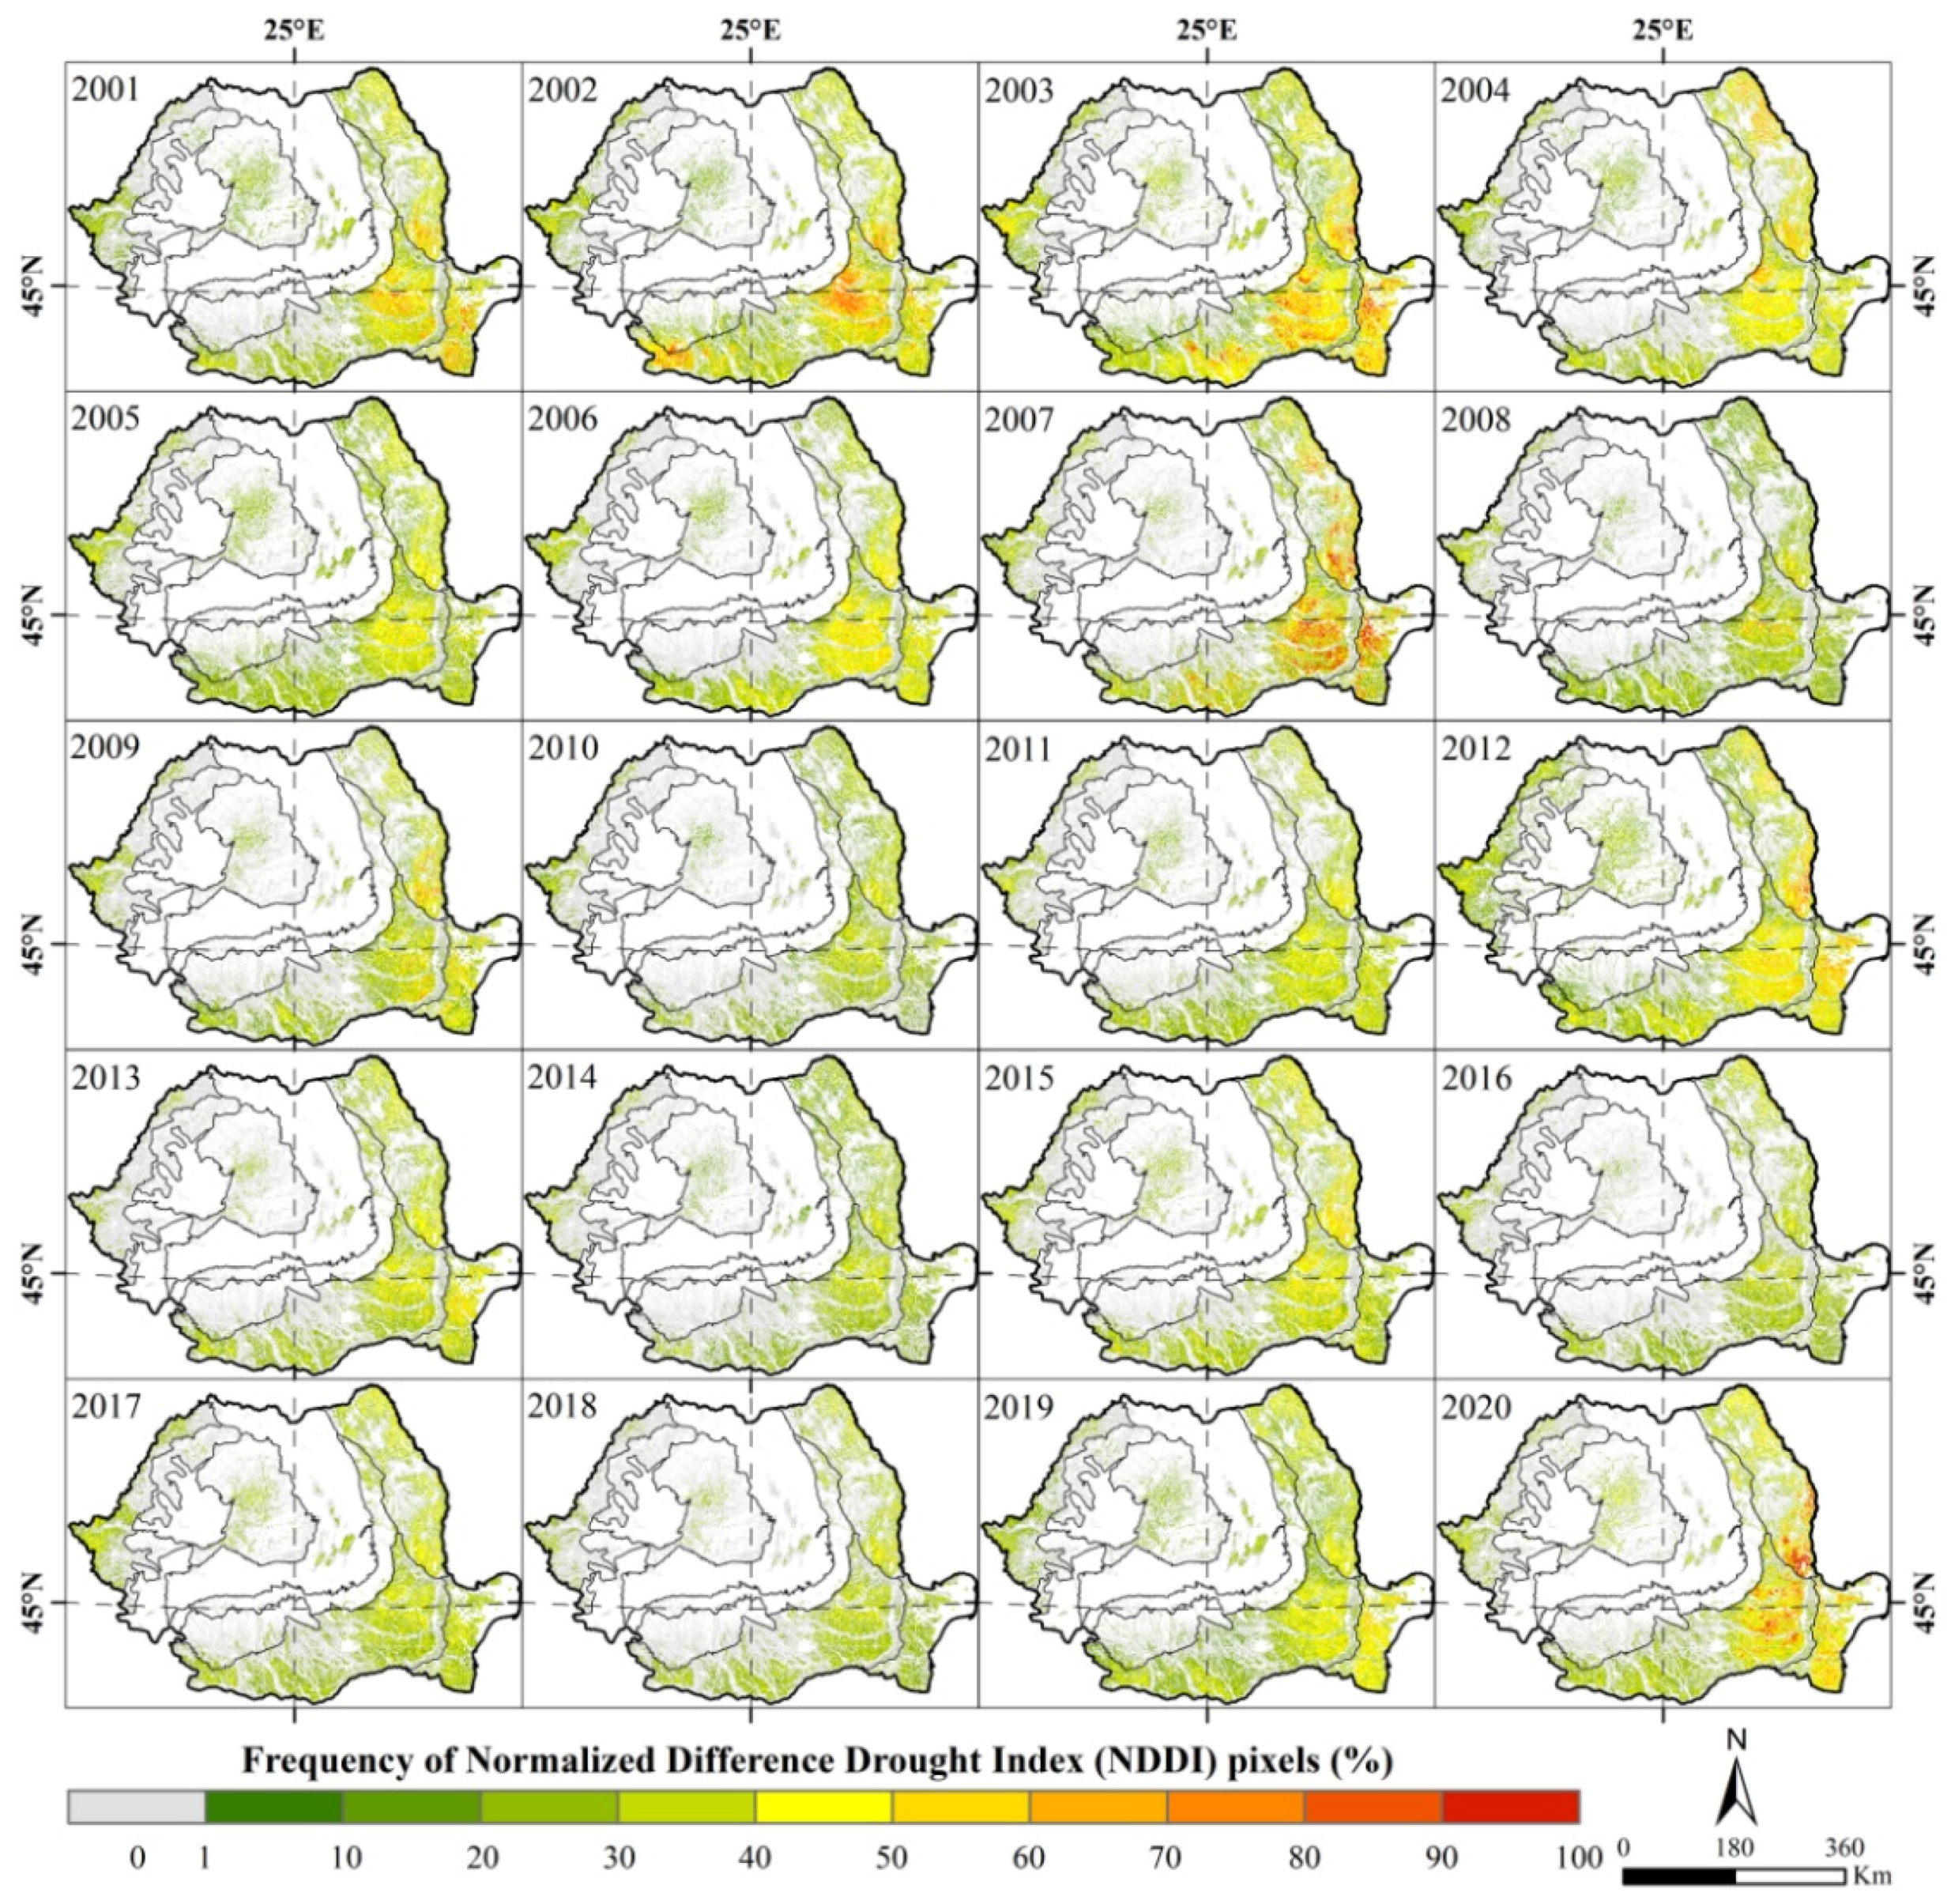
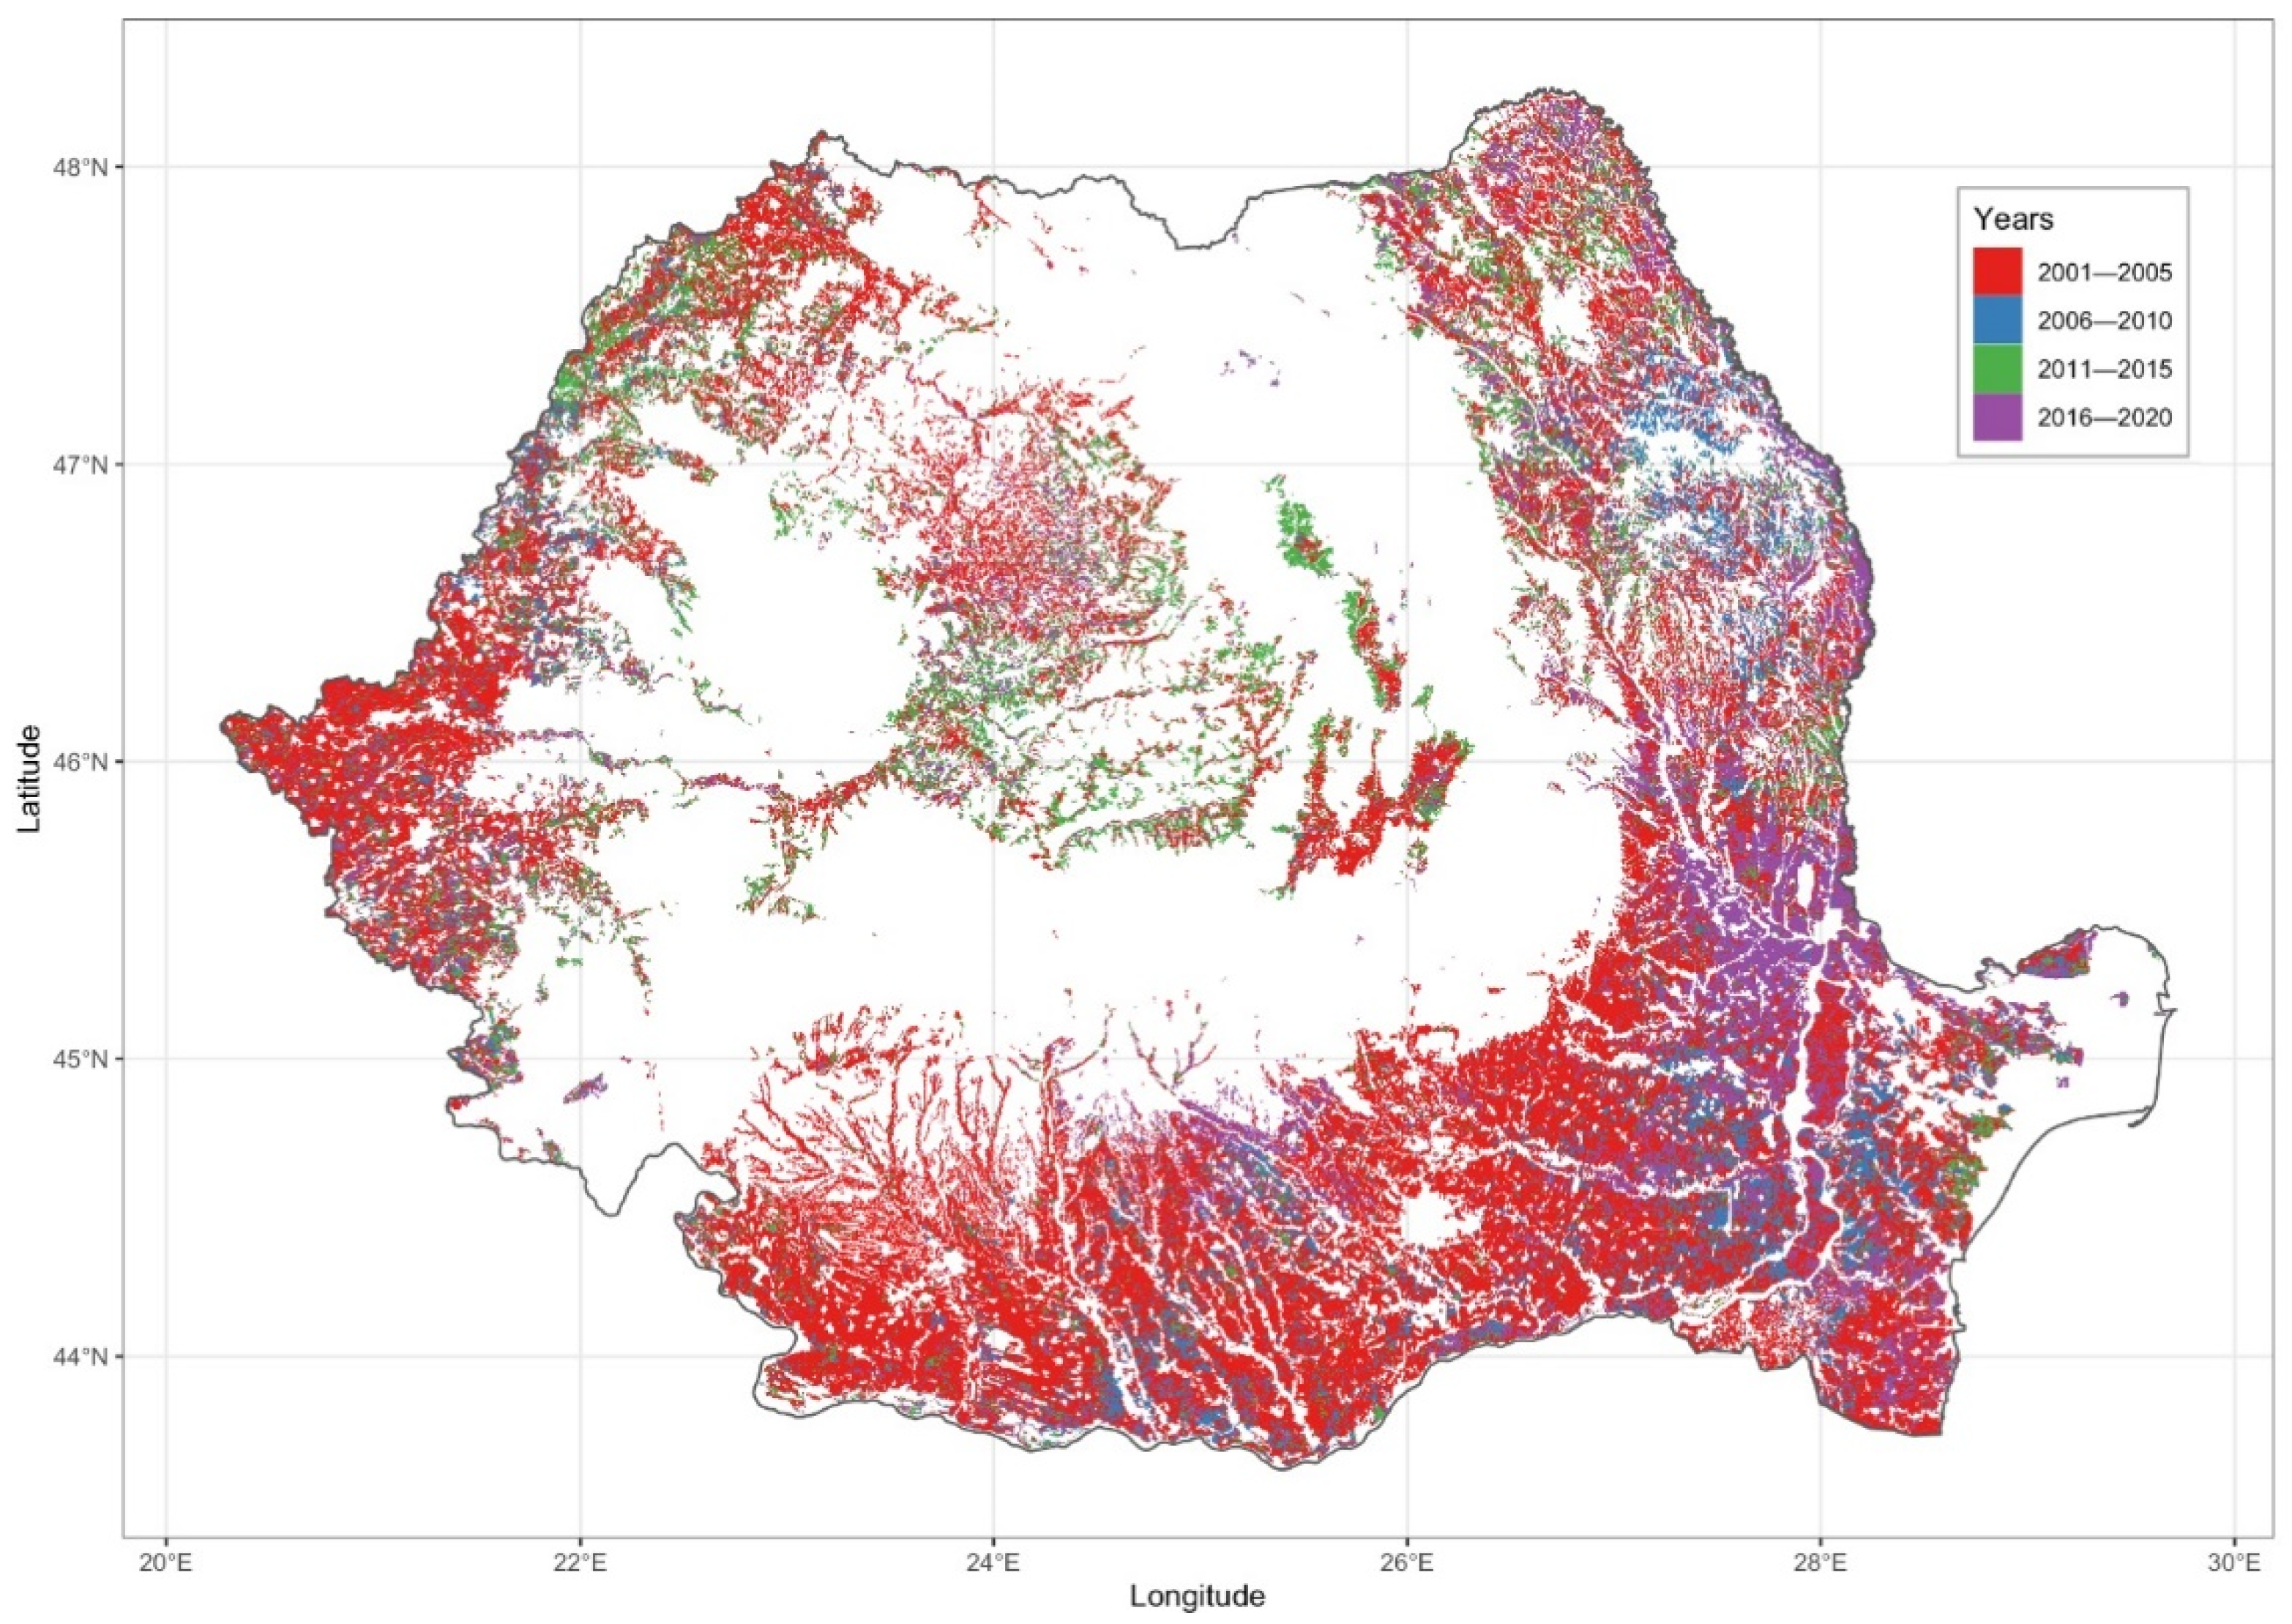
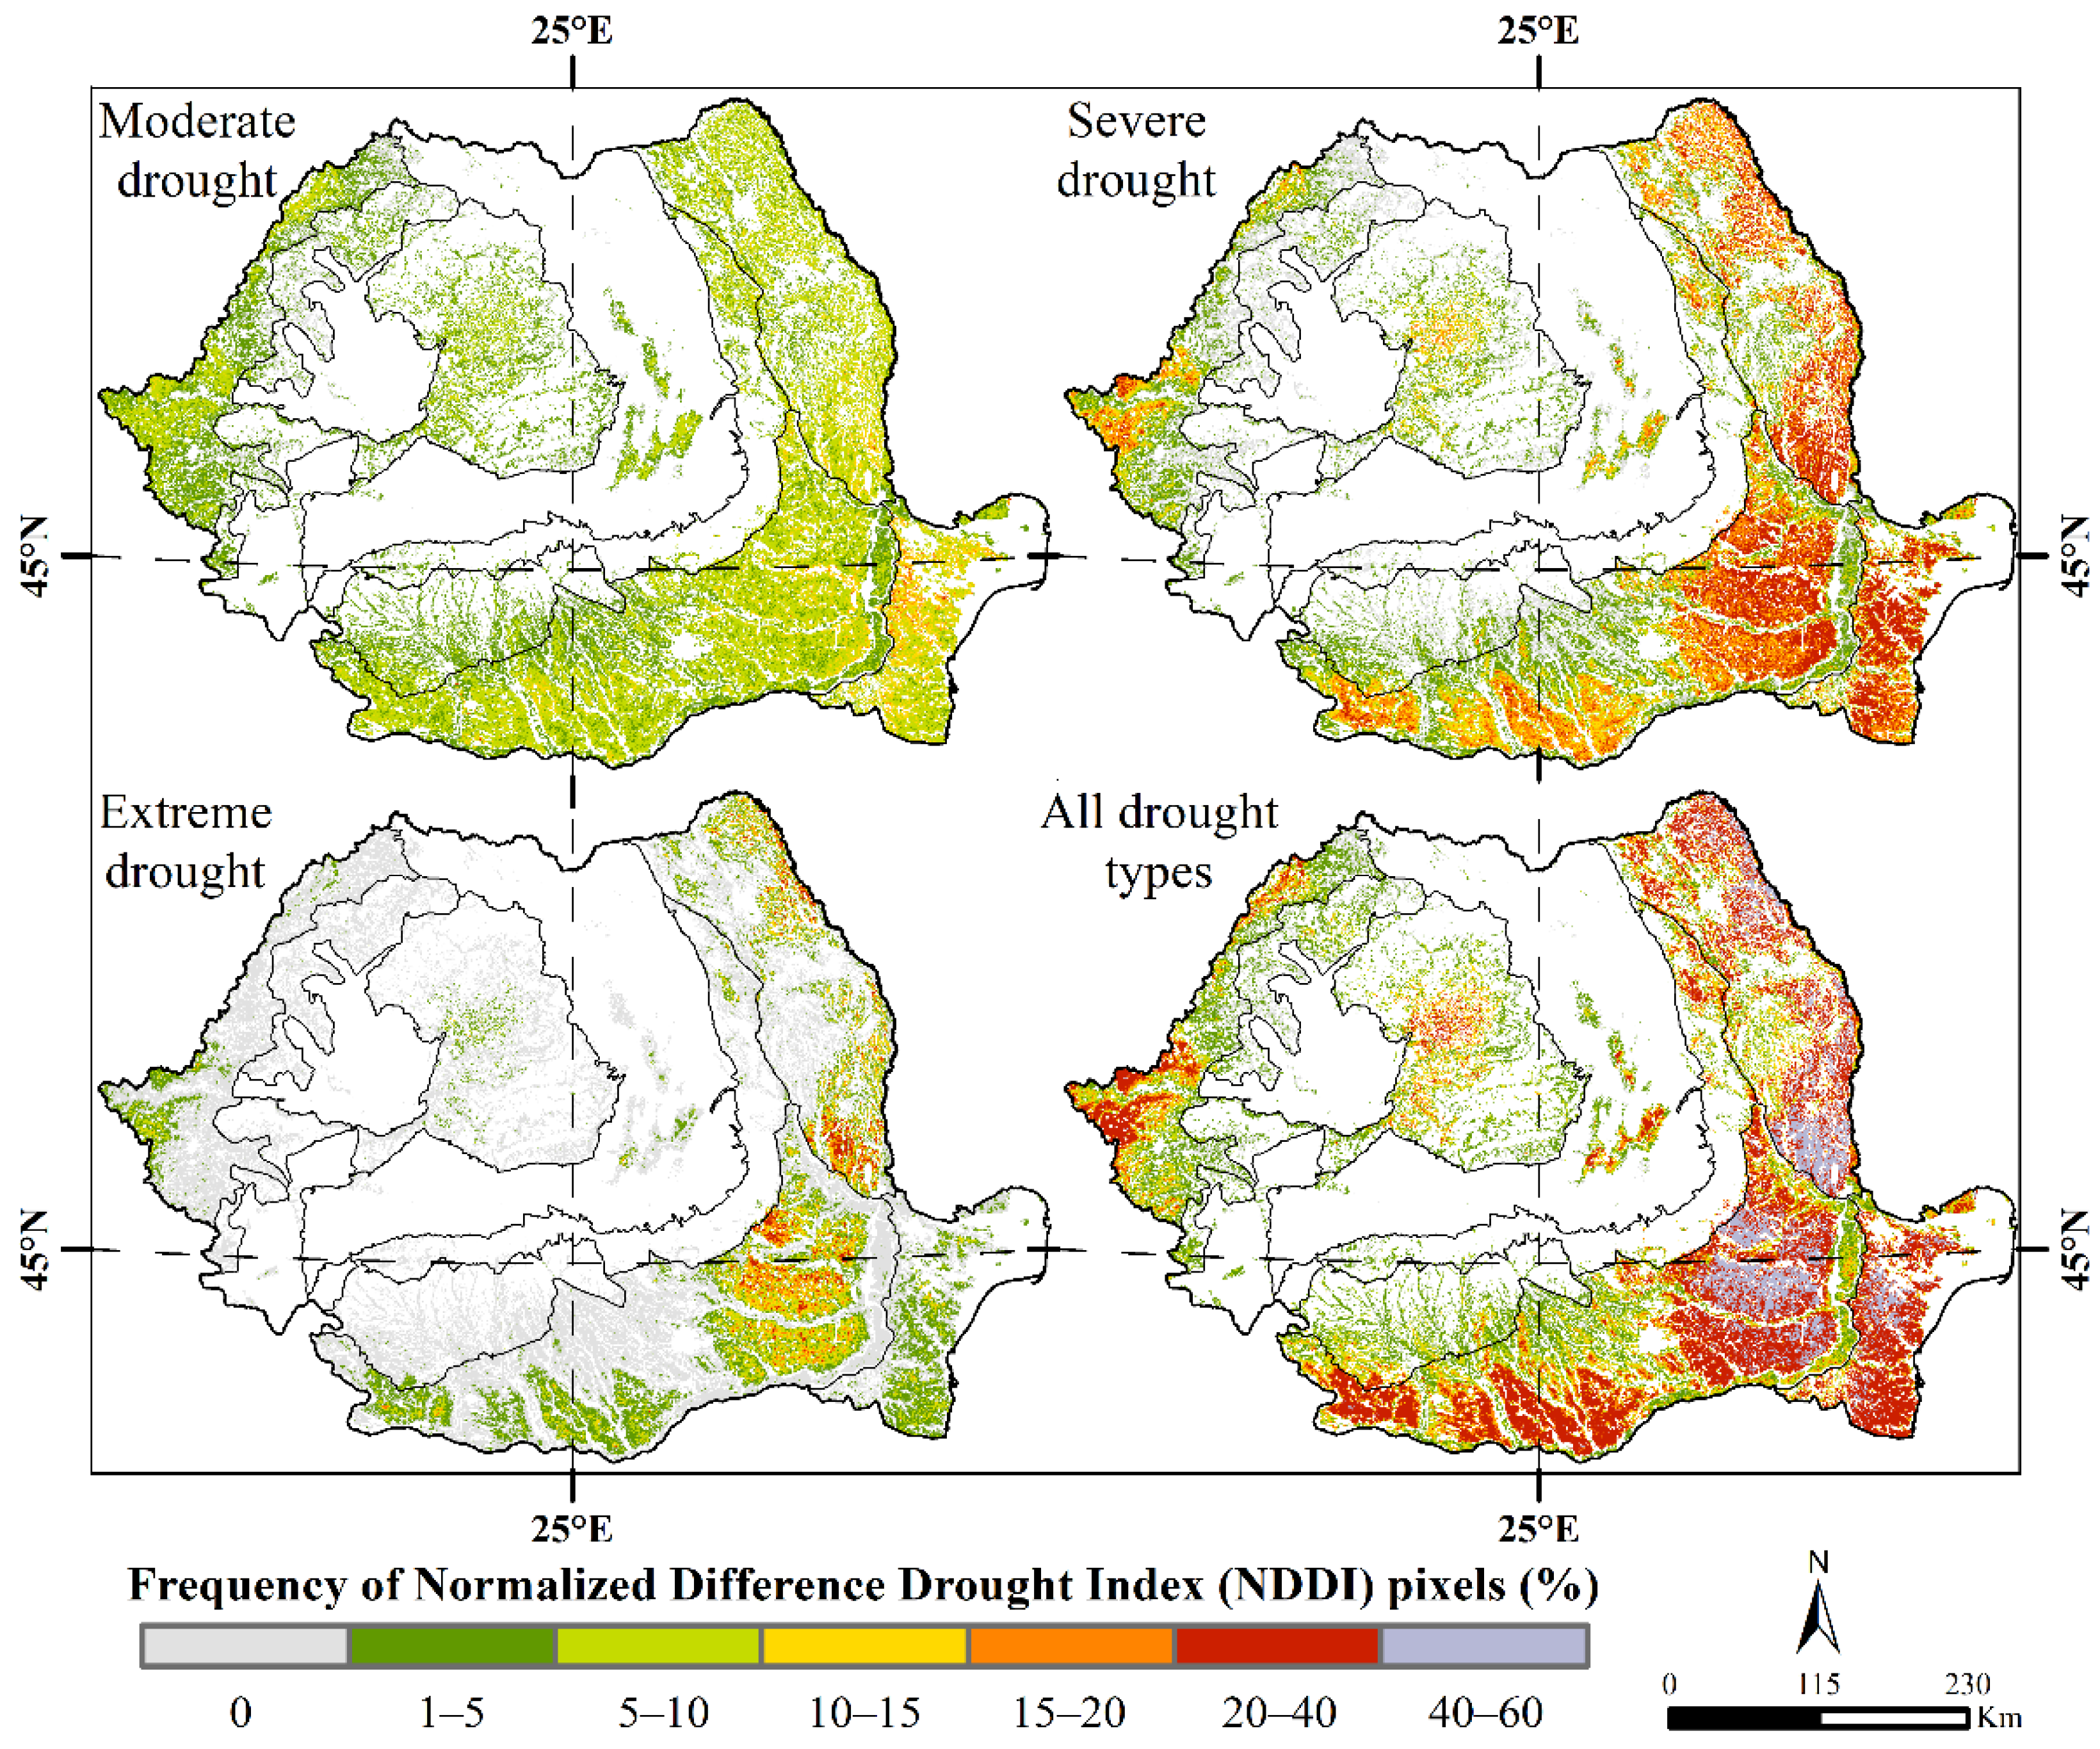
3.1. Drought Extent and Severity According to NDDI

The results of our analysis indicate firstly that, as a multiannual mean, 17.2% of arable land was affected by drought during the analyzed period (2001–2020), with a larger extent during the very dry years (25.6% in 2003, 24.1% in 2012, 23.0% in 2002 and 21.9% in 2020). By comparison, during very humid years, the arable lands were clearly less affected by drought (10.8% in 2016, 11.0% in 2014, 11.1% in 2018 and 11.2% in 2010). Thus, as a general feature, drought has constantly affected the territory of Romania, although only some regions have been severely impacted (Table 5 and Figure 2). Taking into account the fact that more than 70% of the arable lands in Romania are found in plain regions, we observe that these are the regions constantly facing the risk of drought occurrence and the associated impacts on agriculture production.
Additionally, the trend analysis applied to all drought types (moderate, severe, extreme) between 2001 and 2020 (Table 4) indicates a decreasing trend (R2 = 0.14, p-value < 0.10), in contrast to other trends identified using other methods for drought assessment [46]. More details regarding the trend analysis are given in Figures S4 and S5 in the Supplementary Materials. Moreover, it can be observed that the first part of the analyzed period (2001–2010) recorded more years in terms of drought extent and severity than the second interval (2011–2020). Therefore, we can assume that the discussed increase in the frequency of drought events derived mainly from standardized precipitation index [93,94,95] is not firmly supported from the perspective of crop vegetation conditions, assessed using the NDDI.
In terms of spatial distribution of drought for the 12 annual composites (Figure 3), and from year to year (Figure 4), we can see that the NDDI drought classes are present in all of the arable regions of Romania. As a main feature, a general country scale asymmetry, with the south-eastern regions more prone to drought than the western side of the country, can be clearly seen. This asymmetry is explained partially by the asymmetry in the field of atmospheric precipitation between these regions, but probably also by a plethora of other factors. For instance, it is known that the NDDI can also be influenced by the prevailing crop type (more wheat in the south-east of Romania), by some types of soils that easily lose the water reserve in the upper layers (such as those in the south and south-east of Romania developed on loess and sands), and by the level of underground water. For instance, analyzing the results for each composite between March and September (Figure 3), it can be seen that drought is less pronounced from April to June, an interval corresponding both to the peak in annual precipitation amount in Romania and to the maximum crop vegetation development. After the end of June, the drought increases in spatial frequency as a combined effect of the decrease in precipitation amount and the depletion of the arable lands by vegetation, due to the harvest of some important crops, such as wheat.
In general, the south-east of Romania was affected by drought even during the wettest years, such as in 2010, 2014, 2016 or 2018 (Figure 4). Normally, if we discuss the manifestation of the desertification process in Romania [46], one should expect this phenomenon in those regions that are affected by drought even during the wettest years. However, our analysis does not support the so-called theory of desertification in Romania, at least from the perspective of crop vegetation conditions.
To underline the variability of drought occurrence at the country scale, we identified, for each pixel on the map of arable lands in Romania, the year recording the highest value of the NDDI, indicating either severe or extreme drought conditions. The results were simplified by grouping them into four classes that indicate the 5 year interval in which these values were recorded (Figure 5).
Although the southern and western parts of Romania recorded the highest values of the NDDI, mainly between 2001 and 2005 (due to 2003 and 2002 drought events), and secondly during 2006–2010 (as an effect of the 2007 drought episode), in the central and north-western parts of Romania, over large parts of the arable lands, the interval 2011–2015 had the highest drought impact (particularly due to the 2012 drought event). For the north-eastern part of Romania, even if 2001–2005 recorded most of the maximum values of the NDDI, no interval appears to be dominant for the most severe drought conditions as a whole: 2016–2020 prevailed over the southern part of the region together with the Bărăgan region, 2006–2010 prevailed over the central part of the region, and 2011–2020 was more present over the northern part, in particular (Figure 5).
Consequently, the most important region subject to drought in Romania (Figure 6), as derived from the NDDI values, extends over the southern part of the Moldavian Plateau and the eastern part of the Romanian Plain (the so-called Bărăgan Plain, one of the most important agricultural regions in Romania). However, within this region, drought was not pronounced along the valley of the rivers (Siret, Buzău, Ialomița). In addition, we can distinguish a compact strip of arable land oriented from north to south, located east of the Romanian Plain and west of the Dobrogea Plateau, along the Danube, between the cities of Galați and Călărași, which is not severely affected by drought. This region is represented by lands between the Danube branches, recording a high degree of soil humidity and benefiting from well-developed irrigation systems [47]. A second important region impacted by drought is located in the north-eastern part of Romania, within the Moldavian Plain. In addition to these two important regions, drought is also common in the Dobrogea region, in the southern part of the Romanian plain and in the western part of the country, in a region that is relatively distant from the extremity of the Pannonian Plain.
It is important to underline that all of these regions that are affected by drought have at least three elements in common: the low amount of precipitation with a multiannual mean less than 300 mm between March and September [49], a very high level of groundwater vulnerability [96,97] and the prevalence of wheat crops in the arable lands.
For a more comprehensive view on drought, in addition to the frequency of drought classes for the entire period from 2001 to 2020, we selected the upper/lower third (that is, 7 years) of the driest/wettest years from 2001 to 2020, according to the results shown in Table 2. We thus present more synthetically the distribution of the frequency of drought classes of the NDDI, selecting the most relevant years for drought/humid conditions (Figure 7 and Figure 8).
The driest 7 years between 2001 and 2020, as shown by the NDDI values (Table 5), were by 2003, 2012, 2002, 2020, 2007, 2001 and 2019. Clearly 2003, with 7.4% of the arable land affected by moderate drought and 19.0% affected by severe and extreme drought, represents a record year from this point of view. The second driest year was 2012 with 7.2% of arable land affected by moderate drought, and 16.9% affected by severe and extreme drought.
The spatial extent of drought as shown by the NDDI values for these years presents a similar pattern as for multiannual mean, but extreme drought conditions are extended over the Dobrogea Plateau, the north-eastern part of the Moldavian Plateau and the southern central part of the Romanian Plain (Figure 7). For the western part of Romania during these years, the differences from the multiannual mean are not high, indicating a less pronounced impact of drought in this region.
In contrast, the wettest 7 years between 2001 and 2020, as shown by the NDDI values, were 2016, 2014, 2018, 2010, 2008, 2009 and 2013. The wettest years were 2016 and 2014 with only 10.8% and 11%, respectively, of arable land affected by drought (Figure 8, Table 5). Regarding the territorial extension of the drought during these intervals, the most affected areas remained the eastern and southern parts of Romania. Certainly, during these years the drought manifested with a lower degree of severity. However, even in these general humid conditions the drought remained a threat in some regions pf eastern Romania, particularly in the northeast and southeast of the Moldavian Plateau, in the eastern part of the Romanian Plain and the Dobrogea Plateau. Because these are the regions in Romania that are constantly affected by drought, drought in these regions should not be considered an extreme meteorological event, but a common climate feature. That is, in these regions agriculture is not possible without intensive irrigation.

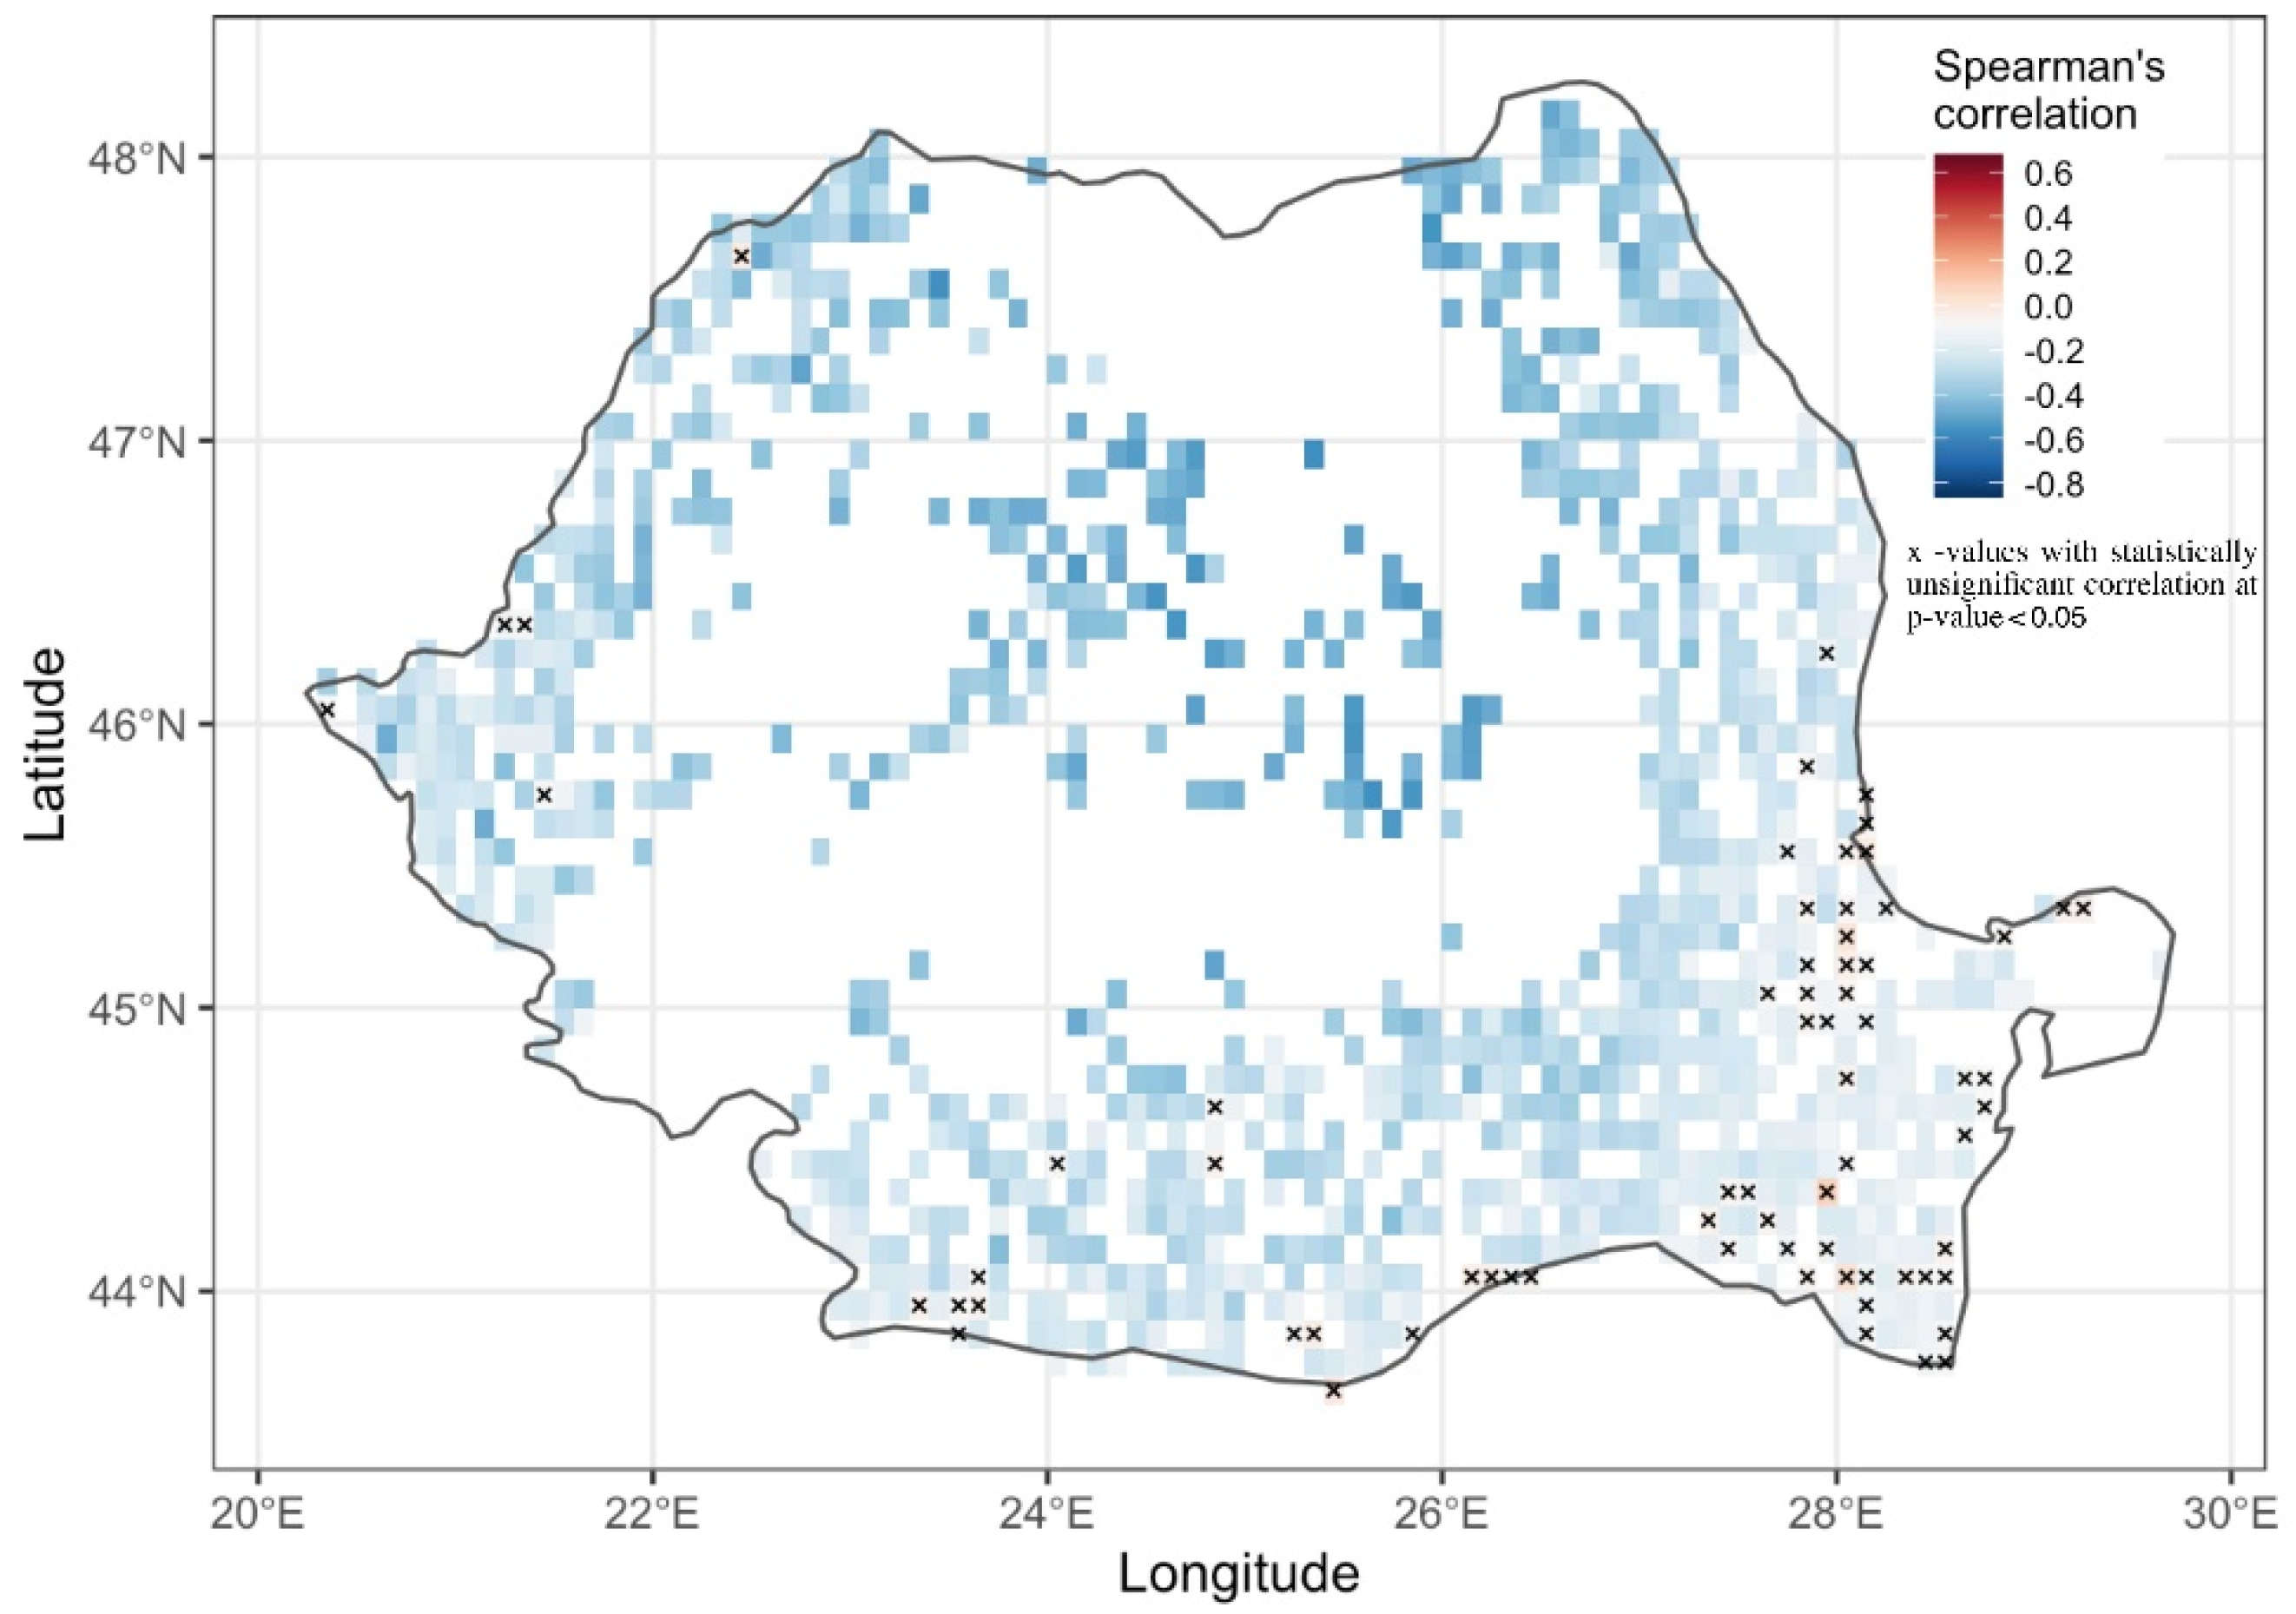
3.2. The Relationship between Atmospheric Precipitation and NDDI

The relationship between the atmospheric precipitation amount and the NDDI is governed by a logical inverse correlation (−0.37 Pearson coefficient, statistically significant for p < 0.10). In addition, the difference (70.4 mm) between the means of the precipitation amount for the five most dry/humid years, defined using the NDDI (Table 5), is statistically significant at p < 0.10.
Generally, we can observe that the 1-composite lagged correlation is prevalent for the entire interval with a spatial frequency of pixels with significant correlation reaching the maximum (ca. 30% of all the arable lands) from May to July (Figure 9). Moreover, for March and April (with a minimum between 23 April and 8 May) the direct correlation is very weak, as also observed by Potopová et al. [98] in the Republic of Moldova for the correlation between the NDVI and SPEI. The thermal increase in this period most likely causes a rapid increase in vegetal activity and so, although the precipitation amounts are not high, the plants develop rapidly (Figure 9a). In fact, the correlation is weak for this period, and also for the 1- and 2- composite lagged correlations, supporting the same explanation of the rapid increase in vegetal mass triggered by the temperature increase. Moreover, this is the period when the maize crop, which covers 25% of the arable lands in Romania [99] and is a highly demanding crop in terms of water supply, reaches its maximum vegetal activity. After this period, starting with the second 10-day period of May, the 1-composite lagged correlation increases in significance (more than 30% of the arable lands) with its peak at the beginning of June. This can represent the fact that the precipitation amount reaches its annual maximum during this period. The 2-composite lagged correlation was the most important towards the end of the study period, with its peak between 29 August and 13 of September. In brief, we can observe that the response of crop vegetation to atmospheric precipitation amount is fasterduring the maximum development phase of crops and early summer and slower at the end of crop development.
Overall, at the annual level the 1-composite lagged correlation reached the highest score of frequency of statistical significance on the arable lands, and was close to the direct correlation (Figure 9b). We note that for the annual level the correlation was aggregated for the p-value <0.05.
Therefore, we showed the 1-composite lagged correlation for each composite separately (Figure 10) and for annual conditions (Figure 11). For each composite separately, one can first observe that the significant correlations are mainly negative, reflecting the logical and expected relationship between low/high precipitation amount and drought/excessive humid conditions.
However, some pixels, particularly those located in the south-eastern part of Romania, present a positive significant correlation. This is mainly a result of the vegetation development despite the weak amount of atmospheric precipitation, especially when the plants benefit from a consistent reserve of soil humidity. In addition, the correlation is thoroughly influenced by the crop phenology and the year-to-year crop rotation.
The annual conditions (Figure 11) resume the overall negative correlation between precipitation amount and NDDI values. Interestingly, this negative correlation is stronger over the arable lands in regions with higher precipitation, such as the regions in the northern half of the country. This is induced mainly by the prevalence in these regions of crops with a summer maximum in their development that corresponds with the annual peak in atmospheric precipitation, such as maize.
By comparison, the lack of statistical significance is specific for some spots in the south-eastern part of Romania, but also along the Danube and sparsely in the remainder of the country, and correspond mainly with areas with extensive irrigation.

4. Conclusions

Spatial and temporal characteristics of the NDDI were described in an attempt to analyze and monitor the frequency and severity of drought on the arable land in Romania for a relatively long period (2001–2020). The drought assessment was based on the calculation of the relative frequency of NDDI values indicating drought conditions (NDDI >0.5). The analysis focused on the March–September period to cover the crop development from the greening period of vegetation in early spring, to the stage of maximum vegetation and harvest in late summer and early autumn. In addition, the NDDI values were correlated with atmospheric precipitation, with the aim to determine the role of this important driver on drought frequency and severity.
The main conclusion of our study is that the NDDI represents a valuable tool to assess drought from both temporal and spatial perspectives. However, drought assessment using the NDDI should be interpreted with caution because the NDDI is a result of both meteorological and non-meteorological conditions, which are constantly changing over time. This aspect is underlined, in particular, by the weak significant correlation that we obtained between the NDDI and precipitation amount at the country scale. Moreover, when used on longer time period, as in our study, the NDDI offers a comprehensive view of the degree of aridity for the analyzed region.
Regarding the spatial distribution of drought using NDDI drought classes, it was observed that the most affected regions are the eastern and southern parts of the Romanian Plain, the entire Dobrogea region, and the north-eastern part of the Moldavian Plateau. In addition, most of the plain in the west, and the central and western parts of the Romanian Plain, are affected by moderate drought. Overall, we highlight that these are the arable regions in Romania for which drought should not be considered an extreme event, but a main climate feature, that can be handled by permanent irrigation.
Our results also do not indicate a clear trend regarding the multiannual frequency of drought, as expressed by NDDI values, during the analyzed period between 2001 and 2020. Therefore, based on our results, the discussion regarding a possible desertification manifesting in some parts of Romania is doubtful, at least from the point of view of vegetation conditions.

Supplementary Materials

The following are available online at https://www.mdpi.com/article/10.3390/rs13081478/s1, Figure S1: The maps of the original (top-left), artificially gaps (top-right) and dineof filling gaps (bellow left) of 241 -2012 composite, Figure S2: The density distribution of the original (orange) and gap-filled(gray) pixels, Figure S3: The boxjitterplot of the original (left) and gap-filled (right) pixels, Figure S4: Sen’slope trend for precipitation amount (6 of March–13 of September) between 2001 and 2020 (no significant values at p < 0.10), Figure S5: Figure S5 Sen’slope trend for drought frequency (6 of March–13 of September) derived from NDDI between 2001 and 2020 (sparse significant values, especially in the south-east of Romania).

Author Contributions

Conceptualization, R.-V.D., L.S.; methodology, R.-V.D., L.S., V.-A.A.; software, R.-V.D., S.Ț.; validation, R.-V.D., L.S., V.-A.A.; formal analysis, L.A., L.S.; investigation, R.-V.D., L.S., V.-A.A., L.A.; resources, R.-V.D.; data curation, L.S.; writing—original draft preparation, R.-V.D.; writing—review and editing, L.S., S.Ț.; visualization, S.Ț.; supervision, L.S., L.A.; funding acquisition, R.-V.D.; R.-V.D., L.S., V.-A.A. are the main authors of this research paper. All authors have read and agreed to the published version of the manuscript.

Funding

This work was financially supported by the Department of Geography, Faculty of Geography and Geology, the ‘Alexandru Ioan Cuza’ University of Iasi. Lucian Sfîcă was supported by a grant of the Romanian Ministry of Education and Research CNCS-UEFISCDI, project number PN-III-P1-1.1-TE-2019-0286, within PNCDI III, project leader Assoc. Prof. Ph.D Ionuț Minea.

Institutional Review Board Statement

Not applicable.

Informed Consent Statement

Not applicable.

Data Availability Statement

Not applicable.

Acknowledgments

This paper was co-financed from the European Social Fund, through the Human Capital Operational Program, Project Number POCU/380/6/13/123623 << Doctoral students and postdoctoral researchers prepared for the labor market!>>.

Conflicts of Interest

The authors declare no conflict of interest.

References

  1. IPCC. Climate Change 2013: The Physical Science Basis. Contribution of Working Group I to the Fifth Assessment Report of the Intergovernmental Panel on Climate Change; Cambridge University Press: Cambridge, UK, 2013. [Google Scholar]
  2. Trenberth, K.E.; Dai, A.; Van Der Schrier, G.; Jones, P.D.; Barichivich, J.; Briffa, K.R.; Sheffield, J. Global warming and changes in drought. Nat. Clim. Chang. 2014, 4, 17–22. [Google Scholar] [CrossRef]
  3. Heim, R.R. A Review of Twentieth-Century Drought Indices Used in the United States. Bull. Am. Meteorol. Soc. 2002, 83, 1149–1166. [Google Scholar] [CrossRef] [Green Version]
  4. Hao, Z.; Singh, V.P. Drought characterization from a multivariate perspective: A review. J. Hydrol. 2015, 527, 668–678. [Google Scholar] [CrossRef]
  5. Rakonczai, J. Effects and Consequences of Global Climate Change in the Carpathian Basin. Clim. Chang. Geophys. Found. Ecol. Eff. 2011, 12, 297–322. [Google Scholar] [CrossRef] [Green Version]
  6. Gulácsi, A.; Kovács, F. Drought Monitoring with Spectral Indices Calculated from Modis Satellite Images in Hungary. J. Environ Geogr. 2015, 8, 11–20. [Google Scholar] [CrossRef] [Green Version]
  7. Wilhite, D.A.; Glantz, M.H. Understanding: The Drought Phenomenon: The Role of Definitions. Water Int. 1985, 10, 111–120. [Google Scholar] [CrossRef] [Green Version]
  8. Palmer, W.C. Meteorological Drought; Research Paper No. 45; US Department of Commerce Weather Bureau: Washington, DC, USA, 1965; Volume 30.
  9. McKee, T.B.; Doesken, N.J.; Kleist, J. The relationship of drought frequency and duration to time scales. In Proceedings of the 8th Conference on Applied Climatology, Anaheim, CA, USA, 17–22 January 1993; pp. 179–183. [Google Scholar]
  10. Hayes, M.J.; Svoboda, M.D.; Wardlow, B.D.; Anderson, M.C.; Kogan, F. Drought monitoring: Historicaland current perspectives. In Remote Sensing of Drought: Innovative Monitoring Approaches; CRC Press: Boca Raton, FL, USA, 2012; pp. 1–19. ISBN 978143983560. [Google Scholar]
  11. Páscoa, P.; Gouveia, C.; Russo, A.; Bojariu, R.; Vicente-Serrano, S.; Trigo, R. Drought Impacts on Vegetation in Southeastern Europe. Remote Sens. 2020, 12, 2156. [Google Scholar] [CrossRef]
  12. Kogan, F. Application of vegetation index and brightness temperature for drought detection. Adv. Space Res. 1995, 15, 91–100. [Google Scholar] [CrossRef]
  13. Wang, P.X.; Li, X.W.; Gong, J.Y.; Song, C. Vegetation temperature condition index and its application for drought monitoring. Int. Geosci. Remote Sens. 2001, 1, 141–143. [Google Scholar] [CrossRef]
  14. Sandholt, I.; Rasmussen, K.; Andersen, J. A simple interpretation of the surface temperature/vegetation index space for assessment of surface moisture status. Remote Sens. Environ. 2002, 79, 213–224. [Google Scholar] [CrossRef]
  15. Rahimzadeh-Bajgiran, P.; Omasa, K.; Shimizu, Y. Comparative evaluation of the Vegetation Dryness Index (VDI), the Temperature Vegetation Dryness Index (TVDI) and the improved TVDI (iTVDI) for water stress detection in semi-arid regions of Iran. ISPRS J. Photogramm. 2012, 68, 1–12. [Google Scholar] [CrossRef]
  16. Lloyd-Hughes, B. The impracticality of a universal drought definition. Appl. Clim. 2014, 117, 607–611. [Google Scholar] [CrossRef] [Green Version]
  17. Tucker, C.J.; Pinzon, J.E.; Brown, M.E.; Slayback, D.A.; Pak, E.W.; Mahoney, R.; Vermote, E.F.; El Saleous, N. An extended AVHRR 8-km NDVI dataset compatible with MODIS and SPOT vegetation NDVI data. Int. J. Remote Sens. 2005, 26, 4485–4498. [Google Scholar] [CrossRef]
  18. Fensholt, R.; Rasmussen, K.; Nielsen, T.T.; Mbow, C. Evaluation of earth observation based long term vegetation trends—Intercomparing NDVI time series trend analysis consistency of Sahel from AVHRR GIMMS, Terra MODIS and SPOT VGT data. Remote Sens. Environ. 2009, 113, 1886–1898. [Google Scholar] [CrossRef]
  19. Beck, P.S.; Atzberger, C.; Høgda, K.A.; Johansen, B.; Skidmore, A.K. Improved monitoring of vegetation dynamics at very high latitudes: A new method using MODIS NDVI. Remote Sens. Environ. 2006, 100, 321–334. [Google Scholar] [CrossRef]
  20. Gu, Y.; Brown, J.F.; Verdin, J.P.; Wardlow, B. A five-year analysis of MODIS NDVI and NDWI for grassland drought assessment over the central Great Plains of the United States. Geophys. Res. Lett. 2007, 34. [Google Scholar] [CrossRef] [Green Version]
  21. Fernandes, R.; Butson, C.; Leblanc, S.; Latifovic, R. Landsat-5 TM and Landsat-7 ETM+ based accuracy assessment of leaf area index products for Canada derived from SPOT-4 VEGETATION data. Can. J. Remote Sens. 2003, 29, 241–258. [Google Scholar] [CrossRef]
  22. Gouveia, C.M.; Bastos, A.; Trigo, R.M.; Dacamara, C.C. Drought impacts on vegetation in the pre- and post-fire events over Iberian Peninsula. Nat. Hazards Earth Syst. Sci. 2012, 12, 3123–3137. [Google Scholar] [CrossRef]
  23. Idso, S.; Jackson, R.; Pinter, P.; Reginato, R.; Hatfield, J. Normalizing the stress-degree-day parameter for environmental variability. Agric. Meteorol. 1981, 24, 45–55. [Google Scholar] [CrossRef]
  24. Ceccato, P.; Gobron, N.; Flasse, S.; Pinty, B.; Tarantola, S. Designing a spectral index to estimate vegetation water content from remote sensing data: Part 1. Remote Sens. Environ. 2002, 82, 188–197. [Google Scholar] [CrossRef]
  25. Wagner, W.; Scipal, K.; Pathe, C.; Gerten, D.; Lucht, W.; Rudolf, B. Evaluation of the agreement between the first global remotely sensed soil moisture data with model and precipitation data. J. Geophys. Res. Space Phys. 2003, 108. [Google Scholar] [CrossRef]
  26. Liu, L.; Xiang, D.; Dong, X.; Zhou, Z. Improvement of the Drought Monitoring Model Based on the Cloud Parameters Methodand Remote Sensing Data. In Proceedings of the First International Workshop on Knowledge Discovery and Data Mining (WKDD 2008), Adelaide, Australia, 23–24 January 2008; pp. 293–296. [Google Scholar]
  27. Belal, A.A.; El-Ramady, H.R.; Mohamed, E.S.; Saleh, A.M. Drought risk assessment using remote sensing and GIS techniques. Arab. J. Geosci. 2014, 7, 35–53. [Google Scholar] [CrossRef]
  28. Vicente-Serrano, S.M. Evaluating the Impact of Drought Using Remote Sensing in a Mediterranean, Semi-arid Region. Nat Hazards 2007, 40, 173–208. [Google Scholar] [CrossRef]
  29. Vicente-Serrano, S.M.; Cuadrat-Prats, J.M.; Romo, A. Early prediction of crop production using drought indices at different time-scales and remote sensing data: Application in the Ebro Valley (north-east Spain). Int. J. Remote Sens. 2006, 27, 511–518. [Google Scholar] [CrossRef]
  30. Gouveia, C.; Trigo, R.; Beguería, S.; Vicente-Serrano, S. Drought impacts on vegetation activity in the Mediterranean region: An assessment using remote sensing data and multi-scale drought indicators. Glob. Planet. Chang. 2017, 151, 15–27. [Google Scholar] [CrossRef] [Green Version]
  31. Sepulcre-Canto, G.; Horion, S.; Singleton, A.; Carrao, H.; Vogt, J. Development of a Combined Drought Indicator to detect agricultural drought in Europe. Nat. Hazards Earth Syst. Sci. 2012, 12, 3519–3531. [Google Scholar] [CrossRef] [Green Version]
  32. Dalezios, N.R.; Blanta, A.; Spyropoulos, N.V. Assessment of remotely sensed drought features in vulnerable agriculture. Nat. Hazards Earth Syst. Sci. 2012, 12, 3139–3150. [Google Scholar] [CrossRef] [Green Version]
  33. Gobron, N.; Pinty, B.; Mélin, F.; Taberner, M.; Verstraete, M.M.; Belward, A.; Lavergne, T.; Widlowski, J. The state of vegetation in Europe following the 2003 drought. Int. J. Remote Sens. 2005, 26, 2013–2020. [Google Scholar] [CrossRef]
  34. Buras, A.; Rammig, A.; Zang, C.S. Quantifying impacts of the 2018 drought on European ecosystems in comparison to 2003. Biogeosciences 2020, 17, 1655–1672. [Google Scholar] [CrossRef] [Green Version]
  35. Spinoni, J.; Naumann, G.; Vogt, J.; Barbosa, P. European drought climatologies and trends based on a multi-indicator approach. Glob. Planet. Chang. 2015, 127, 50–57. [Google Scholar] [CrossRef]
  36. Enea, A.; Urzica, A.; Breabăn, I.G. Remote sensing, GIS and HEC-RAS techniques, applied for flood extentvalidation, based on Landsat imagery, LiDAR and hydrological data. Case study: Baseu River, Romania. J. Environ. Prot. Ecol 2018, 19, 1091–1101. [Google Scholar]
  37. Rusu, A.; Ursu, A.; Stoleriu, C.C.; Groza, O.; Niacșu, L.; Sfîcă, L.; Minea, I.; Stoleriu, O.M. Structural Changes in the Romanian Economy Reflected through Corine Land Cover Datasets. Remote Sens. 2020, 12, 1323. [Google Scholar] [CrossRef] [Green Version]
  38. Kuemmerle, T.; Müller, D.; Griffiths, P.; Rusu, M. Land use change in Southern Romania after the collapse of socialism. Reg. Environ. Chang. 2009, 9, 1–12. [Google Scholar] [CrossRef]
  39. Mărgărint, M.C.; Niculiţă, M. Landslide type and pattern in Moldavian Plateau, NE Romania. In Landform Dynamics and Evolution in Romania; Springer: Cham, The Netherlands, 2017; pp. 271–304. [Google Scholar] [CrossRef]
  40. Mărmureanu, L.; Marin, C.A.; Andrei, S.; Antonescu, B.; Ene, D.; Boldeanu, M.; Vasilescu, J.; Viţelaru, C.; Cadar, O.; Levei, E. Orange Snow—A Saharan Dust Intrusion over Romania During Winter Conditions. Remote Sens. 2019, 11, 2466. [Google Scholar] [CrossRef] [Green Version]
  41. Țîmpu, S.; Sfîcă, L.; Dobri, R.-V.; Cazacu, M.-M.; Nita, A.-I.; Birsan, M.-V. Tropospheric Dust and Associated Atmospheric Circulations over the Mediterranean Region with Focus on Romania’s Territory. Atmosphere 2020, 11, 349. [Google Scholar] [CrossRef] [Green Version]
  42. Prăvălie, R.; Sîrodoev, I.; Peptenatu, D. Changes in the forest ecosystems in areas impacted by aridization in south-western Romania. J. Env. Health Sci. Eng. 2014, 12, 2. [Google Scholar] [CrossRef] [Green Version]
  43. Cheval, S.; Dumitrescu, A. The summer surface urban heat island of Bucharest (Romania) retrieved from MODIS images. Appl. Clim. 2015, 121, 631–640. [Google Scholar] [CrossRef]
  44. Herbel, I.; Croitoru, A.-E.; Rus, A.V.; Roşca, C.F.; Harpa, G.V.; Ciupertea, A.-F.; Rus, I. The impact of heat waves on surface urban heat island and local economy in Cluj-Napoca city, Romania. Appl. Clim. 2018, 133, 681–695. [Google Scholar] [CrossRef]
  45. Crețu, Ș.-C.; Ichim, P.; Sfîcă, L. Summer urban heat island of Galați city (Romania) detected using satellite products. Present Environ. Sustain. Dev. 2020, 14, 5–27. [Google Scholar] [CrossRef]
  46. Vorovencii, I. Assessing and monitoring the risk of desertification in Dobrogea, Romania, using Landsat data and decision tree classifier. Environ. Monit. Assess. 2015, 187, 204. [Google Scholar] [CrossRef]
  47. Angearu, C.-V.; Ontel, I.; Boldeanu, G.; Mihailescu, D.; Nertan, A.; Craciunescu, V.; Catana, S.; Irimescu, A. Multi-Temporal Analysis and Trends of the Drought based on MODIS Data in Agricultural Areas, Romania. Remote Sens. 2020, 12, 3940. [Google Scholar] [CrossRef]
  48. Geografia României, I. Geografia Fizică (Geography of Romania, I. Physical Geography); Romanian Academy Publishing: Bucharest, Romania, 1983; pp. 171–194. (In Romanian) [Google Scholar]
  49. Sandu, I.; Pescaru, V.I.; Poiană, I.; Geicu, A.; Cândea, I.; Ţâştea, D. Clima României (Climate of Romania); Romanian Academy Publishing: Bucharest, Romania, 2008. (In Romanian) [Google Scholar]
  50. Prăvălie, R.; Piticar, A.; Roșca, B.; Sfîcă, L.; Bandoc, G.; Tiscovschi, A.; Patriche, C. Spatio-temporal changes of the climatic water balance in Romania as a response to precipitation and reference evapotranspiration trends during 1961–2013. Catena 2019, 172, 295–312. [Google Scholar] [CrossRef]
  51. Prăvalie, R.; Sîrodoev, I.; Peptenatu, D. Detecting climate change effects on forest ecosystems in Southwestern Romania using Landsat TM NDVI data. J. Geogr. Sci. 2014, 24, 815–832. [Google Scholar] [CrossRef] [Green Version]
  52. Dobri, R.-V.; Sfîcă, L.; Ichim, P.; Harpa, G.-V. The Distribution of the Monthly 24-Hour Maximum Amount of Precipitation in Romania According to their Synoptic Causes. Geogr. Tech. 2017, 12, 62–72. [Google Scholar] [CrossRef] [Green Version]
  53. Nita, I.A.; Sfîcă, L.; Apostol, L.; Radu, C.; Birsan, M.V.; Szep, R.; Keresztesi, A. Changes in cyclone intensity over Romania according to 12 tracking methods. Rom. Rep. Phys. 2020, 72, 706. [Google Scholar]
  54. Croitoru, A.-E.; Piticar, A.; Dragotă, C.S.; Burada, D.C. Recent changes in reference evapotranspiration in Romania. Glob. Planet. Chang. 2013, 111, 127–136. [Google Scholar] [CrossRef]
  55. Vicente-Serrano, S.M.; Azorin-Molina, C.; Sanchez-Lorenzo, A.; Revuelto, J.; López-Moreno, J.I.; González-Hidalgo, J.C.; Moran-Tejeda, E.; Espejo, F. Reference evapotranspiration variability and trends in Spain, 1961–2011. Glob. Planet. Chang. 2014, 121, 26–40. [Google Scholar] [CrossRef] [Green Version]
  56. Colantoni, A.; Ferrara, C.; Perini, L.; Salvati, L. Assessing trends in climate aridity and vulnerability to soil degradation in Italy. Ecol. Indic. 2015, 48, 599–604. [Google Scholar] [CrossRef]
  57. Nastos, P.T.; Politi, N.; Kapsomenakis, J. Spatial and temporal variability of the Aridity Index in Greece. Atmos. Res. 2013, 119, 140–152. [Google Scholar] [CrossRef]
  58. Rusu, M.; Simion, G. Farm structure adjustments under the irrigation systems rehabilitation in the Southern plain of Romania: A first step towards sustainabile developments. Carpathian J. Earth Environ. Sci. 2015, 10, 91–100. [Google Scholar]
  59. Didan, K. MOD13Q1 MODIS/Terra Vegetation Indices 16-Day L3 Global 250 m SIN grid V006. NASA EOSDIS Land Processes DAAC. 2015. Available online: https://doi.org/10.5067/MODIS/MOD13Q1.006 (accessed on 22 September 2020).
  60. Du, T.L.T.; Du Bui, D.; Nguyen, M.D.; Lee, H. Satellite-Based, Multi-Indices for Evaluation of Agricultural Droughts in a Highly Dynamic Tropical Catchment, Central Vietnam. Water 2018, 10, 659. [Google Scholar] [CrossRef] [Green Version]
  61. Testa, S.; Mondino, E.C.B.; Pedroli, C. Correcting MODIS 16-day composite NDVI time-series with actual acquisition dates. Eur. J. Remote Sens. 2014, 47, 285–305. [Google Scholar] [CrossRef]
  62. Team, A. Application for Extracting and Exploring Analysis Ready Samples (AppEEARS). NASA EOSDIS Land Processes Distributed Active Archive Center (LP DAAC), USGS/Earth Resources Observation and Science (EROS) Center: Sioux Falls, SD, USA. 2019. Available online: https://lpdaacsvc.cr.usgs.gov/appeears/ (accessed on 22 September 2020).
  63. Corine Land Cover, Copernicus Programme. Available online: https://land.copernicus.eu/pan-european/corine-land-cover/clc2018 (accessed on 7 January 2020).
  64. Haylock, M.R.; Hofstra, N.; Tank, A.M.G.K.; Klok, E.J.; Jones, P.D.; New, M. A European daily high-resolution gridded data set of surface temperature and precipitation for 1950–2006. J. Geophys. Res. Space Phys. 2008, 113. [Google Scholar] [CrossRef] [Green Version]
  65. Klok, E.J.; Tank, A.M.G.K. Updated and extended European dataset of daily climate observations. Int. J. Clim. 2009, 29, 1182–1191. [Google Scholar] [CrossRef]
  66. Copernicus Climate Change Service (C3S). Climate Data Store (CDS). 2020. Available online: https://cds.climate.copernicus.eu/#!/home (accessed on 7 October 2020).
  67. Beckers, J.-M.; Rixen, M. EOF calculations and data filling from incomplete oceanographic data sets. J. Atmos. Oceanic Technol. 2003, 20, 1839–1856. [Google Scholar] [CrossRef]
  68. Alvera-Azcárate, A.; Barth, A.; Rixen, M.; Beckers, J. Reconstruction of incomplete oceanographic data sets using empirical orthogonal functions: Application to the Adriatic Sea surface temperature. Ocean Model. 2005, 9, 325–346. [Google Scholar] [CrossRef] [Green Version]
  69. Alvera-Azcárate, A.; Barth, A.; Beckers, J.-M.; Weisberg, R.H. Multivariate reconstruction of missing data in sea surface temperature, chlorophyll, and wind satellite fields. J. Geophys. Res. Space Phys. 2007, 112. [Google Scholar] [CrossRef] [Green Version]
  70. Sirjacobs, D.; Alvera-Azcárate, A.; Barth, A.; Lacroix, G.; Park, Y.; Nechad, B.; Ruddick, K.; Beckers, J.M. Cloud filling of ocean and sea surface temperature remote sensing products over the Southern North Sea by the Data Interpolating Empirical Orthogonal Functions methodology. J. Sea Res. 2011, 65, 114–130. [Google Scholar] [CrossRef]
  71. Alvera-Azcárate, A.; Barth, A.; Parard, G.; Beckers, J.-M. Analysis of SMOS sea surface salinity data using DINEOF. Remote Sens. Environ. 2016, 180, 137–145. [Google Scholar] [CrossRef] [Green Version]
  72. Beckers, J.-M.; Barth, A.; Alvera-Azcárate, A. DINEOF reconstruction of clouded images including error maps–application to the Sea-Surface Temperature around Corsican Island. Ocean Sci. 2006, 2, 183–199. [Google Scholar] [CrossRef] [Green Version]
  73. Hilborn, A.; Costa, M. Applications of DINEOF to Satellite-Derived Chlorophyll-a from a Productive Coastal Region. Remote Sens. 2018, 10, 1449. [Google Scholar] [CrossRef] [Green Version]
  74. Cheval, S.; Dumitrescu, A.; Amihaesei, V.-A. Exploratory Analysis of Urban Climate Using a Gap-Filled Landsat 8 Land Surface Temperature Data Set. Sensors 2020, 20, 5336. [Google Scholar] [CrossRef] [PubMed]
  75. Filipponi, F.; Valentini, E.; Xuan, A.N.; Guerra, C.A.; Wolf, F.; Andrzejak, M.; Taramelli, A. Global MODIS Fraction of Green Vegetation Cover for Monitoring Abrupt and Gradual Vegetation Changes. Remote Sens. 2018, 10, 653. [Google Scholar] [CrossRef] [Green Version]
  76. Tucker, C.J. Red and photographic infrared linear combinations for monitoring vegetation. Remote Sens. Environ. 1979, 8, 127–150. [Google Scholar] [CrossRef] [Green Version]
  77. Gao, B.C. NDWI—A normalized difference water index for remote sensing of vegetation liquid water from space. Remote Sens. Environ. 1996, 58, 257–266. [Google Scholar] [CrossRef]
  78. Chen, J.; Jönsson, P.; Tamura, M.; Gu, Z.; Matsushita, B.; Eklundh, L. A simple method for reconstructing a high-quality NDVI time-series data set based on the Savitzky–Golay filter. Remote Sens. Environ. 2004, 91, 332–344. [Google Scholar] [CrossRef]
  79. Chen, J.; Quan, W.; Zhang, M.; Cui, T. A Simple Atmospheric Correction Algorithm for MODIS in Shallow Turbid Waters: A Case Study in Taihu Lake. IEEE J. Sel. Top. Appl. Earth Obs. Remote Sens. 2012, 6, 1825–1833. [Google Scholar] [CrossRef]
  80. Wang, Q.; Adiku, S.; Tenhunen, J.; Granier, A. On the relationship of NDVI with leaf area index in a deciduous forest site. Remote Sens. Environ. 2005, 94, 244–255. [Google Scholar] [CrossRef]
  81. Gamon, J.A.; Field, C.B.; Goulden, M.L.; Griffin, K.L.; Hartley, A.E.; Joel, G.; Penuelas, J.; Valentini, R. Relationships Between NDVI, Canopy Structure, and Photosynthesis in Three Californian Vegetation Types. Ecol. Appl. 1995, 5, 28–41. [Google Scholar] [CrossRef] [Green Version]
  82. Myneni, R.; Williams, D. On the relationship between FAPAR and NDVI. Remote Sens. Environ. 1994, 49, 200–211. [Google Scholar] [CrossRef]
  83. Angearu, C.-V.; Irimescu, A.; Mihailescu, D.; Virsta, A. Evaluation of Droughts and Fires in the Dobrogea Region, Using Modis Satellite Data. Agric. Life. Life Agric. Conf. Proc. 2018, 1, 336–345. [Google Scholar] [CrossRef] [Green Version]
  84. Angearu, C.V. Analiza secetei asupra terenurilor arabile din România pe baza imaginilor satelitare. Rev. Stiintifica A Adm. Natl. Meteorol. 2018, 1, 61–76. (In Romanian) [Google Scholar]
  85. Zhang, A.; Jia, G. Monitoring meteorological drought in semiarid regions using multi-sensor microwave remote sensing data. Remote Sens. Environ. 2013, 134, 12–23. [Google Scholar] [CrossRef]
  86. Park, S.; Im, J.; Park, S. Probabilistic Drought Intensification Forecasts Using Temporal Patterns of Satellite-Derived Drought Indicators. EGU General Assembly Conference Abstracts. 2016; EPSC2016-11264. Available online: https://meetingorganizer.copernicus.org/EGU2016/EGU2016-11264-1.pdf (accessed on 10 October 2020).
  87. Trinh, L.H.; Vu, D.T. Application of remote sensing technique for drought assessment based on normalized difference drought index, a case study of Bac Binh district, Binh Thuan province (Vietnam). Russ. J. Earth Sci. 2019, 19, 1–9. [Google Scholar] [CrossRef]
  88. Gulácsi, A.; Kovács, F. Drought monitoring of forest vegetation using MODIS-based normalized difference drought index in Hungary. Hung. Geogr. Bull. 2018, 67, 29–42. [Google Scholar] [CrossRef] [Green Version]
  89. Erdenetuya, M.; Bulgan, D.; Erdenetsetseg, B. Drought monitoring and assessment using multi satellite data in Mongolia. In Proceedings of the 32nd Asian Conference on Remote Sensing, Tapei, Taiwan, 3–7 October 2011. [Google Scholar]
  90. Cheng-lin, L.; Jian-jun, W. Crop drought monitoring using MODIS NDDI over mid-territory of China. In Proceedings of the IEEE International Geoscience and Remote Sensing Symposium, IGARSS 2008, Boston, MA, USA, 7–11 July 2008. [Google Scholar]
  91. Rhee, J.; Im, J.; Carbone, G.J. Monitoring agricultural drought for arid and humid regions using multi-sensor remote sensing data. Remote Sens. Environ. 2010, 114, 2875–2887. [Google Scholar] [CrossRef]
  92. Stancalie, G.; Nertan, A.T.; Serban, F. Agricultural Drought Monitoring Using Satellite—Based Products in Romania. In Proceedings of the Third International Conference on Telecommunications and Remote Sensing, Luxembourg, 26–27 June 2014; ICTRS, SciTePress: Luxembourg, 2014; Volume 1, pp. 100–106, ISBN 978-989-758-033-8. [Google Scholar]
  93. Cheval, S.; Busuioc, A.; Dumitrescu, A.; Birsan, M. Spatiotemporal variability of meteorological drought in Romania using the standardized precipitation index (SPI). Clim. Res. 2014, 60, 235–248. [Google Scholar] [CrossRef]
  94. Ionita, M.; Scholz, P.; Chelcea, S. Assessment of droughts in Romania using the Standardized Precipitation Index. Nat. Hazards 2016, 81, 1483–1498. [Google Scholar] [CrossRef] [Green Version]
  95. Paltineanu, C.; Mihailescu, I.F.; Prefac, Z.; Dragota, C.; Vasenciuc, F.; Claudia, N. Combining the standardized precipitation index and climatic water deficit in characterizing droughts: A case study in Romania. Theor. Appl. Clim. 2008, 97, 219–233. [Google Scholar] [CrossRef]
  96. Prăvălie, R.; Patriche, C.; Săvulescu, I.; Sîrodoev, I.; Bandoc, G.; Sfîcă, L. Spatial assessment of land sensitivity to degradation across Romania. A quantitative approach based on the modified MEDALUS methodology. Catena 2020, 187, 104407. [Google Scholar] [CrossRef]
  97. Minea, I.; Iosub, M.; Boicu, D. Groundwater Resources from Eastern Romania under Human and Climatic Pressure. Sustainability 2020, 12, 10341. [Google Scholar] [CrossRef]
  98. Potopová, V.; Boroneant, C.; Boincean, B.; Soukup, J. Impact of agricultural drought on main crop yields in the Republic of Moldova. Int. J. Climatol. 2016, 36, 2063–2082. [Google Scholar] [CrossRef] [Green Version]
  99. National Institute of Statistics in Romania (NISR). Available online: https://insse.ro/cms/en (accessed on 10 December 2020).
Figure 1. Geographical position of Romania and the extension of arable lands (source: Corine Land Cover (CLC) 2018).
Remotesensing 13 01478 g001
Figure 2. Relative frequency (%) of NDDI main drought classes between 2001 and 2020.
Remotesensing 13 01478 g002
Figure 3. Spatial relative frequency of drought classes (NDDI >0.5) at the level of arable lands in Romania for the 16-day composite periods between March and September (2001–2020).
Remotesensing 13 01478 g003
Figure 4. Spatial relative frequency of the drought classes (NDDI >0.5) at the annual level for the arable lands in Romania according to the NDDI between 2001 and 2020.
Remotesensing 13 01478 g004
Figure 5. The year recording the highest value of the NDDI for each pixel in Romania for 2001–2020.
Remotesensing 13 01478 g005
Figure 6. Spatial relative frequency of drought classes at the level of arable lands in Romania between 2001 and 2020.
Remotesensing 13 01478 g006
Figure 7. Spatial relative frequency of drought classes over arable lands in Romania for the seven driest years from 2001 to 2020.
Remotesensing 13 01478 g007
Figure 8. Spatial relative frequency of drought classes over arable lands in Romania for the seven wettest years from 2001 to 2020.
Remotesensing 13 01478 g008
Figure 9. Spearman’s correlation between precipitation amount and the NDDI with 1-composite lag and 2-composite lag for the 12 annual composites (a) and for annual level (b).
Remotesensing 13 01478 g009
Figure 10. Spearman correlation between precipitation amount and the 1-composite lag of the NDDI.
Remotesensing 13 01478 g010
Figure 11. Spatial extent of Spearman’s correlation values between precipitation amount and the 1-composite lag of the NDDI for March and September (2001–2020).
Remotesensing 13 01478 g011
Table 1. Territorial extension of arable lands according to CLC 2018 in the main regions of Romania (thousands of hectares).
Territorial Extension of Arable Lands in Romania (Source: CLC 2018)
CarpathiansTransylvanian PlateauSubcarpathiansPannonian PlainCrisana and Banat HillsMoldavian PlateauRomanian PlainGetic PlateauDobrogea Plateau and Danube Delta
270750313260036313903.0706801680
Table 2. Composite periods of MOD13 used in the study [61].
CompositeDay of Year (No.)Starting Day during Non-Leap YearsStarting Day during Leap Years *Season
1656-Mar05-MarSpring
28122-Mar21-Mar
3977-Apr06-Apr
411323-Apr22-Apr
51299-May08-May
614525-May24-May
716110-Jun09-Jun
817726-Jun25-JunSummer
919312-Jul11-Jul
1020928-Jul27-Jul
1122513-Aug12-Aug
1224129-Aug28-Aug
* Due to numerous corrections made to the acquired data, both in leap years and in non-leap years, 16-day Moderate Resolution Imaging Spectroradiometer (MODIS) composites have the same data range [61].
Table 3. Layers of MOD13Q1 product [59]; the bands used to calculate the Normalized Difference Drought Index (NDDI) (1, 2 and 7) are given in bold.
Layer NameDescriptionUnitsData TypeFill ValueNo Data ValueValid RangeScale Factor
250 m 16 days NDVI16 day NDVINDVI16-bit signed integer−3000N/A−2000 to 10,0000.0001
250 m 16 days EVI16 day EVIEVI16-bit signed integer−3000N/A−2000 to 10,0000.0001
250 m 16 days VI QualityVI quality indicatorsBit Field16-bit unsigned integer65535N/A0 to 65534N/A
250 m 16 days red reflectanceSurface Reflectance Band 1N/A16-bit signed integer−1000N/A0 to 10,0000.0001
250 m 16 days Near Infrared reflectanceSurface Reflectance Band 2N/A16-bit signed integer−1000N/A0 to 10,0000.0001
250 m 16 days blue reflectanceSurface Reflectance Band 3N/A16-bit signed integer−1000N/A0 to 10,0000.0001
250 m 16 days Middle Infrared reflectanceSurface Reflectance Band 7N/A16-bit signed integer−1000N/A0 to 10,0000.0001
250 m 16 days view zenith angleView zenith angle of VI PixelDegree16-bit signed integer−10000N/A0 to 18,0000.01
250 m 16 days sun zenith angleSun zenith angle of VI pixelDegree16-bit signed integer−10000N/A0 to 18,0000.01
250 m 16 days relative azimuth angleRelative azimuth angle of VI pixelDegree16-bit signed integer−4000N/A−18,000 to 18,0000.01
250 m 16 days composite day of the yearDay of year VI pixelJulian day16-bit signed integer−1N/A1 to 366N/A
250 m 16 days pixel reliabilityQuality reliability of VI pixelRank8-bit signed integer−1N/A0 to 3N/A
Table 4. The statistical parameters of the original and gap-filled data pixels (//–not applicable).
Summary StatisticalOriginal DataGap-Filled DataOriginal vs. Gap-Filled Data
Minimum0.02−0.08//
1st Quartile0.340.31//
Median0.460.44//
Average0.480.46//
3rd Quartile0.590.57//
Maximum1.751.72//
Root-Mean-Square Error////0.03
Mean-Absolute-Error////0.09
R-squared////0.91
Table 5. Relative frequency (%) of NDDI drought classes between 2001 and 2020 (ToD—Type of drought, Nd—No drought, Md—Moderate drought, Sd—Severe drought, Ed—Extreme drought and Ad—All types of drought) and the precipitation amount (mm) accumulated between 5 of March and 13 of September.
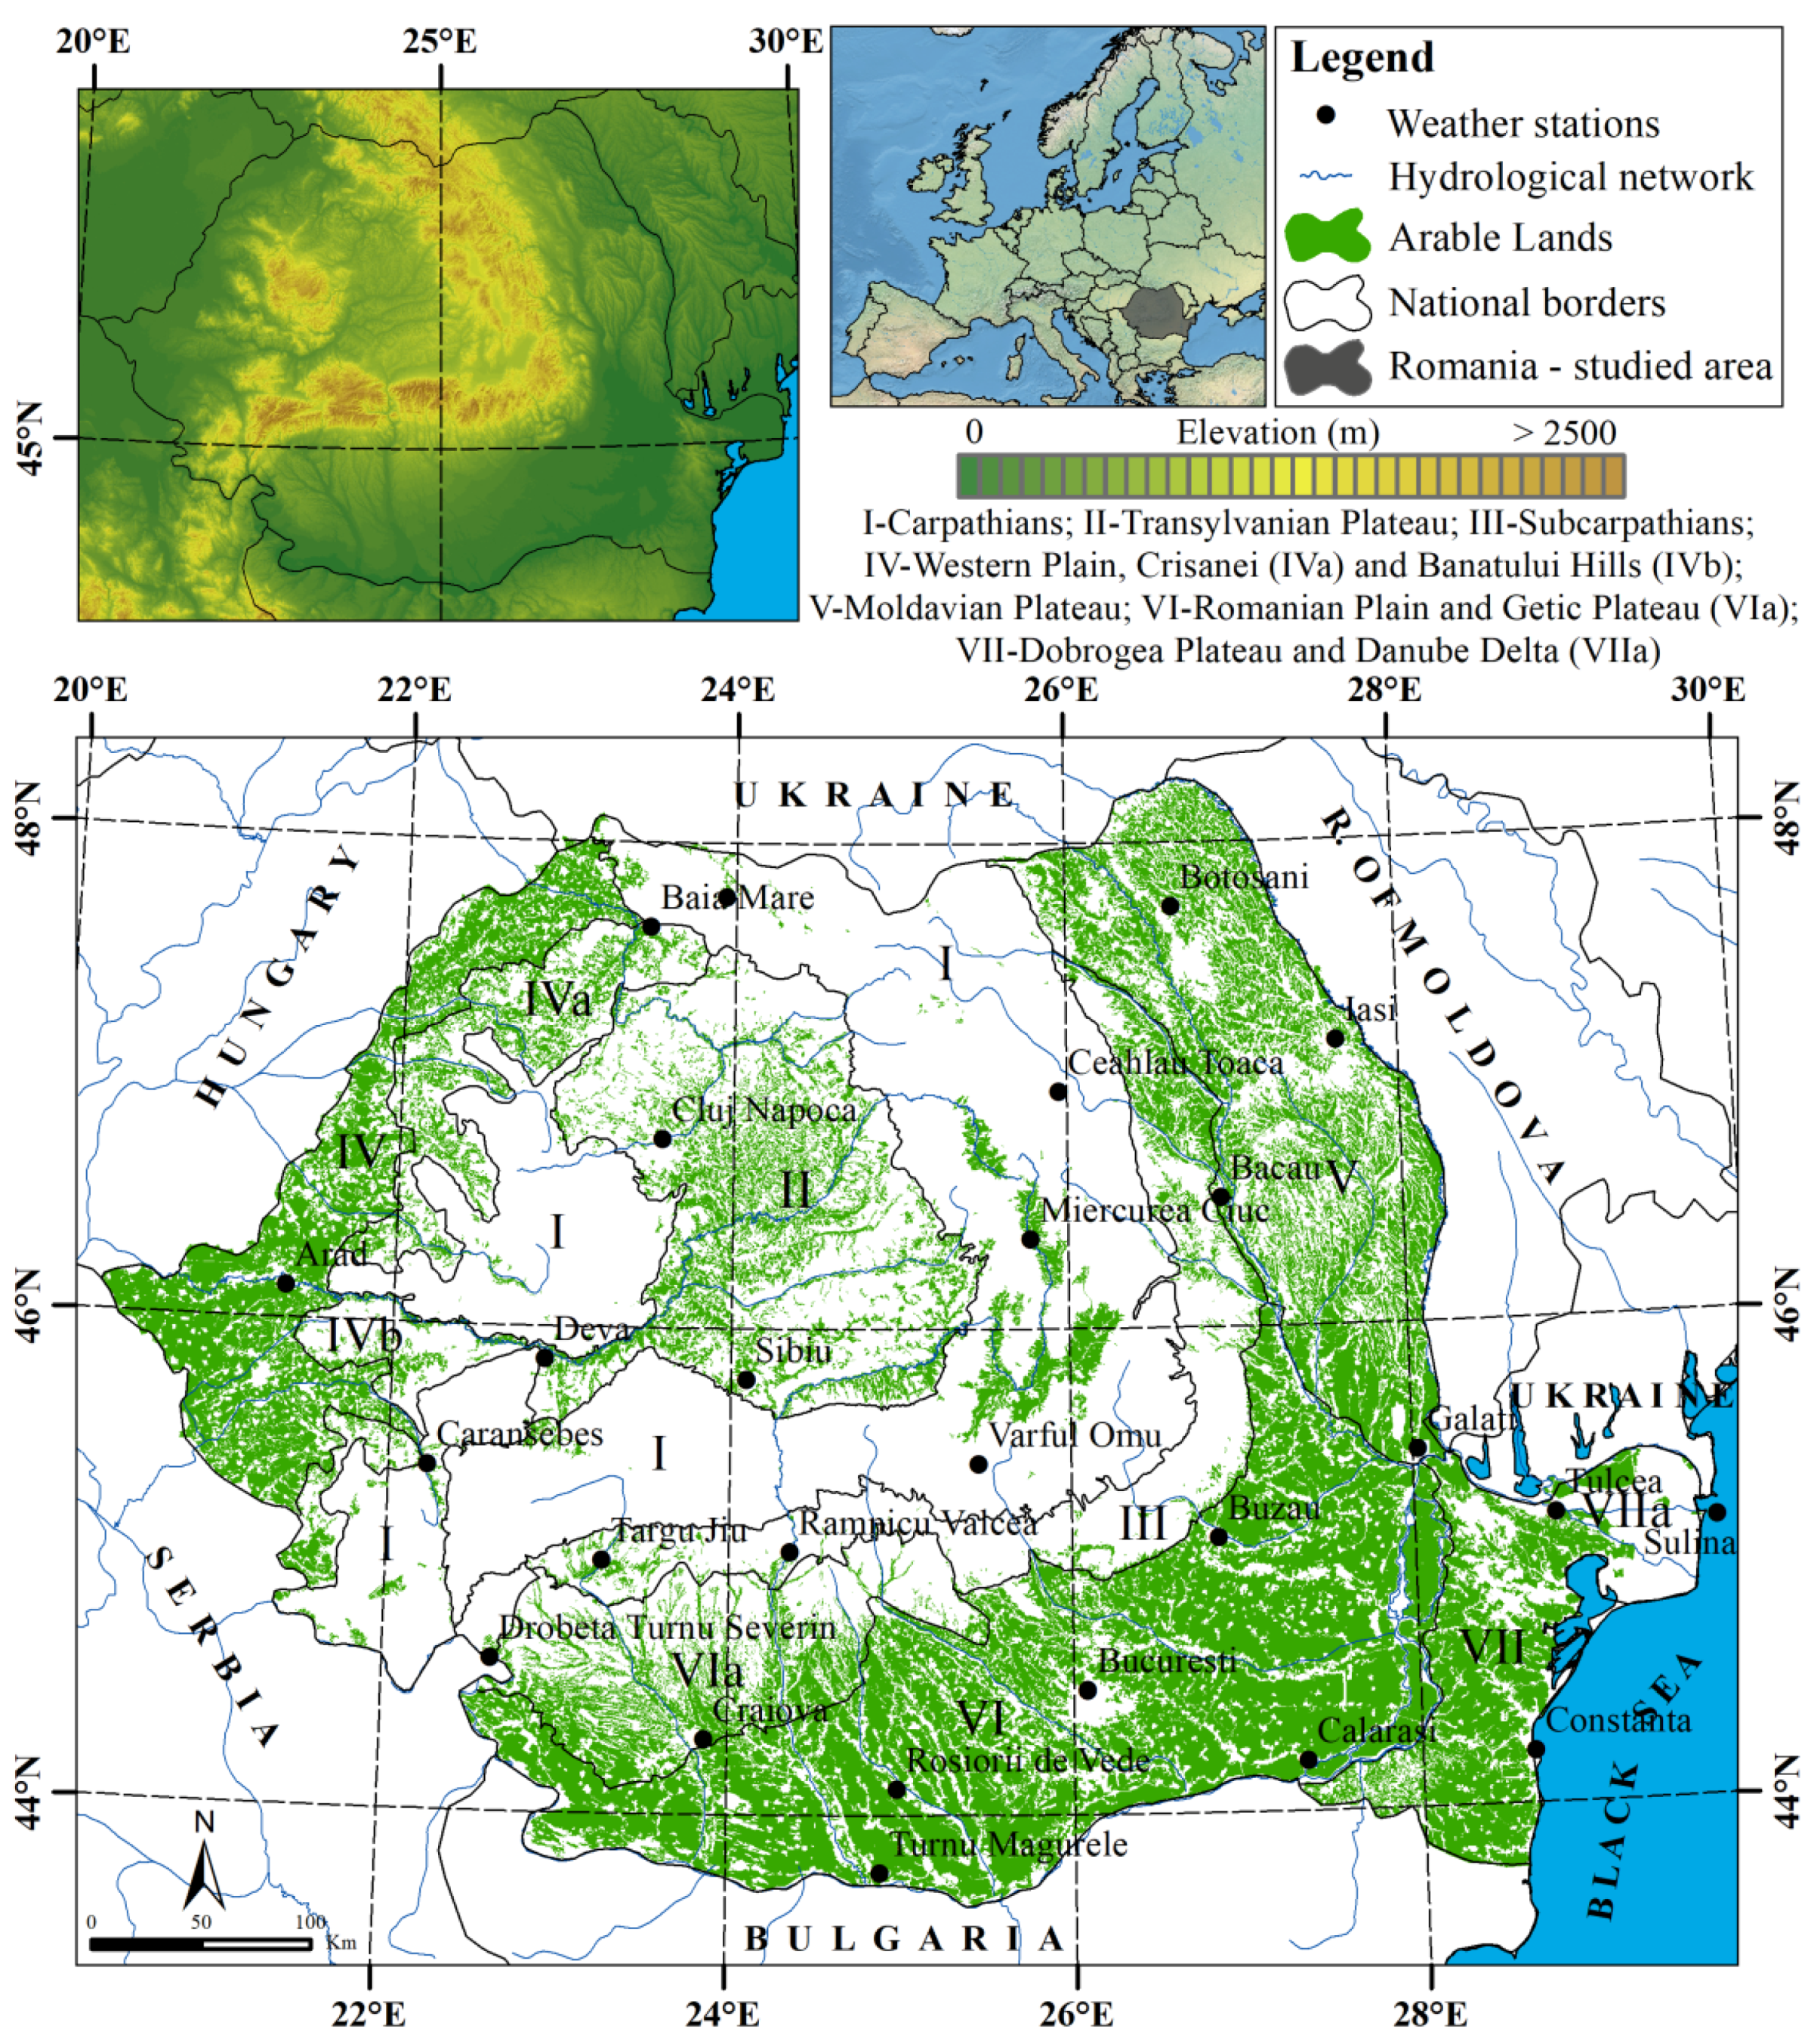
Normal Difference Drought Index (NDDI)
ToDNdMdSdEdAdPrecipitation Amount (mm)
Range<0.50.5–0.60.6–1>1>0.5
200180.26.410.52.919.8370.9
200277.07.212.33.523.0310.0
200374.47.413.64.725.6207.2
200481.35.59.83.518.7319.8
200581.55.410.13.018.5458.7
200683.04.99.82.317.0375.3
200778.87.910.92.321.2295.1
200887.04.56.91.513.0289.9
200985.55.67.71.214.5276.1
201088.84.06.11.111.2381.0
201184.65.18.41.915.4270.3
201275.97.213.43.524.1267.3
201385.44.98.21.514.6339.3
201489.03.86.01.311.0405.5
201582.45.89.62.217.6262.3
201689.23.75.91.210.8329.4
201784.25.28.52.115.8316.6
201888.94.25.91.011.1340.9
201980.55.510.63.419.5286.3
202078.17.211.82.921.9360.1
2001–202082.85.69.32.417.2323.1
Publisher’s Note: MDPI stays neutral with regard to jurisdictional claims in published maps and institutional affiliations.

