
Test Loading of Structures with a Suspect Resistance


1
Faculty of Built Environment, Tampere University, P.O. Box 600, FI-33014 Tampere, Finland
2
Faculty of Information Technology and Communication Sciences, Tampere University, P.O. Box 600, FI-33014 Tampere, Finland
*
Author to whom correspondence should be addressed.
Appl. Sci. 2021, 11(8), 3424; https://doi.org/10.3390/app11083424
Submission received: 9 March 2021
/
Revised: 30 March 2021
/
Accepted: 9 April 2021
/
Published: 11 April 2021
(This article belongs to the Section Civil Engineering)
Abstract
:The reliability of load-bearing structures is normally secured through codes, a competent structural design and proper execution inspection. Alternatively, the reliability can be obtained via skilled test loading, which is a feasible technique both in the construction of new structures and in the load-bearing verification of existing ones. Although the current codes lack instructions for test loading, they are, however, used in special cases; for example, when the reliability of the structures is doubtful due to a defect, or when the structure is suspected to have especially high resistance variability. Test loading involves significant research questions that need to be addressed, including: What is the test load in comparison with the expected maximum service time load or the characteristic load? How can the instantaneous test load be compared with the actual long-term service-time load? Does the test loading harm the structure, and what is the target reliability in the test loading calculation? In this paper, we approach these questions from a theoretical point of view and propose how a suitable test load can be chosen in practice using an approximate and a precise approach.
1. Introduction
The trustworthiness of a structure is normally secured through codes, a competent structural design and proper execution control. Skilled test loading is an alternative technique that may be used as a partial or full replacement of special code stipulations, comprehensive design calculations or special quality-control measures. The current codes, however, lack detailed instructions for test loading. The Eurocodes [1,2,3] include general guidelines for test loading without the reliability survey, which is the key focus of this article. Apparently, for this reason, test loading is seldom applied in structural practice, and its full potential is not normally understood.
The testing may occur before the assembly of the structure (e.g., grading timber boards to various strength classes) or after the assembly. The theory and the principles presented here apply to both cases.
Test loading is, nevertheless, sometimes an outstanding and even a superior alternative to reliably verify the load bearing of a structure. Currently, it is applied in the following exceptional cases only: (1) when the reliability of the structure is doubtful; for example, due to a defect, it can be a feasible alternative to strengthening, demolishing or reduced load; (2) when the reliability demand is especially high or when test loading is easy; for instance, bridges are often test loaded; (3) when the material of the structure or the joints have exceptionally high variability, for example, glue lam beam lamellas, I-joist flanges and glued timber trusses are often test loaded. Video [4] discloses that I-joist flanges are test loaded before the joist assembly. In North America, glued timber trussed joists have been exploited extensively for several decades, and these joists are always test loaded [5]. (4) Some geotechnical codes include rules for test loading; pull anchors, for instance, are always test loaded [2,3,6]. However, these test loads seem high, about twice the characteristic load, and are set without a comprehensive probability examination.
Furthermore, the process of test loading involves several open research questions, including: What is the required test load in comparison with the expected maximum service time load or the characteristic load? How can the instantaneous test load be compared with the actual long-term service time load, and is the test loading harmful for the structure?
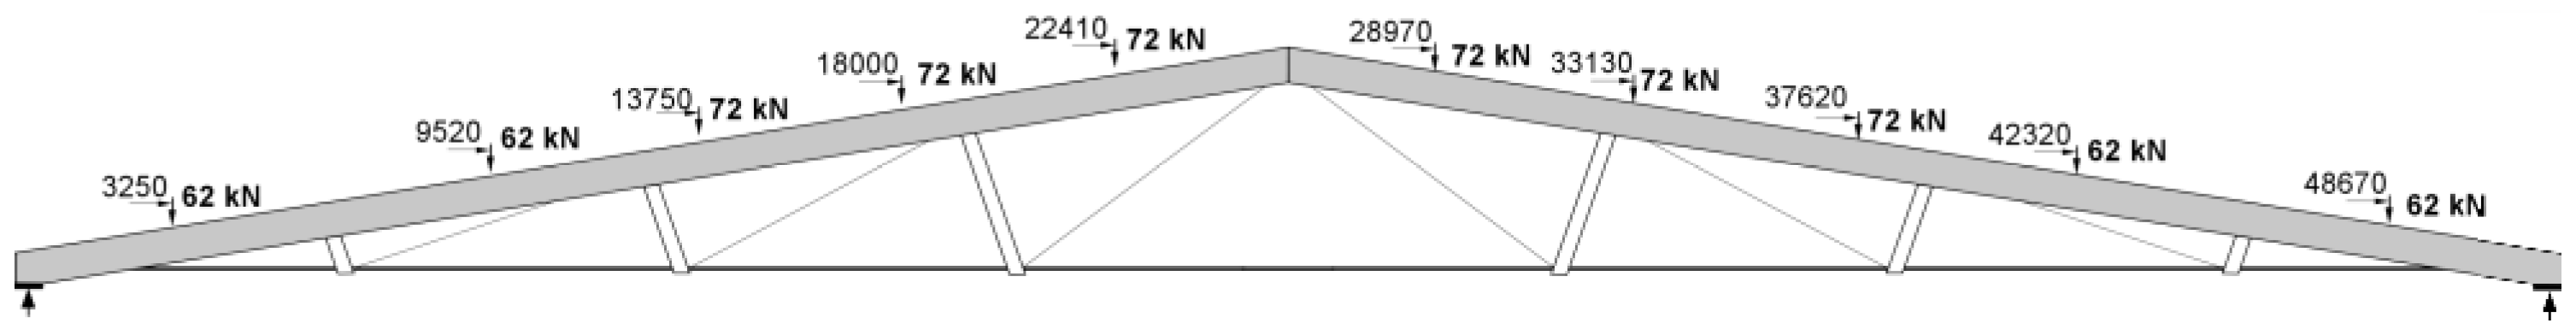
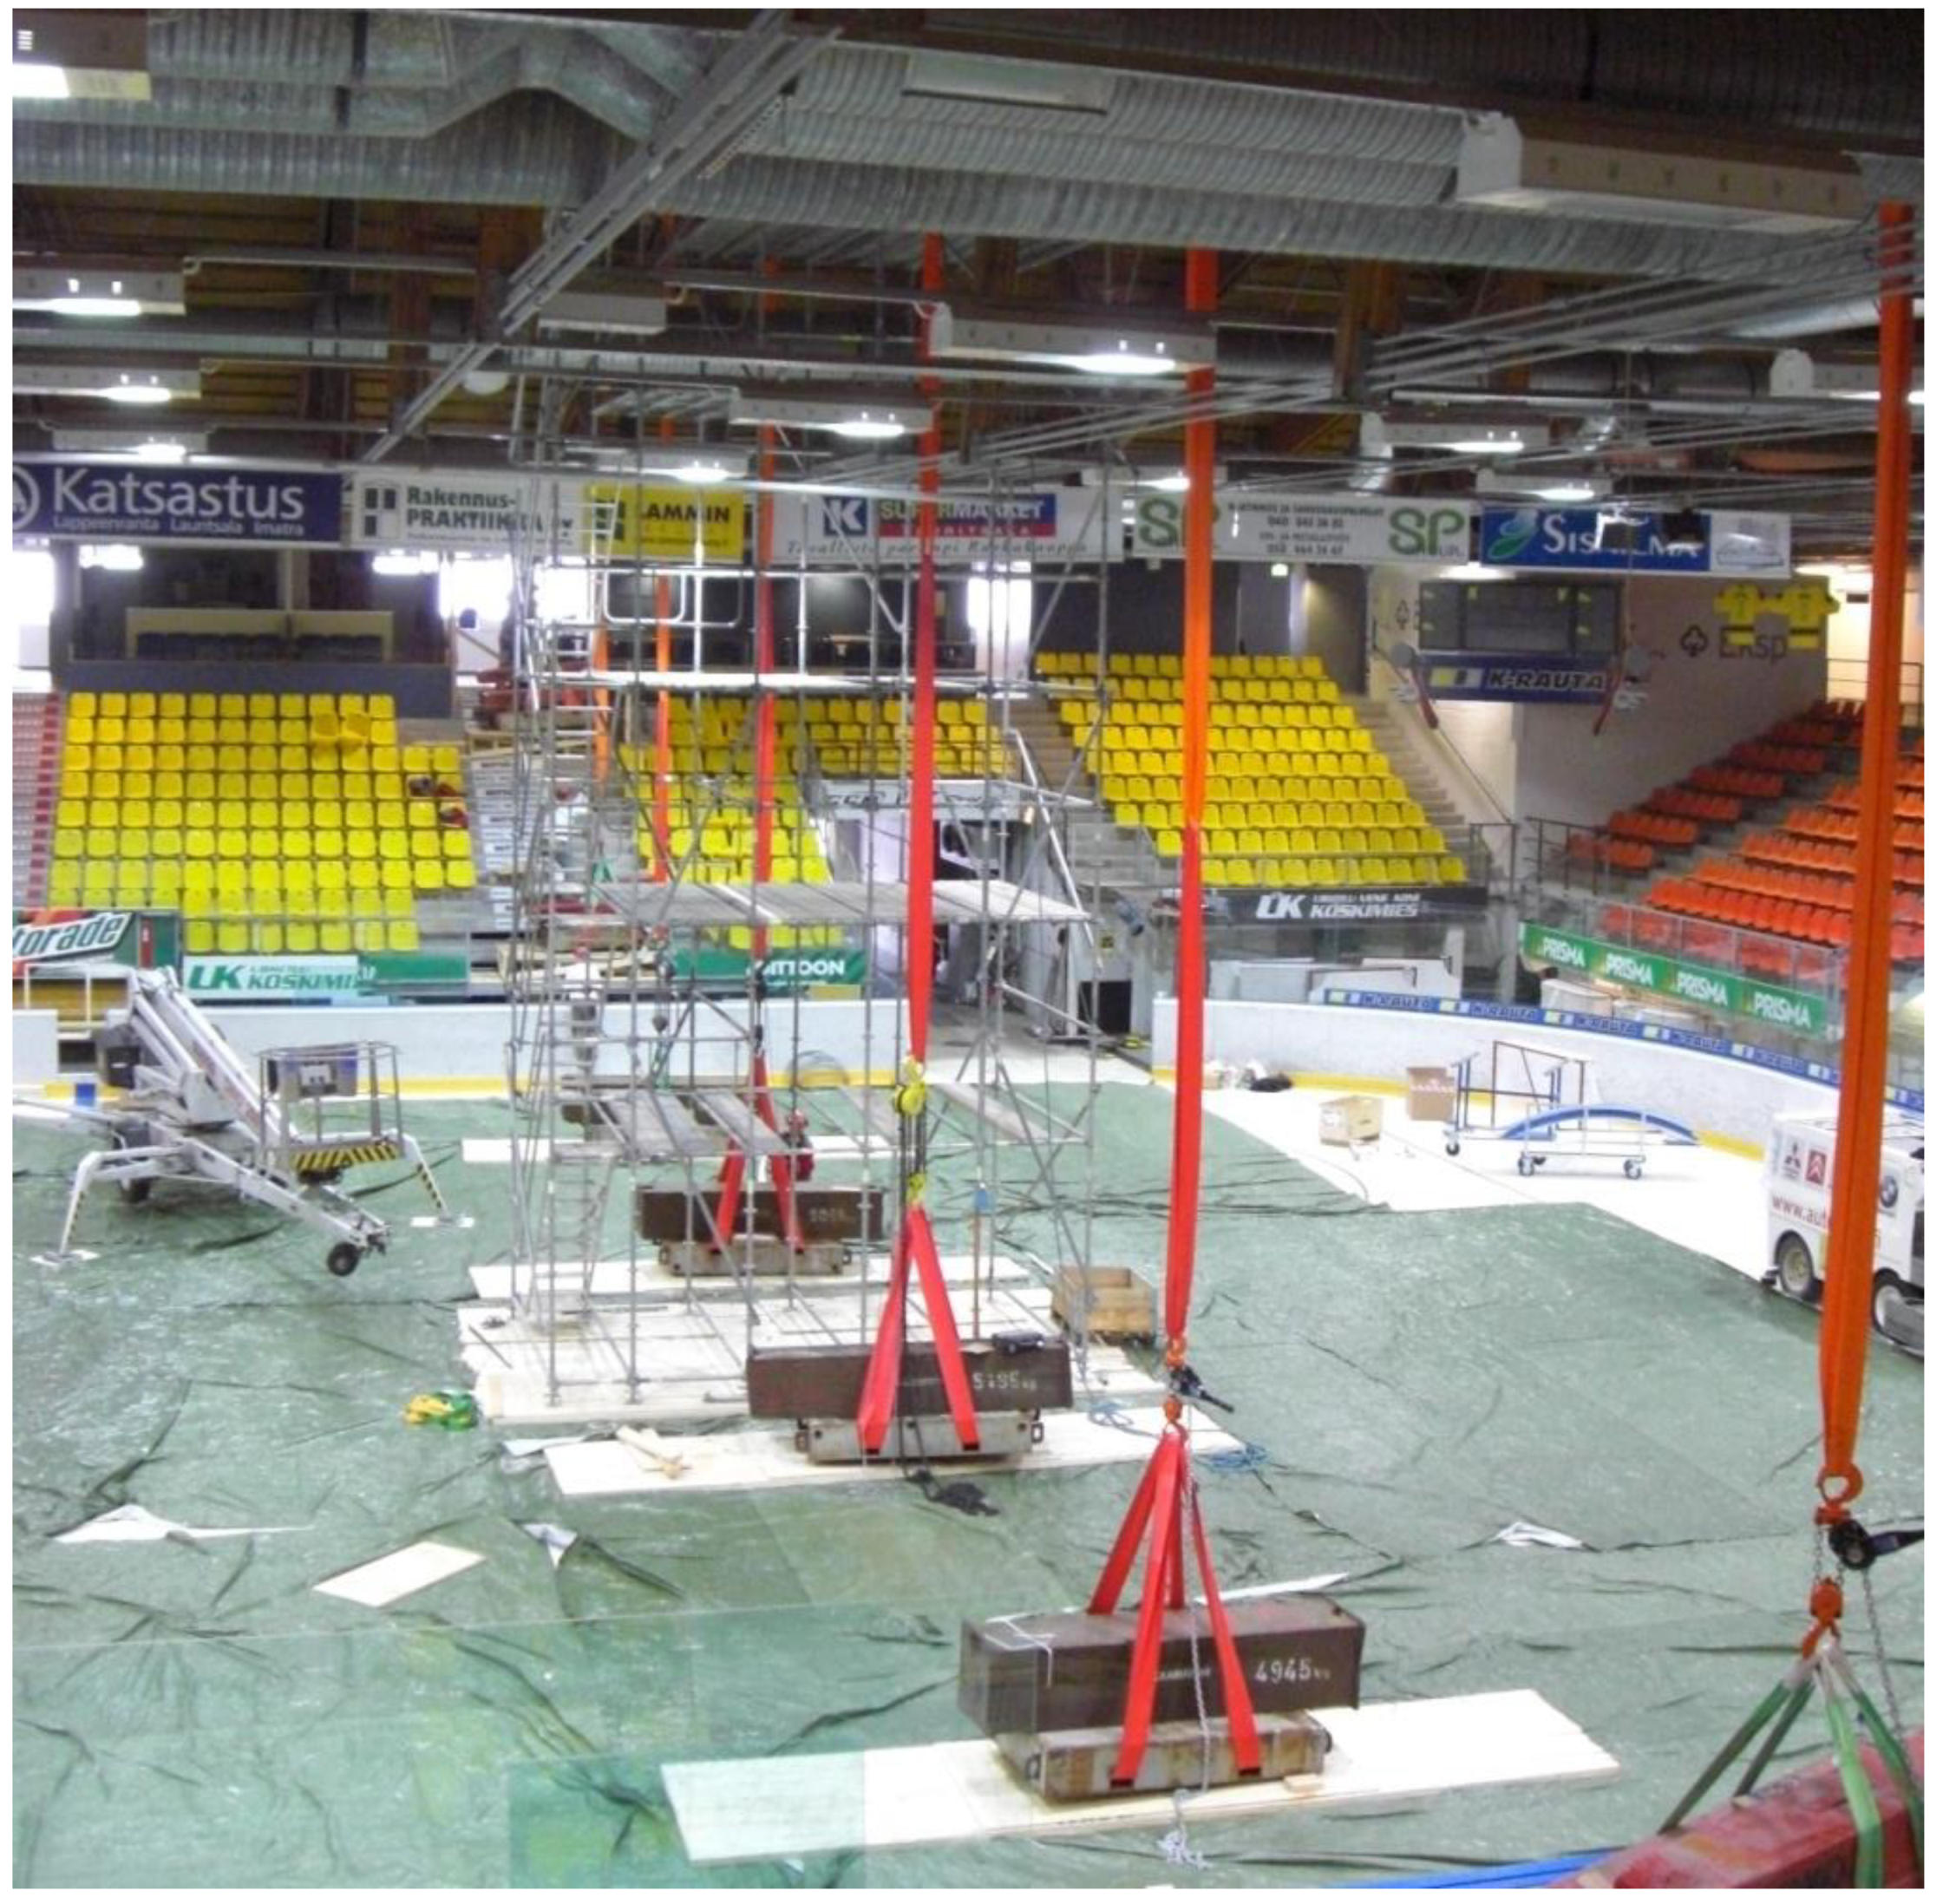
The authors have successfully test loaded several long-span girders e.g., the 50-year-old, 55 m span sports hall in the city of Lappeenranta, Finland, for which demolition had been suggested by previous studies but which, through test loading, has been verified for sufficient load-bearing capacity without strengthening (Figure 1 and Figure 2). Based on these experiences and on the following arguments, we see that test loading has the potential for more extensive practical usage.
The governing assumption for the combination of permanent and variable loads is the independent load combination and semi-probabilistic mathematics [1,2,3,7,8,9,10,11,12,13,14,15,16,17]. The authors have disclosed a new simple procedure and equations for combining permanent and variable loads independently [18,19]. These equations are modified here for the test loading. In the authors’ opinion, the loads should be combined dependently [18,20]. The test loading equations are presented here for the dependent load combination as well.
Test loading is a supreme technique in some cases due to its unique characteristics:
First, test loading ensures that the structure does not fail due to lack of strength; i.e., that the strength corresponds to the assumptions of the design. Whereas a normal structure may fail on overload; i.e., due to the load exceeding the design load or due to the lack of strength, a test loaded structure may fail only in the former case. This suggests that for a test loaded structure, the given overall reliability can be achieved with lower target reliability as compared to the normal case. Namely, surveys on structural failures show that the cause of the failure is practically always the lack of strength, normally with no overload [21]. Moreover, the overload (variable load) is such a rare occurrence that it normally generates a warning in one way or another.
Second, a normal structure involves uncertainties and variabilities due to codes, design and execution, but a test loaded structure does not, which is another reason why it can be calculated for lower target reliability.
Third, if test loading is applied for an existing structure with a short remaining residual service time, target reliability may be lowered, since the service time survived indicates that a certain probability of survival and the short remaining time justifies the lowered reliability demand.
In this paper, we adopt a theoretical point of view and propose how a suitable test loading with lowered target reliability can be chosen in practice using an approximate and a precise approach. The process of test loading is seen here as a partial or full alternative of the Eurocodes as implemented in Finland. Our focus is, especially, on the Finnish Eurocodes and timber structures [22]. The assumptions, terms and notations of these codes are used [1,22]. Attention is paid to the characteristic variable load. All design codes are based on its one-year 98th percentile and 0.64 probability in 50-year service time. In the structural design, this load is multiplied with a safety factor (1.5 in the Eurocodes).
2. Target Reliability for the Test Loading Calculations
The target reliability index of the Eurocodes [1] in the normal reliability class RC2 is ; i.e., the failure probability Pf50 is 1/15,400 in 50 years. This estimate for reliability considers the possibility of a failure due to overload or lack of strength, as well as the uncertainties and variabilities for the code directives, design calculations and execution. A test loaded structure does not lack strength or have the above uncertainties and variabilities. Therefore, test loading calculations can be made for a target reliability lower than .
The proportion of uncertainty is normally assumed to be about 5–10% of the overall safety factor. Furthermore, a test loaded structure may fail on the overload only, and behavior variability for lacking strength is nonexistent. We assume here that the decreased variability of this cause justifies about a 5–10% lower overall safety factor. The test loaded structure may fail on the overload only, which normally gives a warning, and therefore a 0–5% lower overall safety factor may be applied. To sum up the effects explained above, we assume that the test loaded structure may be designed for a 15% lower overall safety factor. This rough estimate is used here in the approximative calculations only.
The statistics available on the causes of structural failures are scarce. The authors have investigated structural failures over several decades and in their opinion, about 10% of the failures are due to overload, and 90% are due to other reasons. This estimate was confirmed recently in verbal communication with the experts of the Finnish Safety Investigation Authority (https://www.turvallisuustutkinta.fi (accessed on 8 January 2021)). Consequently, the reliability calculations are made here assuming that the failure probability in the test loading calculations is Pf50 = 1/1500, which is 10 times higher than the one in the normal design, . The higher failure probability is justified as 90% of the failure reasons are absent, and the failure domain is smaller. There are arguments for even lower reliability and higher failure probability: the overload gives a warning, and the overall uncertainty is less. However, these arguments are disregarded, and it is assumed that they compensate for the uncertainties of the test loading. corresponds approximately to RC1 of the Eurocodes. Thus, we assume here that the test loaded structure calculated for RC1 has overall reliability equal to a normal structure calculated for RC2.
The literature on structural reliability recommends a target reliability of in normal design cases [10], which suggests that the test loading can be made for a reliability of about . This option is not pursued here but the reliability calculations are made for , which is considered unquestionably safe or excessively safe.
3. Instantaneous Loading Versus the Service-Time Loading
In some materials, such as timber and plastics, the resistance decreases with increased load duration. In the design codes, such variable resistance is determined by separating the loads into different duration classes specified by a modification factor, which determines the resistance in proportion to the reference. Table 1 includes the modification factor Kmod for solid wood in the European timber code [22].
The test loading is normally instantaneous with the load duration of a couple of seconds only; i.e., its modification factor is Most timber structures are loaded with a medium-term load (Kmod = 0.8). Thus, we may assume that, in this case, the test load must be 1.375 (1.1/0.8) times the significant medium-term load to compensate for the load-duration effect. Each load duration needs its own load-duration effects.
4. Harmful Effects
Test loading can potentially cause harmful effects, which increase along with the rising test load. To overcome this difficulty, the following special precautions should be considered:
- The structure must not give any noteworthy indication of cracking, such as a rupturing sound during the loading.
- The structure must stay mainly in the elastic state during the loading; i.e., the deflection must return to its unloaded state after the loading, and the load-deflection behavior must be linear.
- The test load should be adjusted to be as low as possible to satisfy the reliability demand. For example, it is feasible to utilize test loading for structures that are unlikely to carry the full load during the service time. In this case, test loading can be conducted for a lower load. If the actual load exceeds the test load, special measures will be taken. The authors have used this method to test load defective long-span roof girders. In this case, the critical load is a layer of snow. If the actual snow load exceeds the critical load, action can be taken to remove the snow in order to reduce the load. As the snow is removed directly when the critical limit is exceeded or close to that limit, the load-duration effect can be omitted.
- Only a part of the structure is test loaded. This method can be applied, for example, in a quality-assurance program.
The authors suggest that if the points above are considered appropriately, the probability for harmful effects will be negligible.
5. Choosing the Test Load
This section proposes two alternative approaches for choosing the test load. The first one is approximative and helps in understanding the concept. The second proposal is based on the state-of-the-art probability theory. Both methods are based on the assumptions explained above: in the approximate method, the test load is the same as the load factor, which is set assuming that the test load safety factor is 15% lower than the normal one; i.e., and . In the second method, the test load is derived for the reliability index instead of .
A debatable issue is whether the loads should be combined independently with lower overall safety or dependently with stricter criteria and higher design loads. In the authors’ opinion, the latter is the correct approach [18,20]. However, the independent load combination is applied in many codes and, therefore, results for both combination methods are presented.
5.1. Approximate Method
In the Eurocodes, the variable load safety factor is set for the most variable loads like snow, . The live load has less variability, [17], and a lower safety factor can be used. is assumed here. An even lower factor value could be used, as disclosed in the next section. The Eurocodes [1] include the dependent load combination rule (8.12) for joining these loads. The resulting dependent combination load is given by the equation:
The Eurocodes include two independent load combination rules (8.13a,b) and (8.14a,b). The rule (8.14a,b), used in Finland, is applied here:
As explained above, in the test loading, 15% lower load factors can be applied to obtain the target reliability. Figure 3 illustrates the test load as a function of the load ratio ; i.e., the ratio between the variable q load and the total load q+g:
5.2. Probability Method
Test loading can be employed in cases with known or unknown resistance distribution. These two cases need a different approach and are addressed here one by one. Both methodologies have the same basic theory, which is tackled first.
5.2.1. Partial Factors vs. Design Values
In the current partial safety factor codes, the safety factors are unequal (). The safety factors can be set equal () by modifying the characteristic load of the variable load. For example, if in the Eurocodes the characteristic value of the variable load is increased by 11%, the load factors will be the same (). The design equation can be divided by the load factor when design value equations are obtained, which reaches the same result as the partial factor equations.
If the partial factor design is applied for the test loading, the loads obtained relate to multiplication by the load factors and . These values can be divided by the load factors when the test loads corresponding to the design values are obtained. Thus, the same test loads are obtained in both methods. For simplicity, the design-value approach is applied here.
5.2.2. Equations for Safety-Factor Calculation
Normally, permanent and variable loads are combined independently, but in the authors’ opinion, the loads should be combined dependently, as the independent combination contradicts the physics [20]. The dependent combination results in higher loads, and is therefore safer and applied here. As a comparison, the results for the independent load combination are given as well. The authors explained the dependent and the independent safety factor calculation procedure earlier [18,19], and it is disclosed concisely here.
The notation of the Eurocodes is applied. The design point may be chosen arbitrarily. It is set here at unity, where the characteristic values of all distributions are fixed; i.e., the 0.5 fractile of the permanent load, the 0.98 fractile of the variable load and the 0.05 fractile of the material property.
The permanent load distribution, cumulative distribution and density distribution are assumed to be normal with , , VG = 0.0915. These parameter settings correspond with the permanent load safety factor of the Eurocodes; that is, .
The variable-load distribution, cumulative distribution and density distribution are assumed to be Gumbel. The variable load-safety factor is . The coefficient of variation is assumed like snow; and like a live load. In the dependent load combination, the variable load distribution is in the 50-year mode; i.e., . In the independent load combination, the variable load distribution is in the 5-year mode; i.e., [12,13,14,19], which is due to the reliability reduction ( in the FORM reliability calculation). The variable load ratio in the total load is .
The distribution of the material properties is assumed to be log-normal, with cumulative distribution and density distribution . The material parameters of the three materials examined here are given in Table 2.
When only the permanent load acts, the material safety factor γM can be solved by the equation [18,19]:
If the variable load acts individually, the factor in Equation (4) is replaced by . The material safety factors for an individual permanent load , or variable load , are given in Table 3 for 5- and 50-year durations with b50 = 3.83; i.e., Pf50 = 1/15,400, VQ = 0.4 and VQ = 0.2 , , , and .
The permanent load and the 5-year variable load are combined independently with load ratio α, using the convolution equation to obtain the independent cumulative distribution (x, α) for the combination loading [18,19].
The dependent load combination (x, α) is calculated by adding up the partial loadings by fractiles. The following recursive form is more appropriate for the actual calculations [18,19,20] for the dependent combination distribution:
The material-safety factor for the independent and dependent load combinations is calculated using Equation (4) with the distribution replaced by and , respectively.
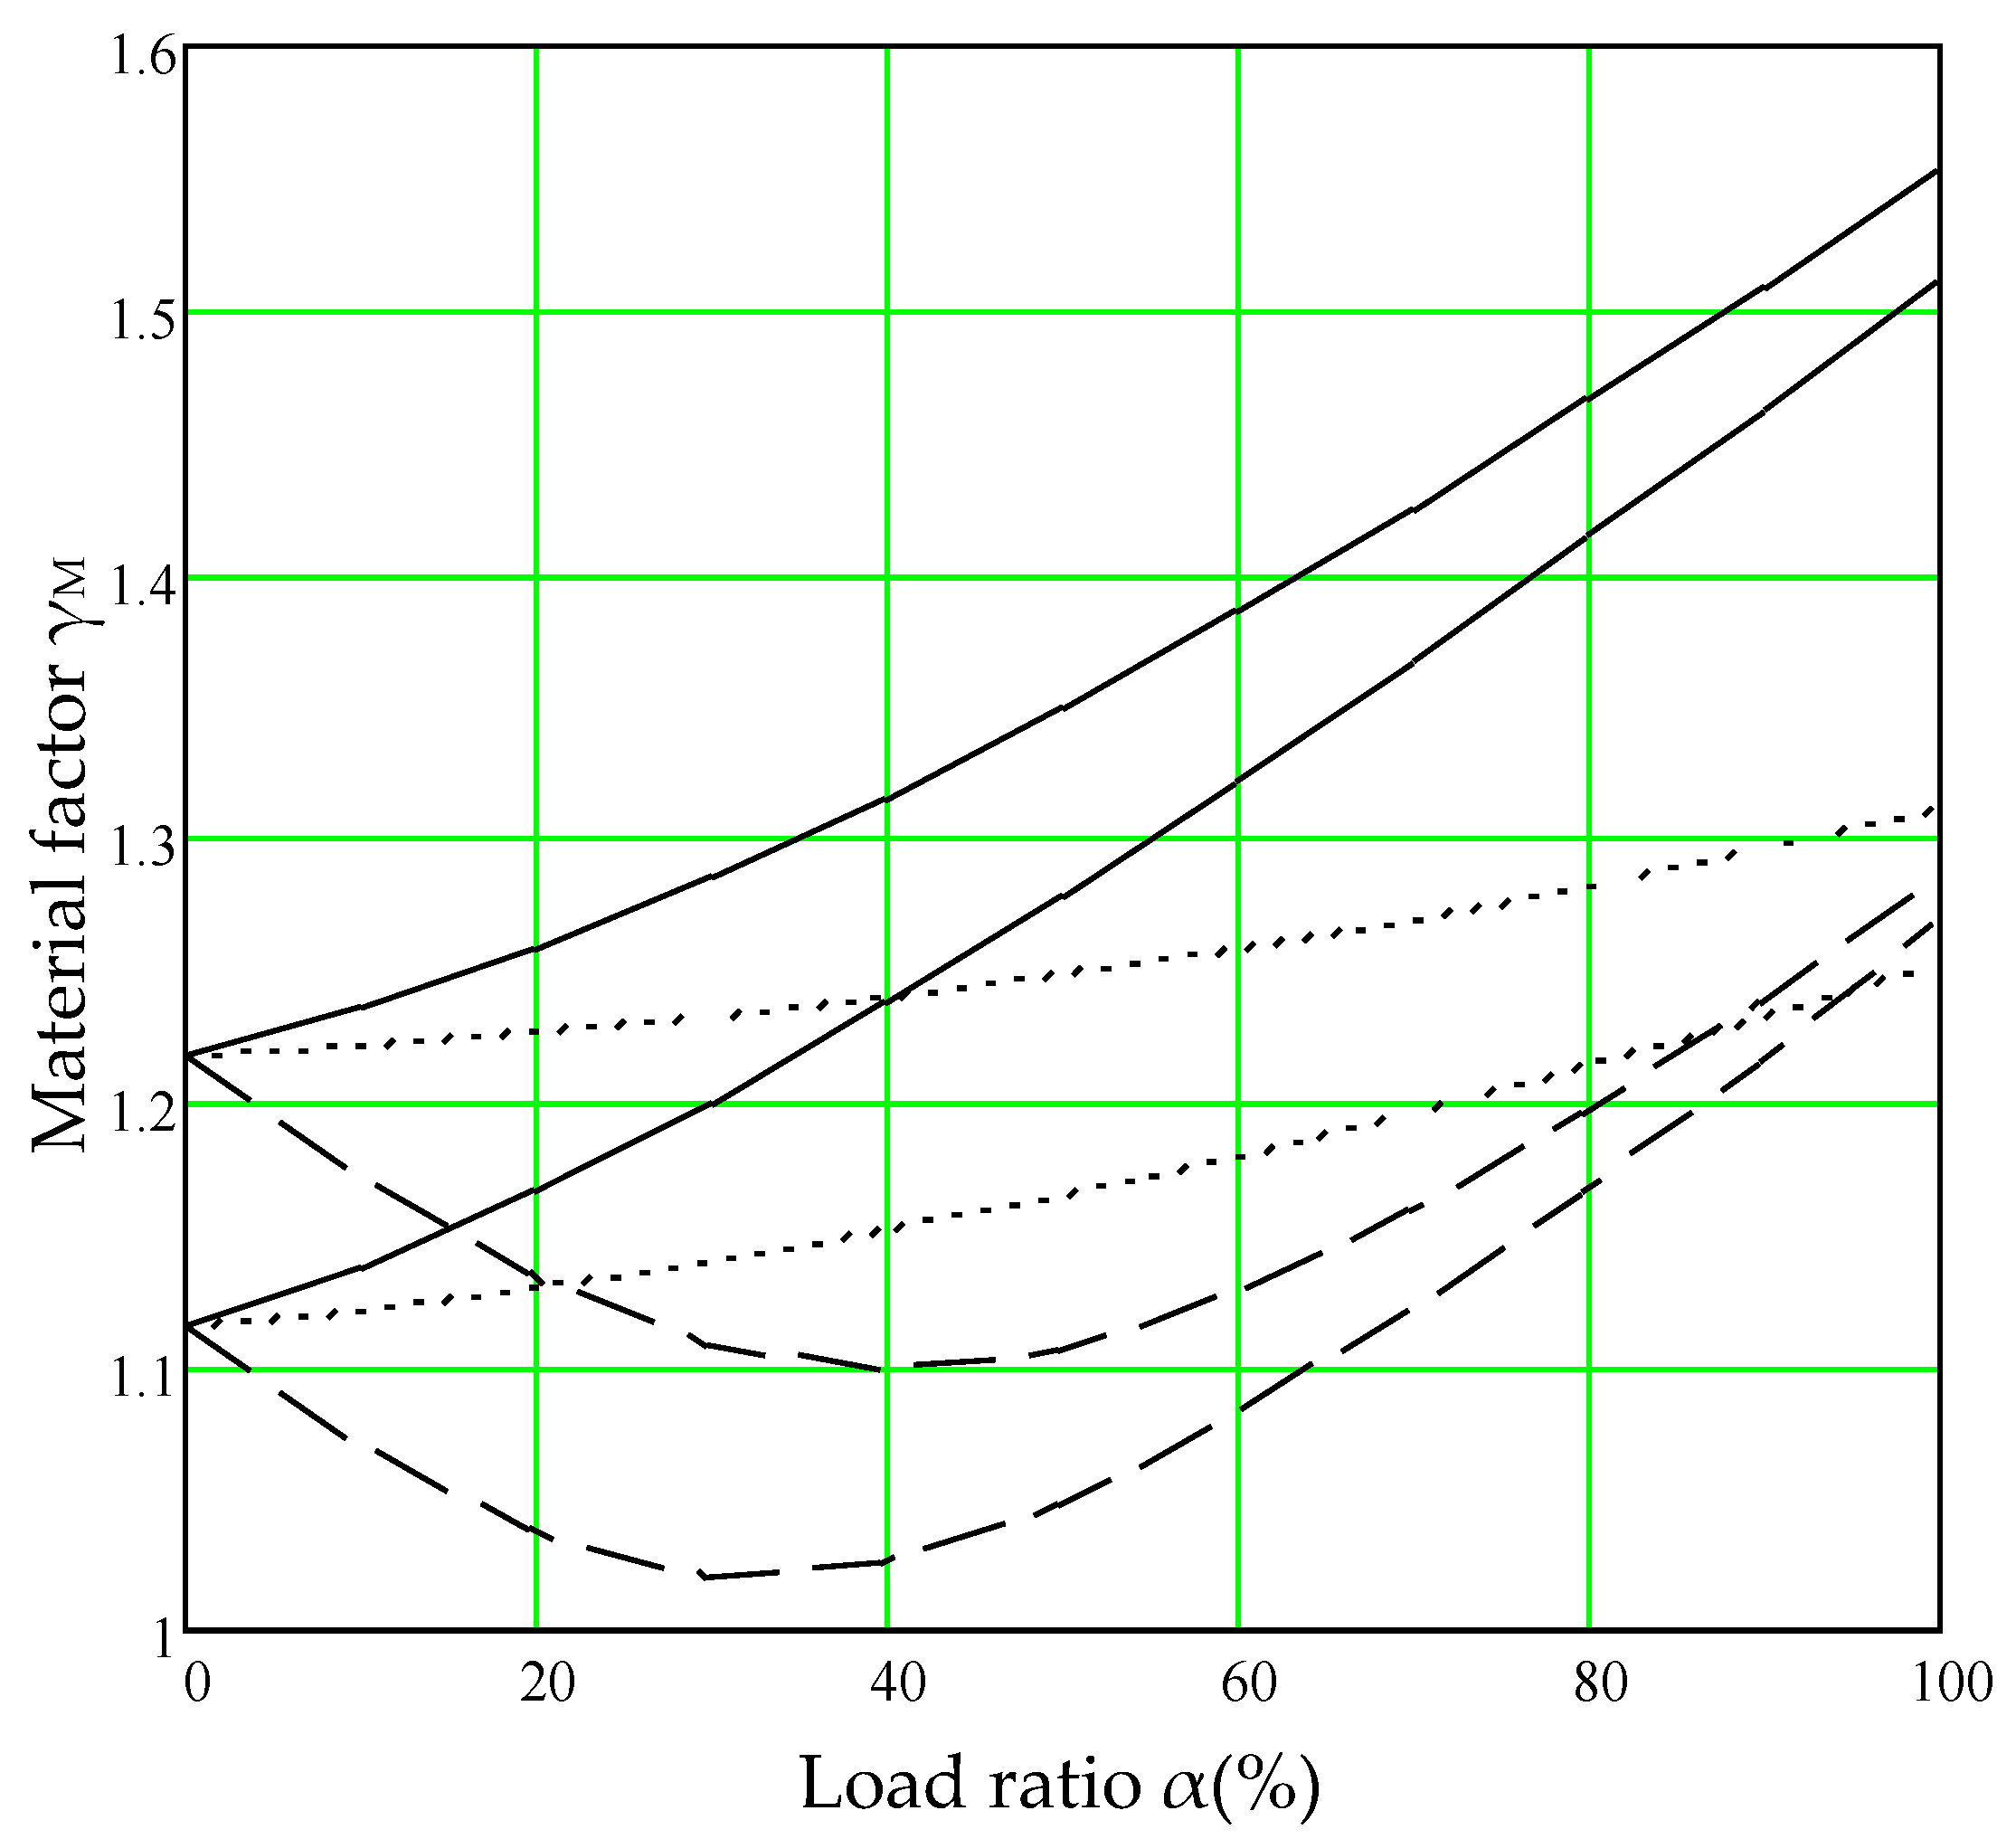
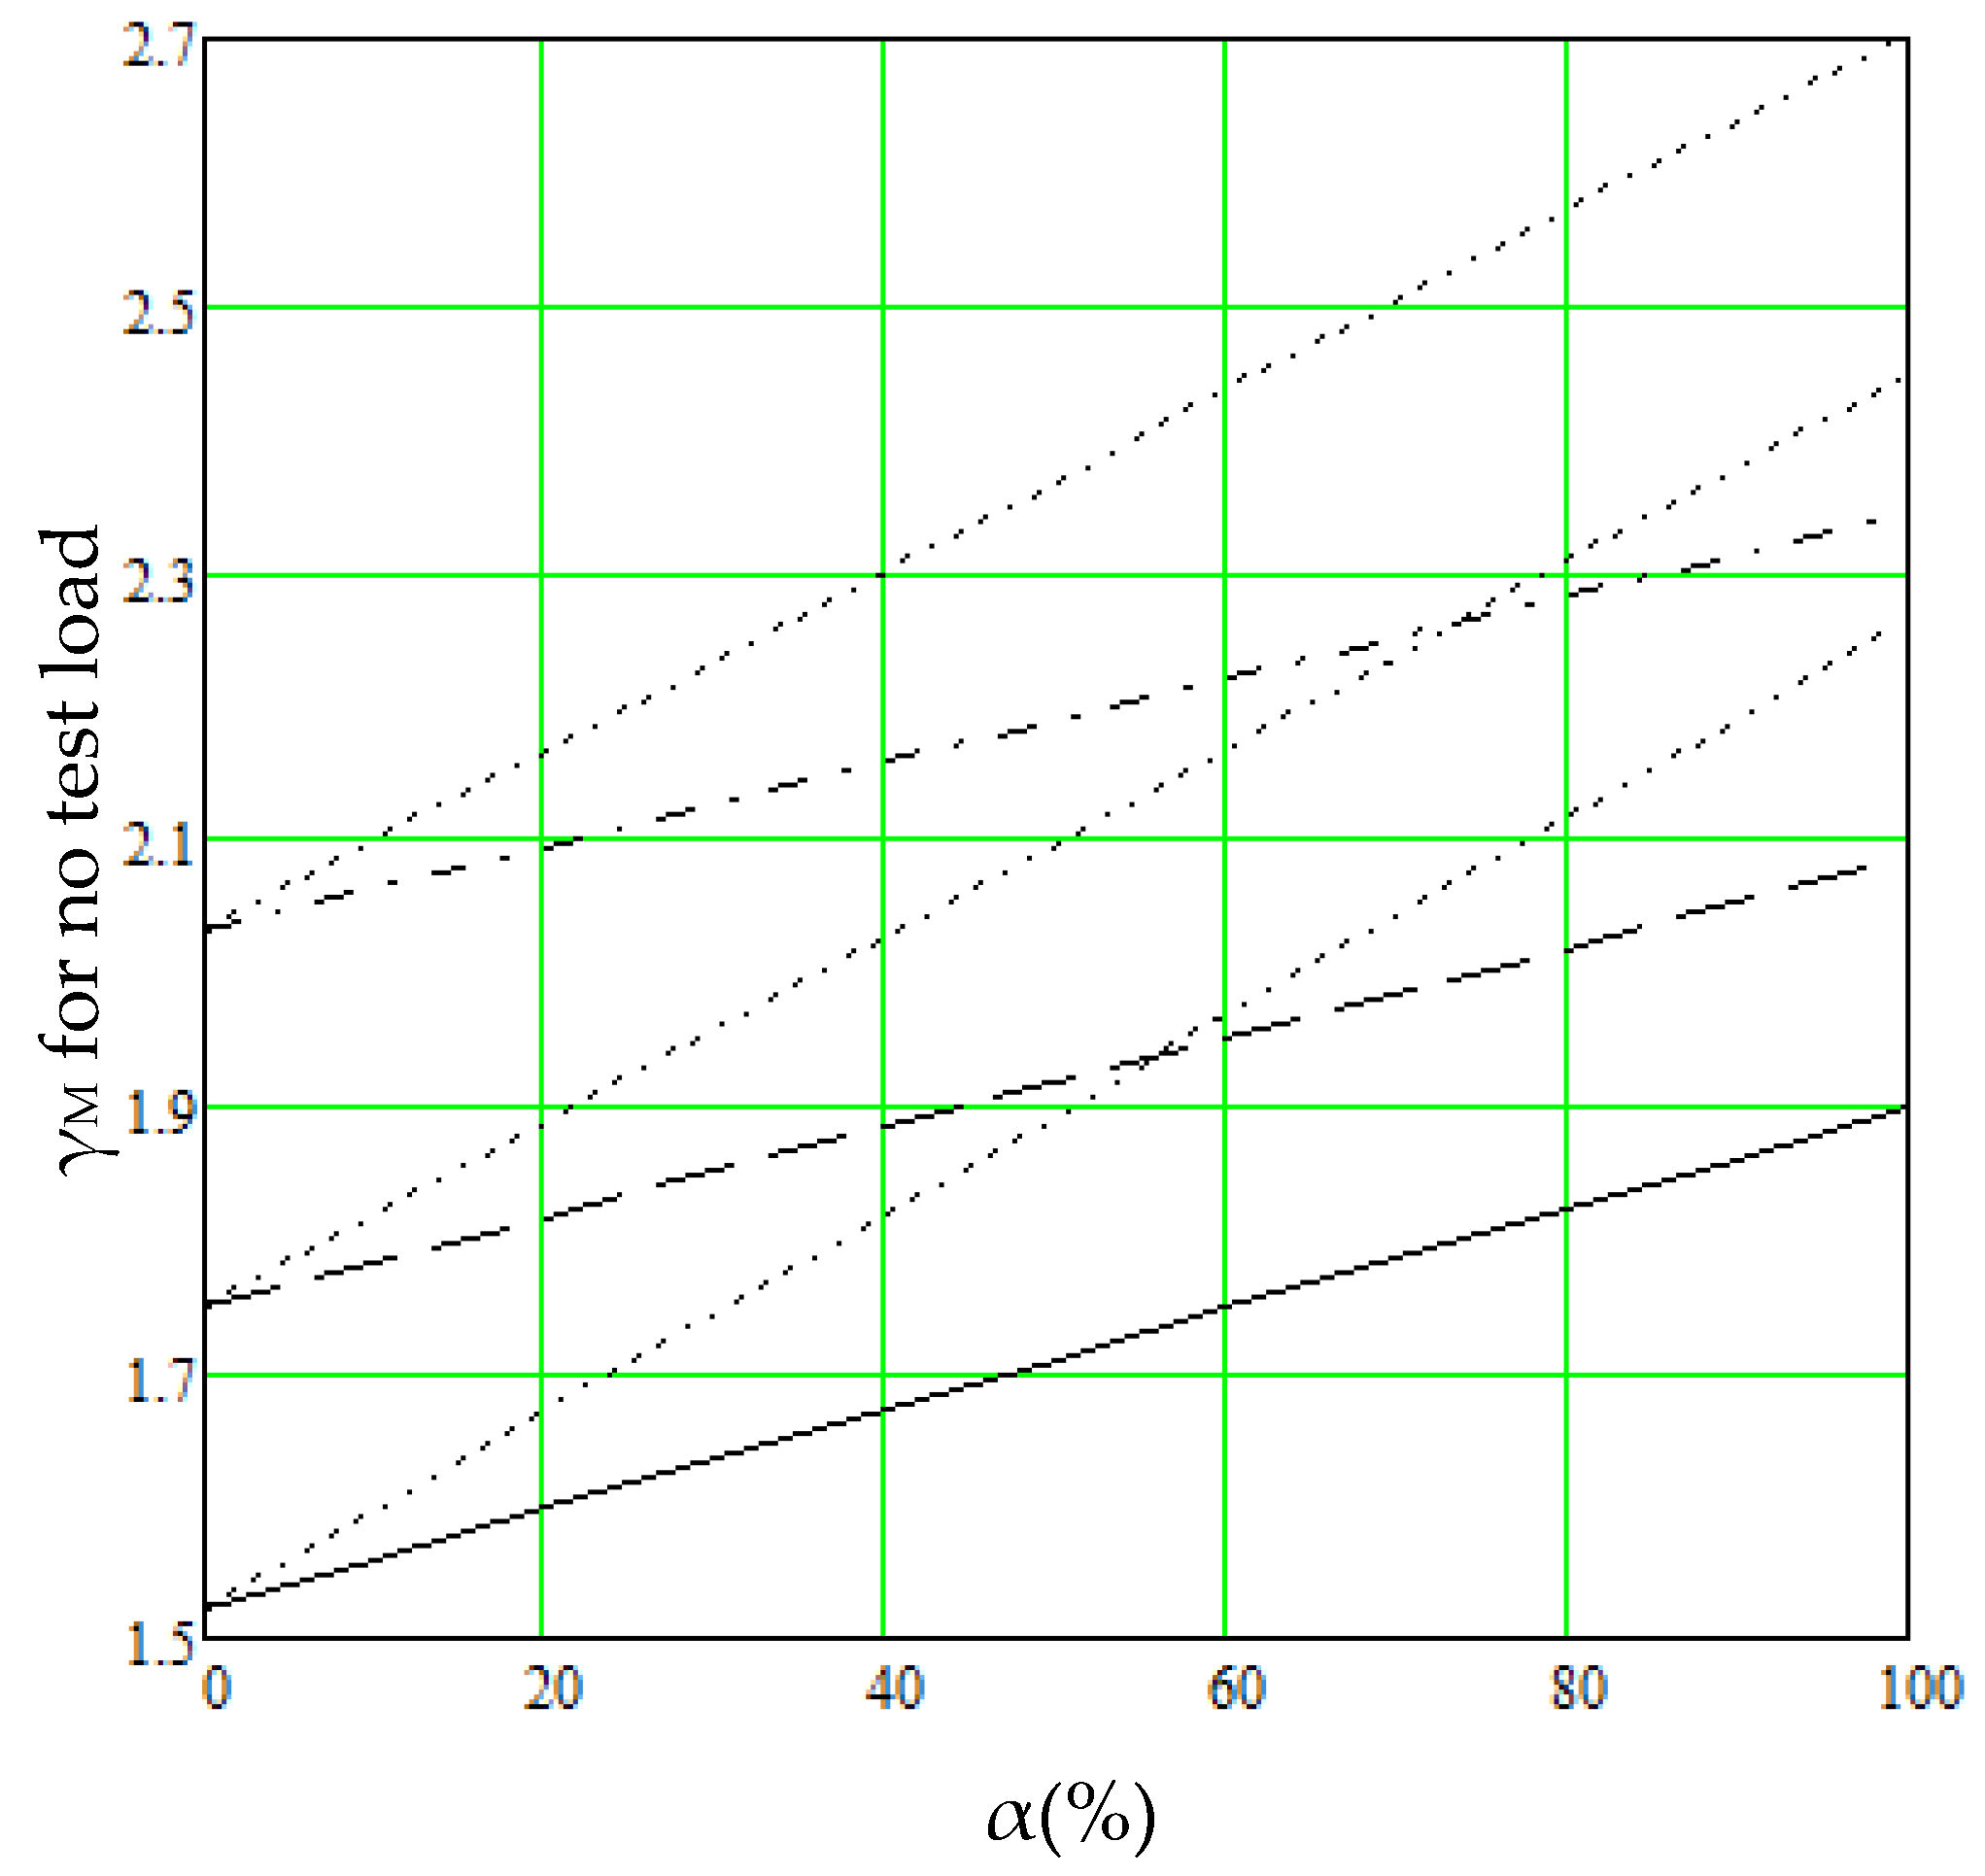
Figure 4 gives the material-safety factors as a function of the load ratio α, calculated via the equations above without considering the uncertainty of two materials (VM = 0.15, 0.2) and for two variable loads (VQ = 0.4 and VQ = 0.2). For α = 0%, only the permanent load is acting, while for α = 100%, only the variable load is acting. The solid lines denote the dependent load combination (and 50-year variable-load setting); dashed lines apply to the independent load combination (and 5-year variable-load setting). The upper lines denote VM = 0.2, and the lower ones VM = 0.15. The dotted lines apply to the dependent load combination with VQ = 0.2, e.g., a live load.
Normally, the dependent load combination is about 10% higher than the independent one. However, in this case, the dependent load combination was about 20% higher when the proportion of the variable load was high.
The dependent safety factor curves are straight lines within about 1% accuracy at loading ratios α = 20–80%. This approximation is applied later in this study.
5.2.3. Is the Test Loading Needed?
When the resistance is high, the test loading is not needed. The required resistance μM, σM can be solved approximately from Equation (4) by setting γG = γQ = 1, as in ideal partial safety factor codes, the design loads stay below the characteristic values. The same applies to the design value codes as well when the load factors are separated from the total factors. Then the reliability is obtained from the resistance only; i.e., the load may be arbitrary. The results are given in Figure 5. The solid line applies to VQ = 0.2, VM = 0.1; the dashed line to VQ = 0.2, VM = 0.15; and the dash-dotted line to VQ = 0.2, VM = 0.2. Dotted lines denote corresponding values for VQ = 0.4.
5.2.4. Equations for Test Loading Calculations
Test loading reduces the resistance distribution by eliminating low-resistance items below the test load. The design point is set at unity; i.e., the characteristic values of the distributions are fixed at unity.
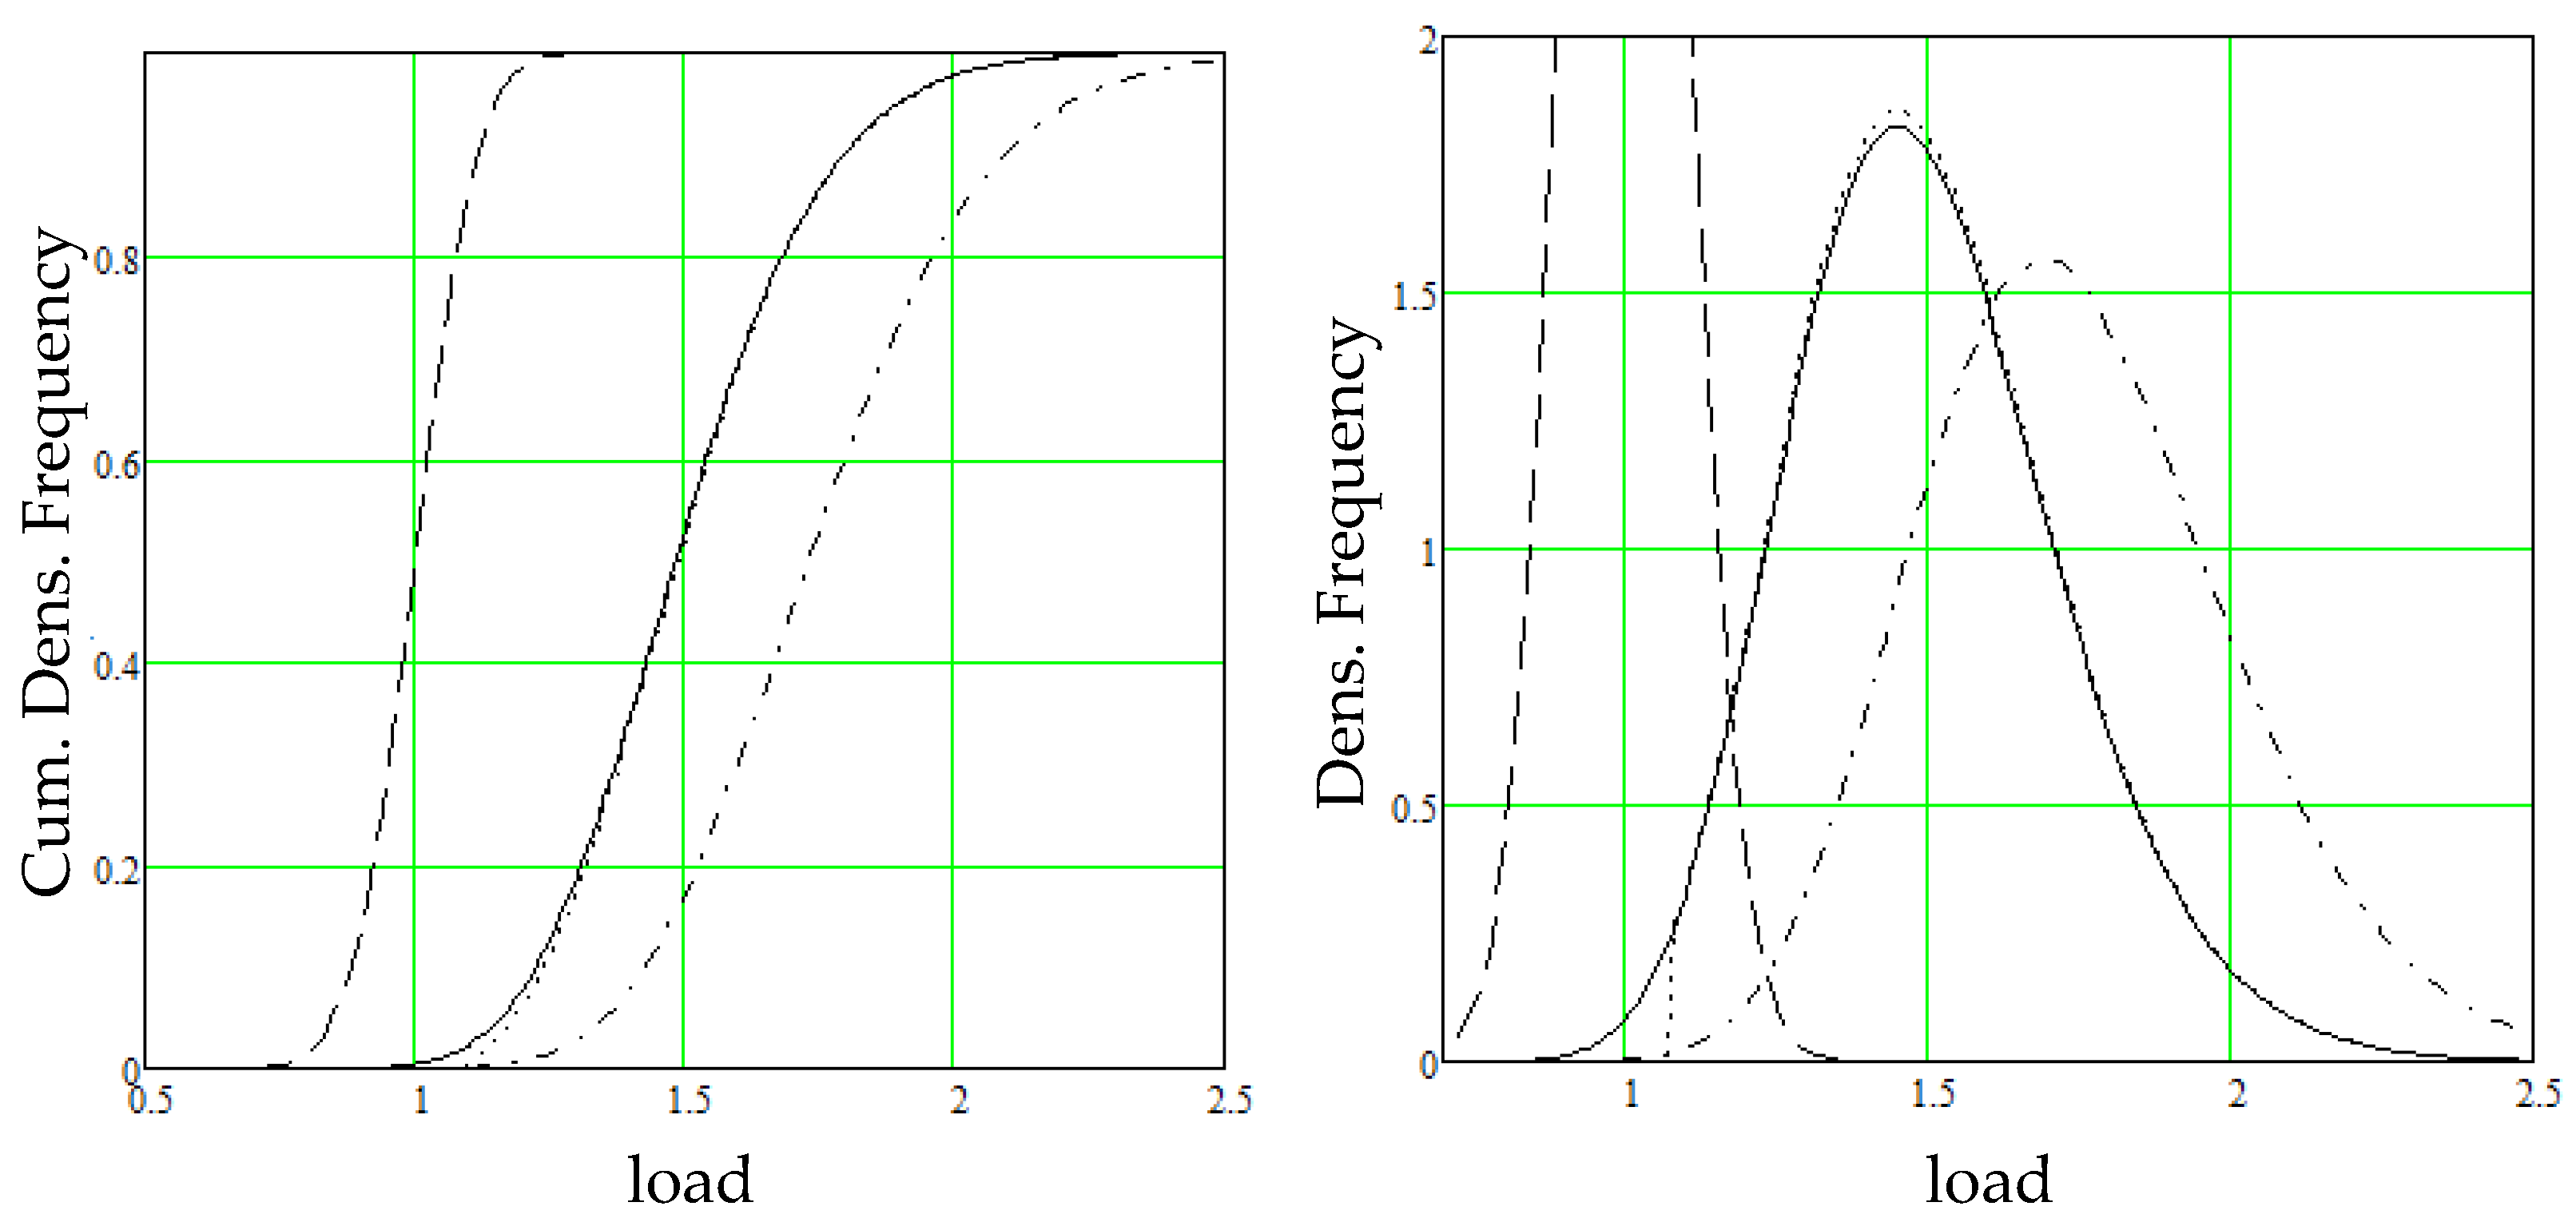
Figure 6 demonstrates the idea in the actual permanent load and resistance distribution of high-quality timber, β50 = 3.2, VM = 0.15, μM = 1.5. The test load is 1.071 obtained from Equation (7). Test loading is not needed if the mean resistance is γM = 1.749 obtained from Equation (4). The dashed lines apply the permanent load distributions; the solid lines are material distributions; the dotted lines are material distributions after test loading; and the dash-dotted line applies to the resistance distribution where test loading is not needed.
The equations for test loading are based on the safety factor calculation in Equations (4)–(6) above. When the structure is test loaded by the permanent load only, equation derived from Equation (4), to calculate the test load γ to reach failure probability is:
The result for β50 = 3.2; i.e., = 1/1500, = 1.5, VM = 0.15 is γ = 1.071.
The equation for the variable loading is:
and the result for the variable loading VQ = 0.20 and the same parameters as above is γ = 1.241.
The test load γ for an independent load combination with load ratio α is calculated by:
5.2.5. Test Loading with Known Resistance Distribution
Test loading is currently applied in three cases where the resistance distribution is known. Glue lam lamella scanning is sometimes applied to obtain beams with a high resistance. I-joists are often test loaded to secure required reliability. Glued timber trusses manufactured presently are always tested for a test load, which is 1.5 times the characteristic load, (https://www.openjoisttriforce.com/ (accessed on 26 March 2021)).
In this test loading concept, the resistance distribution; i.e., distribution type, mean μM and deviation σM, are first settled. Then, the manufacturer selects the characteristic load. The higher the characteristic load, the higher the proportion of the structures that fail in the test loading; that is, the selection of the characteristic load needs optimization.
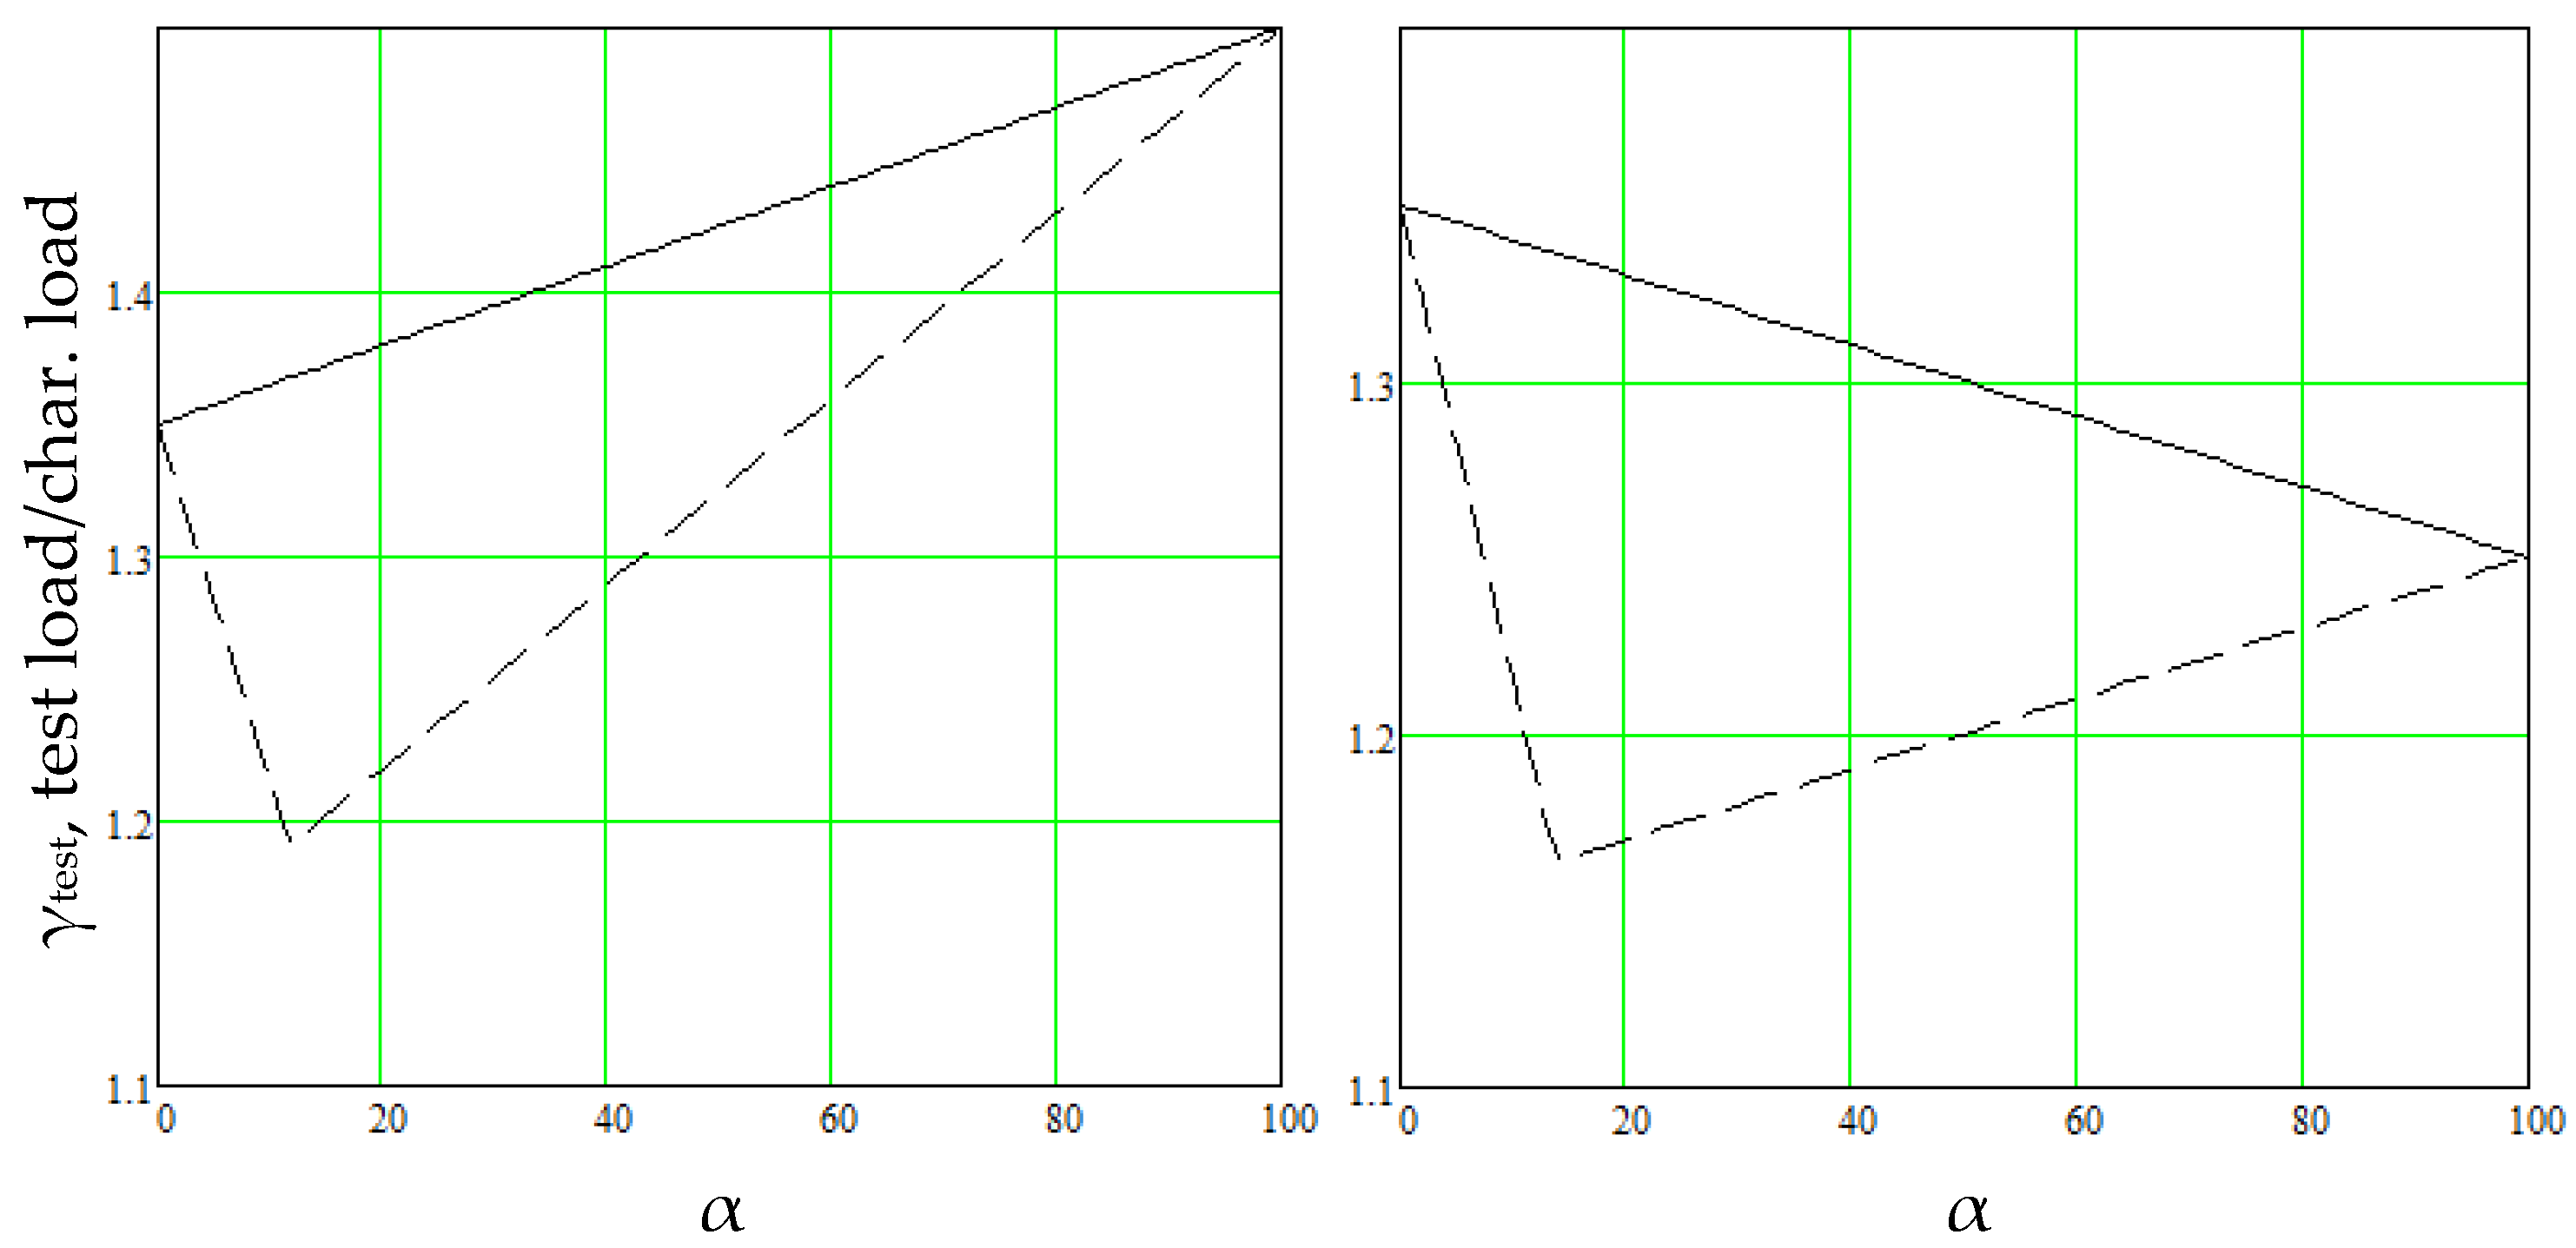
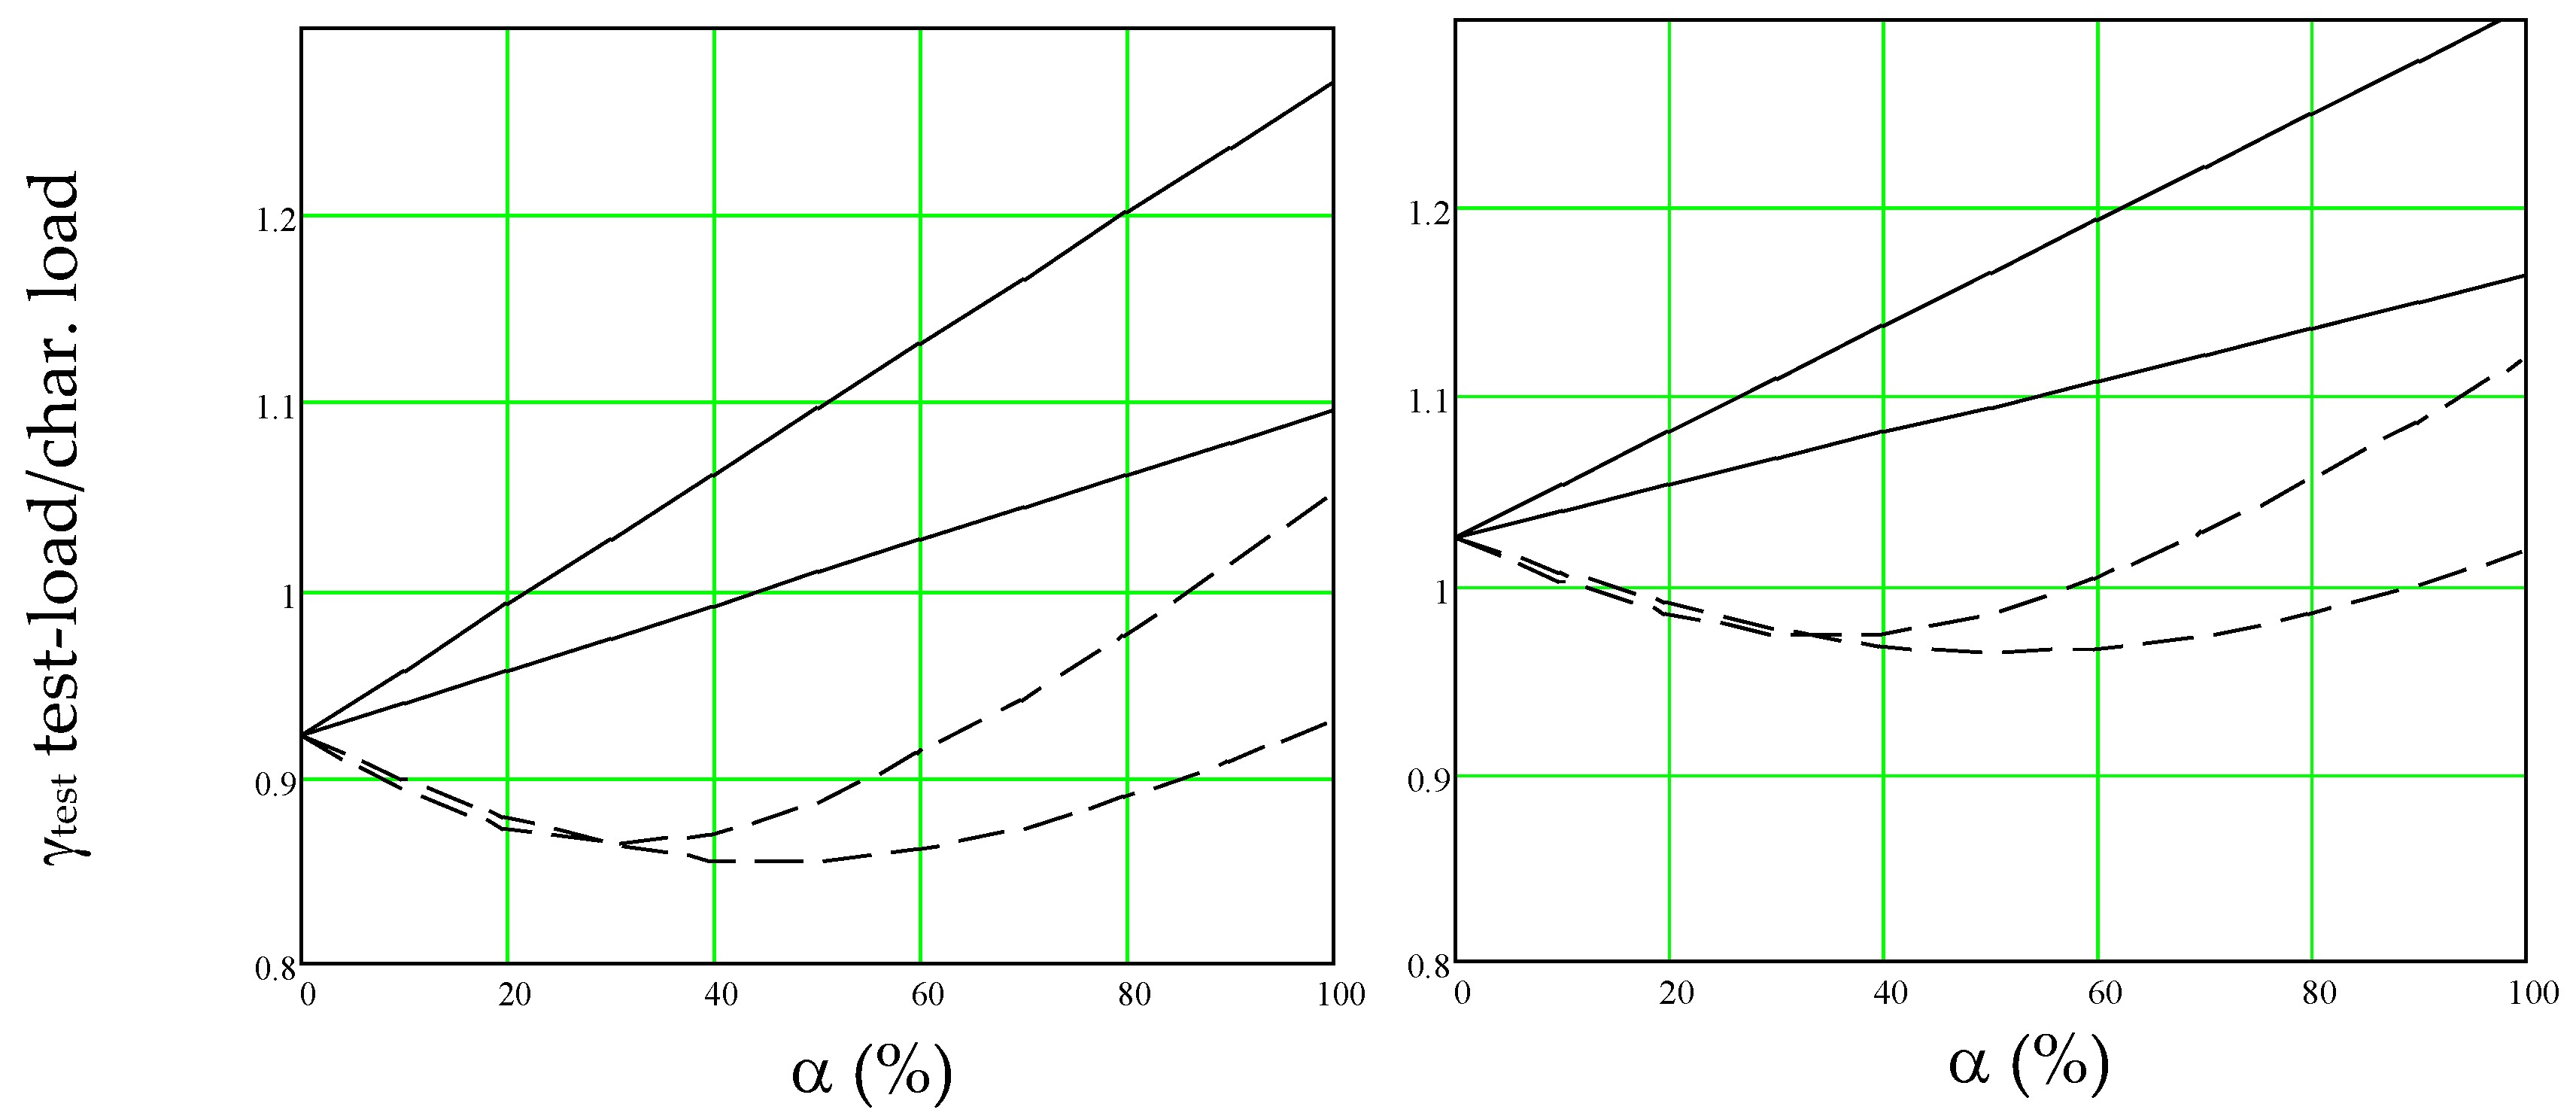
In glued timber truss test loading, log-normal is a feasible distribution, coefficient of variation is VM = 0.15–0.2 and the characteristic load is about μM /1.9. In Figure 7, test loads γ are given for β50 = 3.2 (Pf50 = 1/1500) and μM = 1.9; i.e., the mean resistance is 1.9 times the design point and the characteristic load values. In the left and right graphs of Figure 3, VM = 0.15 and VM = 0.20, respectively; the solid lines correspond to the dependent load combination and the dashed lines to the independent one; the upper lines depict the case VQ = 0.4, and lower lines VQ = 0.2.
The dependent test load values are about 20% higher than the independent ones, which suggests that the test loads calculated for β50 = 3.2 may be excessively high. Figure 4 suggests that the reliability of the current Eurocodes is less than intended for β50 = 3.8. Studies by the authors show that the overall reliability of the current Eurocodes is about β50 = 3.2 if the load combination is dependent. Therefore, as explained above, one can justify calculating the test loads for a lower reliability than β50 = 3.2. However, this lower reliability is not recommended here; instead, we emphasize that the results obtained for β50 = 3.2 are probably excessively safe.
Thus, when the mean resistance is at least 1.9 times the characteristic load, the test loads γtest can be calculated by for VQ = 0.2, VM = 0.15:
for VQ = 0.4, VM = 0.15:
for VQ = 0.2, VM = 0.20:
for VQ = 0.4, VM = 0.20:
where α is the proportion of the variable load in the total load.
If the structure is a timber structure, the γtest values above must be multiplied by the load-duration factor, normally 1.375. For example, if the structure is a glued timber truss that is used as a floor joist, VQ = 0.2 and VM = 0.15, and the load proportion is α = 0.7, then the actual test load is γtest = 1.43 regarding the characteristic load. When the structure is used as a roof joist, VQ = 0.4, and the test load is γtest = 1.60.
If the resistance of the actual structure is unknown, there is a substantial risk that the structure fails in the test loading. However, the test loading would be a feasible option as an alternative to demolition, restoration work or loading restrictions.
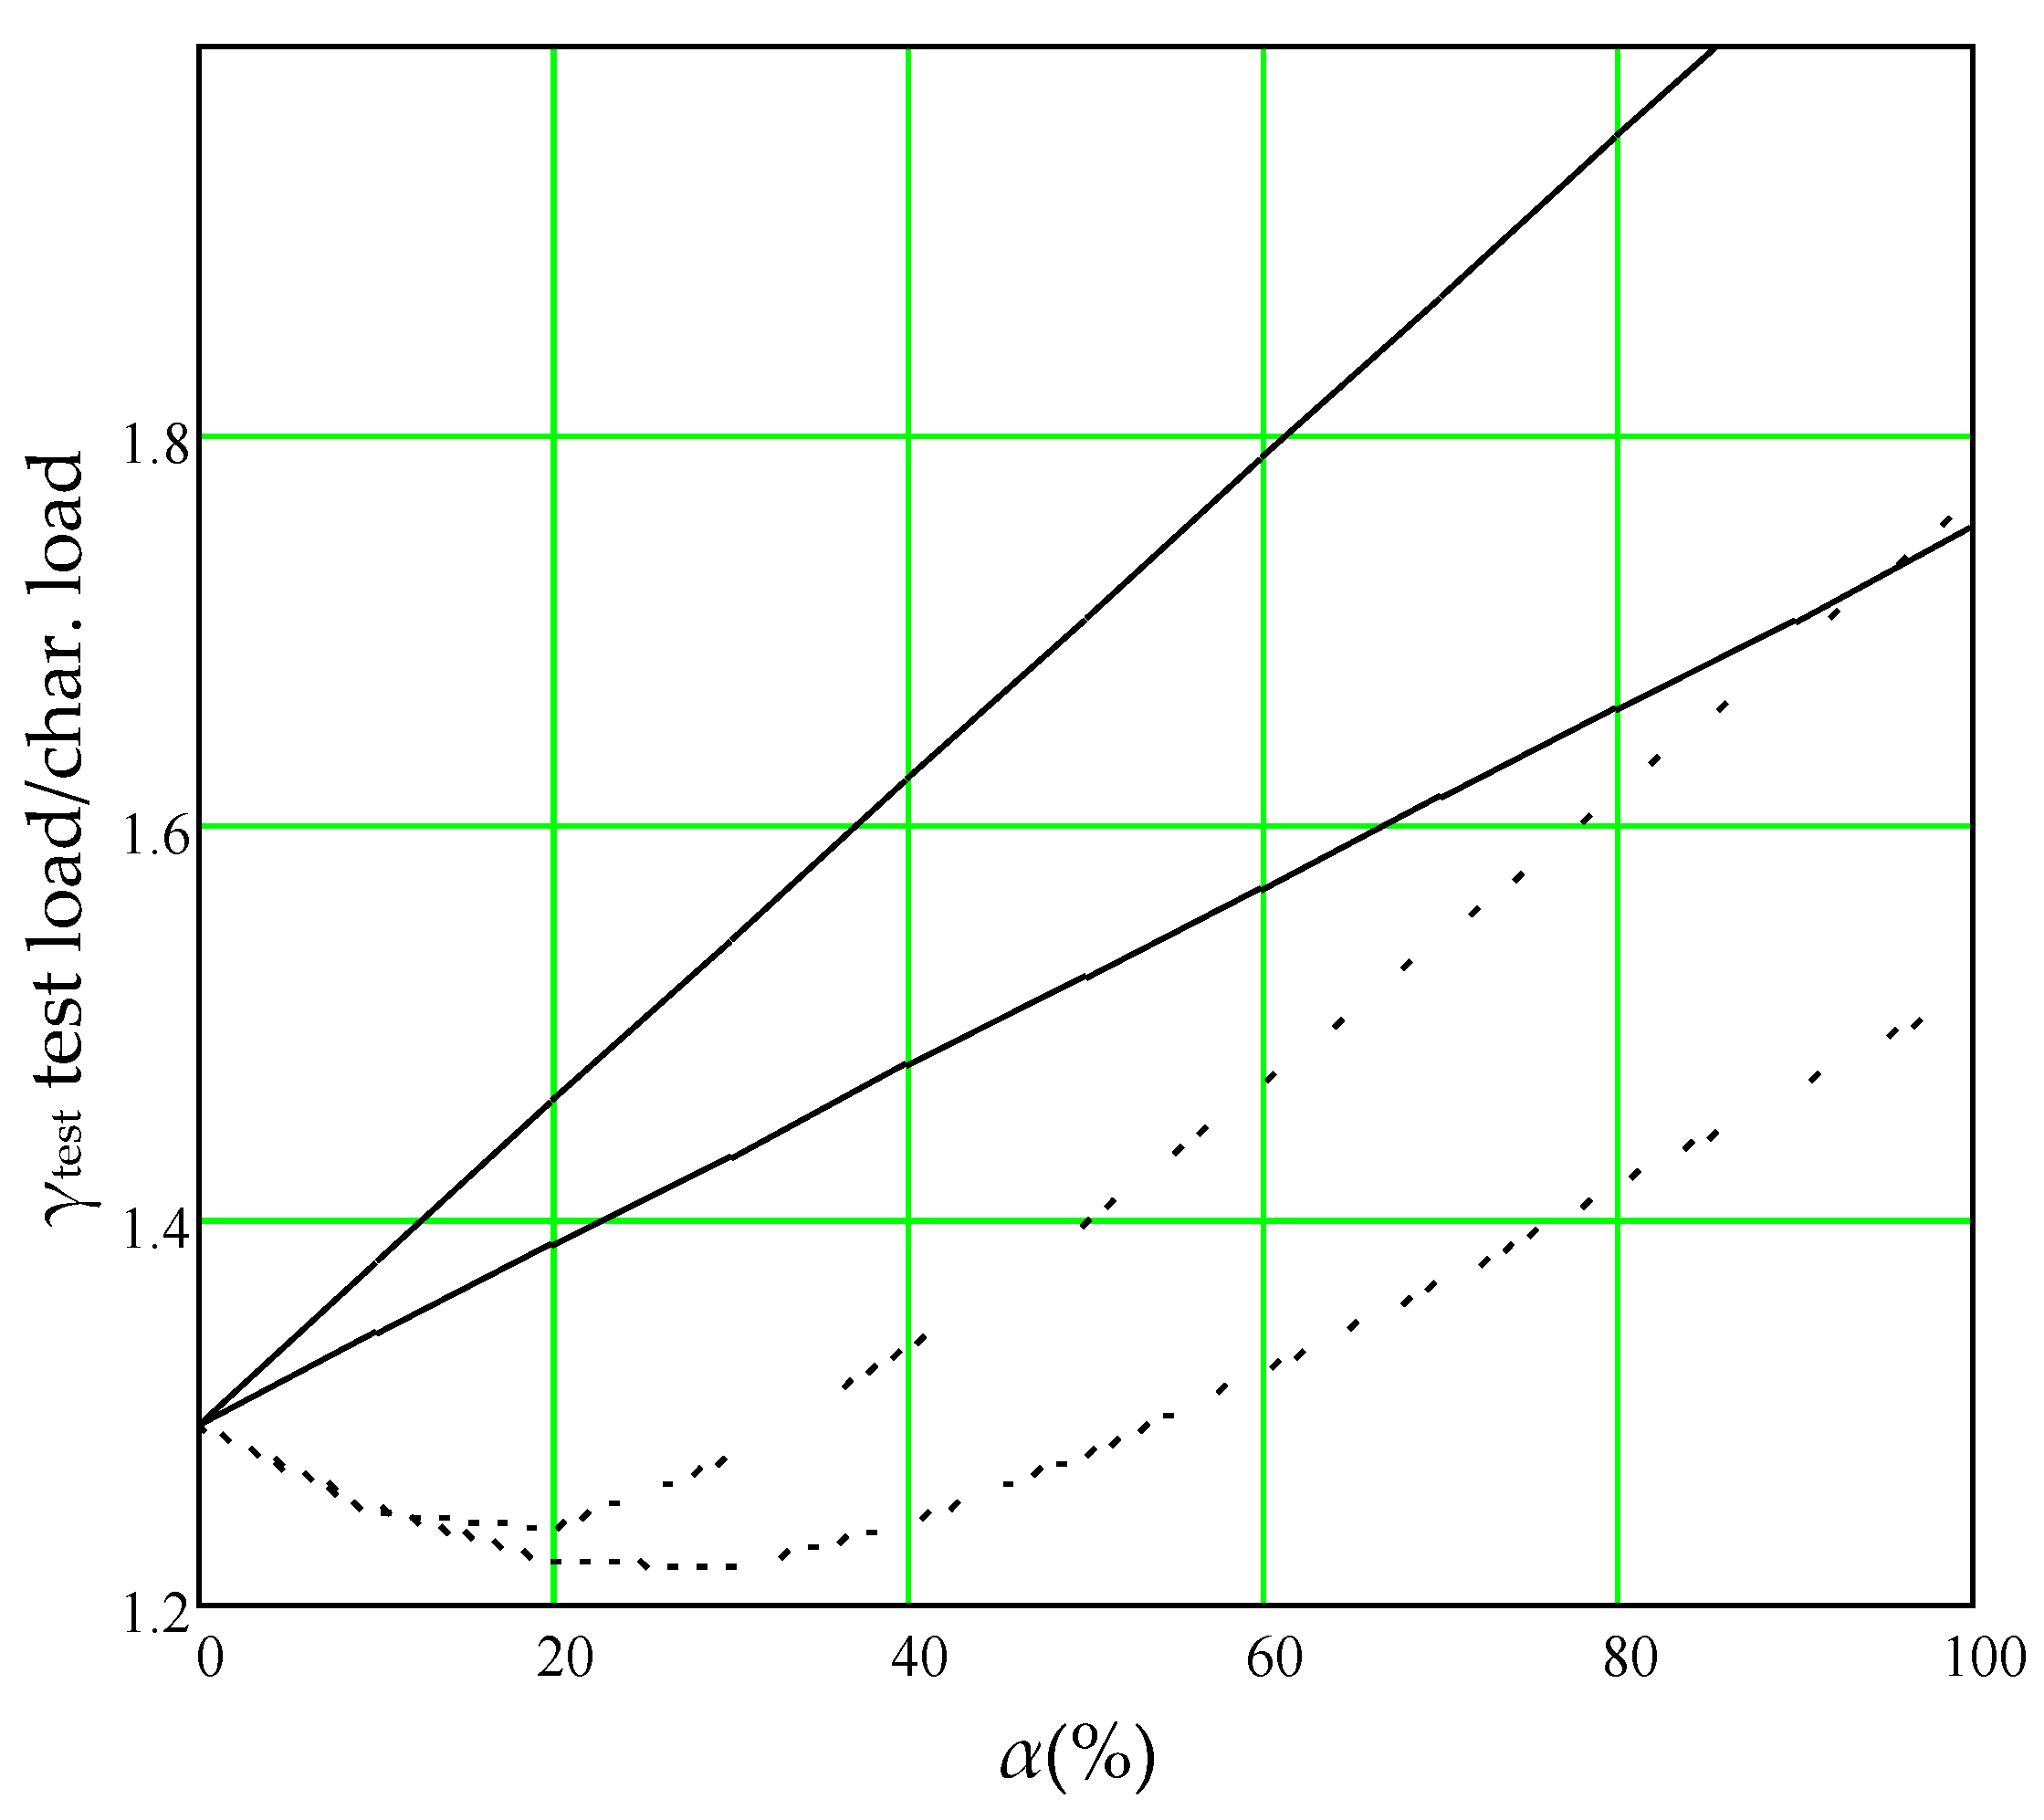
In Figure 8, the test loads γtest are given as the function of the load proportion α, assuming that the reliability is obtained from the loading only; i.e., the resistance of the material is entirely unknown and has no resistance beyond the test load. The solid line applies to the dependent load combination, β50 = 3.2. The dotted curves denote the corresponding independent load combination. The upper lines refer to VQ = 0.4 and the lower ones to VQ = 0.2, respectively.
In Figure 8, the required test loads are considerably higher than the one given in Figure 7, the reason being that the resistance includes no reliability. Due to the risk of failure, lower test loads can be applied by an expert evaluation in special cases: The test load can be set for a lower load than needed for the remaining service time. For example, the snow load is set to a fixed value. If the actual load exceeds this value, the excess load is removed. The authors used this method in the sports hall of the city of Lappeenranta. Alternatively, an evaluation is made about the resistance of the structure, and an estimate for the minimum resistance is estimated and the test loading is conducted for the minimum resistance or for an estimated resistance distribution. For example, if one can assume that the resistance corresponds to VM = 0.2 and the 5% resistance matches the characteristic values, the needed test load is obtained from Equation (13).
5.2.6. Checking
Two checks are given next to insure the validity of the equations above:
The test load γtest for the permanent load VG = 0.0915, μM = 1.9, VQ = 0.2, β50 = 3.2 is γtest = 0.92. We assume that the load has a coefficient of variability VG = 0; i.e., the occurrence probability is 0 when the load is less than unity and otherwise it is 1. Then, the material above unity has the failure probability 1/85,000, i.e., the material alone has lower reliability than needed. If the distribution is moved; i.e., if the distribution is multiplied by 0.859, the failure probability is the required one; i.e., 1/1500 at unity. As the actual distribution is less severe, the value 0.92 is truthful.
The test load γtest for the permanent load VG = 0.0915, β50 = 3.2 and unknown resistance is γtest = 1.294; that is, the load distribution must be divided by 1.294. When doing so, the failure probability is 1/1500, which is the target probability at unity.
6. Limitations
Test loading is currently seldom applied for several reasons:
- Comprehensive instructions for test loading are lacking in the current codes.
- Test loading is an excess cost in comparison with the normal construction.
- Test loading constitutes an excess procedure requiring special apparatus and knowledge.
- The structure might fail in the test loading, which might cause a significant economic loss. On the other hand, if the structure fails in the actual use, the economic loss is normally much higher.
- Test loading is normally feasible in structures that have only one critical load case. Virtually all horizontal structures have one critical load case; namely, all simultaneous vertical loads, and these structures are normally suitable for test loading.
- Test loading may cause harmful effects in the structure. For example, in a concrete structure, cracks may occur even at a low overloading. On the other hand, most structures, such as timber and metal structures, resist minor overloads well.
7. Discussion
It is common that the permanent and the variable load are assumed to be independent, and therefore the independent combination is often used. Both methods reach the same result for the permanent load [19], but the dependent load combination results in about 20% higher safety factors for the variable loads. The dependent load combination is safer and therefore was applied here.
An important test loading application is the reliability assurance of a glued timber trussed joist. If the mean resistance is 1.9 times the characteristic load and the coefficient of resistance variation is 15%, the test loading for a floor joist is 1.27 times the characteristic load for the permanent load and 1.50 times for the variable load VQ = 0.2; the combination values are obtained from a linear interpolation.
8. Conclusions
Test loading was found to be advantageous in many ways, including the following aspects. First, a test loaded structure never fails due to lack of strength; i.e., if it fails, it does so on the overloading only. Second, the eventual failure is likely to give a pre-warning, and third, the test loaded structure does not have uncertainties associated with codes, design and execution. Consequently, test loading reliability calculations can be made for a lower target reliability. In the authors’ opinion, the overall reliability of the Eurocodes corresponds to approximately β50 = 3.2, and the test loading values may be set for a lower reliability. However, the test load values given in this article are based on β50 = 3.2, and are therefore safe in the authors’ opinion.
Author Contributions
Conceptualization, T.P.; methodology, T.P.; software, T.P.; validation, T.P., S.P.; formal analysis, T.P.; investigation, T.P.; data curation, T.P.; writing—original draft preparation, T.P., J.M.; writing—review and editing, T.P., J.M.; visualization, T.P.; project administration, T.P. All authors have read and agreed to the published version of the manuscript.
Funding
This research was supported by Academy of Finland Centre of Excellence in Inverse Modelling and Imaging 2018-2025 (Decision 336792).
Institutional Review Board Statement
Not applicable.
Informed Consent Statement
Not applicable.
Data Availability Statement
Data are contained within this article and the results can be reproduced by the equations given.
Acknowledgments
Keijo Ruohonen, at the Tampere University, collaborated in the mathematical formulation of this paper.
Conflicts of Interest
The authors declare no conflict of interest.
References
- CEN. Draft prEN 1990:2020 Eurocode—Basis of Structural Design; CEN: Brussels, Belgium, 2020. [Google Scholar]
- CEN. Eurocode 7—Geotechnical Design. Part 1: General Rules; CEN: Brussels, Belgium, 2014. [Google Scholar]
- CEN. EN 1537 Execution of Special Geotechnical Works—Ground Anchors; CEN: Brussels, Belgium, 2013. [Google Scholar]
- James Jones & Sons Ltd has Launched World Leading I-Joist Production Line. Available online: https://vimeo.com/391954916 (accessed on 26 March 2021).
- Open Joist Triforce Built by Barrette. Available online: https://www.youtube.com/watch?v=K5WlA2sqF1U (accessed on 26 March 2021).
- CEN. EN ISO 22477-5 Geotechnical Investigation and Testing-Testing of Geotechnical Structures—Part 5: Testing of Grouted Anchors; CEN: Brussels, Belgium, 2018. [Google Scholar]
- Ferry Borges, J.; Castanheta, M. Structural Safety; Laboratorio Nacional de Engenharia Civil: Lisbon, Portugal, 1971. [Google Scholar]
- International Organization for Standardization. ISO 8930 General Principles of Reliability of Structures; International Organization for Standardization: Geneva, Switzerland, 1987. [Google Scholar]
- International Organization for Standardization. ISO 2394, General Principles of Reliability of Structures, List of Equivalent Terms; International Organization for Standardization: Geneva, Switzerland, 2015. [Google Scholar]
- Joint Committee on Structural Safety, Reliability Based Code Calibration. Available online: http://www.jcss.byg.dtu.dk/codecal (accessed on 26 March 2021).
- Diamantidis, D. Probabilistic Assessment of Existing Structures; RILEM Publications: Cachan, France, 2001. [Google Scholar]
- Gulvanessian, H.; Calgaro, J.-A.; Holicky, M. Designer’s Guide to EN 1990, EUROCODE: Basis of Structural Design; Thomas Telford Publishing: London, UK, 2002. [Google Scholar]
- Gulvanessian, H.; Holicky, M. Eurocodes: Using reliability analysis to combine action effects. Proc. Inst. Civ. Eng. Struct. Build. 2005, 158, 243–252. [Google Scholar] [CrossRef] [Green Version]
- JRC. Implementation of Eurocodes, Handbook 2, Reliability Backgrounds; JRC: Prague, Czech Republic, 2005; Available online: https://eurocodes.jrc.ec.europa.eu/showpublication.php?id=63 (accessed on 26 March 2021).
- Sykora, M.; Holicky, M.; Markova, J. Verification of existing reinforcement concrete bridges using the semi-probabilistic approach. Eng. Struct. 2013, 56, 1419–1426. [Google Scholar] [CrossRef]
- Luechinger, P.; Fischer, J. New European Technical Rules for the Assessment and Retrofitting of Existing Structures. Eur. Comm. 2015. [Google Scholar] [CrossRef]
- Ranta-Maunus, A.; Fonselius, M.; Kurkela, J.; Toratti, T. Reliability Analysis of Timber Structures, VTT Research Notes 2109, Espoo. 2001. Available online: https://www.vtt.fi/inf/pdf/tiedotteet/2001/T2109.pdf (accessed on 26 March 2021).
- Poutanen, T. Calculation of partial safety factors. In Applications of Statistics and Probability in Civil Engineering; Faber, M.H., Köhler, J., Nishijima, K., Eds.; Taylor & Francis Group: London, UK, 2011. [Google Scholar]
- Poutanen, T.; Länsivaara, T.; Pursiainen, S.; Mäkinen, J.; Asp, O. Calculation of Safety Factors of the Eurocodes. Appl. Sci. 2021, 11, 208. Available online: https://www.mdpi.com/2076-3417/11/1/208 (accessed on 19 February 2020). [CrossRef]
- Poutanen, T.; Pursiainen, S.; Mäkinen, J.; Länsivaara, T. Combination of Permanent and Variable Loads, Rakenteiden Mekaniikka. J. Struct. Mech. 2018, 51, 1–9. Available online: https://rakenteidenmekaniikka.journal.fi/issue/view/4901 (accessed on 26 March 2021).
- Fruhwald, E.; Serrano, E.; Toratti, T.; Emilsson, A.; Thelandersson, S. Design of Safe Timber Structures—How Can we Learn from Structural Failure in Concrete, Steel and Timber? Division of Structural Engineering, Lund University: Lund, Sweden, 2007. [Google Scholar]
- CEN. EN 1995-1-1:2004, Eurocode 5. Design of Timber Structures; CEN: Brussels, Belgium, 2004. [Google Scholar]
Figure 1.
Principle of the roof of the Lappeenranta sports hall: tension rods with pitched glue lam beams loaded by 10-point loads.
Figure 1.
Principle of the roof of the Lappeenranta sports hall: tension rods with pitched glue lam beams loaded by 10-point loads.

Figure 2.
View of the test loading, with weights on the floor lifted up.

Figure 3.
The load factor γL and the test load γtest as a function of the load ratio α; i.e., a 15% lower factor than used in the Eurocodes. The left and right graphs apply to (e.g., snow), and (e.g., live load), respectively. Solid lines correspond to Equation (1), and dashed lines to Equation (2).

Figure 4.
Material safety factors γM as a function of the load ratio α (β50 = 3.83, VQ = 0.4). The solid lines denote the dependent load combination; the dashed lines apply to the independent load combination; the dotted lines mean the dependent load combination and VQ = 0.2. The upper lines denote VM = 0.2 and lower ones VM = 0.15, correspondingly.

Figure 5.
Mean material resistances μM required for no test loading. Solid line: VQ = 0.2, VM = 0.1; dashed line: VQ = 0.2, VM = 0.15; dash-dotted line VQ = 0.2, VM = 0.2; dotted lines: VQ = 0.4.
Figure 5.
Mean material resistances μM required for no test loading. Solid line: VQ = 0.2, VM = 0.1; dashed line: VQ = 0.2, VM = 0.15; dash-dotted line VQ = 0.2, VM = 0.2; dotted lines: VQ = 0.4.

Figure 6.
Illustration of the permanent load and resistance distributions of material with VM = 0.15, μM = 1.5. The dashed lines apply the permanent load distributions; the solid lines relate the resistance distributions; the dotted curve denotes distributions where the loads below 1.071 are removed by test loading. The dash-dotted lines denote the ultimate resistance distributions where test loading is not needed for β50 = 3.2.

Figure 7.
Test-loads γtest needed for β50 = 3.2, μM = 1.9. In the left and right graph, VM = 0.15 and VM = 0.20, respectively; the solid lines correspond to the dependent load combination and dashed lines to the independent one; the upper lines depict the case VQ = 0.4 and lower lines VQ = 0.2, respectively.

Figure 8.
Test loads γtest needed for a structure with unknown resistance β50 = 3.2. The solid lines apply to the dependent load combination, and the dotted lines to the independent combination, correspondingly; and the upper lines refer to VQ = 0.4 and lower ones to VQ = 0.2, respectively.
Figure 8.
Test loads γtest needed for a structure with unknown resistance β50 = 3.2. The solid lines apply to the dependent load combination, and the dotted lines to the independent combination, correspondingly; and the upper lines refer to VQ = 0.4 and lower ones to VQ = 0.2, respectively.


Table 1.
Modification factor Kmod for solid wood in service class 2 (normal dry climate) according to the timber Eurocodes [22].
Table 1.
Modification factor Kmod for solid wood in service class 2 (normal dry climate) according to the timber Eurocodes [22].
| Load-Duration Class | Examples of Loading | Duration | |
|---|---|---|---|
| Permanent | self-weight | >10 years | 0.6 |
| Long-term | storage | 6–10 months | 0.7 |
| Medium-term | imposed load, snow | 1 week–6 months | 0.8 |
| Short-term | snow, wind | <week | 0.9 |
| Instantaneous | wind, accidental load | 1.1 |
Table 2.
Parameters of the material properties.
| VM | μM | σM |
|---|---|---|
| 0.10 | 1.184 | 0.184 |
| 0.15 | 1.292 | 0.194 |
| 0.20 | 1.412 | 0.282 |
Table 3.
Material safety factors for single loads for , and .
| 0.10 | 1.031 | 1.281 | 1.509 | 1.073 | 1.231 |
| 0.15 | 1.114 | 1.268 | 1.512 | 1.080 | 1.253 |
| 0.20 | 1.218 | 1.285 | 1.554 | 1.116 | 1.311 |
Publisher’s Note: MDPI stays neutral with regard to jurisdictional claims in published maps and institutional affiliations. |
© 2021 by the authors. Licensee MDPI, Basel, Switzerland. This article is an open access article distributed under the terms and conditions of the Creative Commons Attribution (CC BY) license (https://creativecommons.org/licenses/by/4.0/).
Share and Cite
MDPI and ACS Style
Poutanen, T.; Pursiainen, S.; Mäkinen, J. Test Loading of Structures with a Suspect Resistance. Appl. Sci. 2021, 11, 3424. https://doi.org/10.3390/app11083424
AMA Style
Poutanen T, Pursiainen S, Mäkinen J. Test Loading of Structures with a Suspect Resistance. Applied Sciences. 2021; 11(8):3424. https://doi.org/10.3390/app11083424
Chicago/Turabian StylePoutanen, Tuomo, Sampsa Pursiainen, and Jari Mäkinen. 2021. "Test Loading of Structures with a Suspect Resistance" Applied Sciences 11, no. 8: 3424. https://doi.org/10.3390/app11083424
Note that from the first issue of 2016, this journal uses article numbers instead of page numbers. See further details here.