
Fuzzy Set Qualitative Comparative Analysis of Factors Influencing the Use of Cryptocurrencies in Spanish Households


1
Department of Management and Marketing, Complutense University of Madrid, 28040 Madrid, Spain
2
Social and Business Research Laboratory, University Rovira i Virgili, 43002 Tarragona, Spain
3
Economics and Business Department, University of La Rioja, 26006 Logroño, Spain
*
Author to whom correspondence should be addressed.
Mathematics 2021, 9(4), 324; https://doi.org/10.3390/math9040324
Submission received: 20 January 2021
/
Revised: 1 February 2021
/
Accepted: 3 February 2021
/
Published: 6 February 2021
(This article belongs to the Special Issue Fuzzy Sets in Business Management, Finance, and Economics)
Abstract
:This paper assesses the variables influencing the expansion of cryptocurrency (crypto for short) use in households. To carry on the study we apply a consumer-behavior focus and so-called fuzzy set Qualitative Comparative Analysis (fsQCA). In a previous research, that was grounded on Unified Theory of Acceptance and Use of Technology (UTAUT) and Partial Least Squares (PLS), we found that main factors to explain the intention to use of cryptos by individuals were performance expectancy (in fact, it was the main factor), effort expectancy and facilitating conditions. We did not found evidences about the relevance of social influence, perceived risk and financial literacy. This study revisits these results by applying fsQCA instead PLS. Empirical research on factors influencing cryto use is relatively scarce due to the novelty of blockchain techs, so the present paper expands the literature on this topic by using an original analytical tool in this context. The main contribution of this paper consists in showing empirically that fsQCA provides a complementary and enriching perspective to interpret data about the use of cryptos. We obtain again that the most relevant factor to explain the intention of using cryptocurrencies is perceived expectancy and that also effort expectancy and facilitation conditions are relevant. But also fsQCA has allowed us discovering that despite social influence, perceived risk and financial literacy were not significant in the PLS model, they impact on the intention to use cryptocurrencies when are combined with other factors. Social influence acts as an “enable factor” for the rest of explanatory variables and it is linked positively with intention to use cryptos. Also financial literacy is relevant because its lack is a sufficient condition for the non-acceptance of that blockchain tech. Likewise we have checked that perceived risk influences the intention of using cryptos. However, this influence may be positive or negative depending of the circumstances.
1. Introduction
The origin of blockchain tech and cryptocurrencies (cryptos for short) dates back to 2008. That year, Satoshi Nakamoto posted a paper to a cryptography forum entitled “Bitcoin: A Peer-to-Peer Electronic Cash System” [1]. That post described a decentralized peer-to-peer monetary system, whose motivation was that “a purely peer-to-peer version of electronic cash would allow online payments to be sent directly from one party to another without going through a financial institution” [1]. Thus, in 2009 the first cryptocurrency, so-called bitcoin, was created. Cryptocurrencies are digital currencies based on blockchain technology, which employ cryptographic techniques. They are also non-fiat digital currencies i.e., digital currencies that are not linked to any underlying asset, have no intrinsic value, and do not suppose a liability from any economic agent [2].
Glasser et al. [3] differentiate the following uses of cryptos: as a speculative digital asset and as a currency. They conclude that the use of cryptos is biased to speculation. So, [4] estimates that above 50% of crypto platforms users have utilized them only in speculative trades. On the other hand, about 46% of cryptocurrency platforms users have employed cryptos as a transactional medium at least once in a year.
Following the statistics by CoinmarketCap [5], the capitalization of crypto markets has grown approximately 100 times from last week of April 2013 (US $1.37 billions) to last week of 2020 (US $140 billions). In both dates bitcoin was the most capitalized cryptocurrency but whereas 4th week of April 2013 that value was US $1.3 billion and concentrated above 94% of whole market, capitalization in last week of 2020 grew to US $488 billion, but supposed slightly less than 50% of overall market. The magnitude of growth rate is still more impressive for the 10th currency. On April 2013 that currency was Mincoin with a capitalization value US $118.657. In last week of December 2020 this place was occupied by Polkadlot (US $4.6 billions). That is to say, the value of Polkadlot at the end of 2020 is 3.5 times overall cryptocurrency market on 2013 April. Likewise, the number of actually negotiated cryptos in market has increased within that period from 10 last week of 2003 April to more than 2000 in last week of 2020.
A simple bibliographic search on Web of Knowledge database shows that from bitcoin creation to middle 2010, papers on this topic were scarce or null. Table 1 shows the results of the simple search “cryptos” AND several terms as e.g., “prices” in Social Sciences publications. Until 2017, research on cryptos grew slowly and likewise at year 2017 it still was scarce [6]. At 2018 there is a breakpoint in the number of published papers that reaches a maximum in 2019.
Cryptos generate many opportunities as e.g., fast, efficient, and anonymous transactions and moreover are non-intermediated. However, they also have drawbacks, such as their risk and price volatility, clearly greater than those of a conventional currency; the great technological and financial knowledge needed for their handle and the fuzzy social perception about holding them. Taking into account these considerations, this paper assesses factors that influence the acceptance of cryptos by households from the framework provided by Technology Acceptance Models (TAMs).
This research has been made with the same sample of adults from Spain as Arias-Oliva et al. [7]. Literature on the application of TAMs on this topic is not so widespread and, due to the reasons above, all very recent. Let us point out apart from [7,8,9,10,11,12,13,14,15,16,17,18,19,20,21,22]. Despite all reviewed literature is based in the use of TAMs, the final configuration of hypothesis to test and the use/user of cryptos under consideration have different nuances. They may come from how TAM is applied but also due to the use of cryptocurrency tested: a generic intention to use by individuals [7,8,9,10,11,12,13,14,15,16,17,18,19,20]; as a payment method in commercial transactions [14,15,16,17,18,19,20,21] or as a purely way of investment [19]. This paper uses the configuration of hypotheses in [7] and also tests the intention to use by households, i.e., their motivation may be either as payment method or as an investment asset.
With the exception of [19], all reviewed papers on the acceptance of cryptos use Partial Least Squares (PLS) to test the influence of factors. This paper supposes a novelty in this context since uses fuzzy set Qualitative Comparative Analysis (fsQCA) developed by Ragin in [23,24] to extend the results that we reached by using PLS in [7]. This methodology is very used in sociological studies, but also there is a great deal of applications in management and marketing (see [25] for an extended survey). As far as similar questions to ours are concerned, fsQCA has been applied instead PLS in the assessment of new technologies acceptance [26,27] and also as a complementary method to PLS in management issues [28,29]. The use of fsQCA provides a complementary approach to correlational methods to deal with causality. Conventional regression is variable-oriented, i.e., it is focused in fitting the mean effect of every variable on the output. On the other hand fsQCA is case-oriented. It is based on measuring the membership degree of each case in the set of attributes and the outcome set [23,28]. Thus, with fsQCA we cannot quantify with a coefficient the influence of a given variable over the output but we can discover how input variables are combined to produce or not produce an output [26].
The rest of the paper is structured as follows. In the second section we built up our hypotheses over the basis of existing literature. Subsequently we present our materials and methods. Fourth section describes results from analytical tools. We finally outline conclusions and future research lines.
2. A Model to Explain the Acceptance of Cryptocurrencies by Households
The model and hypothesis that we propose to explain the variables influencing crypto acceptance are those we used in [7]. So, our theoretical ground is the Unified Theory of Acceptance and Use of Technology (UTAUT) [30] and its extension UTAUT2 [31]. These models are widely accepted by academic community to explain how an emerging technology is adopted in a society. Both are based on Technology Acceptance Models [32,33], Theory of Reasoned Action [34] and Theory of Planned Behavior [35]. UTAUT models postulate a direct and positive influence of performance expectancy (PE), effort expectation (EE), social norm (SN), and facilitating conditions (FC) on the intention to use (IU) a tech. Likewise, as we do in [7] we include in our model behavioral research findings about how perception of risk and financial literacy affect the IU financial products.
Performance Expectancy (PE) is defined in [30] as the expectation of a person about the influence of using a technology on his/her performance. It is widely accepted that current electronic payment systems are slow, insecure, inefficient, uncollaborative and non-global [36]. So, crypto use has potential to solve these drawbacks [37]. From the emerging of bitcoin, business sphere has integrated progressively cryptos into their activities. The first purchase with bitcoins was done in 2010 to buy two pizzas [38]. Nowadays it is possible to use bitcoins in some 18,500 businesses around the world [39].
Bitcoin is only one of more than 8000 cryptos on the market. That number does not include all cryptos, just those quoted on the market to be traded. The volatility of cryptos opens enormous psychological thresholds in prices [40]. That variety of currencies allows crypto portfolios accessing to wide risk-return configurations. Likewise, as it pointed out by Liu and Tsyvisnsky [41] factors influencing the price of cryptos are different to those linked to the price of conventional financial assets and so, their returns are uncorrelated with those from stock and bonds. For example, cryptos are not influenced by economic cycles. Therefore, they are very suitable to implement so-called alternative portfolio management strategies or as shelter investment in recession periods. Moreover, the anonymity provided by the use of cryptos allows public to keep the confidentiality of their savings and movement of funds. The other side of their usefulness is that they make easier criminal acts as e.g., tax evasion, money laundering or contraband transactions [42].
PE is possibly the variable that literature finds as the most relevant in FinTech acceptance. Some evidences in this way are [43] for the use of a payment authentication system based on biometrics; [44] in the behavioral intention to adopt plastic money; [45] on the use of financial websites; [46] for adopting online banking. In the use of m-banking [26,47,48,49,50,51] obtain similar results. Regarding specific literature on cryptos results in [7,8,9,10,11,12,14,15,18,20,21] also suggests that PE is the key factor to explain intention to use, so the following hypothesis can be stated:
Hypothesis 1 (H1).
Performance expectancy influences positively intention to use cryptos.
The second variable tested is effort expectancy (EE) that [30] define as the ease extend linked with using a given tech. In this regard [52] states that major part of interviewed people feel that blockchain is not an easy technology to use. In this way [53] outlines that making transaction with bitcoins is a great challenge for many people. In fact [54] finds that non-users of bitcoin felt incapable of using it and so, it is possibly the greater barrier to the widespread use of cryptos.
There are many evidences of the positive relation EE with the adoption of new financial technologies. Some evidences in this way are [55] for electronic ways of micro crowdfunding and also abovementioned papers [26,43,44,45,47,48,49,50,56]. Within cryptos and blockchain research we find [9,10,11,12,15,16,18,20] confirming so. We have to point out that in [20] EE may be assimilated to the construct “web quality” in this paper. In [7] we also found for this relation a positive sign but with a weak statistical significance, so the following hypothesis is proposed:
Hypothesis 2 (H2).
Effort expectancy is positively linked with the intention of using cryptos.
Social influence (SI) is the degree to which people feel that close persons think that they have to use a specific technology [30]. At this regard persons from cryptocurrency community participate in collaborative works giving help to the rest [57]. Social support generates trust and commitment and so is linked positively to the intention of using a technology [15]. Despite there are less evidences of the link between SI and IU, there are still a great number of findings in this way. Within e-banking we can remark [43,48,49,51,55,56]. Regarding cryptos let us outline that [8,10,12,14,17,18,19,20,22]. In our paper [7] we also found a positive relation but it was not significant, so the following hypothesis is tested:
Hypothesis 3 (H3).
Social influence is positively linked with the intention of using cryptos.
Facilitating conditions (FC) are the degree to which an individual considers that he/she has the necessary infrastructure to run a specific technology [30]. It is clear that operating with cryptos needs being technologically equipped and, likewise, a minimum level of computer comprehension and knowledge is required [58,59]. As far as FindTech is concerned [26,46,47,56] found a positive significant relation. Regarding cryptos and bitcoin [10,16,17,19,21] show that FC influences cryptos IU. In [7] we had also identified FC to be a determinant factor, so the following hypothesis is made:
Hypothesis 4 (H4).
Facilitating conditions are related positively with the intention of using cryptos.
Despite not being explicitly considered in UTAUT2, perceived risk (PR) is considered in many papers as a key barrier to using new techs. From a behavioral research perspective, Faqih in [60] defines PR as consumers’ belief about the degree of uncertainty and non-desired consequences due to putting to work a product. It has been considered a key variable of consumers’ purchase intention [61,62], as well as a predictor of technology adoption [63]. Likewise, standard financial economics state that the risk of an asset is a key variable to make a financial decision. Therefore, market risk, that is, the risk of losses due to the diminution of cryptos price is clearly greater than of conventional currencies [58]. It is well-known that determinants of cryptos return are completely different from those for stocks and bonds [41,64]. Likewise, volatility, deflation and speculative bubbles are more probable in crypto market than in conventional currency market due to cryptos have no supervision from any Central Bank and their intrinsic value is null [65]. These reasons explains why an ING study on bitcoin opinion found that 29% of Europeans had intention of never investing in cryptos since they had the perception that stocks are a less risky investment tool [58]. On the other hand, cryptos are not linked with any country and so, they are not subject to country-risk. Likewise, following [4], national currency-focused fund transfer systems and B2B payment platforms are more exposed to the risk of exchange rate than cryptocurrency-focused merchant services. The reason is that the latter often also deal exchanges with cryptos in their payment activities.
Likewise, cryptos (specially the small ones) are clearly subjected to liquidity and counterparty risk. For example it is often very difficult changing cryptos with local currencies in many countries as e.g., Latin American states [4].
Undoubtedly, a big deal of risk in cryptos use is operational risk that in several papers [14,15,20] is identified as the main determinant of trustiness. Following [4], the greatest risk factor for small exchanges and second one within large exchanges context are security breaks whose consequence may be a permanent loss of funds. These problems may come from possible cyberattacks, the irreversibility of agreements or the impossibility of key recovering [15]. Likewise from large exchanges point of view the lack of regulation is also a source of risk. This question seems to be less relevant in small exchanges. In these agreements a great drawback comes from the difficulties with maintaining banking relationships. However, for large exchanges this risk seems to be under control [4]. Small trades are more distressed about fraud than large exchanges. The reason could be that they are addressed more often than large exchanges but also that fraud has a greater patrimonial impact due to their constrained budget [4].
Several studies analyze the influence of PR on the IU financial technologies [25,46,48,66]. However, in [66] it is stated that while the direct influence of PR on the IU m-banking is normally small, it supposes a key factor in pre-adoption process. In cryptocurrency context [14,15,17] consider that variable relevant to explain crypto use. Some papers [14,15,18,20,21] reveal that trustiness and perceived security, that are linked with operational risk, are relevant to decide about the use of cryptos. Thus, the following hypothesis is tested:
Hypothesis 5 (H5).
Perceived risk is related negatively with the intention of using cryptos.
The last factor tested in our paper is financial literacy (or financial knowledge), FL. Following [67] people’s financial literacy consists in the level of their knowledge about financial concepts and in the degree of confidence on their skills to apply that knowledge in real-world situations.
Financial knowledge has been proved to be influent in adopting new financial techs. Whereas [68] conclude that persons with low financial literacy are consistently less likely to trade stocks, the survey by [69] shows that a great financial knowledge implies a higher propensity to participate in financial markets and investing in shares. In [67] it is pointed out that financial knowledge is associated with more saving planning, active participation in stock markets and rational choices of financial products. On the other hand, lower financial knowledge implies poorer financial decisions as, e.g., more expensive loans. In [70] it is outlined that financial knowledge effectively impacts in financial decisions as those related to credit cards use, mortgage loans, etc. In a cryptocurrency context [13] observes that in Japan the IU cryptos as a payment method is positively and significantly linked with FL. However, we did not find in [7] that FL to be relevant in the IU. The following hypothesis is put forth:
Hypothesis 6 (H6).
Financial literacy positively influences the IU cryptos.
3. Materials and Methods
3.1. Data Collection
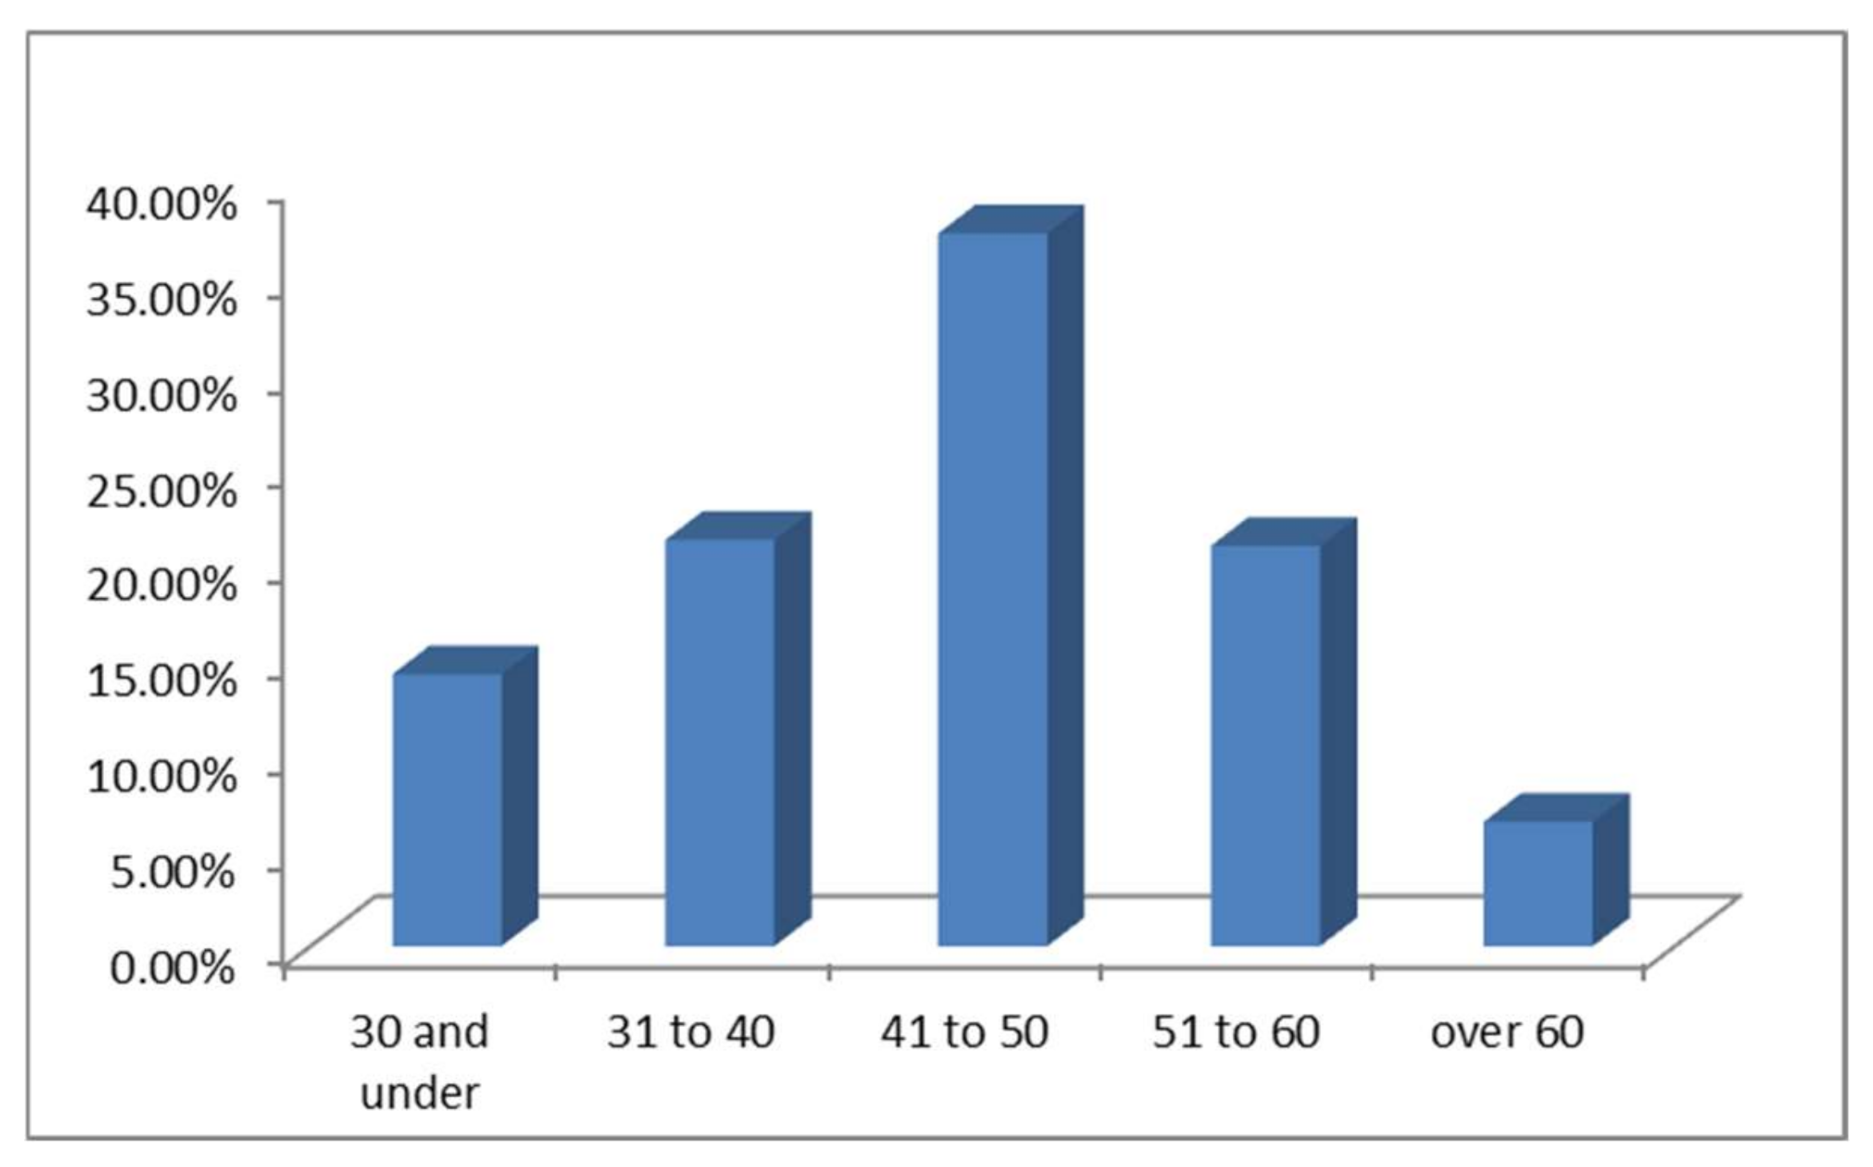
The database used in this paper is that in [7]. The sample has 402 answers from people over 20 years old from Spain, with a university degree and at least basic skills on Internet. The survey was answered between August 1 and September 10 2018. The responses are distributed between men and women as 53/47. In [7] it is outlined that this rate is due to the later incorporation in Spain of women to higher education. The composition of sample by ages is depicted in Figure 1. In [7] it is stated that this distribution is in accordance to the age configuration of Spanish population. So, as we expected, the greater proportion of answers come from people between the ages of 41 and 50. Notice that individuals under 21 years old were not included because usually they have already not obtained a university degree. Arias-Oliva et al. in [7] point out that these patterns are similar to the distribution of the Spanish population and so, the sample is adequate to represent target population.
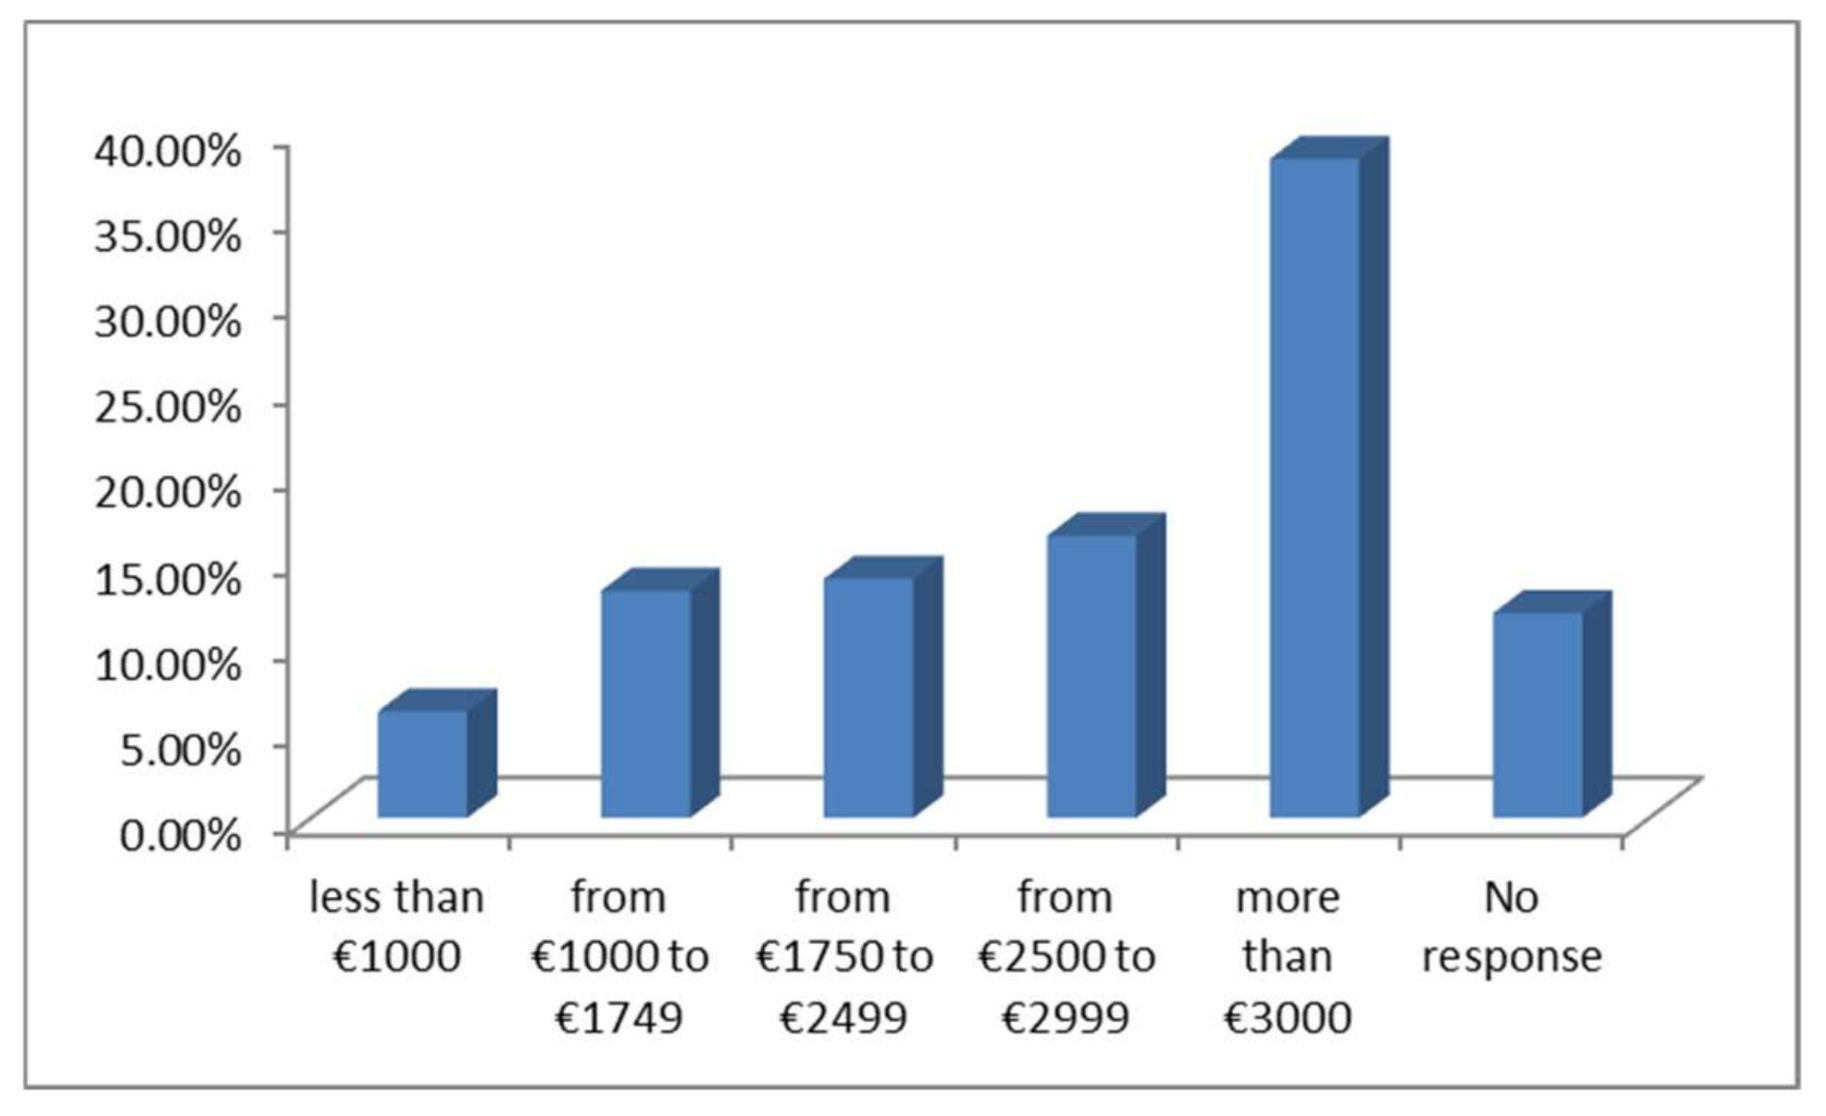
Figure 2 shows the distribution of net monthly household income. In [7] it is checked that this distribution implies a higher average income than those for whole Spanish population. However, this fact is not surprising since our survey was answered by college-educated people, who are more likely to earn higher salaries.
3.2. Measurement Scales
3.3. Quantitative Methodology
The research used the following sequential process:
Stage 1. Measurement model analysis.
To explore potential existence of dimensions in the scales we have run principal component analysis with Varimax rotation. Subsequently we have performed an assessment on reliability, convergent and discriminant validity of scales.
Stage 2. Test hypothesis H1–H6.
In [7] we used for this analysis a PLS regression. It implies calculating R2, Q2, path coefficients, and linked statistical significance degree. On the other hand, in this paper we use Qualitative Comparative Analysis (QCA) [24] and fuzzy set QCA (fsQCA) in [23] to evaluate such hypothesis.
There is a great deal of applications of fsQCA in management and marketing [25]. As far as similar fields to ours are concerned, fsQCA has been applied instead PLS in the assessment of new technologies acceptance [26,27] and also as a complementary method to PLS [28,29].
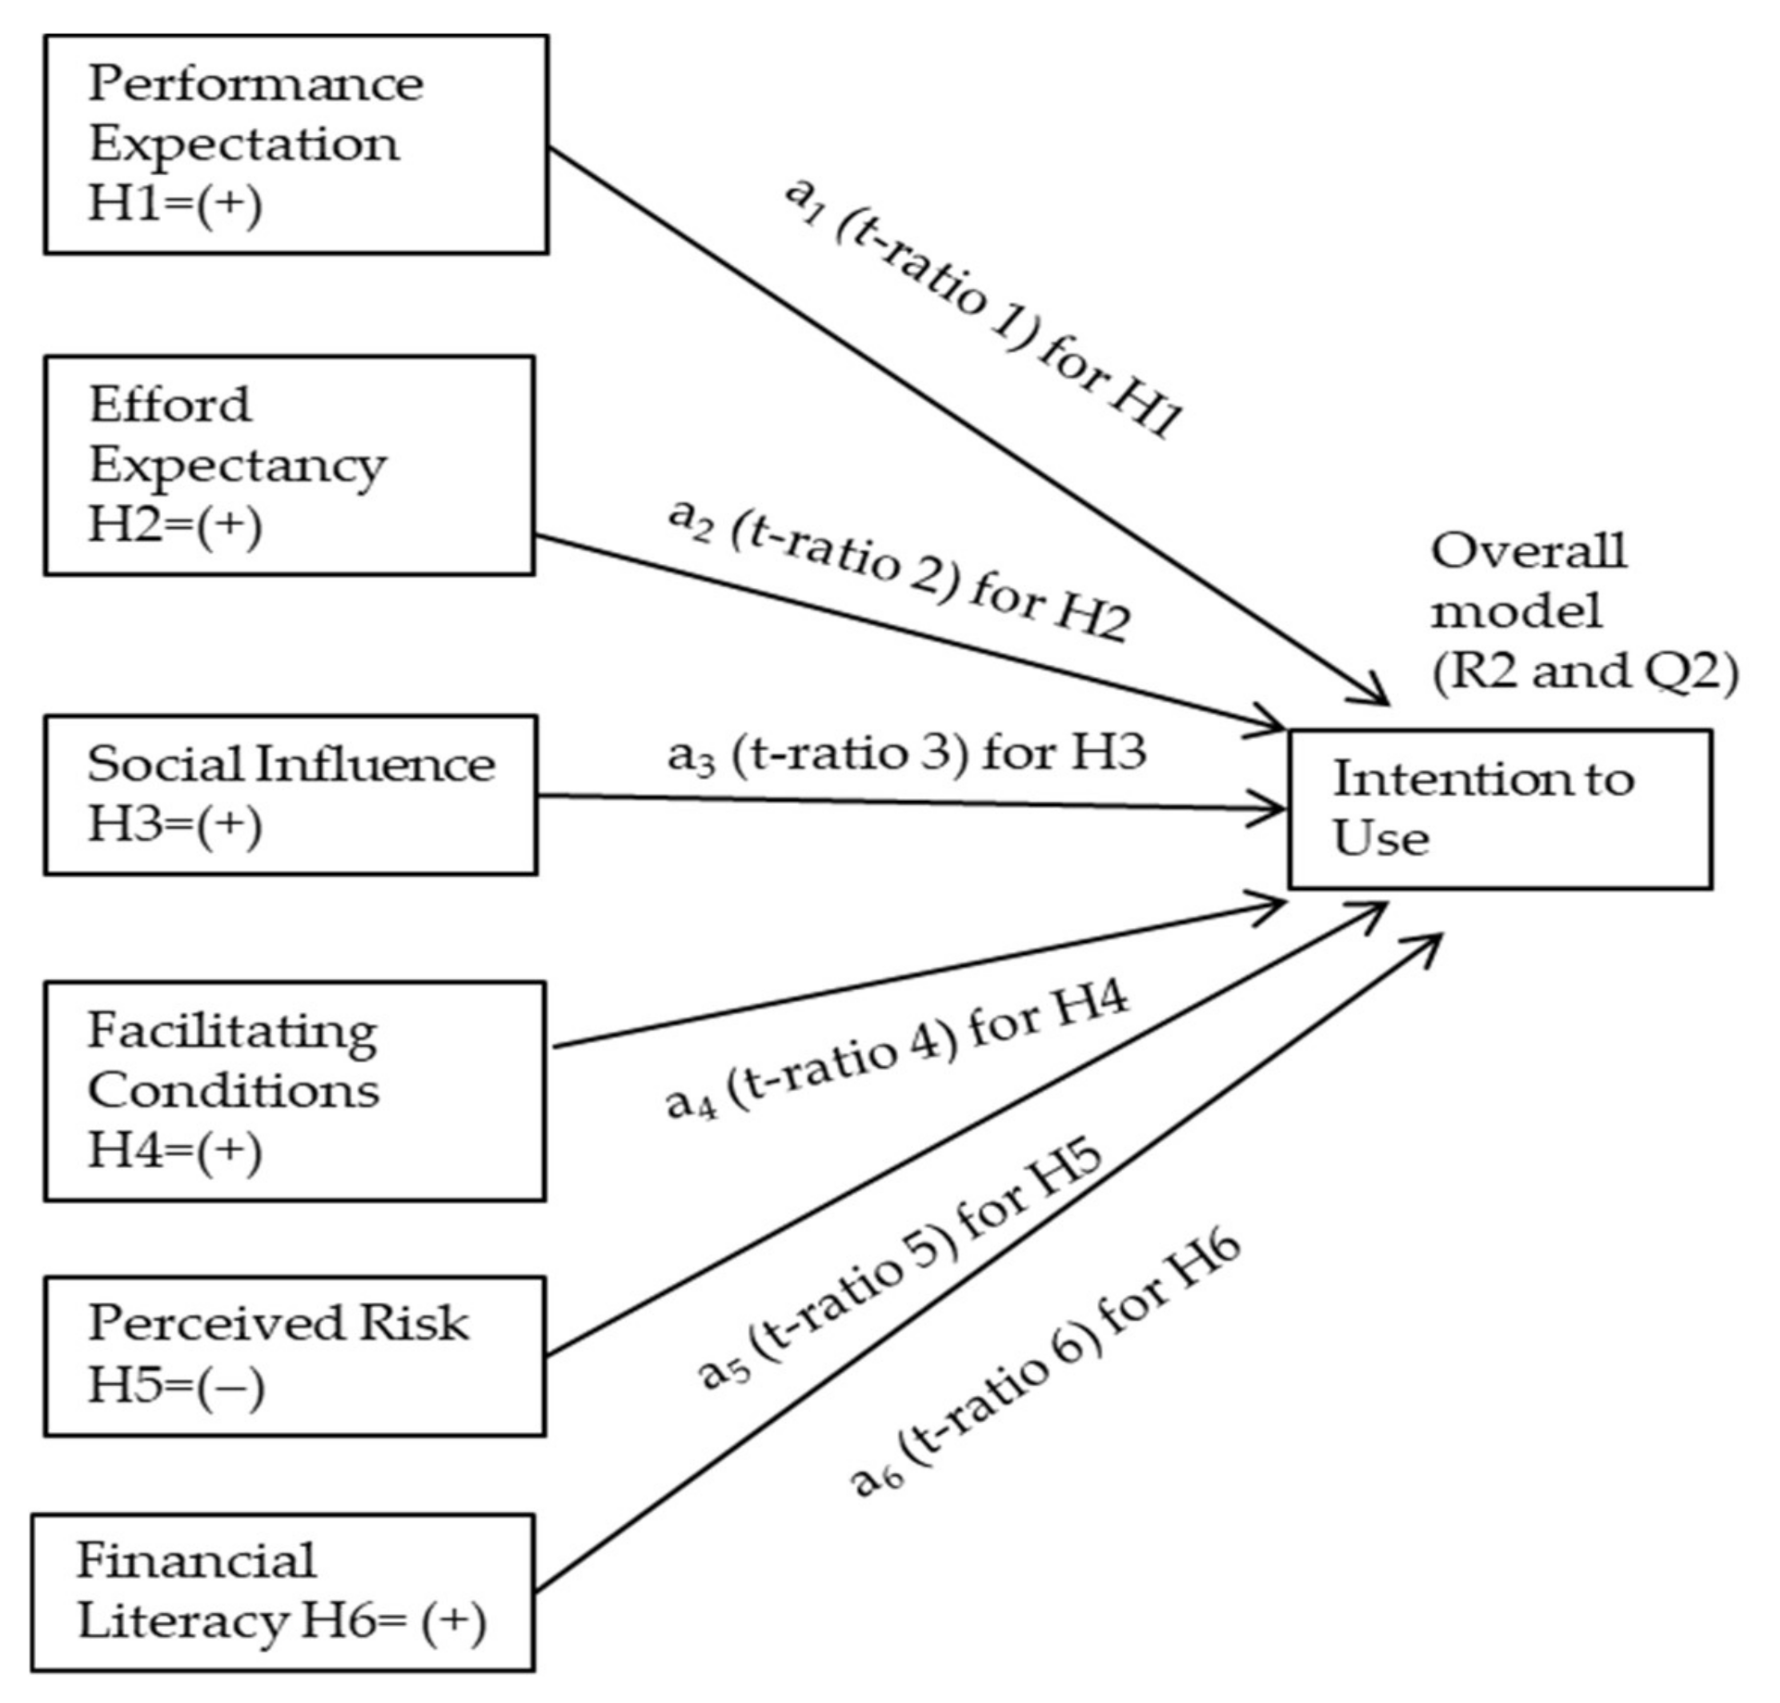
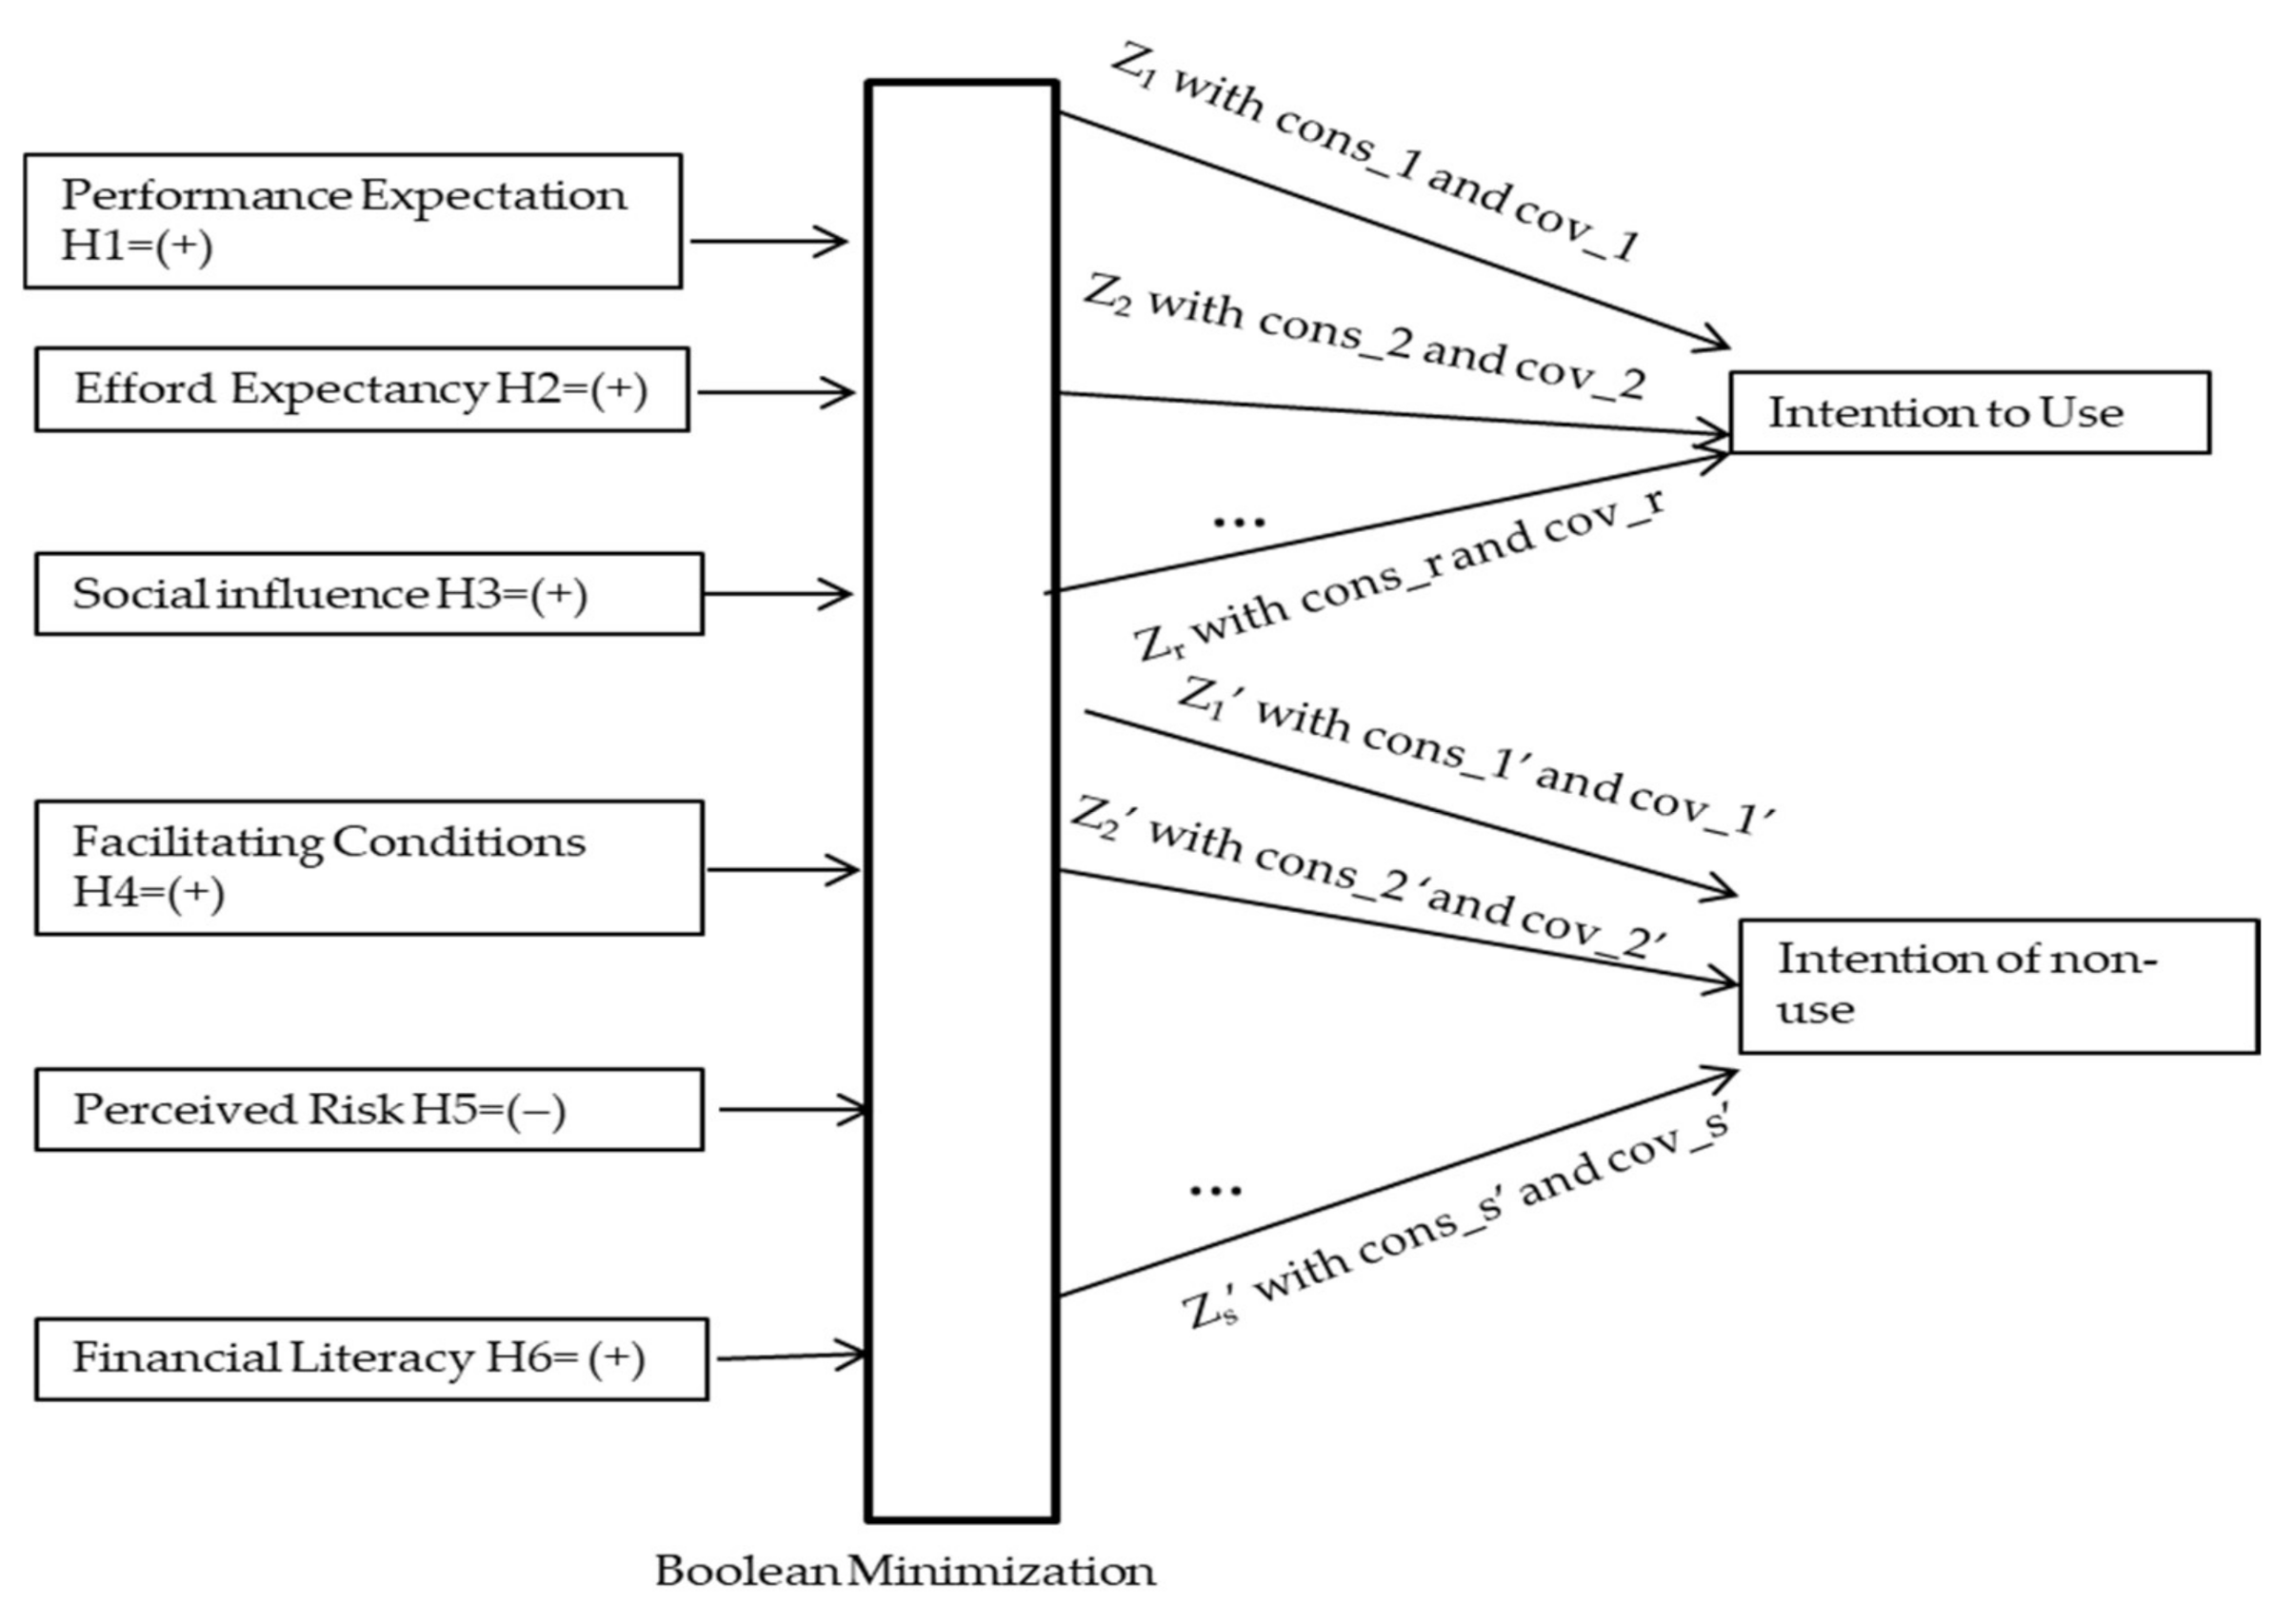
Any correlational method in general and PLS in particular assumes symmetrical relations between variables and measures the net effect of each variable on assessed output. On the other hand fsQCA allows discovering the combinatorial effects of variables over the output as well as taking into account that these interactions could be asymmetrical [28]. So, to test hypothesis in Section 2, PLS and fsQCA follow different ways. With PLS we find an average value (a coefficient) for the influence each factor on output variables and then we test its statistical relevance from its t-ratio. When applying fsQCA we find the logical implicates that combining the presence/absence of input variables suit better output results by using Boolean logic. Subsequently consistency and coverage measures inform about the relevance of discovered logical implicates and compare them with initial hypothesis. Figure 3 and Figure 4 depict a graphical comparison about how PLS and fsQCA test hypothesis under the framework exposed in Section 2.
Figure 3 represents how PLS works. Coefficients a1, a2, …, a6 quantify the sign of average influence of factors individually. Their t-ratios allow testing their particular statistical significance. To assess goodness of whole model, R2 and Q2 must be used. Figure 4 shows how fsQCA process empirical data. After a Boolean minimization, logical implicates Z1, Z2, .., Zr, Z1′, Z2′, .., Zs’ are found. They embed the presence/absence of at least one input variable. Consistency and coverage measures summarize the significance and empirical relevance of every logical implicate. To test hypothesis, the configuration of these implicates must be interpreted accordingly.
Therefore, two measures are of interest for a given logical implicate:
- Consistency (cons) of the causal combination that measures the degree in which membership in a combination of causes (recipe) is a subset of outcome set.
- Coverage (cov) that measures the proportion of the outcome explained by each recipe.
As it is usually advised by literature [26] we analyze the influence of input variables not only on the outcome (IU) but also on its negation (~IU). In our case, a facilitating condition may consist in having a powerful PC and a good internet connection. The influence of this fact in crypto use may be great, little or negligible. On the other hand, it comes fair that the negation of such condition ensures not operating with cryptos. So, if we symbolize as “~” the negation of a variable, we evaluate:
where f(·) symbolizes Boolean function. The implementation of fsQCA is done by using fsqca 3.1 software [71] and follows the following steps:
IU = f(PE, EE, CP, FC, PR, FL),
~IU = f(PE, EE, CP, FC, PR, FL),
Step 1. Find the factorial punctuation for of the jth observation (j = 1, 2, …, 402 in our sample) in ith variable (IU, PE, EE, SI, FC, PR and FL). We symbolize as fij those values.
Step 2. Built up the membership function for input variables PR EE, SI, FC, PR and FL and output variable IU by normalizing within [0,1] their standardized factorial punctuation in step 1. So, for a variable i, the membership value for the jth observation is:
The membership degree within the negated fuzzy set, ~Xi is defined then as: .
Step 3. Built up a Boolean truth table which is composed by so-called “min terms”. We state for the value of the jth observation in ith variable two unique the possible values: true ( = 1) and false ( = 0). So:
Step 4. Maintain only those min terms whose consistency to produce the output are at least a threshold ε. Ragin [71] suggests ε = 0.8.
Step 5. By applying Quine-McCluskey algorithm [72] find essential prime implicates in truth table. These implicates conform so-called Qualitative Comparative Analysis complex solution (CQA-CS). That algorithm supposes implementing the following steps:
- 5.1. Order min terms in ascending order and group them from the number of 1 in their binary representation.
- 5.2. Compare observed min terms by pairs successively. If a change in a one-bit position exists, ”erase” in the couple of those min terms the differed bit position and maintain the rest of the bits as they are.
- 5.3. Repeat second step until all prime implicates are obtained.
- 5.4. Formulate the prime implicate table. Prime implicates are placed by rows and min terms in column wise. Identify the cells corresponding to the min terms that are covered in each prime implicate.
- 5.5. Identify essential prime implicates from the observation of each column. If a min term is covered only by one prime implicate, then it is an essential prime implicate. Those implicates also belong to simplified Boolean function.
- 5.6. Simplify prime implicate table by deleting the row of each essential prime implicate and the columns linked to min terms that are covered in that essential prime implicate. Repeat step 5 for reduced prime implicate table.
- 5.7. This process is finished when all min terms are over.
Let us remark that essential prime implicates are Boolean products whose factors may be Xj or .
Step. 6. CQA-CS is usually hard to interpret and is build up with no more assumption than data. So, fsqca 3.1 also offers a parsimonious solution (QCA-PS). It is fitted from any remainder over non observed configuration of variables in order to make solution as easy as possible regardless whether it constitute an “easy” or “difficult counterfactual” case [71].
Step 7. To continue the minimization process, [23] proposes using simplifying assumptions that should be theoretically well-founded about how a given condition is causally related to the outcome. It must be supposed for non-observed configurations, if an input variable contributes to output exclusively when it is present, absent or in both cases. This step lets us obtaining so-called intermediate solution (QCA-IS).
Step 8. Let be a possible prime implicate (configuration or recipe) Z that without a loss of generality we built as:
where 1 ≤ r ≤ n, n is the number of output variables and “∗” stands for the Boolean product. So, we can obtain for the jth observation:
So, the consistency of recipe Z in producing output Y is:
where Yj stands for the value of jth observation in output variable (Intention to Use in our case). Consistency may be understood similar as a statistical measure of significance [73]. It is widely accepted that to consider Z as sufficient condition, consistency must be above 0.8.
Subsequently, the coverage of recipe Z to produce Y is:
Coverage provides a measure of empirical relevance. Its analogous statistical measure is R2. A consistency above 0.8 for a recipe (6) implies that the combination is “almost always” necessary or sufficient [23]. It can be considered that a condition is completely sufficient when cons > 0.9 y cov > 0.5 (see [74]).
Step 9. Interpret intermediate and parsimonious solutions. At this point there is no a unified rule about what solution must be interpreted. Ragin in [23] suggests using QCA-IS since it supposes a compromise between simplicity of CQA-PS and complexity of CQA-CS. As it is pointed out by Thiem in [75] empirical studies are usually done over this solution. However, also in [75] it is advised searching causal relations using exclusively QCA-PS instead intermediate solution. That paper argues that QCA-CS and QCA-IS introduces matching counterfactual data with which QCA supplements the empirical observations. These artificial data may induce inferences that violate the actual causal structure that had generated the empirical data in the first place and that QCA is meant to uncover.
4. Results
4.1. Results from Mesurement Model
The analysis of the measurement model was done in [7] and quantitative results are summarized in Table A1, Table A2 and Table A3 of annex. Table A1 shows basic descriptive statistics of our sample. Results in Table A2 show that factorial analysis detects only one dimension in all scales. Bartlett sphericity test has always a p-value (<0.0001), whereas Kaiser-Meyer-Olkin statistic, was always (≥0.5). The percentage of variance explained by the factors was in all dimensions (>70%), which confirms scales suitability. Regarding the evaluation of the measurement model, Table A2 of annex suggests that results on this concern are correct.
Constructs present a composite reliability and Cronbach’s alpha always >0.7, confirming so that reliability was correct (see Table A3 of annex). Average variance extracted (AVE) in all scales is greater than 0.5. Therefore the convergent validity criterion was thus met. The HTMT values were correct in all cases (<0.9). Likewise, the square root of the AVE was higher than the correlations between constructs, i.e., discriminant validity criterion has been also accomplished (see Table A4).
4.2. Results from Fuzzy Set Comparative Qqualitative Analysis
A previous step to develop fsQCA implies implementing so-called necessity analysis [73]. It consists in stating cons and cov in (7) and (8) between each individual input (in affirmed and negated form) and the output (also affirmed and negated). Results are in Table 3. This analysis lets stating the degree in which and individual factor that is affirmed/negated is necessary to induce the output (or the negated output).
Table 3 suggests that there is an asymmetry in the explanation of IU and ~IU. Regarding IU are “almost always necessary or sufficient” PE, EE, FC and FL. When analysing ~IU, again negated PE seems to be the main cause (cons and cov > 0.9) but also ~SI (e.g., news about bad experiences with cryptos) presents great cons and cov. Notice that SI did not present high cons to produce IU. PR (and not ~PR) has a cons > 0.8 in IU. Then, the presence of perceived risk can incentive some people to use crypto. These persons act as risk lovers, e.g., they buy cryptos as a method for betting, or as an investment with a high expected return due to its great volatility. This fact might suggest rejecting H5. However, the empirical weight of that finding (cov < 0.5) diminishes its relevance. When analyzing the influence of PR on the negation of IU, it can be checked that PR (and not ~PR) causes also ~IU (cons > 0.8, cov > 0.7). Therefore consistency and coverage of PR on ~IU outline PR as a relevant factor to reject the use of cryptos.
Table 4 shows configurations of QCA-IS and QCA-PA of model (1). To generate intermediate solution we have supposed for non-covered Boolean configurations of outputs (19 over 26 = 64 possible configurations) that PE, EE, SI, FC and FL cause IU only when they are present. It is according to our hypothesis, findings in literature described in Section 2 and with necessity analysis in Table 3. So, due the contradiction between H5 and necessity analysis of PR, we suppose that either presence or absence of PR may cause IU. Analysis of intermediate solution lets appreciating that:
- PE is within the configurations with greater cons (always > 0.9) and cov (for PE*EE and PE*PR cov > 0.7). So, it seems that perceived usefulness is the most influent factor for using cryptos.
- PE, EE, SI, FC and PL are at least in one recipe with cons > 0.8 and cov > 0.5 and in affirmed form. This fact is in accordance with postulated hypotheses. At this regard, SI seems to have great influence on IU since it appears in 4 recipes.
- PR is within the recipe EE*~PR*FL (cons > 0.8 but cov < 0.5) negated as we expected. However this is the recipe of QCA-IS with poorer cov.
- PR appears in two configurations with “+” sign: SI*PR*FL and PE*PR both with cons > 0.8 and cov > 0.5. This fact violates H5. On the other hand these recipes have a suitable interpretation from a risk lover perspective. Configuration SI*PR*FL might reveal a person with financial knowledge (FL) whose environment is devoted to risky investments (SI*PR). The recipe PE*PR might reveal individuals that may use cryptos as a bet method.
- Analysis of QCA-PS reveals similar patterns as QCA-IS.
- PE is the unique input factor that may cause IU without the coincidence of any other variable. Likewise, it presents the greater cons (>0.9) and coverage (>0.8). So, it seems that the presence of PE could cause IU without the help of any other factor.
- EE, FC and PL cause IU in configurations whose cons > 0.8 and cov > 0.5 but always when they are combined with affirmed SI. Again, SI seems to be most influent factor than EE, FC and PL.
- Perceived risk only appears in one recipe with cons > 0.8 but with the lower cov (<0.5). In this case its form (negated) is as expected in H5.
The results of fsQCA over IU = f(PE, EE, SI, FC, PR, FL) suggest the acceptance of H1, H2, H3, H4, and H6. On the other hand, the assessment of H5 must be nuanced since its rejection would not imply that PR does not influence IU. Some causal configurations suggest that PR may stimulate IU to some users when it is present and to others if it is absent.
Table 5 shows configurations of QCA-IS and QCA-PA in (2), i.e., for the explanation of ~IU. To generate intermediate solution in ~IU we have supposed for non-covered Boolean configurations that PE, EE, SI, FC and FL cause IU only when they are absent. It is congruent to that we done for intermediate solution in Table 4 and with the results from necessity analysis in Table 3. The same argument applies to justify supposing that PR can be either present or absent to cause ~IU. After checking Table 4 and Table 5 we find that the explanation of IU and ~IU by causal recipes of input factors is far to be symmetrical. So, QCA-IS for ~IU shows that:
- The absence of financial literacy (cons = 0.853 and cov = 0.696) and facilitating conditions (cons > 0.9 and cov > 0.7) are sufficient conditions by their selves for the intention of non-using cryptos.
- PE, EE and SI also take part of recipes in their negated form as we expected from H1, H2 and H3 respectively. In all those essential prime implicates cons > 0.85.
- PR is in two recipes with a contradictory sign. It appears as ~PE*PR (cons > 0.9, con > 0.8). It is, so, affirmed as we expected from H5. On the other hand, it is also negated in ~SI*~PR with a consistency close to 0.9 but with a relatively low coverage (0.365).
- Analysis of QCA-PS reveals similar patterns as QCA-IS:
- The simple negation of PE, EE, FC and FL cause the intention of non-using cryptos. This finding fits H1, H2, H4 and H6. In all cases cons > 0.85 and coverage ≥ 0.69. Now, the most influent variable seems to be the negation of PE (cons > 0.9 and cov > 0.9).
- In the recipe ~SI*~PR, social influence is negated as we postulated in H3. On the other hand, the presence of ~PR implies a violation of H5. In any case, despite in this recipe cons = 0.882, its empirical relevance is weak (cov = 0.362).
So, it seems again that, with the exception of H5, we cannot reject any hypothesis in Section 2.
5. Discussion and Conclusions
There are not so much empirical studies about variables influencing cryto acceptance because of the novelty of blockchain techs. This paper contributes to literature on cryptos and employs an original analytical tool in this context, fsQCA. We have found that complementing UTAUT modelling with fsQCA lets discover relations between variables that influence crypto use that we did not in [7] by using conventional PLS. So, whereas [7] only found relevant three variables to explain the use of cryptos, we have discovered that all factors are relevant. Likewise, with the exception of the hypothesis on PR, all other are confirmed. As in [7], PE is revealed as the most decisive variable to explain IU. EE is also a relevant variable when it is combined with SI and also its absence could be a sufficient condition for ~IU. Similar considerations can be made about FC, that was relevant in [7], but also for FL, that in [7] was not. Let us remark the importance of social influence to explain IU. Its sole presence or absence is never relevant for IU or ~IU. However it is present with the expected ”sign” in recipes that allow EE, FC, PR or FL to be relevant. So, it seems that SI acts as a facilitator factor to induce the other input variables to be relevant for IU.
Evidences do not support that the influence of PR on using cryptos is necessary negative. However this fact does not imply that it is not relevant to explain IU. Depending on the context PR may have a positive or negative influence. We find configurations with PR (i.e., its presence affects positively using cryptos) but also with ~PR (i.e., not perceiving risk also influences positively using cryptos), so the configuration in QCA-IS (SI*FC*PR) may explain behaviors of people with FL that from information by close people (SI) use cryptos consciously as a risky asset. Likewise the configuration PE*PR may explain utilizing cryptos as a bet method. On the other hand the configuration EE*~PR*FL explains the behavior of persons with financial knowledge that consider cryptos easy to manage and that, in their context, its use have low risk.
The main objective of this paper was complementing conclusions about IU cryptos in [7] by applying fsQCA instead PLS. As any regression methodology, PLS allows quantifying average influence of each factor over IU by means of a coefficient. Likewise, it supposes a symmetrical impact of the presence/absence of an input variable over the presence/absence of output. By using fsQCA we cannot quantify in a coefficient the average weight of one factor into the intention to use crypto and this fact suppose a drawback. Likewise fsQCA is quite sensitive to how membership functions are built up and also to outliers. On the other hand, fsQCA can discern how factors are combined to produce (or not produce) IU, so the application of conventional correlational techniques in [7] led us to conclude that SI was not a significant factor. However, fsQCA allow checking the important role of SI to induce IU since its presence lets EE, FC and FL to be relevant. Likewise fsQCA lets discover asymmetrical relations between variables. This fact allows us detecting that FC alone is not enough to generate IU but its sole absence influences decisively the intention of not using cryptos. Likewise, the use of fsQCA lets us stating that the non-significance of PR in [7] (i.e., the coefficient that quantify the influence of PR on IU was not significantly different from 0) does not mean that PR is irrelevant to explain IU. It may be caused by the balance of responses from people averse to risk and risk-lovers.
We are aware that this study has some limitations. These constraints are an incentive to conduct further research. This paper is focused on a concrete population segment: college-educated adults with Internet skills. Future studies should focus on other household segments but also on other economic agents (small business, transnational corporations, institutional investors …). Another constraint is that this research is circumscribed to Spain. Conclusions might be slightly different if the survey had a wider geographical extension or if it were answered in another country, so the use of an international database may allow improving the conclusions that we have extracted in this work. Other issue that could be assessed in future research is the sustainability of blockchain mining. In [76] it is stated that the mining process requires intensive computation resources with large energy consumption. Therefore sustainability factors can impact on the development of blockchain technology. It is an emerging technology that is evolving continuously. Therefore, the findings of this research should be interpreted under above considerations.
Author Contributions
M.A.-O. and J.P.-B. have collected data have built up model to validate and have validated scales. J.d.A.-S. have implemented fsqca. All authors have contributed equally to extract conclusions from data and in literature revision. All authors have read and agreed to the published version of the manuscript.
Funding
This research was funded by the COBEMADE research group at University of La Rioja (REGI 20/40) and Programa RIS3 La Rioja. CAR-PID2019-105764RB-I00.
Institutional Review Board Statement
With regard to ethics approval: (1) all participants were given detailed written information about the study and procedure; (2) no data directly or indirectly related to the subjects’ health were collected and, thus, the Declaration of Helsinki was not generally mentioned when the subjects were informed; (3) the anonymity of the collected data was ensured at all times; and (4) no permission was obtained from a board or committee ethics approval, it was not required as per applicable institutional and national guidelines and regulations (5) voluntary completion of the questionnaire was taken as consent for the data to be used in research, informed consent of the participants was implied through survey completion.
Informed Consent Statement
Informed consent was obtained from all subjects involved in the study.
Data Availability Statement
Survey supporting the study can be obtained by demanding it to any author.
Acknowledgments
Authors acknowledge helpful comments of anonymous reviewers.
Conflicts of Interest
Authors declare having no conflicts of interest.
Appendix A

Table A1.
Descriptive statistics of our questionnaire.
| Construct/Item | μ | Q2 | σ | Q1 | Q3 | Q3–Q1 |
|---|---|---|---|---|---|---|
| Intention to Use | ||||||
| I intend to use cryptocurrencies | 3.20 | 2 | 3.37 | 0 | 6 | 6 |
| I predict that I will use cryptocurrencies | 4.12 | 3 | 3.42 | 1 | 7 | 6 |
| Performance Expectancy | ||||||
| Using cryptocurrencies will increase opportunities to achieve important goals for me | 3.95 | 3 | 3.28 | 1 | 7 | 6 |
| Using cryptocurrencies will help me achieve my goals more quickly | 3.34 | 3 | 3.03 | 1 | 5 | 4 |
| Using cryptocurrencies will increase my standard of living | 3.13 | 2.5 | 2.89 | 0 | 5 | 5 |
| Effort Expectancy | 3.08 | 2 | 2.90 | 0 | 5 | 5 |
| It will be easy for me to learn how to use cryptocurrencies | 4.99 | 5 | 3.06 | 2 | 7 | 5 |
| Using cryptocurrencies will be clear and understandable for me | 5.13 | 5 | 3.00 | 3 | 7.25 | 4.25 |
| It will be easy for me to use cryptocurrencies | 3.96 | 4 | 2.86 | 2 | 6 | 4 |
| It will be easy for me to become an expert in the use of cryptocurrencies | 2.82 | 2 | 2.62 | 0 | 5 | 5 |
| Social Influence | ||||||
| The people who are important to me will think that I should use cryptocurrencies | 3.03 | 3 | 2.68 | 0 | 5 | 5 |
| he people who influence me will think that I should use cryptocurrencies | 3.04 | 3 | 2.72 | 0 | 5 | 5 |
| People whose opinions I value would like me to use cryptocurrencies | 4.91 | 5 | 3.19 | 2 | 7 | 5 |
| Facilitating Conditions | ||||||
| I have the necessary resources to use cryptocurrencies | 3.95 | 3.5 | 3.25 | 1 | 7 | 6 |
| I have the necessary knowledge to use cryptocurrencies | 5.69 | 6 | 3.00 | 4 | 8 | 4 |
| Cryptocurrencies are compatible with other technologies that I use | 5.29 | 5 | 3.09 | 3 | 8 | 5 |
| I can get help if I have difficulty using cryptocurrencies | 6.93 | 7 | 2.72 | 5 | 9 | 4 |
| Perceived Risk | ||||||
| Using cryptocurrencies is risky | 7.66 | 8 | 2.55 | 7 | 10 | 3 |
| There is too much uncertainty associated with the use of cryptocurrencies | 7.12 | 8 | 2.72 | 5 | 10 | 5 |
| Compared with other currencies/investments, cryptocurrencies are riskier | 5.07 | 5 | 2.90 | 3 | 7 | 4 |
| Financial Literacy | ||||||
| I have a good level of financial knowledge | 5.45 | 6 | 2.76 | 3 | 8 | 5 |
| I have a high capacity to deal with financial matters | 3.70 | 3 | 3.04 | 1 | 6 | 5 |
Note: μ stands for mean Q1, Q2 and Q3 for the 1st, 2nd and 3rd quartile and σ for the standard deviation.
Table A2.
Standarized loadings and t-values.
| Construct/Item | Loading (t-Value) |
|---|---|
| Intention to Use | |
| I intend to use cryptocurrencies | 0.90 (52.16) |
| I predict that I will use cryptocurrencies | 0.91 (48.22) |
| Performance Expectancy | |
| Using cryptocurrencies will increase opportunities to achieve important goals for me | 0.97 (69.60) |
| Using cryptocurrencies will help me achieve my goals more quickly | 0.93 (69.35) |
| Using cryptocurrencies will increase my standard of living | 0.92 (55.40) |
| Effort Expectancy | |
| It will be easy for me to learn how to use cryptocurrencies | 0.89 (38.66) |
| Using cryptocurrencies will be clear and understandable for me | 0.95 (58.16) |
| It will be easy for me to use cryptocurrencies | 0.94 (62.97) |
| It will be easy for me to become an expert in the use of cryptocurrencies | 0.94 (49.45) |
| Social Influence | |
| The people who are important to me will think that I should use cryptocurrencies | 0.91 (43.21) |
| The people who influence me will think that I should use cryptocurrencies | 0.93 (48.28) |
| People whose opinions I value would like me to use cryptocurrencies | 0.99 (70.56) |
| Facilitating Conditions | |
| I have the necessary resources to use cryptocurrencies | 0.79 (23.27) |
| I have the necessary knowledge to use cryptocurrencies | 0.88 (32.08) |
| Cryptocurrencies are compatible with other technologies that I use | 0.78 (21.61) |
| I can get help if I have difficulty using cryptocurrencies | 0.77 (20.66) |
| Perceived Risk | |
| Using cryptocurrencies is risky | 0.90 (6.30) |
| There is too much uncertainty associated with the use of cryptocurrencies | 0.65 (5.98) |
| Compared with other currencies/investments, cryptocurrencies are riskier | 0.87 (6.65) |
| Financial Literacy | |
| I have a good level of financial knowledge | 1.00 (62.58) |
| I have a high capacity to deal with financial matters | 0.92 (33.56) |
Source: [7].
Table A3.
Construct reliability, Cronbach alpha and convergent reliability.
| Construct | Composite Reliability | Cronbach’s Alpha | AVE |
|---|---|---|---|
| Intention to Use (IU) | 0.898 | 0.897 | 0.814 |
| Performance Expectancy (PE) | 0.960 | 0.960 | 0.889 |
| Effort Expectancy (EE) | 0.962 | 0.962 | 0.864 |
| Social Influence (SI) | 0.959 | 0.959 | 0.887 |
| Facilitating Conditions (FC) | 0.878 | 0.878 | 0.645 |
| Perceived Risk (PR) | 0.850 | 0.851 | 0.658 |
| Financial Literacy (FL) | 0.956 | 0.955 | 0.916 |
Source: [7].
Table A4.
Divergent validity.
| Construct | IU | PE | EE | SI | FC | PR | FL |
|---|---|---|---|---|---|---|---|
| Intention to Use (IU) | 0.902 | 0.896 | 0.640 | 0.680 | 0.674 | 0.120 | 0.282 |
| Performance Expectancy (PE) | 0.896 | 0.943 | 0.557 | 0.739 | 0.565 | 0.137 | 0.237 |
| Effort Expectancy (EE) | 0.640 | 0.557 | 0.930 | 0.493 | 0.767 | 0.088 | 0.450 |
| Social Influence (SI) | 0.680 | 0.739 | 0.494 | 0.942 | 0.566 | 0.089 | 0.239 |
| Facilitating Conditions (FC) | 0.673 | 0.565 | 0.767 | 0.563 | 0.803 | 0.094 | 0.489 |
| Perceived Risk (PR) | −0.123 | −0.137 | −0.090 | −0.084 | 0.047 | 0.817 | 0.284 |
| Financial Literacy (FL) | 0.282 | 0.237 | 0.450 | 0.239 | 0.493 | 0.286 | 0.957 |
Source: [7].
| R2 | Q2 | Direct Effect | p-Value | Correlation | Variance Explained | |
|---|---|---|---|---|---|---|
| Intention to Use (IU) | 0.848 | 0.654 | ||||
| Performance Expectancy (PE) | 0.764 | 0.000 | 0.896 | 68.45% | ||
| Effort Expectancy (EE) | 0.078 | 0.070 | 0.640 | 4.99% | ||
| Social Influence (SI) | −0.041 | 0.244 | 0.680 | −2.79% | ||
| Facilitating Conditions (FC) | 0.220 | 0.000 | 0.673 | 14.81% | ||
| Perceived Risk (PR) | −0.017 | 0.278 | −0.123 | 0.21% | ||
| Financial Literacy (FL) | −0.028 | 0.226 | 0.282 | −0.79% |
Source: [7].
References
- Nakamoto, S. Bitcoin: A Peer-to-Peer Electronic Cash System; Manubot: Montreal, QC, Canada, 2019; Available online: https://git.dhimmel.com/bitcoin-whitepaper (accessed on 23 December 2020).
- World Bank Group. Distributed Ledger Technology (DLT) and Blockchain; World Bank Group: Washington, DC, USA, 2017. [Google Scholar] [CrossRef] [Green Version]
- Glaser, F.; Zimmermann, K.; Haferkorn, M.; Webber, M.C.; Siering, M. Bitcoin-asset or Currency? Revealing Users’ Hidden Intentions. ECIS. Available online: https://papers.ssrn.com/sol3/papers.cfm?abstract_id=2425247 (accessed on 9 December 2020).
- Hileman, G.; Rauchs, M. Global Blockchain Benchmarking Study. SSRN Electron. J. 2017. [Google Scholar] [CrossRef]
- CoinmarketCap. Available online: https://coinmarketcap.com/2020 (accessed on 30 December 2020).
- Holub, M.; Johnson, J. Bitcoin research across disciplines. Inf. Soc. 2018, 34, 114–126. [Google Scholar] [CrossRef]
- Arias-Oliva, M.; Pelegrín-Borondo, J.; Matías-Clavero, G. Variables Influencing Cryptocurrency Use: A Technology Acceptance Model in Spain. Front. Psychol. 2019, 10, 475. [Google Scholar] [CrossRef] [Green Version]
- Kim, J.; Gim, G. A study on factors affecting the intention to accept blockchain technology. J. Inf. Technol. Serv. 2017, 16, 1–20. [Google Scholar]
- Shahzad, F.; Xiu, G.; Wang, J.; Shahbaz, M. An empirical investigation on the adoption of cryptocurrencies among the people of mainland China. Technol. Soc. 2018, 55, 33–44. [Google Scholar] [CrossRef]
- Walton, A.J.; Johnston, K.A. Exploring Perceptions of Bitcoin Adoption: The South African Virtual Community Perspective. Interdiscip. J. Inf. Knowl. Manag. 2018, 13, 165–182. [Google Scholar] [CrossRef] [Green Version]
- Mazumbari, L.; Mutambara, E. Predicting FinTech innovation adoption in South Africa: The case of cryptocurrency. Afr. J. Econ. Manag. Stud. 2019, 11, 30–50. [Google Scholar]
- Fujiki, H. Who adopts crypto assets in Japan? Evidence from the 2019 financial literacy survey. J. Jpn. Int. Econ. 2020, 58, 101107. [Google Scholar] [CrossRef]
- Mendoza-Tello, J.C.; Mora, H.; Pujol-López, F.A.; Lytras, M.D. Social commerce as a driver to enhance trust and intention to use cryptocurrencies for electronic payments. IEEE Access 2018, 6, 50737–50751. [Google Scholar] [CrossRef]
- Mendoza-Tello, J.C.; Mora, H.; Pujol-López, F.A.; Lytras, M.D. Disruptive innovation of cryptocurrencies in consumer acceptance and trust. Inf. Syst. E Bus. Manag. 2019, 17, 195–222. [Google Scholar] [CrossRef]
- Nuryyev, G.; Wang, Y.-P.; Achyldurdyyeva, J.; Jaw, B.-S.; Yeh, Y.-S.; Lin, H.-T.; Wu, L.-F. Blockchain Technology Adoption Behavior and Sustainability of the Business in Tourism and Hospitality SMEs: An Empirical Study. Sustainability 2020, 12, 1256. [Google Scholar] [CrossRef]
- Sheel, A.; Nath, V. Blockchain technology adoption in the supply chain (UTAUT2 with risk)–evidence from Indian supply chains. Int. J. Appl. Manag. Sci. 2020, 12, 324–346. [Google Scholar] [CrossRef]
- Yoo, Y.H.; Park, H.S. A Study on User’s Acceptance of Blockchain-based Copyright Distribution Platforms and Its Usage. J. Ind. Distrib. Bus. 2019, 10, 59–72. [Google Scholar]
- Albayati, H.; Kim, S.K.; Rho, J.J. Accepting financial transactions using blockchain technology and cryptocurrency: A cus-tomer perspective approach. Technol. Soc. 2020, 62, 101320. [Google Scholar] [CrossRef]
- Gupta, S.; Gupta, S.; Mathew, M.; Sama, H.R. Prioritizing intentions behind investment in cryptocurrency: A fuzzy analytical framework. J. Econ. Stud. 2020. ahead of print. [Google Scholar] [CrossRef]
- Gil-Cordero, E.; Cabrera-Sánchez, J.P.; Arrás-Cortés, M.J. Cryptocurrencies as a Financial Tool: Acceptance Factors. Mathematics 2020, 8, 1974. [Google Scholar] [CrossRef]
- Roussou, I.; Stiakakis, E.; Sifaleras, A. An empirical study on the commercial adoption of digital currencies. Inf. Syst. E Bus. Manag. 2019, 17, 223–259. [Google Scholar] [CrossRef]
- Schaupp, L.C.; Festa, M. Cryptocurrency Adopt ion and the Road to Regulation. In Proceedings of the 19th Annual International Conference on Digital Government Research: Governance in the Data Age; Association for Computing Machinery: New York, NY, USA, 2018; pp. 1–9. [Google Scholar]
- Ragin, C.C. Using qualitative comparative analysis to study causal complexity. Health Serv. Res. 1999, 34, 1225–1239. [Google Scholar]
- Ragin, C. Redesigning Social Inquiry: Fuzzy Sets and Beyond; Chicago University Press: Chicago, IL, USA, 2008. [Google Scholar]
- Kraus, S.; Ribeiro-Soriano, D.; Schüssler, M. Fuzzy-set qualitative comparative analysis (fsQCA) in entrepreneurship and innovation research–the rise of a method. Int. Entrep. Manag. J. 2018, 14, 15–33. [Google Scholar] [CrossRef]
- Veríssimo, J.M.C. Enablers and restrictors of mobile banking app use: A fuzzy set qualitative comparative analysis (fsQCA). J. Bus. Res. 2016, 69, 5456–5460. [Google Scholar] [CrossRef]
- Jenson, I.; Leith, P.; Doyle, R.; West, J.; Miles, M.P. Testing innovation systems theory using Qualitative Comparative Analysis. J. Bus. Res. 2016, 69, 1283–1287. [Google Scholar] [CrossRef]
- Leischnig, A.; Henneberg, S.C.; Thornton, S.C. Net versus combinatory effects of firm and industry antecedents of sales growth. J. Bus. Res. 2016, 69, 3576–3583. [Google Scholar] [CrossRef] [Green Version]
- Kaya, B.; Abubakar, A.M.; Behravesh, E.; Yildiz, H.; Mert, I.S. Antecedents of innovative performance: Findings from PLS-SEM and fuzzy sets (fsQCA). J. Bus. Res. 2020, 114, 278–289. [Google Scholar] [CrossRef]
- Venkatesh, V.; Morris, M.G.; Davis, G.B.; Davis, F.D. User Acceptance of Information Technology: Toward a Unified View. Mis Q. 2003, 27, 425. [Google Scholar] [CrossRef] [Green Version]
- Venkatesh, V.; Thong, J.Y.L.; Xu, X. Consumer Acceptance and Use of Information Technology: Extending the Unified Theory of Acceptance and Use of Technology. Mis Q. 2012, 36, 157–178. [Google Scholar] [CrossRef] [Green Version]
- Davis, F.D. Perceived Usefulness, Perceived Ease of Use, and User Acceptance of Information Technology. Mis Q. 1989, 13, 319–340. [Google Scholar] [CrossRef] [Green Version]
- Venkatesh, V.; Davis, F.D. A Theoretical Extension of the Technology Acceptance Model: Four Longitudinal Field Studies. Manag. Sci. 2000, 46, 186–204. [Google Scholar] [CrossRef] [Green Version]
- Fishbein, M.; Ajzen, I. Belief, Attitude, Intention, and Behavior: An. Introduction to Theory and Research; Adison-Wesley: Boston, MA, USA, 1975. [Google Scholar] [CrossRef]
- Ajzen, I. The theory of planned behavior. Organ. Behav. Hum. Decis. Process. 1991, 50, 179–211. [Google Scholar] [CrossRef]
- Board of Governors of the Federal Reserve System Home Page. Available online: http://www.federalreserve.gov (accessed on 18 June 2013).
- Deloitte State-Sponsored Cryptocurrency: Adapting the Best of Bitcoin’s Innovation to the Payments Ecosystem. Available online: https://www2.deloitte.com/content/dam/Deloitte/au/Documents/financial-services/deloitte-au-fs-state-sponsored–cryptocurrency-180516.pdf (accessed on 2 February 2018).
- Bort, J. Is Bitcoin Pizza Day Thanks to These Two Pizzas Worth $5 Million Today. Business Insider 22 May. Available online: https://www.businessinsider.es/2014 (accessed on 29 November 2019).
- Coinmap. 2020. Available online: https://coinmap.org/welcome/ (accessed on 3 January 2021).
- Borondo, J.P.; Oliva, M.A.; Menorca, L.G.; Ayensa, E.J. Pricing policies in hotels: A psychological threshold research in online and offline channels. Int. J. Internet Mark. Advert. 2015, 9, 161. [Google Scholar] [CrossRef]
- Liu, Y.; Tsyvinski, A. Risks and Returns of Cryptocurrency; No. w24877; National Bureau of Economic Research: Cambridge, MA, USA, 2018. [Google Scholar]
- Bloomberg, J. Using Bitcoin or Other Cryptocurrency to Commit Crimes? Law Enforcement is onto You. Forbes. Bussines Wire 2017 $16.3 Billion Global Blockchain Technology Market Analysis & Trends —Industry Forecast to 2025—Research and Markets | Business Wire. Available online: https://www.forbes.com/sites/jasonbloomberg/2017/12/28/using-bitcoin-or-other-cryptocurrency-tocommit-crimes-law-enforcement-is-onto-you/#1006bdfc3bdcbitcoin-price-pizza-day-may-22-2018-5?r=US&IR=Business; https://www.businesswire.com/news/home/20170130005684/en/16.3-Bil-lion-Global-Blockchain-Technology-Market-Analysis (accessed on 13 December 2020).
- Kim, S.Y.; Lee, S.H.; Chi, Y.D.; Im, E.T.; Gim, G.Y. A study on the factors affecting the intention to use biometrics in payment services. Int. J. Bank Mark. 2018, 36, 170–183. [Google Scholar] [CrossRef]
- Makanyeza, C.; Mutambayashata, S. Consumers’ acceptance and use of plastic money in Harare, Zimbabwe: Application of the unified theory of acceptance and use of technology. Int. J. Bank Mark. 2018, 36, 379–392. [Google Scholar] [CrossRef]
- Torres, J.A.S.; Arroyo-Cañada, F.-J.; Sandoval, A.V.; Sánchez-Alzate, J.A. E-banking in Colombia: Factors favouring its acceptance, online trust and government support. Int. J. Bank Mark. 2018, 36, 170–183. [Google Scholar] [CrossRef]
- Khan, I.U.; Hameed, Z.; Khan, S.U. Understanding Online Banking Adoption in a Developing Country. J. Glob. Inf. Manag. 2017, 25, 43–65. [Google Scholar] [CrossRef] [Green Version]
- Nisha, N. Exploring the Dimensions of Mobile Banking Service Quality. Int. J. Bus. Anal. 2016, 3, 60–76. [Google Scholar] [CrossRef] [Green Version]
- Kishore, S.V.K.; Sequeira, A.H. An Empirical Investigation on Mobile Banking Service Adoption in Rural Karnataka. Sage Open 2016, 6, 62158244016633731. [Google Scholar] [CrossRef] [Green Version]
- Farah, M.F.; Hasni, M.J.S.; Abbas, A.K. Mobile-banking adoption: Empirical evidence from the banking sector in Pakistan. Int. J. Bank Mark. 2018, 36, 1386–1413. [Google Scholar] [CrossRef]
- Warsame, M.H.; Ireri, E.M. Moderation effect on mobile microfinance services in Kenya: An extended UTAUT model. J. Behav. Exp. Financ. 2018, 18, 67–75. [Google Scholar] [CrossRef]
- Hussain, M.; Mollik, A.T.; Johns, R.; Rahman, M.S. M-payment adoption for bottom of pyramid segment: An empirical investigation. Int. J. Bank Mark. 2019, 37, 362–381. [Google Scholar] [CrossRef]
- Baur, A.W.; Bühler, J.; Bick, M.; Bonorden, C.S. Cryptocurrencies as a Disruption? Empirical Findings on User Adoption and Future Potential of Bitcoin and Co. In Proceedings of the Mining Data for Financial Applications; Springer: Berlin/Heidelberg, Germany, 2015; pp. 63–80. [Google Scholar]
- Krombholz, K.; Judmayer, A.; Gusenbauer, M.; Weippl, E.; Grossklags, J.; Preneel, B. The Other Side of the Coin: User Experiences with Bitcoin Security and Privacy. In Mining Data for Financial Applications; Springer: Berlin/Heidelberg, Germany, 2017; Volume 9603, pp. 555–580. [Google Scholar]
- Gao, X.; Clark, G.D.; Lindqvist, J. Of Two Minds, Multiple Addresses, and One Ledger. In Proceedings of the 2016 CHI Conference on Human Factors in Computing Systems, San Jose, CA, USA, 7–12 May 2016; pp. 1656–1668. [Google Scholar]
- Moon, Y.; Hwang, J. Crowdfunding as an Alternative Means for Funding Sustainable Appropriate Technology: Acceptance Determinants of Backers. Sustainability 2018, 10, 1456. [Google Scholar] [CrossRef] [Green Version]
- Mahfuz, M.A.; Khanam, L.; Mutharasu, S.A. The influence of website quality on m-banking services adoption in Bangladesh: Applying the UTAUT2 model using PLS. In Proceedings of the 2016 International Conference on Electrical, Electronics and Optimization Techniques (ICEEOT), Chennai, India, 3–5 March 2016; pp. 2329–2335. [Google Scholar]
- Hajli, N. The role of social support on relationship quality and social commerce. Technol. Forecast. Soc. Chang. 2014, 87, 17–27. [Google Scholar] [CrossRef]
- Yermack, D. Is Bitcoin a real currency? An economic appraisal. In Handbook of Digital Currency; Academic Press: New York, NY, USA, 2015; pp. 31–43. [Google Scholar]
- Beikverdi, A.; Song, J. Trend of centralization in Bitcoin’s distributed network. In Proceedings of the En 2015 IEEE/ACIS 16th International Con-ference on Software Engineering, Artificial Intelligence, Networking and Parallel/Distributed Computing (SNPD), Takamatsu, Japan, 1–3 June 2015; pp. 1–6. [Google Scholar]
- Faqih, K.M. An empirical analysis of factors predicting the behavioral intention to adopt Internet shopping technology among non-shoppers in a developing country context: Does gender matter? J. Retail. Consum. Serv. 2016, 30, 140–164. [Google Scholar] [CrossRef]
- Salisbury, W.D.; Pearson, R.A.; Pearson, A.W.; Miller, D.W. Perceived security and World Wide Web purchase intention. Ind. Manag. Data Syst. 2001, 101, 165–177. [Google Scholar] [CrossRef]
- Kannungo, S.; Jain, V. Relationship between risk and intention to purchase in an online context: Role of gender and product category. In Proceedings of the 13th European Conference on Information Systems, The European IS Profession in the Global Networking Environment 2004, ECIS 2004, Turku, Finland, 14–16 June 2004. [Google Scholar]
- Featherman, M.S.; Pavlou, P.A. Predicting e-services adoption: A perceived risk facets perspective. Int. J. Hum. Comput. Stud. 2003, 59, 451–474. [Google Scholar] [CrossRef] [Green Version]
- Ahmed, W.M. Is there a risk-return trade-off in cryptocurrency markets? The case of Bitcoin. J. Econ. Bus. 2020, 108, 105886. [Google Scholar] [CrossRef]
- Dwyer, G.P. The economics of Bitcoin and similar private digital currencies. J. Financ. Stab. 2015, 17, 81–91. [Google Scholar] [CrossRef] [Green Version]
- Shaikh, A.A.; Glavee-Geo, R.; Karjaluoto, H. How Relevant Are Risk Perceptions, Effort, and Performance Expectancy in Mobile Banking Adoption? Int. J. E Bus. Res. 2018, 14, 39–60. [Google Scholar] [CrossRef]
- Stolper, O.A.; Walter, A. Financial literacy, financial advice, and financial behavior. J. Bus. Econ. 2017, 87, 581–643. [Google Scholar] [CrossRef] [Green Version]
- Van Rooij, M.; Lusardi, A.; Alessie, R. Financial literacy and stock market participation. J. Financ. Econ. 2011, 101, 449–472. [Google Scholar] [CrossRef] [Green Version]
- Lusardi, A.; Mitchell, O.S. The Economic Importance of Financial Literacy: Theory and Evidence. J. Econ. Lit. 2014, 52, 5–44. [Google Scholar] [CrossRef] [PubMed] [Green Version]
- Hastings, J.S.; Madrian, B.C.; Skimmyhorn, W.L. Financial Literacy, Financial Education, and Economic Outcomes. Annu. Rev. Econ. 2013, 5, 347–373. [Google Scholar] [CrossRef] [PubMed] [Green Version]
- Ragin, C. User’s Guide to Fuzzy-Set/Qualitative Comparative Analysis 3. Department of Sociology; University of California: Irvine, CA, USA, 2018. [Google Scholar]
- McCluskey, E.J. Minimization of Boolean functions. Bell Syst. Tech. J. 1956, 35, 1417–1444. [Google Scholar] [CrossRef]
- Thiem, A. Set-relational fit and the formulation of transformational rules in fsQCA. Compasss Wp. Ser. 2010, 2010, 61. Available online: http://www.compasss.org/wpseries/Thiem2010.pdf (accessed on 15 December 2020).
- Legewie, N. An introduction to applied data analysis with qualitative comparative analysis. Forum Qual. Sozi Alforschung/Forum Qual. Soc. Res. 2013, 14, 3. [Google Scholar] [CrossRef]
- Thiem, A. Beyond the Facts: Limited Empirical Diversity and Causal Inference in Qualitative Comparative Analysis. Sociol. Methods Res. 2019. [Google Scholar] [CrossRef] [Green Version]
- Krause, M.J.; Tolaymat, T. Quantification of energy and carbon costs for mining cryptocurrencies. Nat. Sustain. 2018, 1, 711–718. [Google Scholar] [CrossRef]
- De Andrés-Sánchez, J.; Belzunegui-Eraso, A.; Valls-Fonayet, F. Assessing Efficiency of Public Poverty Policies in UE-28 with Linguistic Variables and Fuzzy Correlation Measures. Mathematics 2021, 9, 128. [Google Scholar] [CrossRef]
- Ban, A.I.; Ban, O.I.; Tuse, D.A. Derived fuzzy importance of attributes based on the weakest triangular norm-based fuzzy arithmetic and applications to the hotel services. Iran. J. Fuzzy Syst. 2016, 13, 65–85. [Google Scholar]
Figure 1.
Sample distribution by age.

Figure 2.
Sample distribution by monthly household income.

Figure 3.
Hypothesis tested and analytical methodology with PLS in [7]. Source: Arias-Oliva, M.; Pelegrín-Borondo, J.; Matías-Clavero, G. Variables influencing cryptocurrency use: a technology acceptance model in Spain. Frontiers in Psychology 2019, 10, 475.
Figure 3.
Hypothesis tested and analytical methodology with PLS in [7]. Source: Arias-Oliva, M.; Pelegrín-Borondo, J.; Matías-Clavero, G. Variables influencing cryptocurrency use: a technology acceptance model in Spain. Frontiers in Psychology 2019, 10, 475.

Figure 4.
Hypothesis tested and analytical methodology with fsQCA.

Table 1.
Number of papers indexed in Web of Science within 2014–2010 for the search “cryptos AND”
| Year | ∅ | Prices | Regulation | Investment | Markets |
|---|---|---|---|---|---|
| 2014 | 10 | 2 | 1 | 4 | 7 |
| 2015 | 24 | 2 | 2 | 4 | 16 |
| 2016 | 38 | 4 | 4 | 15 | 24 |
| 2017 | 101 | 16 | 16 | 19 | 55 |
| 2018 | 293 | 67 | 50 | 53 | 176 |
| 2019 | 541 | 146 | 68 | 80 | 377 |
| 2020 | 400 | 131 | 42 | 40 | 258 |
Source: Own elaboration from database Web of Knowledge.
Table 2.
Constructs, items and their theoretical foundation.
| Construct/Item | Theoretical Foundation |
|---|---|
| Intention to Use | TAM2 scale (Venkatesh & Davis, 2000) |
| I intend to use cryptocurrencies | TAM2 scale (Venkatesh & Davis, 2000) Adapted from the UTAUT2 scale (Venkatesh et al., 2012) |
| I predict that I will use cryptocurrencies | |
| Performance Expectancy | |
| Using cryptocurrencies will increase opportunities to achieve important goals for me | Adapted from the UTAUT2 scale (Venkatesh et al., 2012) Adapted from the UTAUT2 scale (Venkatesh et al., 2012) |
| Using cryptocurrencies will help me achieve my goals more quickly | |
| Using cryptocurrencies will increase my standard of living | |
| Effort Expectancy | |
| It will be easy for me to learn how to use cryptocurrencies | Adapted from the UTAUT2 scale (Venkatesh et al., 2012) Adapted from the UTAUT2 scale (Venkatesh et al., 2012) |
| Using cryptocurrencies will be clear and understandable for me | |
| It will be easy for me to use cryptocurrencies | |
| It will be easy for me to become an expert in the use of cryptocurrencies | |
| Social Influence | |
| The people who are important to me will think that I should use cryptocurrencies | Adapted from the UTAUT2 scale (Venkatesh et al., 2012) Adapted from the UTAUT2 scale (Venkatesh et al., 2012) |
| The people who influence me will think that I should use cryptocurrencies | |
| People whose opinions I value would like me to use cryptocurrencies | |
| Facilitating Conditions | |
| I have the necessary resources to use cryptocurrencies | Adapted from the UTAUT2 scale (Venkatesh et al., 2012) Faqih (2016) based on Shim et al. (2011) |
| I have the necessary knowledge to use cryptocurrencies | |
| Cryptocurrencies are compatible with other technologies that I use | |
| I can get help if I have difficulty using cryptocurrencies | |
| Perceived Risk | |
| Using cryptocurrencies is risky | Faqih (2016) based on Shim et al. (2011) Based on Hasting et al. (2013) |
| There is too much uncertainty associated with the use of cryptocurrencies | |
| Compared with other currencies/investments, cryptocurrencies are riskier | |
| Financial Literacy | |
| I have a good level of financial knowledge | Based on Hasting et al. (2013) |
| I have a high capacity to deal with financial matters | |
Source: [7].
Table 3.
Necessity analysis on IU and ~IU.
| Necessity Analysis on IU | Necessity Analysis on ~IU | ||||
|---|---|---|---|---|---|
| Variable | Cons | Coverage | Variable | Cons | Coverage |
| PE | 0.826 | 0.901 | PE | 0.310 | 0.586 |
| ~PE | 0.620 | 0.341 | ~PE | 0.948 | 0.904 |
| EE | 0.870 | 0.661 | EE | 0.505 | 0.666 |
| ~EE | 0.561 | 0.395 | ~EE | 0.743 | 0.908 |
| SI | 0.649 | 0.801 | SI | 0.314 | 0.672 |
| ~SI | 0.735 | 0.382 | ~SI | 0.907 | 0.817 |
| FC | 0.875 | 0.644 | FC | 0.522 | 0.665 |
| ~FC | 0.545 | 0.397 | ~FC | 0.721 | 0.909 |
| PR | 0.882 | 0.446 | PR | 0.842 | 0.736 |
| ~PR | 0.478 | 0.635 | ~PR | 0.366 | 0.843 |
| FL | 0.792 | 0.601 | FL | 0.538 | 0.707 |
| ~FL | 0.545 | 0.397 | ~FL | 0.696 | 0.853 |
Table 4.
QCA-IS and QCA-PS for the model IU = f(PE, EE, SI, FC, PR, FL).
| Intermediate Solution | Raw Coverage | Unique Coverage | Consistency |
| PE*EE | 0.761 | 0.022 | 0.923 |
| EE*SI | 0.621 | 0.003 | 0.859 |
| PE*PR | 0.758 | 0.040 | 0.905 |
| EE*~PR*FL | 0.416 | 0.010 | 0.838 |
| PE*SI*FL | 0.594 | 0.001 | 0.936 |
| SI*FC*PR | 0.597 | 0.001 | 0.834 |
| SI*PR*FL | 0.558 | 0.001 | 0.840 |
| Cons = 0.859 | |||
| Cov = 0.790 | |||
| Parsimonious Solution | Raw Coverage | Unique Coverage | Consistency |
| PE | 0.826 | 0.163 | 0.901 |
| EE*SI | 0.621 | 0.002 | 0.859 |
| SI*FC | 0.624 | 0.001 | 0.834 |
| SI*FL | 0.577 | 0.001 | 0.840 |
| EE*~PR*FL | 0.416 | 0.010 | 0.838 |
| Cons = 0.869 | |||
| Cov = 0.788 |
Table 5.
QCA-IS and QCA-PS for the model ~IU = f(PE, EE, SI, FC, PR, FL).
| Intermediate Solution | Raw Coverage | Unique Coverage | Consistency |
| ~FL | 0.696 | 0.017 | 0.853 |
| ~FC | 0.721 | 0.009 | 0.909 |
| ~SI*~PR | 0.362 | 0.004 | 0.882 |
| ~EE*~SI | 0.709 | 0.007 | 0.923 |
| ~PE*PR | 0.809 | 0.089 | 0.910 |
| Cons = 0.942 | |||
| Cov = 0.835 | |||
| Parsimonious Solution | Raw Coverage | Unique Coverage | Consistency |
| ~FL | 0.696 | 0.005 | 0.853 |
| ~FC | 0.721 | 0.002 | 0.909 |
| ~EE | 0.743 | 0.004 | 0.908 |
| ~PE | 0.948 | 0.111 | 0.904 |
| ~SI*~PR | 0.362 | 0.001 | 0.882 |
| Cons = 0.976 | |||
| Cov = 0.829 |
Publisher’s Note: MDPI stays neutral with regard to jurisdictional claims in published maps and institutional affiliations. |
© 2021 by the authors. Licensee MDPI, Basel, Switzerland. This article is an open access article distributed under the terms and conditions of the Creative Commons Attribution (CC BY) license (http://creativecommons.org/licenses/by/4.0/).
Share and Cite
MDPI and ACS Style
Arias-Oliva, M.; de Andrés-Sánchez, J.; Pelegrín-Borondo, J. Fuzzy Set Qualitative Comparative Analysis of Factors Influencing the Use of Cryptocurrencies in Spanish Households. Mathematics 2021, 9, 324. https://doi.org/10.3390/math9040324
AMA Style
Arias-Oliva M, de Andrés-Sánchez J, Pelegrín-Borondo J. Fuzzy Set Qualitative Comparative Analysis of Factors Influencing the Use of Cryptocurrencies in Spanish Households. Mathematics. 2021; 9(4):324. https://doi.org/10.3390/math9040324
Chicago/Turabian StyleArias-Oliva, Mario, Jorge de Andrés-Sánchez, and Jorge Pelegrín-Borondo. 2021. "Fuzzy Set Qualitative Comparative Analysis of Factors Influencing the Use of Cryptocurrencies in Spanish Households" Mathematics 9, no. 4: 324. https://doi.org/10.3390/math9040324
Note that from the first issue of 2016, this journal uses article numbers instead of page numbers. See further details here.