

Abstract
We are developing a dedicated, combined breast positron emission tomography (PET)-tomosynthesis scanner. Both the PET and digital breast tomosynthesis (DBT) scanners are integrated in a single gantry to provide spatially co-registered 3D PET-tomosynthesis images. The DBT image will be used to identify the breast boundary and breast density to improve the quantitative accuracy of the PET image. This paper explores PET attenuation correction (AC) strategies that can be performed with the combined breast PET-DBT scanner to obtain more accurate, quantitative high-resolution 3D PET images. The PET detector is comprised of a 32 × 32 array of 1.5 × 1.5 × 15 mm3 LYSO crystals. The PET scanner utilizes two detector heads separated by either 9 or 11 cm, with each detector head having a 4 × 2 arrangement of PET detectors. GEANT4 Application for Tomographic Emission simulations were performed using an anthropomorphic breast phantom with heterogeneous attenuation under clinical DBT-compression. FDG-avid lesions, each 5 mm in diameter with 8:1 uptake, were simulated at four locations within the breast. Simulations were performed with a scan time of 2 min. PET AC was performed using the actual breast simulation model as well as DBT reconstructed volumetric images to derive the breast outline. In addition to using the known breast density as defined by the breast model, we also modeled it as uniform patient-independent soft-tissue, and as a uniform patient-specific material derived from breast tissue composition. Measured absolute lesion uptake was used to evaluate the quantitative accuracy of performing AC using the various strategies. This study demonstrates that AC is necessary to obtain a closer estimate of the true lesion uptake and background activity in the breast. The DBT image dataset assists in measuring lesion uptake with low bias by facilitating accurate breast delineation as well as providing accurate information related to the breast tissue composition. While both the uniform soft-tissue and patient-specific material approaches provides a close estimate to the ground truth, <5% bias can be achieved by using a uniform patient-specific material to define the attenuation map.
Export citation and abstract BibTeX RIS
1. Introduction
Whole-body (WB) positron emission tomography (PET) imaging is now routinely used in cancer diagnosis and treatment. While time-of-flight (TOF) resolution has steadily improved since its re-emergence 15 years ago, spatial resolution for most WB PET scanners continues to be in the 4–5 mm range (Jakoby et al 2011, Bettinardi et al 2011, Miller et al 2015, Vandendriessche et al 2019). The only exception is the recently introduced Siemens Biograph Vision that has a reconstructed spatial resolution of 3.6 mm. It therefore remains challenging for WB PET to accurately quantify lesion uptake in smaller lesions (<5 mm) that are prevalent in early-stage breast cancer. The ability of PET to provide quantitative information by accurately measuring radiotracer uptake is equally important for applications involving tumor characterization and treatment monitoring (Dehdashti et al 2009, Kurland et al 2012, Eary et al 2012, Jones et al 2019). The availability of breast-cancer specific radiotracers (e.g. 18FLT, 18FMISO, 18FES) further motivates the need for a dedicated breast scanner with the ability to accurately measure radiotracer uptake in small tumors.
Over a period of more than two decades, a number of dedicated breast PET scanners have been developed to overcome some of the limitations of WB PET in breast imaging. Besides improving spatial resolution, dedicated breast PET scanners also increase photon sensitivity by using a compact scanner geometry placed close to the breast, thereby reducing the number of photons that would normally get attenuated by the chest or thorax when imaged in a WB-PET scanner. While academic institutions led the effort (Thompson et al 1994, 1995, Freifelder and Karp 1997, Baghaei et al 2000, Murthy et al 2000, Doshi et al 2001, Freifelder et al 2001, Abreu et al 2006, Wang et al 2006, Peng and Levin 2010, Ravindranath et al 2011, Iima et al 2012, Surti 2013), initial studies demonstrating clinical benefits also led to the commercial development of dedicated breast PET scanners (Macdonald et al 2009, Moliner et al 2012, Miyake et al 2014).
PET performs an important role in cancer detection and its quantitative imaging capability can play an equally important role by providing an accurate measure of radiotracer uptake. Just as in WB PET, accurate data corrections are necessary in dedicated breast PET scanners in order to achieve quantitative images. Random coincidences are generally easy to correct using a delayed window coincidence technique to estimate the random coincidences in the electronics as routinely done in commercial WB PET scanners. This reduces bias in the resultant image due to random coincidences but can impact image noise properties. Considering the absence of other organs within the scanner FOV, the fraction of scattered photons is related primarily to the size of the breast being imaged. In previous work investigating scatter in a dedicated breast PET scanner with design similar to the one presented in this paper, (Qi and Huesman 2002) determined a scatter fraction of 32% that is also consistent with measurements performed by Bowen et al (2009). Bowen et al (2012) used a Monte Carlo based scatter correction technique in their dedicated breast scanner design and report a residual error of 3% after scatter correction. In WB PET, scatter correction is routinely performed using the single scatter simulation (Watson et al 1996, Werner et al 2006, Watson 2007) and similar residual errors have been previously reported (Zaidi 2000, Accorsi et al 2004). While a dedicated breast PET scanner design eliminates the loss of 511 keV photons that traverse through the chest or thorax, AC is still necessary to reduce bias that can be as high as 50% as shown previously by Bowen et al (2012). Thus, attenuation represents the largest residual source of bias in dedicated breast PET, and careful AC is necessary in order to accurately quantify radiotracer uptake.
Clinical WB PET AC is performed using the CT image to map the volumetric object outline as well as identify the material density distribution within the object. In recent years dedicated breast PET scanners (Bowen et al 2009, Raylman et al 2018) have been developed that image uncompressed breasts with patients lying in the prone position. These two systems also have an integrated CT scanner that provides anatomic localization and AC similar to clinical PET/CT systems. Dedicated breast PET scanners without a companion CT, either exclude AC, or, perform AC by assuming the breast to be comprised of uniform soft-tissue, and use the emission image to define the breast boundaries. Many of these dedicated breast PET scanners also image the breast compressed and use planar detectors in partial-ring scanner design. In these systems (Murthy et al 2000, Macdonald et al 2009), image artifacts arising from the limited-angle coverage introduce an additional challenge in accurately delineating the breast boundary, which is necessary for accurate AC.
The breast is primarily composed of glandular and adipose tissue and thus heterogenous. Based on the distribution of the two tissue types, the American College of Radiology Breast Imaging Reporting and Data System (www.acr.org) classification system categorizes breast tissue into four categories—fatty, scattered fibroglandular, heterogeneously dense, and extremely dense. While the linear attenuation coefficients of adipose (0.0914 cm−1) and fibroglandular (0.0974 cm−1) tissues differ by only 6.5% at 511 keV, the fraction by volume and spatial distribution of the two tissue types can vary substantially from patient to patient. Thus, for breast imaging it is important to delineate the volumetric breast outline and also identify breast composition to perform AC accurately.
Our group at the University of Pennsylvania is building a dedicated high spatial resolution, TOF breast PET scanner. In comparison with conventional dual-headed PET scanners that suffer from image artifacts and reduced quantitation accuracy due to limited angle effects, TOF information is expected to reduce these effects and improve lesion quantification (Surti and Karp 2008, Lee et al 2013). The breast scanner will be combined with a digital breast tomosynthesis (DBT) unit in an integrated gantry providing spatially co-registered 3D PET-DBT images. In addition to providing an anatomical image co-registered with the PET image, the same DBT image can be used to perform accurate AC of the PET images, which is necessary to produce accurate quantitative information.
This paper explores PET AC strategies that can be performed with the combined breast PET-DBT scanner to obtain fully quantitative high-resolution 3D PET images. Monte Carlo simulations of a compressed anthropomorphic breast with heterogeneous attenuation due to varying tissue composition and density, and containing FDG-avid lesions, were performed. PET image reconstruction was performed without AC, and with AC using attenuation maps derived from different estimation strategies. The accuracy of PET quantification was evaluated by comparing the absolute lesion uptake measured from varying AC strategies.
1.1. Anthropomorphic breast phantom
The open-source Virtual Clinical Trial (OpenVCT) framework was used to generate an anthropomorphic breast phantom (Pokrajac et al 2012, Barufaldi et al 2018). The anthropomorphic breast phantom is a voxelized 3D model, which consists of predefined tissue types. While a variety of breast tissue components can be defined (Bakic et al 2018), for this study we only modeled the primary components—adipose tissue, fibroglandular tissue, and skin. Finer structures like Cooper's ligaments and microcalcifications were not simulated. A breast model with volume and density representative of the average U.S. female population was generated (Yaffe et al 2009). To simulate DBT acquisition conditions, a 50% physical compression to the breast phantom using a GPU-accelerated 3D mapping technique with pre-calculated meshes (Lago et al 2013) was also performed. While the 50% compression is slightly larger than normal, these choices were driven by the availability of compression meshes that matched the simulated breast phantom. The simulated breast contained 18.96% glandular tissue, and after compression measured 18.9 × 9.5 × 5.25 cm3. Figure 1(a) shows a volumetric rendering of the breast phantom. To optimize computational resources and PET Monte Carlo simulation time, the OpenVCT phantom was down-sampled from a voxel size of 100 µm3 to 500 µm3 using nearest-neighbor interpolation with a winner-take-all scheme for categorical data (Matlab imresize3). The down-sampled and original breast phantoms were compared, to ensure that down-sampling did not alter the simulated breast phantom density.
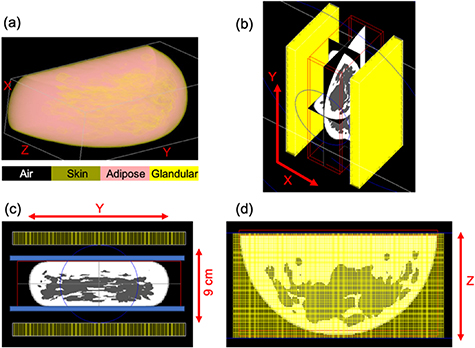
Figure 1. (a) Volumetric rendering of the breast phantom generated by the VCT pipeline. The different breast tissue types simulated are highlighted, and distribution of the two most abundant breast tissue types—adipose (pink) and glandular (yellow) can be visualized. (b) GATE simulation snapshots of the breast PET scanner along with the outline of the anthropomorphic breast phantom placed within the scanner field of view. (c) And (d) depict the front and top views of the simulation. Each of the two PET detector panels are 20 cm (Y) × 10 cm (Z) and separated by 9 cm (X). To accommodate the compression paddle and breast support, the scanner has a 20 (Y) × 10 (Z) × 8 (X) cm3 FOV. The 50% compressed breast is 18.9 (Y) × 9.5 (Z) × 5.25 cm3 (X).
Download figure:
Standard image High-resolution image1.2. DBT imaging simulation
DBT projections of the phantom acquisition were simulated using GPU-enabled x-ray tracing software (Kuo et al 2011). A custom DBT acquisition geometry was used for this study. Conventional DBT utilizes a linear acquisition geometry, where the x-ray source rotates about the patient's breast along a one-dimensional arc in the mediolateral direction. Typically, 15 projections over an angular range of ± 7.5° are acquired. As a screening modality, conventional DBT has shown to benefit the detection of masses, but not calcifications (Rafferty et al 2013). To improve this, the next-generation (NG) DBT system (Eben et al 2018) is being developed to investigate alternative acquisition geometries for DBT. NG acquisition geometries are achieved with the introduction of posteroanterior (PA) x-ray source motion and cranio-caudal (CC) detector motion during the tomosynthesis acquisition. While images acquired with NG-DBT acquisition geometries have improved spatial resolution, lower noise and higher contrast, they have also been shown to have superior volume estimation in comparison with conventional DBT (Acciavatti et al 2019). A bowtie x-ray source motion that also contained 15 projection, eight of which extend into the PA direction (Vent et al 2019a, 2019b) was simulated for this study. All DBT image reconstructions were performed using commercial reconstruction software (Briona—version 3.6, Real Time Tomography, Villanova, PA). This software uses the background signal (air) information from each DBT projection image to segment each projection image automatically before performing filtered back-projection reconstruction. DBT reconstruction generates images with ∼0.1 mm voxel size and 0.5 mm slice thickness.
1.3. PET simulations and image reconstruction
PET Monte Carlo simulations were performed using the GEANT4 Application for Tomographic Emission (GATE) v.8.0 toolkit (Jan et al 2004) and the anthropomorphic breast phantom described above. The PET detector consists of a 32 × 32 array of 1.5 × 1.5 × 15 mm3 LYSO crystals (Krishnamoorthy et al 2014). The PET scanner is comprised of two detector heads, each having a 4 × 2 arrangement of the PET detectors separated by 9 or 11 cm. The scanner has a 20 (Y) × 10 (Z) × 8 or 10 (X) cm3 field of view (FOV), to accommodate the breast compression paddle and support. Figures 1(b)–(d) includes pictures from the GATE simulation depicting the scanner geometry as well as the compressed breast phantom placed within the scanner FOV. The breast phantom was translated along the 'Z' direction to ensure that the edge of the scanner was ∼3 mm away from the edge of the breast phantom (breast chest wall). The breast support plate and the compression paddle (blue in figure 1(c)) were not simulated as they are expected to have fixed and minimal attenuation. The heterogeneous breast phantom was uniformly filled with an activity concentration of 0.1 µCi cc-1 to emulate background activity from a clinical 18FDG scan. Four 18FDG-avid 5 mm diameter lesions with 8:1 uptake were simulated individually within the breast phantom (lesion-present data). All four lesions were located within the central axial plane of the breast phantom. A separate set of simulations was also run for the breast phantom without any lesions (lesion-absent data). Table 1 specifies locations of the four lesions relative to the center of the breast.
Table 1. Centers for the four 5 mm diameter FDG-avid lesions simulated within the breast. Since attenuation is largest at the center of the breast, all four lesions were located in the central axial plane (Z) of the breast phantom.
| Lesion | Location relative to breast center | |
|---|---|---|
| X (cm) | Y (cm) | |
| 1 | 0 | 0 |
| 2 | 0 | 1.5 |
| 3 | 5 | 0 |
| 4 | 5 | 1.5 |
The volume of the breast model simulated in this paper is representative of the average U.S. female population. (Yaffe et al 2009) report a mean compressed breast thickness of 5.9 cm, and thus the 9 cm detector separation is expected to accommodate a large fraction of the U.S. population. However, it is not straightforward to model the exact DBT-compression and compressed three-dimensional shape, and it is possible that the scanner will be unable to accommodate a small portion of the population. Since the PET scanner is not primarily intended for breast cancer screening, a locoregional breast scan would nevertheless be helpful for such patients. This might, however, necessitate relaxing the detector separation to accommodate a larger than average breast. Relaxing the detector separation might also be necessary under conditions where the DBT-compression needs to relaxed (i.e. milder) for patient comfort during the PET scan. To explore this possibility, GATE simulations were also performed with an increased detector separation of 11 cm. Increasing detector separation to accommodate a breast with relaxed compression decreases scanner angular coverage and could affect scanner performance (Lee et al 2013). For ease of comparison, we did not reduce the amount of breast compression in this study. For both detector separations (9 cm and 11 cm), ten independent simulations were performed for a scan time of 2 min each. Coincidence simulation data output from GATE was converted to list mode data, and images with 1 mm3 voxels were reconstructed using a blob-based iterative OSEM algorithm utilizing a Gaussian 300 ps FWHM TOF kernel (Popescu 2004). As this study is focused on evaluating AC strategies that introduce minimal bias, the simulation only modeled true coincidences, and PET data corrections for scatter and randoms corrections were not performed.
1.4. Attenuation correction (AC) strategies
Baseline PET AC was first performed using an ideal AC map which uses the exact knowledge of the modeled breast outline as well as the voxel-by-voxel (heterogeneous) breast density (ideal AC). For our AC strategy, there were then two main areas of evaluation: heterogeneous breast density and breast boundary delineation.
In order to investigate the importance of knowing a voxel-by-voxel breast density that can be challenging if not impossible to obtain, we treated the breast as having a uniform composition, where the tissue was either: (i) a patient-independent soft tissue as is typically performed in breast PET (avg unif AC), or (ii) a weighted-average of all tissue types within the simulated model and hence is patient specific (pat-spec unif AC). In practice, the reconstructed DBT image is a gray-scale image that reflects the material density of underlying breast tissue and can be used to estimate the volumetric breast density necessary to ascertain a patient-specific uniform AC. However, as the DBT image generation process in this work did not model scatter, the DBT-based pat-spec unif AC technique evaluated in this study used a breast density estimate directly from the modeled phantom.
We also evaluated the use of the DBT image to derive the breast outline and repeated AC using the two strategies for defining the uniform breast density (DBT avg unif AC and DBT pat-spec unif AC). To match the PET data processing, the DBT reconstructions were down sampled to 0.5 mm3 voxels using 3D linear interpolation (Matlab Imresize3). As described in section 2.2, the DBT reconstruction not only provides a 3D volumetric reconstruction, it also uses the projection information to discern between breast and air intelligently. All non-air elements from the DBT image were used to delineate the reconstructed breast volume.
For each of the AC strategies, the breast composition (i.e. density) information was translated to corresponding linear attenuation coefficient at 511 keV (Berger and Hubbell 1987, ICRU 1989) and used by the PET image reconstruction software for AC. Figure 2 shows a single central CC slice of the breast phantom and the material definitions used to generate each of the corresponding attenuation maps. Table 2 summarizes the different AC strategies evaluated, and figure 3 outlines the workflow used to evaluate the different AC strategies.

Figure 2. A single central cranio-caudal slice of the breast phantom highlighting the different tissue types (a), and corresponding attenuation map derived from using the phantom outline along with—uniform soft tissue, i.e. avg unif AC (b), volumetric weighted-average over the entire breast volume, i.e. pat-spec unif AC (c), and the true voxel-by-voxel (i.e. ideal AC) based definition as described in section 1.
Download figure:
Standard image High-resolution image
Figure 3. Flowchart highlighting the different approaches investigated for performing attenuation correction, as well as the workflow used to evaluate their performance.
Download figure:
Standard image High-resolution imageTable 2. Summary of the different strategies evaluated for AC. The different techniques were compared to the ideal AC performed using the actual breast model as defined on a voxel-by-voxel basis to perform AC.
| Breast delineation | Breast density (material definition for attenuation map) |
|---|---|
| Breast model (ideal) | Voxel-by-voxel (ideal) |
| Uniform soft-tissue (avg unif) | |
| Uniform volumetric weighted-average (pat-spec unif) | |
| DBT-based (practical) | Uniform soft-tissue (DBT avg unif) |
| Uniform volumetric weighted-average (DBT pat-spec unif) |
1.5. PET image analysis
Absolute lesion activity concentration was used to evaluate the quantitative accuracy of the different AC strategies. Lesion activity concentration was measured by evaluating the mean counts within a 5 mm diameter volume of interest (VOI) drawn in the images with lesions. The VOI center for each dataset was determined by maximizing the signal through iterating over a volume surrounding the true center of each lesion. Background activity concentration was measured in the set of lesion-absent images using 10 mm VOIs placed at the same locations as in the lesion-present images. Uptake was measured for each of the four lesions simulated in the scanner with 9 cm and 11 cm detector separation. PET image uptake calibration for both scanner geometries was performed by imaging a large uniform phantom filling the entire FOV. For each set of lesions and reconstructions, mean and standard deviation of absolute measured activity concentration was calculated across the ten 2 mins scan data sets. Quantitation accuracy (bias) for each lesion was also calculated by comparing with the ideal AC performed using the attenuation map defined on a voxel-by-voxel basis and an outline derived from the model breast.
2. Results
2.1. DBT image reconstruction
Figure 4 shows a single central CC slice from the DBT reconstruction of the anthropomorphic breast phantom. In comparison with mammography, DBT provides a volumetric reconstruction of the breast which should translate to better delineation of the breast outline (volume), which is important for accurate AC.

Figure 4. A single central cranio-caudal slice from the DBT reconstruction of the anthropomorphic breast phantom.
Download figure:
Standard image High-resolution image2.2. PET image reconstructions and AC evaluation
Figure 5 shows a single central slice of the reconstructed PET image (along the three imaging planes) from using the ideal AC generated from the breast model and with the lesion at the center of the breast. PET detectors were separated by 9 cm and the phantom was imaged for 2 min. Also shown are the reconstructed central transverse slices (figures 5(d)–(f)) with the lesion located off-center along either or both X and Y directions. Image analysis was performed after reconstructing for ten iterations as counts in the lesion VOI had converged. An average activity concentration of 0.41 µCi cc-1 was measured for the four lesions when using the ideal AC. Figure 6 summarizes the relative bias in uptake calculated for the background and each of the four lesions when compared to image generated with the ideal AC performed using a voxel-by-voxel attenuation and breast outline derived from the model. The results demonstrate that AC is necessary to quantify radiotracer uptake accurately. A large negative bias (∼45%) relative to using the ideal AC is observed in absence of AC (figure 6, top figure). Using a homogeneous model of soft-tissue (patterned green bar in bottom figure) reduces this bias, albeit overestimating lesion uptake, and using a patient-specific uniform definition (dashed green bar) slightly lowered this overestimation. Similar improvement in bias (red bars) is also observed when using the DBT images to delineate the breast boundary. Quantitative accuracy with <5% bias can be obtained when using the DBT-images for performing AC.
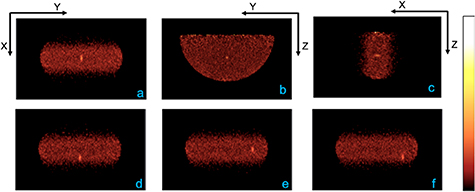
Figure 5. PET images were reconstructed with 1 mm3 voxels. Central slices (a)–(c) of the reconstructed image with the lesion at the center of the breast. The PET scanner detector panels were separated by 9 cm and phantom was imaged for 2 min. Ideal AC material definition and breast delineation from the breast model was used for AC, and average activity concentration of 0.41 µCi cc–1 was measured over the four lesions. Also shown are the central X–Y slices (d)–(f) where the lesions are located off-center along either or both directions.
Download figure:
Standard image High-resolution image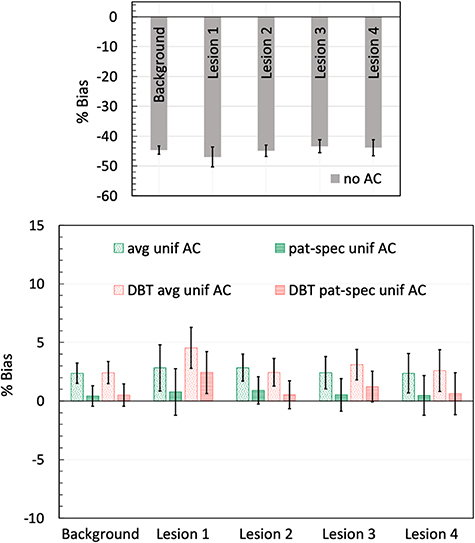
Figure 6. Summary of bias measurements with detector separation of 9 cm: The percent bias in uptake calculated relative to the image using the ideal attenuation map, for both background and the four lesions, are summarized for the no-AC (top figure) and for the varying AC strategies evaluated (bottom figure) in this study. As summarized in table 2, these include AC using the breast model (avg unif—uniform soft-tissue; pat-spec unif—uniform volumetric weighted-average), as well as using the DBT images for breast boundary delineation (DBT avg unif and DBT pat-spec unif). Error bars for each of the measurements are calculated as the standard deviation of bias measured across the ten 2 min scans.
Download figure:
Standard image High-resolution image2.3. Effect of increasing detector separation
Figure 7(a) shows a single central transverse slice of the reconstructed PET image from scanner with PET detectors separated by 11 cm and the phantom imaged for 2 mins.

Figure 7. Central X-Y slices of the reconstructed images from PET scanner with 11 cm separation and scan time of 2 mins. All four source positions listed in table 2 are shown from left to right. As described in figure 5, the ideal AC map along with the breast outline from the breast model was used to perform AC.
Download figure:
Standard image High-resolution imageAlso included are central transverse slices from reconstructions with the lesion located off-center along either or both X and Y directions (figures 7(b)–(d)). In comparison with images having 9 cm detector separation, the decrease in angular coverage from increasing detector separation to 11 cm has no visual impact on image quality. Figure 8 summarizes the relative bias measurements for background and all four lesions imaged with the scanner using 11 cm detector separation. Increasing detector separation in a two-detector design decreases angular coverage and can affect scanner performance. When comparing with the ideal AC data from scanner with 9 cm detector separation, the decrease in angular coverage resulted in ∼5% reduction (averaged over the four lesions) in the measured absolute lesion uptake. There is also a slight increase in bias when using the DBT image for AC (red bars in figure 8 bottom figure). Since the same DBT image from measurements with 9 cm detector separation were used for AC, the small change in bias can be attributed to changes in the limited-angle effect affecting the PET image reconstruction. Overall, consistent with previous measurements in this paper (section 3), quantification with low bias can be maintained with using the DBT images for AC even after increasing the detector separation to 11 cm.

Figure 8. Summary of the relative bias in uptake measurements for background and the four lesions with detector separation of 11 cm and scan time of 2 min. The percent bias in uptake calculated relative to the image using the ideal (voxel) attenuation map, is summarized for no AC (top figure) and the varying AC techniques (bottom figure) evaluated in this paper. As summarized in table 2, the varying AC strategies include using the breast model (avg unif—uniform soft-tissue; pat-spec avg—uniform volumetric weighted-average) as well as using the DBT images for breast boundary delineation (DBT avg unif and DBT pat-spec unif). Error bars for each of the measurements are calculated as the standard deviation of bias measured across the ten 2 min scans.
Download figure:
Standard image High-resolution image
3. Discussion
This paper evaluates AC strategies that can be performed with a dedicated, combined breast PET-DBT scanner. Some dedicated breast PET scanners without a companion CT have previously used the PET image to define the breast boundary necessary for AC. However, image artifacts accompanying a limited-angle PET scanner design limits the accuracy in breast boundary delineation for these scanners. This accuracy is also impacted when imaging with breast-cancer specific radiotracers, which unlike FDG, have high focal uptake and thus are inappropriate for delineating the breast boundary. Hence, the use of a DBT image acquired in the same gantry as the breast PET can be utilized for AC. In addition, DBT can also aid in determining breast density by estimating breast tissue composition.
This study modeled an anthropomorphic breast with heterogeneous attenuation, and used simulations to evaluate various AC strategies. With a focus on clinical impact, evaluations in this paper were performed for a scan time of 2 min, which could be an upper limit for imaging breasts under reduced (mild) or DBT-compression (full). When compared with the ground truth, the study demonstrates that no AC results in a large underestimation (∼45% negative relative bias) of radiotracer uptake for both lesion and background (figure 6). Our results demonstrate that AC can be performed fairly accurately and that for all AC strategies studied here the mean relative bias was <5% over the two detector separations and all lesions and background. For reference, in a prior simulation study, (Kinahan et al 2013) and (Macdonald et al 2020) evaluated AC correction using a single CC view mammogram for the dedicated PET/X scanner (Macdonald et al 2018) currently under development. The mammogram provides a 2-D image of a breast under compression. With noise-free PET emission data, and using uniform soft-tissue definition along with the breast boundary from the 2-D mammogram, Kinahan et al, report an error of ±6% in measuring peak SUV. Thus, the <5% bias measured in this study shows an improvement likely due to the use of a DBT image to define the breast boundary.
While the patient-specific uniform AC (pat-spec unif AC) provides the lowest mean relative bias (∼1% positive bias), the statistical significance of the results summarized in figures 6 and 8 was assessed by performing t-tests. Two groups were compared—(a) significance of using the DBT image to delineate the breast boundary versus the exact breast boundary as defined in the breast mode, i.e. comparison between patterned red and patterned green bars, or, between dashed red and dashed green bars for each lesion, and (b) significance of using uniform patient-specific AC versus uniform patient-independent AC, i.e. comparison between patterned and dashed red bars, or, between patterned and dashed green bars for each lesion. The t-tests were separately performed for each of the 4-lesion measurements from PET scanner with 9 and 11 cm detector separation. For both detector separations, the t-tests (p-value ranging from 0.4 to 0.9) indicated the difference in residual bias when using the DBT image to mark the breast boundary versus the simulated model boundary was not statistically significant. This indicates that the DBT provides good breast boundary delineation necessary for accurate PET AC. The t-tests also suggested no statistically significant difference (p-values ranging from 0.07 to 0.4 for the ideal and DBT-based measurements) in the bias when comparing the uniform patient-specific AC with uniform patient-independent AC. Thus, using an average uniform material definition and outline from the DBT image might be the most practical approach for performing fairly accurate AC with low bias.
The results shown here used the bowtie NG-DBT acquisition that may have an impact on the quality (accuracy) of the DBT image. However, upon comparison with a conventional DBT acquisition, we did not observe any change in the PET quantitation bias. This suggests that the conventional DBT image is sufficient for performing accurate PET AC. However, the bowtie acquisition tested here is only one of many acquisition geometries supported by the NG-DBT system. (Acciavatti et al 2018) have demonstrated that NG-DBT improves breast volume estimation and better boundary delineation in the posterior-anterior direction. Thus, we could still expect additional benefits under conditions that have not been evaluated in this paper.
While we did not explicitly investigate techniques to estimate the patient-specific breast density from the DBT images, this feasibility has been demonstrated previously. (Pertuz et al 2016) have demonstrated that volumetric breast density obtained from DBT images were significantly correlated with breast density estimates obtained from full-field digital mammography and MR imaging-based techniques. The ability to automatically estimate breast density from DBT images is also supported by commercially available (Ekpo et al 2016), and research or open-source software (Kontos et al 2009, Keller et al 2012, Qin et al 2014), some of which have also been validated using patient data (Gastounioti et al 2018). It is also relevant to remember that the 'patient-specific uniform AC' evaluated in this paper does not require information about breast tissue composition on a voxel-by-voxel basis. Thus, the limited depth-resolution of the DBT system is not a limiting factor for accurate PET AC, and findings from this study can be easily extended to clinical measurements with a combined PET-DBT scanner.
The <5% residual error in lesion uptake measurement after AC is also similar to the 3% residual error expected after scatter correction for events scattered with the FOV (Bowen et al 2012). In a dedicated breast scanner, scatter from out-of-FOV activity could also affect quantitation. In previous work (Qi and Huesman 2002) estimated that the scatter contribution from out-of-FOV activity is 7% relative to the within FOV scatter, leading to a total scatter fraction of ∼34% (as opposed to 32% with only in-FOV scatter) with the lower energy threshold set at 270 keV. Thus, the overall contribution from out-of-FOV scatter is expected to be small. With a higher setting for the lower energy threshold in the range of 400–440 keV in our system due to good energy resolution (∼13%) (Krishnamoorthy et al 2014), we expect the overall scatter fraction to be lower than this 34% value (closer to 18% as shown by Freifelder et al 2001) and the residual error from scatter correction to not be higher than that from AC.
For both scanner geometries, true lesion activity concentration is not fully recovered even after AC due to partial volume effects arising due to finite detector spatial resolution and variations in spatial resolution from limited-angle and parallax effects. We have investigated this in prior work (Matej et al 2016) and have also developed a working reconstruction algorithm making use of a spatially-variant resolution model to reduce any image degrading effects due to limited angular coverage (Gravel et al 2019). The algorithm not only improves quantitation, but also improves uniformity over the FOV, thereby decreasing the variability in uptake measured over the different lesions in the FOV.
4. Conclusion
In this work we have evaluated PET AC strategies that can be performed in a combined breast PET-Tomosynthesis scanner. As the primary goal of the scanner is to help with breast cancer treatment, it is important to maintain quantitative accuracy of the scanner. The study demonstrates that AC is necessary to obtain a more accurate estimation of both lesion uptake and background activity in the breast. The DBT scanner assists in measuring lesion uptake with low bias by facilitating accurate breast delineation as well as providing information related to the breast tissue composition. While both uniform soft-tissue or uniform patient-specific material definition provides a close estimate to the ground truth, <5% bias can be achieved by using a uniform patient-specific material definition to define the attenuation map.
Acknowledgments
The work was supported by the National Institutes of Health Grant Nos. R01-CA196528, R01-CA113941, R01-EB028764, R21-CA239177, Komen Foundation (IIR 13264610) and Burroughs Wellcome Foundation (IRSA 1016451) grants.